

The Impact of Spatial Frequency on the Perception of Crowd Emotion: An fMRI Study


Abstract
:1. Introduction
2. Materials and Methods
2.1. Participants
2.2. Stimuli
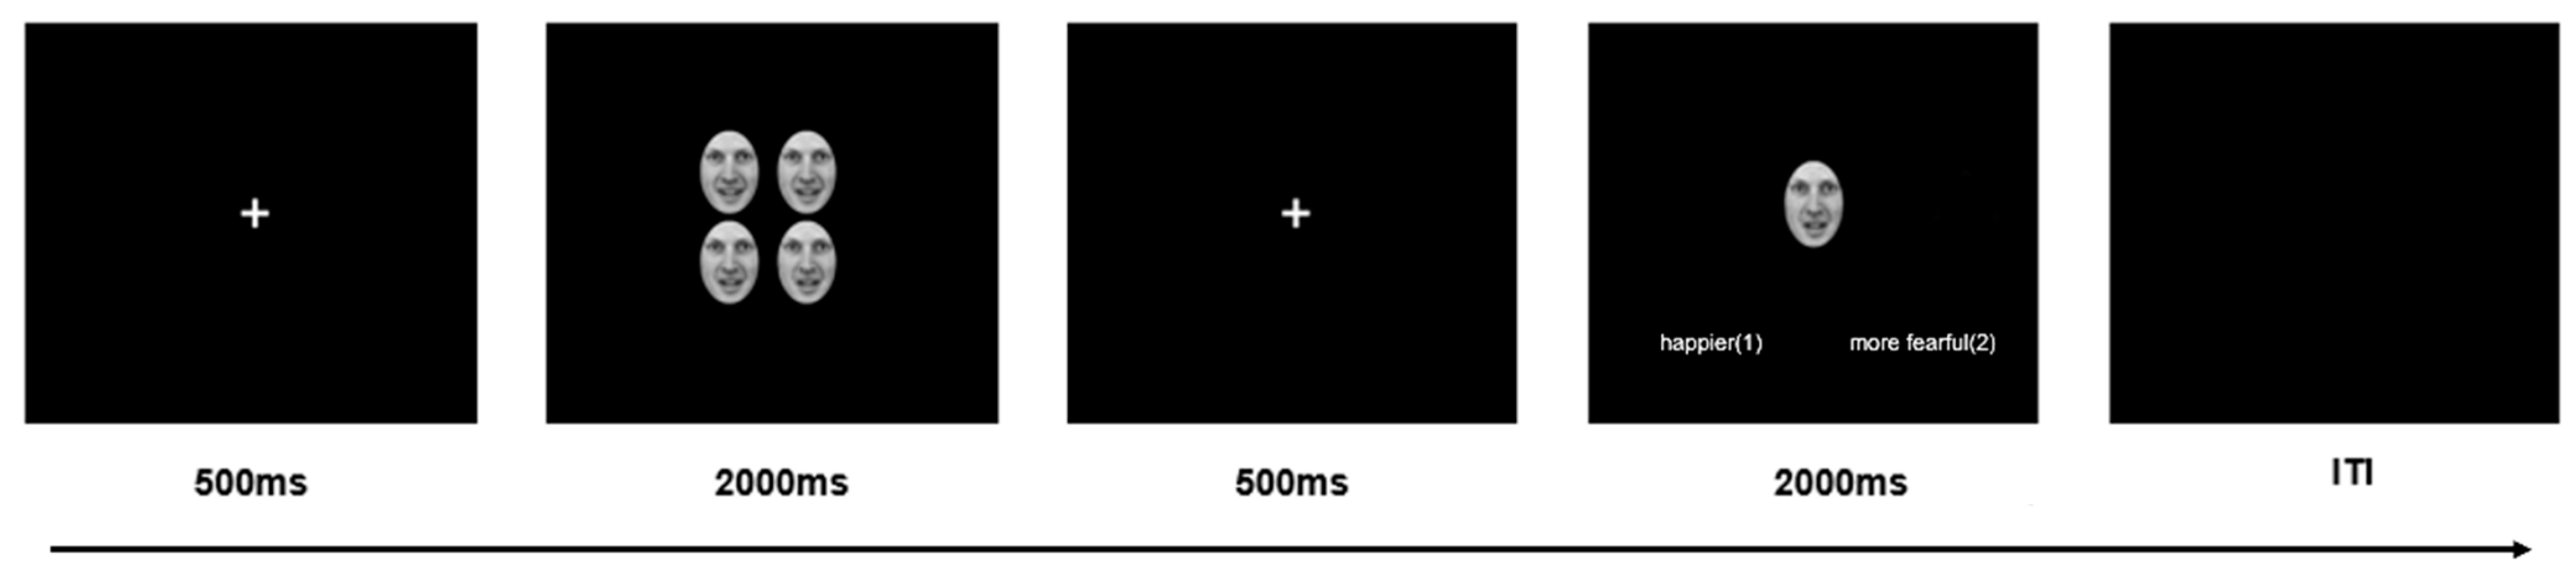
2.3. Procedure
2.4. Behavioral Data Analysis
2.5. fMRI Data Acquisition and Analysis
3. Results
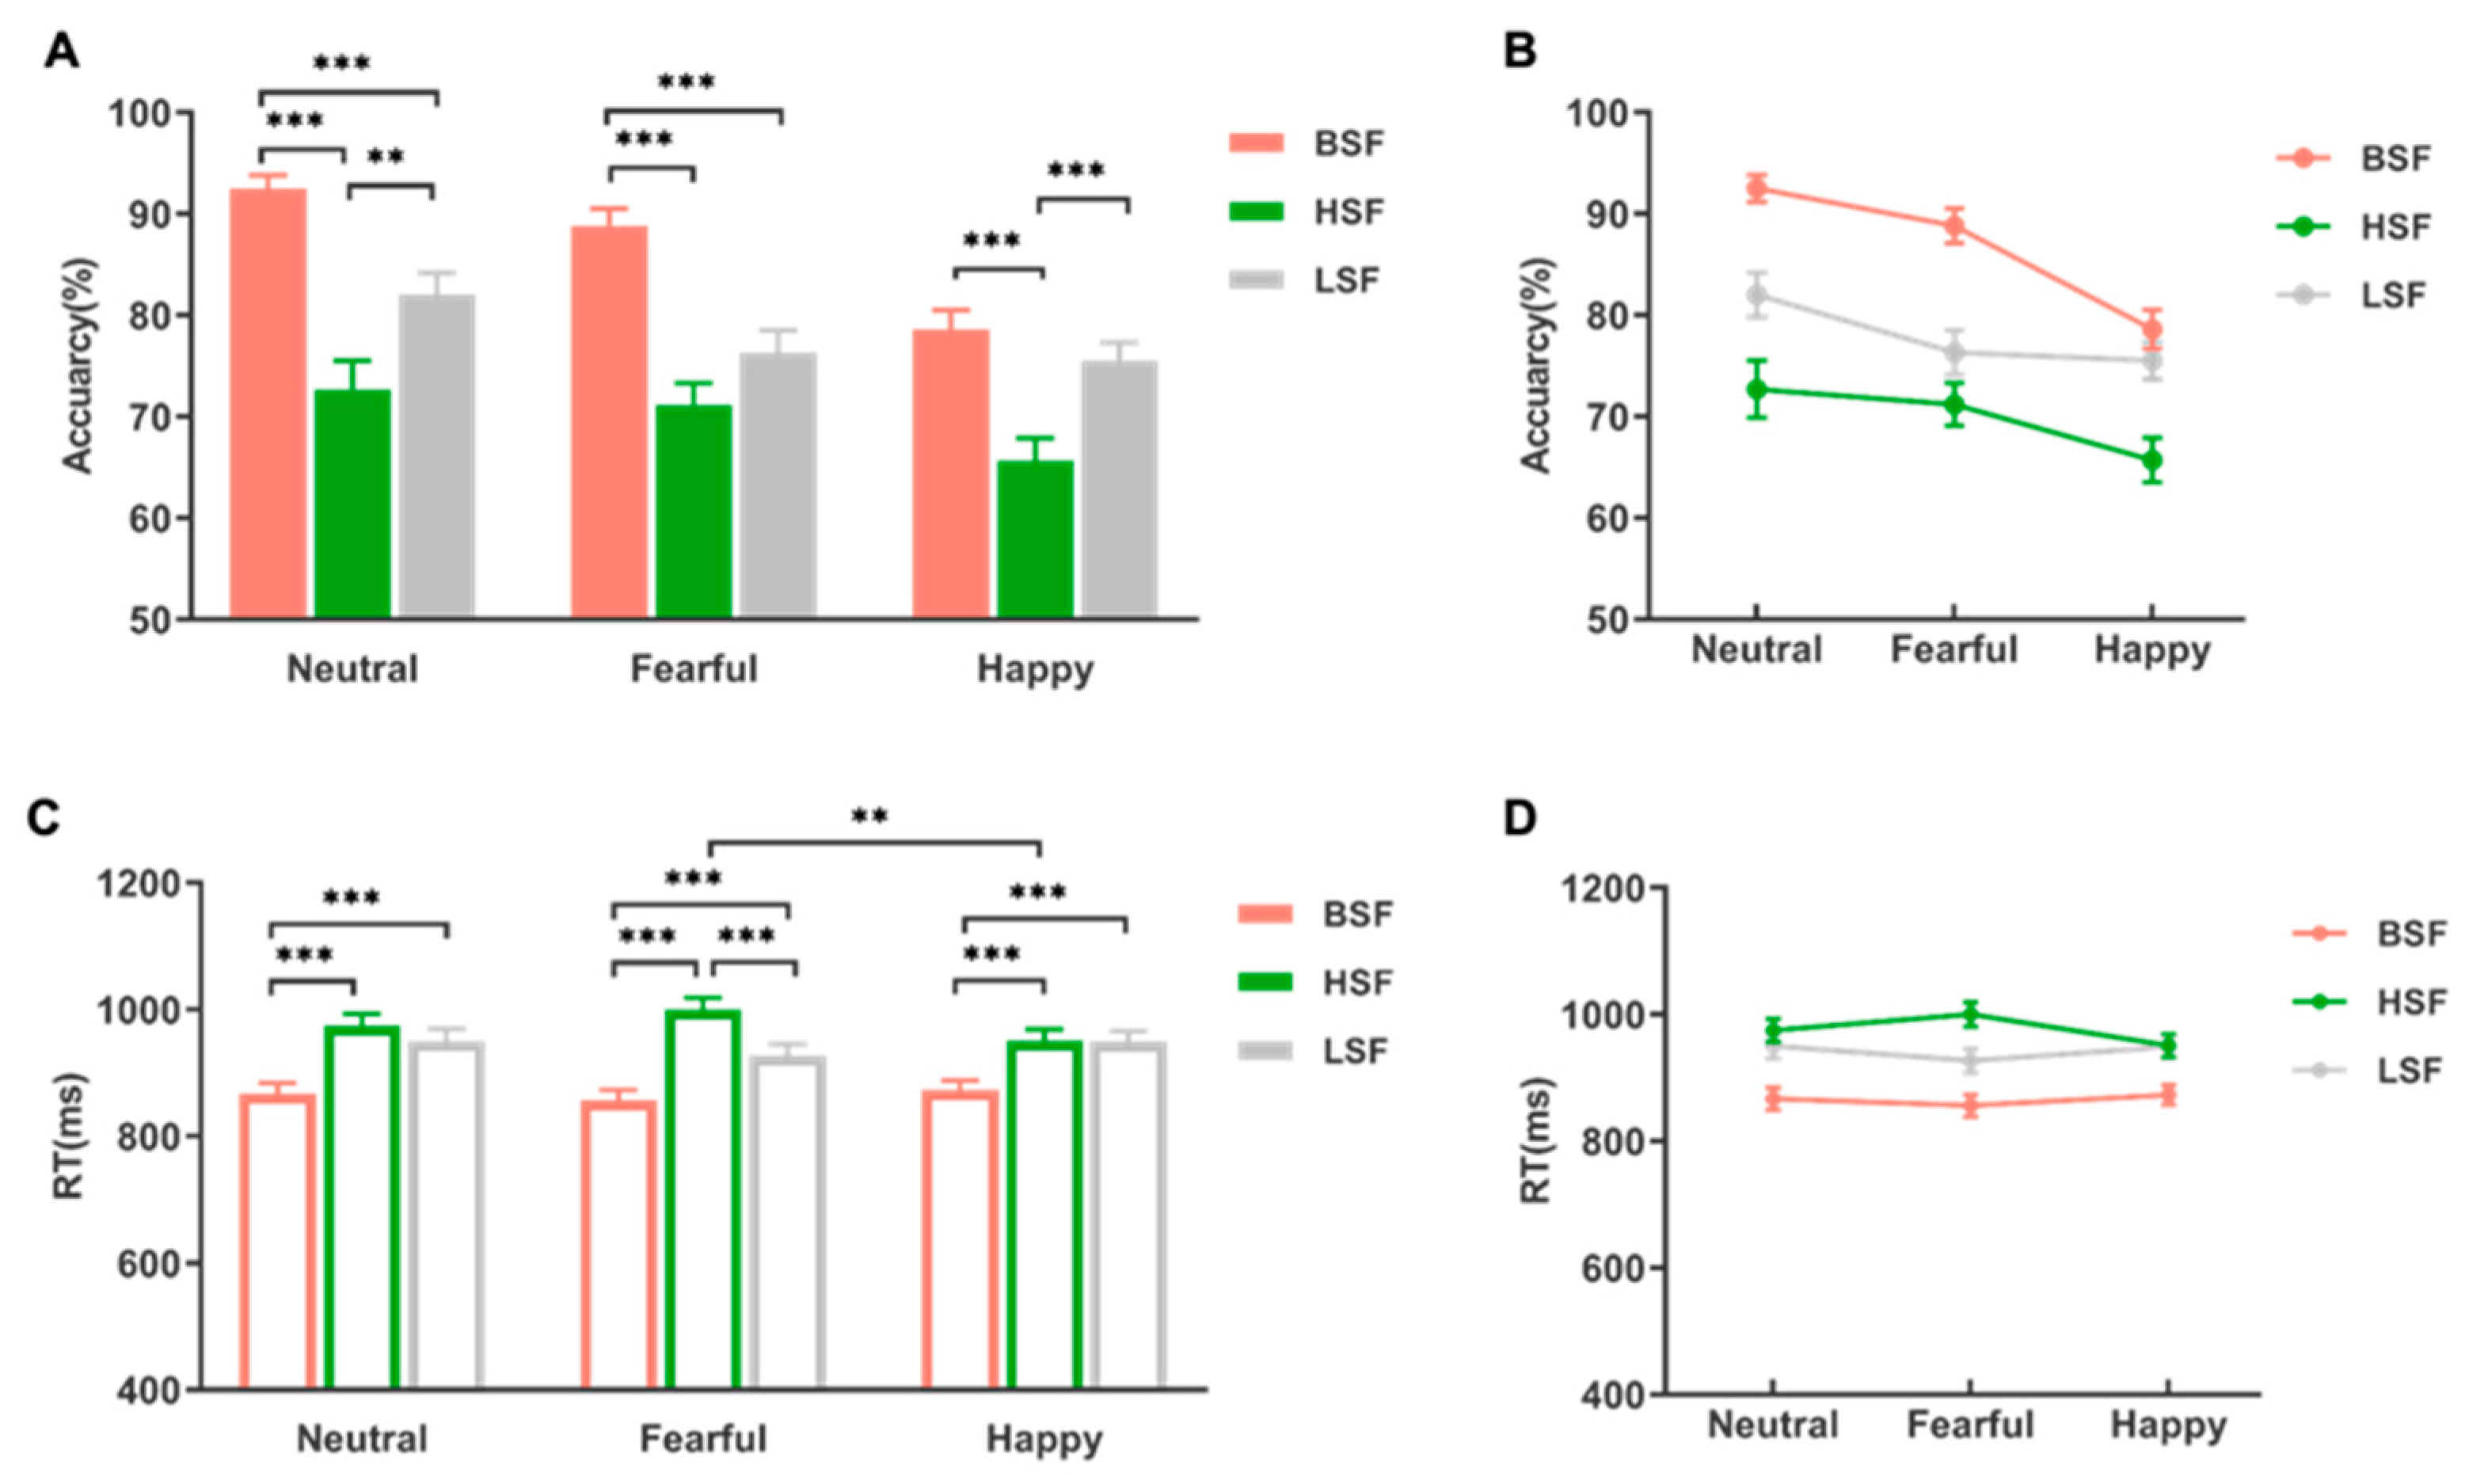
3.1. Behavioral Results
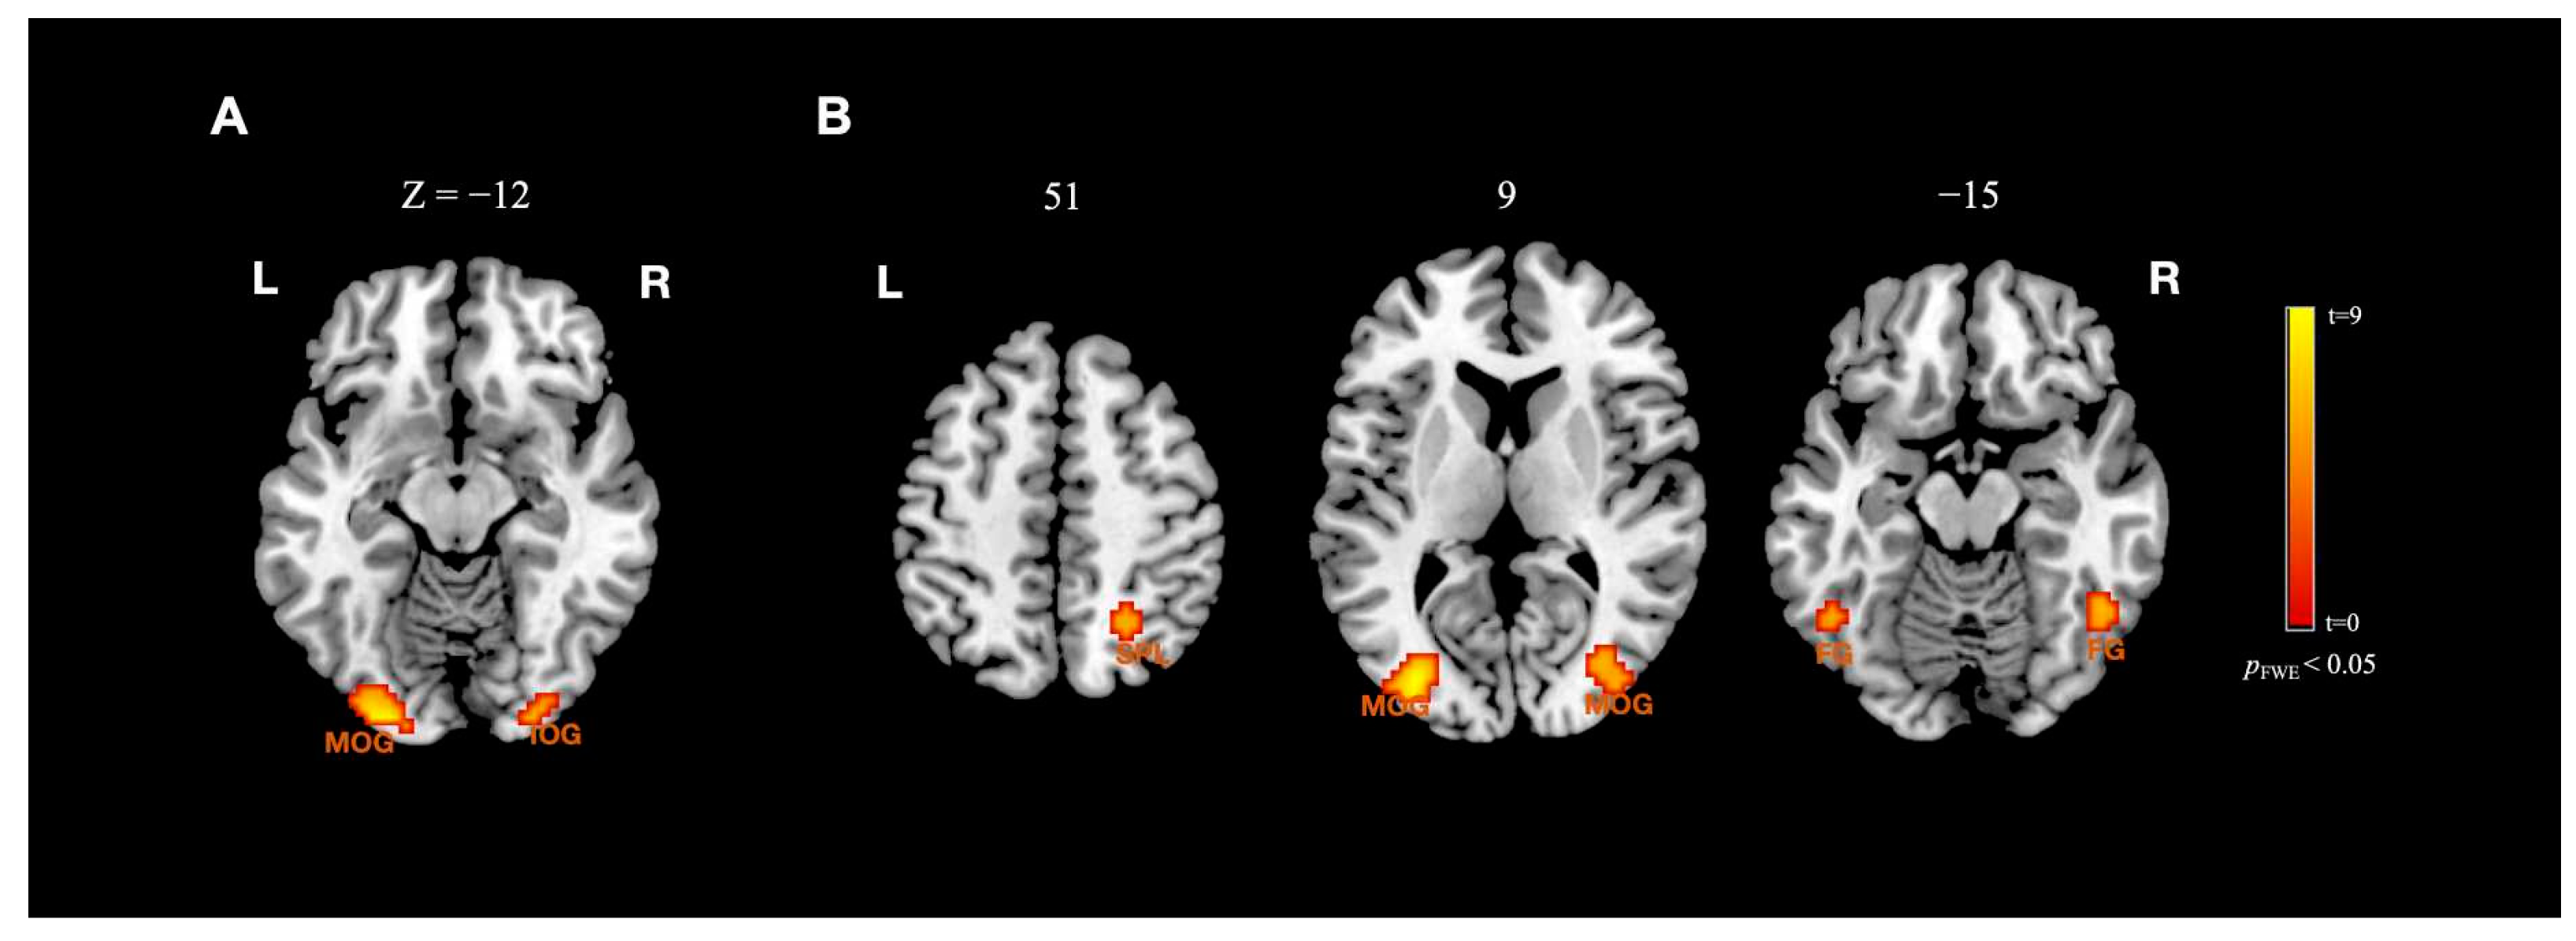
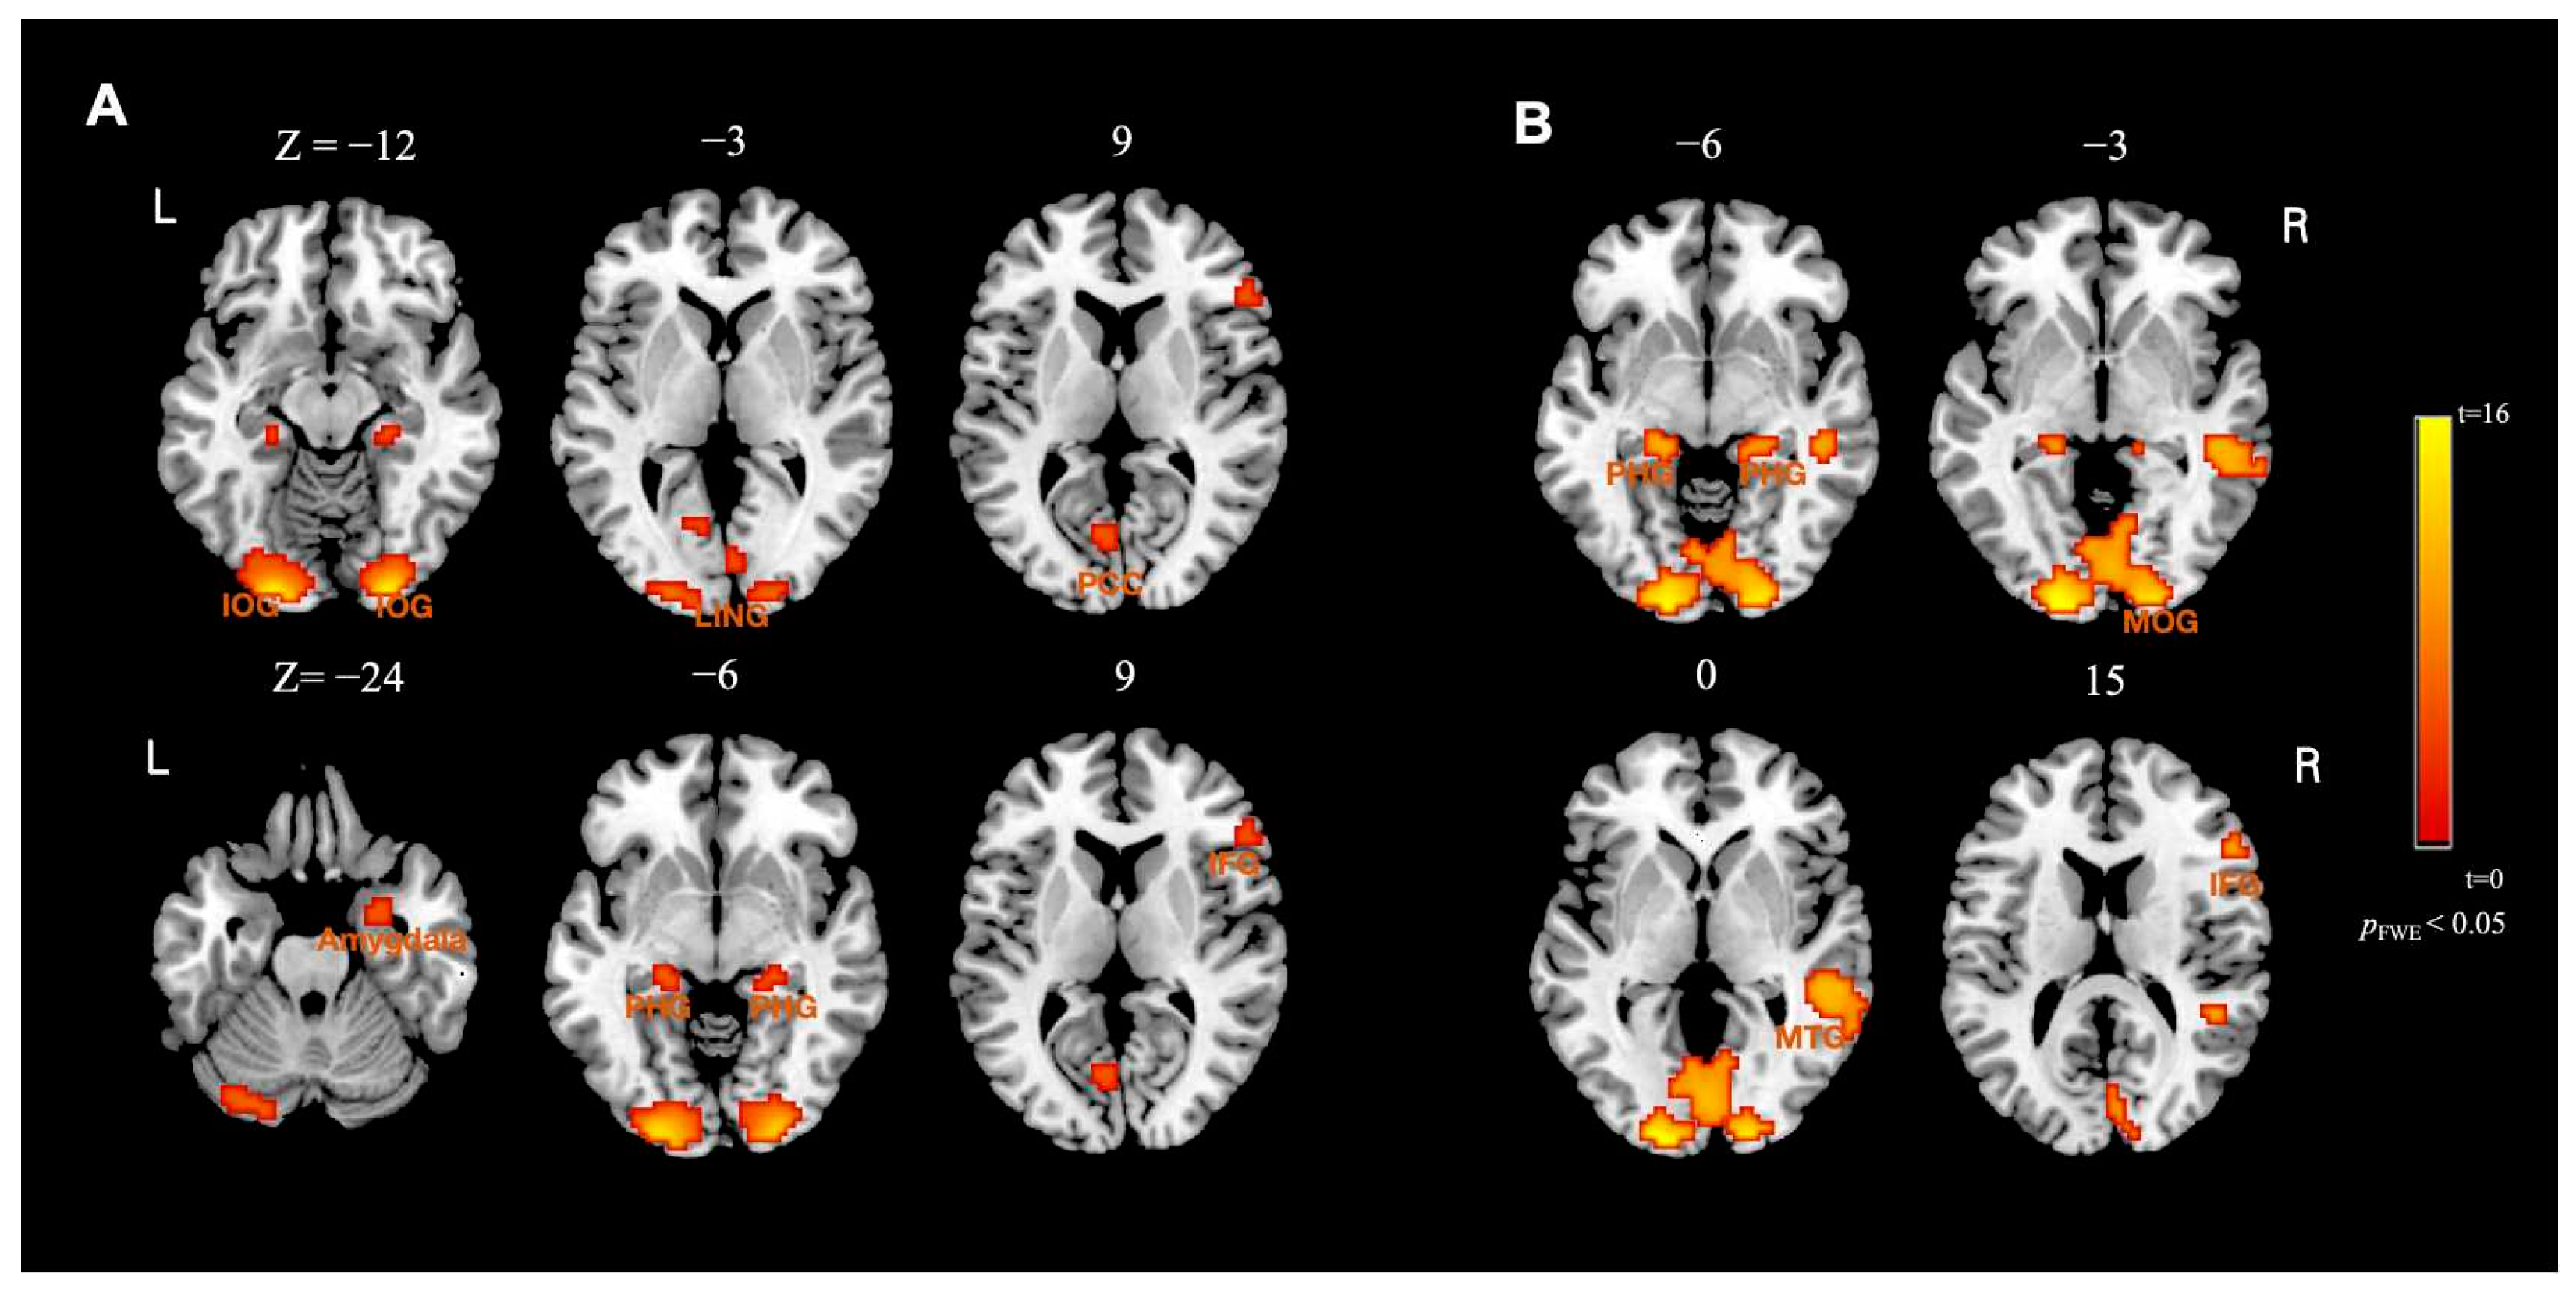
3.2. fMRI Results
4. Discussion
4.1. Impact of Spatial Frequency on Behaviors
4.2. Impact of Spatial Frequency on Neural Patterns
4.3. Possible Moderators and Limitations
5. Conclusions
Supplementary Materials
Author Contributions
Funding
Institutional Review Board Statement
Informed Consent Statement
Data Availability Statement
Conflicts of Interest
References
- Kessler, T.; Hollbach, S. Group-based emotions as determinants of ingroup identification. J. Exp. Soc. Psychol. 2005, 41, 677–685. [Google Scholar] [CrossRef]
- Smith, E.R.; Seger, C.R.; Mackie, D.M. Can emotions be truly group level? Evidence regarding four conceptual criteria. J. Personal. Soc. Psychol. 2007, 93, 431–446. [Google Scholar] [CrossRef]
- Fischer, A.H.; Manstead, A.S. Social functions of emotion. Handb. Emot. 2008, 3, 456–468. [Google Scholar]
- Smith, E.R.; Mackie, D.M. Group-level emotions. Curr. Opin. Psychol. 2016, 11, 15–19. [Google Scholar] [CrossRef]
- Porat, R.; Halperin, E.; Mannheim, I.; Tamir, M. Together we cry: Social motives and preferences for group-based sadness. Cogn. Emot. 2016, 30, 66–79. [Google Scholar] [CrossRef]
- Smith, H.J.; Cronin, T.; Kessler, T. Anger, Fear, or Sadness: Faculty Members’ Emotional Reactions to Collective Pay Disadvantage. Political Psychol. 2008, 29, 221–246. [Google Scholar] [CrossRef]
- Leeuwen, E.V.; Dijk, W.V.; Kaynak, U. Of saints and sinners: How collective pride and guilt affect outgroup helping. Group Process. Intergroup Relat. 2013, 16, 781–796. [Google Scholar] [CrossRef]
- Haberman, J.; Whitney, D. Rapid extraction of mean emotion and gender from sets of faces. Curr. Biol. 2007, 17, R751–R753. [Google Scholar] [CrossRef] [PubMed]
- Alvarez, G.A. Representing multiple objects as an ensemble enhances visual cognition. Trends Cogn. Sci. 2011, 15, 122–131. [Google Scholar] [CrossRef]
- Maule, J.; Franklin, A. Effects of ensemble complexity and perceptual similarity on rapid averaging of hue. J. Vis. 2014, 15, 6. [Google Scholar] [CrossRef] [PubMed]
- Whitney, D.; Yamanashi Leib, A. Ensemble perception. Annu. Rev. Psychol. 2018, 69, 105–129. [Google Scholar] [CrossRef]
- Fenker, D.B.; Heipertz, D.; Boehler, C.N.; Schoenfeld, M.A.; Heinze, H.J.; Duezel, E.; Hopf, J.M. Mandatory processing of irrelevant fearful face features in visual search. J. Cogn. Neurosci. 2010, 22, 2926–2938. [Google Scholar] [CrossRef] [PubMed]
- Fox, E.; Lester, V.; Russo, R.; Bowles, R.J.; Pichler, A.; Dutton, K. Facial Expressions of Emotion: Are Angry Faces Detected More Efficiently? Cogn. Emot. 2000, 14, 61–92. [Google Scholar] [CrossRef] [PubMed]
- Luo, W.; Feng, W.; He, W.; Wang, N.Y.; Luo, Y.J. Three stages of facial expression processing: ERP study with rapid serial visual presentation. Neuroimage 2010, 49, 1857–1867. [Google Scholar] [CrossRef] [PubMed]
- Mihalache, D.; Lamer, S.A.; Allen, J.; Maher, M.; Sweeny, T.D. Anger bias in the evaluation of crowds. J. Exp. Psychol. Gen. 2021, 150, 1870–1889. [Google Scholar] [CrossRef]
- Bucher, A.; Voss, A. Judging the mood of the crowd: Attention is focused on happy faces. Emotion 2019, 19, 1044–1059. [Google Scholar] [CrossRef] [PubMed]
- Ekman, P. An argument for basic emotions. Cogn. Emot. 1992, 6, 169–200. [Google Scholar] [CrossRef]
- Haberman, J.; Whitney, D. Seeing the mean: Ensemble coding for sets of faces. J. Exp. Psychol. Hum. Percept. Perform. 2009, 35, 718. [Google Scholar] [CrossRef]
- Goffaux, V.; Gauthier, I.; Rossion, B. Spatial scale contribution to early visual differences between face and object processing. Cogn. Brain Res. 2003, 16, 416–424. [Google Scholar] [CrossRef]
- Bishop, P.; Henry, G. Spatial vision. Annu. Rev. Psychol. 1971, 22, 119–160. [Google Scholar] [CrossRef]
- Entzmann, L.; Guyader, N.; Kauffmann, L.; Peyrin, C.; Mermillod, M. Detection of emotional faces: The role of spatial frequencies and local features. Vis. Res. 2023, 211, 108281. [Google Scholar] [CrossRef] [PubMed]
- Bruchmann, M.; Schindler, S.; Straube, T. The spatial frequency spectrum of fearful faces modulates early and mid-latency ERPs but not the N170. Psychophysiology 2020, 57, e13597. [Google Scholar] [CrossRef] [PubMed]
- Neta, M.; Berkebile, M.M.; Freeman, J.B. The dynamic process of ambiguous emotion perception. Cogn. Emot. 2021, 35, 722–729. [Google Scholar] [CrossRef] [PubMed]
- Adolphs, R.; Gosselin, F.; Buchanan, T.W.; Tranel, D.; Schyns, P.; Damasio, A.R. A mechanism for impaired fear recognition after amygdala damage. Nature 2005, 433, 68–72. [Google Scholar] [CrossRef]
- Mendez-Bertolo, C.; Moratti, S.; Toledano, R.; Lopez-Sosa, F.; Martinez-Alvarez, R.; Mah, Y.H.; Vuilleumier, P.; Gil-Nagel, A.; Strange, B.A. A fast pathway for fear in human amygdala. Nat. Neurosci. 2016, 19, 1041–1049. [Google Scholar] [CrossRef]
- Vuilleumier, P.; Armony, J.L.; Driver, J.; Dolan, R.J. Distinct spatial frequency sensitivities for processing faces and emotional expressions. Nat. Neurosci. 2003, 6, 624–631. [Google Scholar] [CrossRef]
- Kumar, D.; Srinivasan, N. Emotion perception is mediated by spatial frequency content. Emotion 2011, 11, 1144. [Google Scholar] [CrossRef]
- Turano, M.T.; Giganti, F.; Gavazzi, G.; Lamberto, S.; Gronchi, G.; Giovannelli, F.; Peru, A.; Viggiano, M.P. Spatially Filtered Emotional Faces Dominate during Binocular Rivalry. Brain Sci. 2020, 10, 998. [Google Scholar] [CrossRef]
- Goodale, M.A.; Milner, A.D. Separate visual pathways for perception and action. Trends Neurosci. 1992, 15, 20–25. [Google Scholar] [CrossRef]
- Merigan, W.H.; Maunsell, J. How parallel are the primate visual pathways? Annu. Rev. Neurosci. 1993, 16, 369–402. [Google Scholar] [CrossRef]
- Sawatari, A.; Callaway, E.M. Convergence of magno-and parvocellular pathways in layer 4B of macaque primary visual cortex. Nature 1996, 380, 442–446. [Google Scholar] [CrossRef]
- Bullier, J. Integrated model of visual processing. Brain Res. Rev. 2001, 36, 96–107. [Google Scholar] [CrossRef]
- Freud, E.; Plaut, D.C.; Behrmann, M. ‘What’ is happening in the dorsal visual pathway. Trends Cogn. Sci. 2016, 20, 773–784. [Google Scholar] [CrossRef] [PubMed]
- Lamme, V.A. Blindsight: The role of feedforward and feedback corticocortical connections. Acta Psychol. 2001, 107, 209–228. [Google Scholar] [CrossRef] [PubMed]
- Winston, J.S.; Vuilleumier, P.; Dolan, R.J. Effects of low-spatial frequency components of fearful faces on fusiform cortex activity. Curr. Biol. 2003, 13, 1824–1829. [Google Scholar] [CrossRef] [PubMed]
- Im, H.Y.; Cushing, C.A.; Ward, N.; Kveraga, K. Differential neurodynamics and connectivity in the dorsal and ventral visual pathways during perception of emotional crowds and individuals: A MEG study. Cogn. Affect. Behav. Neurosci. 2021, 21, 776–792. [Google Scholar] [CrossRef] [PubMed]
- Im, H.Y.; Albohn, D.N.; Steiner, T.G.; Cushing, C.A.; Adams, R.B., Jr.; Kveraga, K. Differential hemispheric and visual stream contributions to ensemble coding of crowd emotion. Nat. Hum. Behav. 2017, 1, 828. [Google Scholar] [CrossRef]
- Kveraga, K.; Boshyan, J.; Bar, M. Magnocellular projections as the trigger of top-down facilitation in recognition. J. Neurosci. 2007, 27, 13232–13240. [Google Scholar] [CrossRef] [PubMed]
- Thomas, C.; Kveraga, K.; Huberle, E.; Karnath, H.-O.; Bar, M. Enabling global processing in simultanagnosia by psychophysical biasing of visual pathways. Brain 2012, 135, 1578–1585. [Google Scholar] [CrossRef]
- Haberman, J.; Brady, T.F.; Alvarez, G.A. Individual differences in ensemble perception reveal multiple, independent levels of ensemble representation. J. Exp. Psychol. Gen. 2015, 144, 432–446. [Google Scholar] [CrossRef]
- Haberman, J.; Harp, T.; Whitney, D. Averaging facial expression over time. J. Vis. 2009, 9, 1.1–13. [Google Scholar] [CrossRef]
- Lundqvist, D.; Flykt, A.; Hman, A. The Karolinska Directed Emotional Faces–KDEF, CD ROM from Department of Clinical Neuroscience, Psychology Section; Karolinska Institutet: Stockholm, Sweden, 1998. [Google Scholar]
- Costen, N.P.; Parker, D.M.; Craw, I. Spatial content and spatial quantisation effects in face recognition. Perception 1994, 23, 129–146. [Google Scholar] [CrossRef] [PubMed]
- Deruelle, C.; Rondan, C.; Salle-Collemiche, X.; Bastard-Rosset, D.; Da Fonséca, D. Attention to low-and high-spatial frequencies in categorizing facial identities, emotions and gender in children with autism. Brain Cogn. 2008, 66, 115–123. [Google Scholar] [CrossRef] [PubMed]
- Vlamings, P.H.; Goffaux, V.; Kemner, C. Is the early modulation of brain activity by fearful facial expressions primarily mediated by coarse low spatial frequency information? J. Vis. 2009, 9, 12. [Google Scholar] [CrossRef] [PubMed]
- Tian, J.; Wang, J.; Xia, T.; Zhao, W.; Xu, Q.; He, W. The influence of spatial frequency content on facial expression processing: An ERP study using rapid serial visual presentation. Sci. Rep. 2018, 8, 2383. [Google Scholar] [CrossRef] [PubMed]
- Willenbockel, V.; Sadr, J.; Fiset, D.; Horne, G.O.; Gosselin, F.; Tanaka, J.W. Controlling low-level image properties: The SHINE toolbox. Behav. Res. Methods 2010, 42, 671–684. [Google Scholar] [CrossRef] [PubMed]
- Haberman, J.; Lee, P.; Whitney, D. Mixed Emotions: Sensitivity to Facial Variance in a Crowd of Faces. J. Vis. 2015, 15, 16. [Google Scholar] [CrossRef] [PubMed]
- Haberman, J.; Ulrich, L. Precise Ensemble Face Representation Given Incomplete Visual Input. I-Percept. 2019, 10, 204166951881901. [Google Scholar] [CrossRef]
- Şahin, M.; Aybek, E. Jamovi: An easy to use statistical software for the social scientists. Int. J. Assess. Tools Educ. 2019, 6, 670–692. [Google Scholar] [CrossRef]
- Friston, K.J.; Holmes, A.P.; Worsley, K.J.; Poline, J.P.; Frith, C.D.; Frackowiak, R. Statistical parametric maps in functional imaging: A general linear approach. Hum. Brain Mapp. 1994, 2, 189–210. [Google Scholar] [CrossRef]
- Cushing, C.A.; Im, H.Y.; Adams, R.B., Jr.; Ward, N.; Kveraga, K. Magnocellular and parvocellular pathway contributions to facial threat cue processing. Soc. Cogn. Affect. Neurosci. 2019, 14, 151–162. [Google Scholar] [CrossRef] [PubMed]
- Tamietto, M.; De Gelder, B. Neural bases of the non-conscious perception of emotional signals. Nat. Rev. Neurosci. 2010, 11, 697–709. [Google Scholar] [CrossRef] [PubMed]
- LeDoux, J.E. The Emotional Brain: The Mysterious Underpinnings of Emotional Life; Simon and Schuster: New York, NY, USA, 1998. [Google Scholar]
- Pessoa, L.; Mckenna, M.; Gutierrez, E.; Ungerleider, L.G. Neural processing of emotional faces requires attention. Proc. Natl. Acad. Sci. USA 2002, 99, 11458–11463. [Google Scholar] [CrossRef] [PubMed]
- Whalen, P.J.; Johnstone, T. Human Amygdala Responsivity to Masked Fearful Eye Whites. Science 2004, 306, 2061. [Google Scholar] [CrossRef] [PubMed]
- Mermillod, M.; Bonin, P.; Mondillon, L.; Alleysson, D.; Vermeulen, N. Coarse scales are sufficient for efficient categorization of emotional facial expressions: Evidence from neural computation. Neurocomputing 2010, 73, 2522–2531. [Google Scholar] [CrossRef]
- Mermillod, M.; Vermeulen, N.; Lundqvist, D.; Niedenthal, P.M. Neural computation as a tool to differentiate perceptual from emotional processes: The case of anger superiority effect. Cognition 2009, 110, 346–357. [Google Scholar] [CrossRef]
- Marsh, A.A.; Adams, R.B., Jr.; Kleck, R.E. Why do fear and anger look the way they do? Form and social function in facial expressions. Personal. Soc. Psychol. Bull. 2005, 31, 73–86. [Google Scholar] [CrossRef]
- Elias, E.; Dyer, M.; Sweeny, T.D. Ensemble Perception of Dynamic Emotional Groups. Psychol. Sci. 2017, 28, 193–203. [Google Scholar] [CrossRef]
- Goldenberg, A.; Sweeny, T.D.; Shpigel, E.; Gross, J.J. Is this my group or not? The role of ensemble coding of emotional expressions in group categorization. J. Exp. Psychol. Gen. 2020, 149, 445. [Google Scholar] [CrossRef]
- Goldenberg, A.; Schöne, J.; Huang, Z.; Sweeny, T.D.; Ong, D.C.; Brady, T.F.; Robinson, M.M.; Levari, D.; Zaki, J.; Gross, J.J. Amplification in the evaluation of multiple emotional expressions over time. Nat. Hum. Behav. 2022, 6, 1408–1416. [Google Scholar] [CrossRef]
- Goldenberg, A.; Weisz, E.; Sweeny, T.; Cikara, M.; Gross, J. The Crowd Emotion Amplification Effect. Psychol. Sci. 2020, 32, 437–450. [Google Scholar] [CrossRef] [PubMed]
- Eger, E.; Schyns, P.G.; Kleinschmidt, A. Scale invariant adaptation in fusiform face-responsive regions. Neuroimage 2004, 22, 232–242. [Google Scholar] [CrossRef]
- Iidaka, T.; Yamashita, K.; Kashikura, K.; Yonekura, Y. Spatial frequency of visual image modulates neural responses in the temporo-occipital lobe. An investigation with event-related fMRI. Cogn. Brain Res. 2004, 18, 196–204. [Google Scholar] [CrossRef] [PubMed]
- De Haan, E.H.; Cowey, A. On the usefulness of ‘what’ and ‘where’ pathways in vision. Trends Cogn. Sci. 2011, 15, 460–466. [Google Scholar] [CrossRef]
- Mullen, B.; Brown, R.; Smith, C. Ingroup bias as a function of salience, relevance, and status: An integration. Eur. J. Soc. Psychol. 1992, 22, 103–122. [Google Scholar] [CrossRef]
- Aminoff, E.M.; Kveraga, K.; Bar, M. The role of the parahippocampal cortex in cognition. Trends Cogn. Sci. 2013, 17, 379–390. [Google Scholar] [CrossRef] [PubMed]
- Kauffmann, L.; Ramanoël, S.; Guyader, N.; Chauvin, A.; Peyrin, C. Spatial frequency processing in scene-selective cortical regions. Neuroimage 2015, 112, 86–95. [Google Scholar] [CrossRef]
- Kauffmann, L.; Ramanoël, S.; Peyrin, C. The neural bases of spatial frequency processing during scene perception. Front. Integr. Neurosci. 2014, 8, 37. [Google Scholar] [CrossRef]
- Kesserwani, H.; Kesserwani, A.; Kesserwani, H.N. Apperceptive prosopagnosia secondary to an ischemic infarct of the lingual gyrus: A case report and an update on the neuroanatomy, neurophysiology, and phenomenology of prosopagnosia. Cureus 2020, 12, e11272. [Google Scholar] [CrossRef]
- Hampshire, A.; Chamberlain, S.R.; Monti, M.M.; Duncan, J.; Owen, A.M. The role of the right inferior frontal gyrus: Inhibition and attentional control. Neuroimage 2010, 50, 1313–1319. [Google Scholar] [CrossRef]
- Mayer, J.S.; Bittner, R.A.; Nikolić, D.; Bledowski, C.; Goebel, R.; Linden, D.E. Common neural substrates for visual working memory and attention. Neuroimage 2007, 36, 441–453. [Google Scholar] [CrossRef] [PubMed]
- Vuilleumier, P. How brains beware: Neural mechanisms of emotional attention. Trends Cogn. Sci. 2005, 9, 585–594. [Google Scholar] [CrossRef]
- Ji, L.; Rossi, V.; Pourtois, G. Mean emotion from multiple facial expressions can be extracted with limited attention: Evidence from visual ERPs. Neuropsychologia 2018, 111, 92–102. [Google Scholar] [CrossRef]
- Li, H.; Ji, L.; Tong, K.; Ren, N.; Chen, W.; Liu, C.H.; Fu, X. Processing of Individual Items during Ensemble Coding of Facial Expressions. Front. Psychol. 2016, 7, 1332. [Google Scholar] [CrossRef]
- Mertens, A.; Hepp, J.; Voss, A.; Hische, A. Pretty crowds are happy crowds: The influence of attractiveness on mood perception. Psychol. Res.-Psychol. Forsch. 2020, 85, 1823–1836. [Google Scholar] [CrossRef]
- Mcnair, N.A.; Goodbourn, P.T.; Shone, L.T.; Harris, I.M. Summary statistics in the attentional blink. Atten. Percept. Psychophys. 2016, 79, 100–116. [Google Scholar] [CrossRef]
- Adams, R.B.; Ambady, N.; Macrae, C.N.; Kleck, R.E. Emotional expressions forecast approach-avoidance behavior. Motiv. Emot. 2006, 30, 177–186. [Google Scholar] [CrossRef]
- Kaltwasser, L.; Moore, K.; Weinreich, A.; Sommer, W. The influence of emotion type, social value orientation and processing focus on approach-avoidance tendencies to negative dynamic facial expressions. Motiv. Emot. 2017, 41, 532–544. [Google Scholar] [CrossRef]
- Marsh, A.A.; Ambady, N.; Kleck, R.E. The effects of fear and anger facial expressions on approach-and avoidance-related behaviors. Emotion 2005, 5, 119. [Google Scholar] [CrossRef] [PubMed]
- Wells, L.J.; Gillespie, S.M.; Rotshtein, P. Identification of Emotional Facial Expressions: Effects of Expression, Intensity, and Sex on Eye Gaze. PLoS ONE 2016, 11, e0168307. [Google Scholar] [CrossRef] [PubMed]
- Em, H.I.T.V.; De, G.B. From personal fear to mass panic: The neurological basis of crowd perception. Hum. Brain Mapp. 2015, 36, 2338–2351. [Google Scholar]


| Effect | ANOVA Results | ||||
|---|---|---|---|---|---|
| F | p | ηp2 | Post Hoc Tests | ||
| ACC | Emotion | 30.71 | <0.001 | 0.49 | Neutral > Fearful > Happy |
| Spatial frequency | 41.18 | <0.001 | 0.56 | BSF > LSF > HSF | |
| Emotion × Spatial frequency | 6.13 | <0.001 | 0.16 | Neutral: BSF > LSF > HSF | |
| Happy: BSF > LSF > HSF | |||||
| Fearful: BSF > LSF/HSF | |||||
| RT | Emotion | 0.47 | 0.627 | 0.001 | |
| Spatial frequency | 70.26 | <0.001 | 0.69 | BSF < LSF < HSF | |
| Emotion × Spatial frequency | 6.22 | <0.001 | 0.16 | Neutral: BSF < LSF/HSF | |
| Happy: BSF < LSF/HSF | |||||
| Fearful: BSF < LSF < HSF | |||||
| Activation Location | MNI Coordinates | t | Cluster Size | ||
|---|---|---|---|---|---|
| x | y | z | |||
| HSF > LSF | |||||
| Left middle occipital gyrus | −24 | −93 | −12 | 9.05 | 117 |
| Right inferior occipital gyrus | 27 | −93 | −12 | 6.32 | 31 |
| HSF > BSF | |||||
| Left middle occipital gyrus | −33 | −81 | 9 | 8.62 | 94 |
| Right middle occipital gyrus | 39 | −84 | 12 | 7.20 | 65 |
| Right superior parietal lobule | 24 | −57 | −15 | 5.87 | 23 |
| Right fusiform gyrus | 48 | −54 | −15 | 6.23 | 19 |
| Left fusiform gyrus | −48 | −57 | −15 | 5.65 | 12 |
| BSF > LSF | |||||
| Left inferior occipital gyrus | −24 | −93 | −12 | 16.90 | 297 |
| Right inferior occipital gyrus | 24 | −93 | −12 | 16.58 | 189 |
| Left posterior cingulate gyrus | −6 | −69 | 9 | 5.79 | 22 |
| Right lingual gyrus | 3 | −81 | −3 | 5.20 | 20 |
| Left parahippocampal gyrus | −21 | −30 | −6 | 6.41 | 18 |
| Right parahippocampal gyrus | 24 | −30 | −9 | 6.05 | 17 |
| Right amygdala | 24 | 0 | −24 | 5.83 | 17 |
| Right inferior frontal gyrus | 54 | 33 | 9 | 5.69 | 11 |
| BSF > HSF | |||||
| Right occipital lobe | 18 | −96 | −3 | 9.48 | 710 |
| Right lingual gyrus | 24 | −93 | −9 | 9.41 | 168 |
| right middle temporal gyrus | 57 | −36 | 0 | 6.59 | 133 |
| Left parahippocampal gyrus | −18 | −33 | −6 | 6.22 | 23 |
| Right parahippocampal gyrus | 21 | −30 | −9 | 5.84 | 22 |
| Right inferior frontal gyrus | 54 | 27 | 15 | 5.71 | 16 |
Disclaimer/Publisher’s Note: The statements, opinions and data contained in all publications are solely those of the individual author(s) and contributor(s) and not of MDPI and/or the editor(s). MDPI and/or the editor(s) disclaim responsibility for any injury to people or property resulting from any ideas, methods, instructions or products referred to in the content. |
© 2023 by the authors. Licensee MDPI, Basel, Switzerland. This article is an open access article distributed under the terms and conditions of the Creative Commons Attribution (CC BY) license (https://creativecommons.org/licenses/by/4.0/).
Share and Cite
Zhao, D.; Shen, X.; Li, S.; He, W. The Impact of Spatial Frequency on the Perception of Crowd Emotion: An fMRI Study. Brain Sci. 2023, 13, 1699. https://doi.org/10.3390/brainsci13121699
Zhao D, Shen X, Li S, He W. The Impact of Spatial Frequency on the Perception of Crowd Emotion: An fMRI Study. Brain Sciences. 2023; 13(12):1699. https://doi.org/10.3390/brainsci13121699
Chicago/Turabian StyleZhao, Dongfang, Xiangnan Shen, Shuaixia Li, and Weiqi He. 2023. "The Impact of Spatial Frequency on the Perception of Crowd Emotion: An fMRI Study" Brain Sciences 13, no. 12: 1699. https://doi.org/10.3390/brainsci13121699