
Sensorimotor Network Segregation Predicts Long-Term Learning of Writing Skills in Parkinson’s Disease
 , ,
, ,
Abstract
:1. Introduction
2. Materials and Methods
2.1. Participants
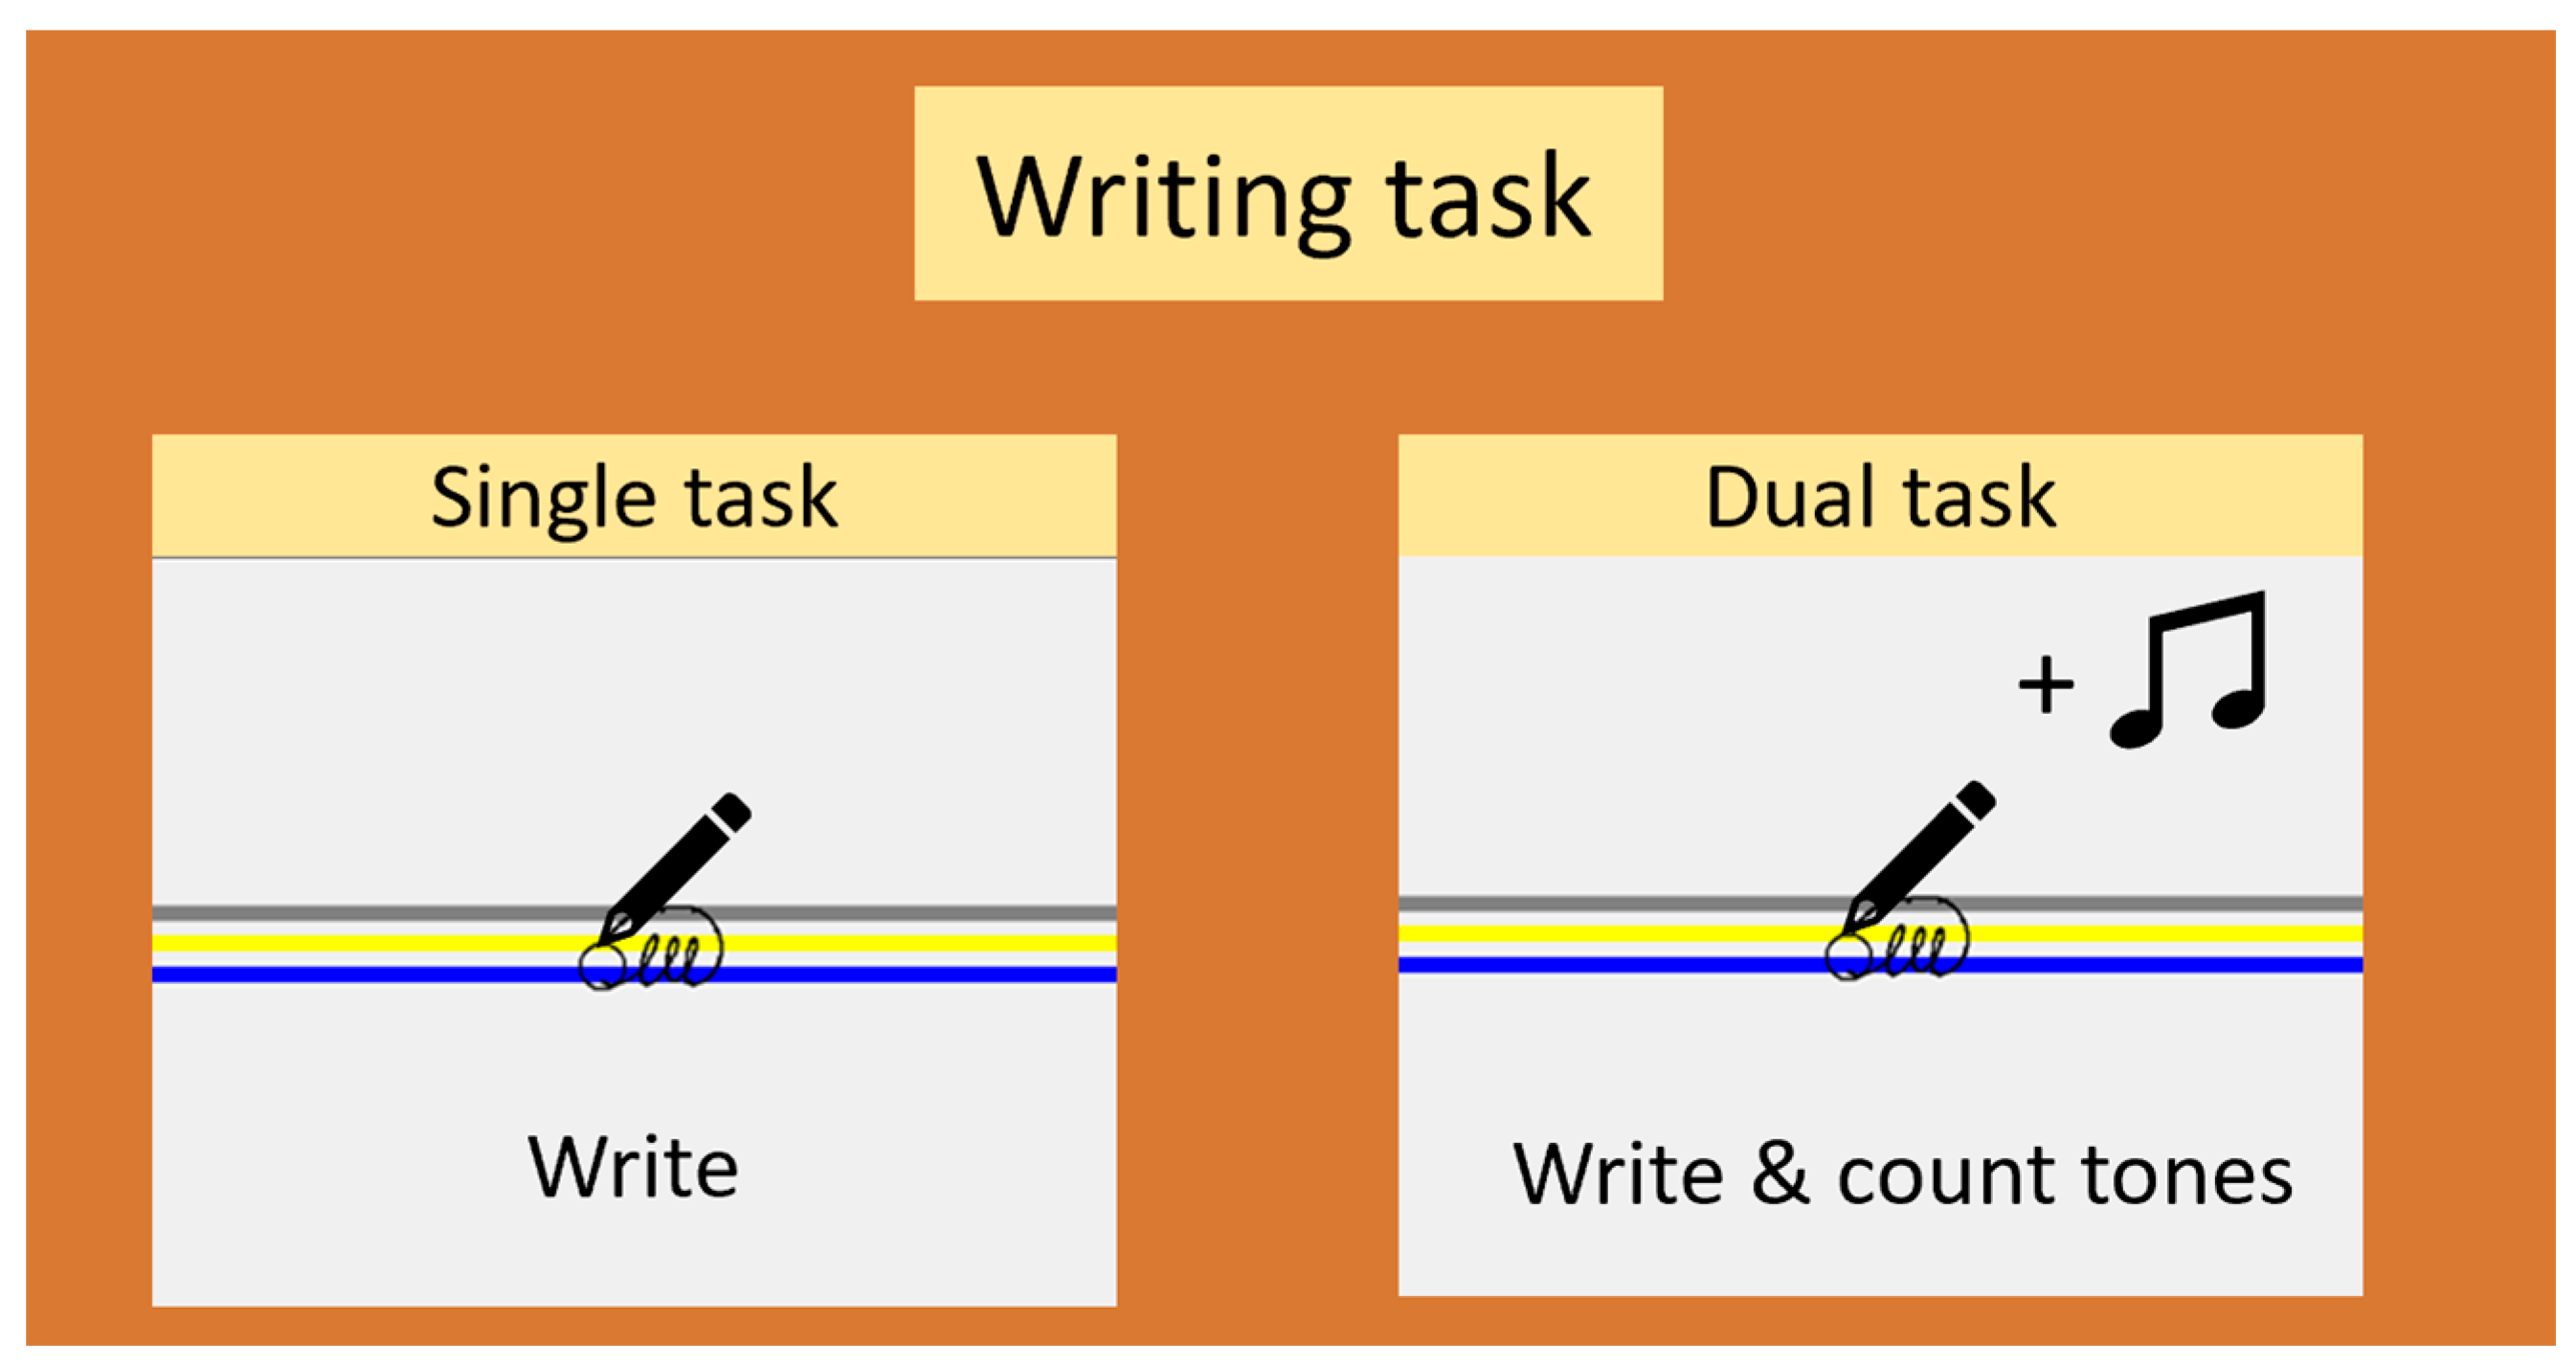
2.2. Study Design
2.3. Experimental Procedure
2.4. Writing Data Processing and Learning Outcomes
2.5. Neuroimaging Data
2.5.1. Acquisition Parameters
2.5.2. Preprocessing
2.5.3. Quality Control
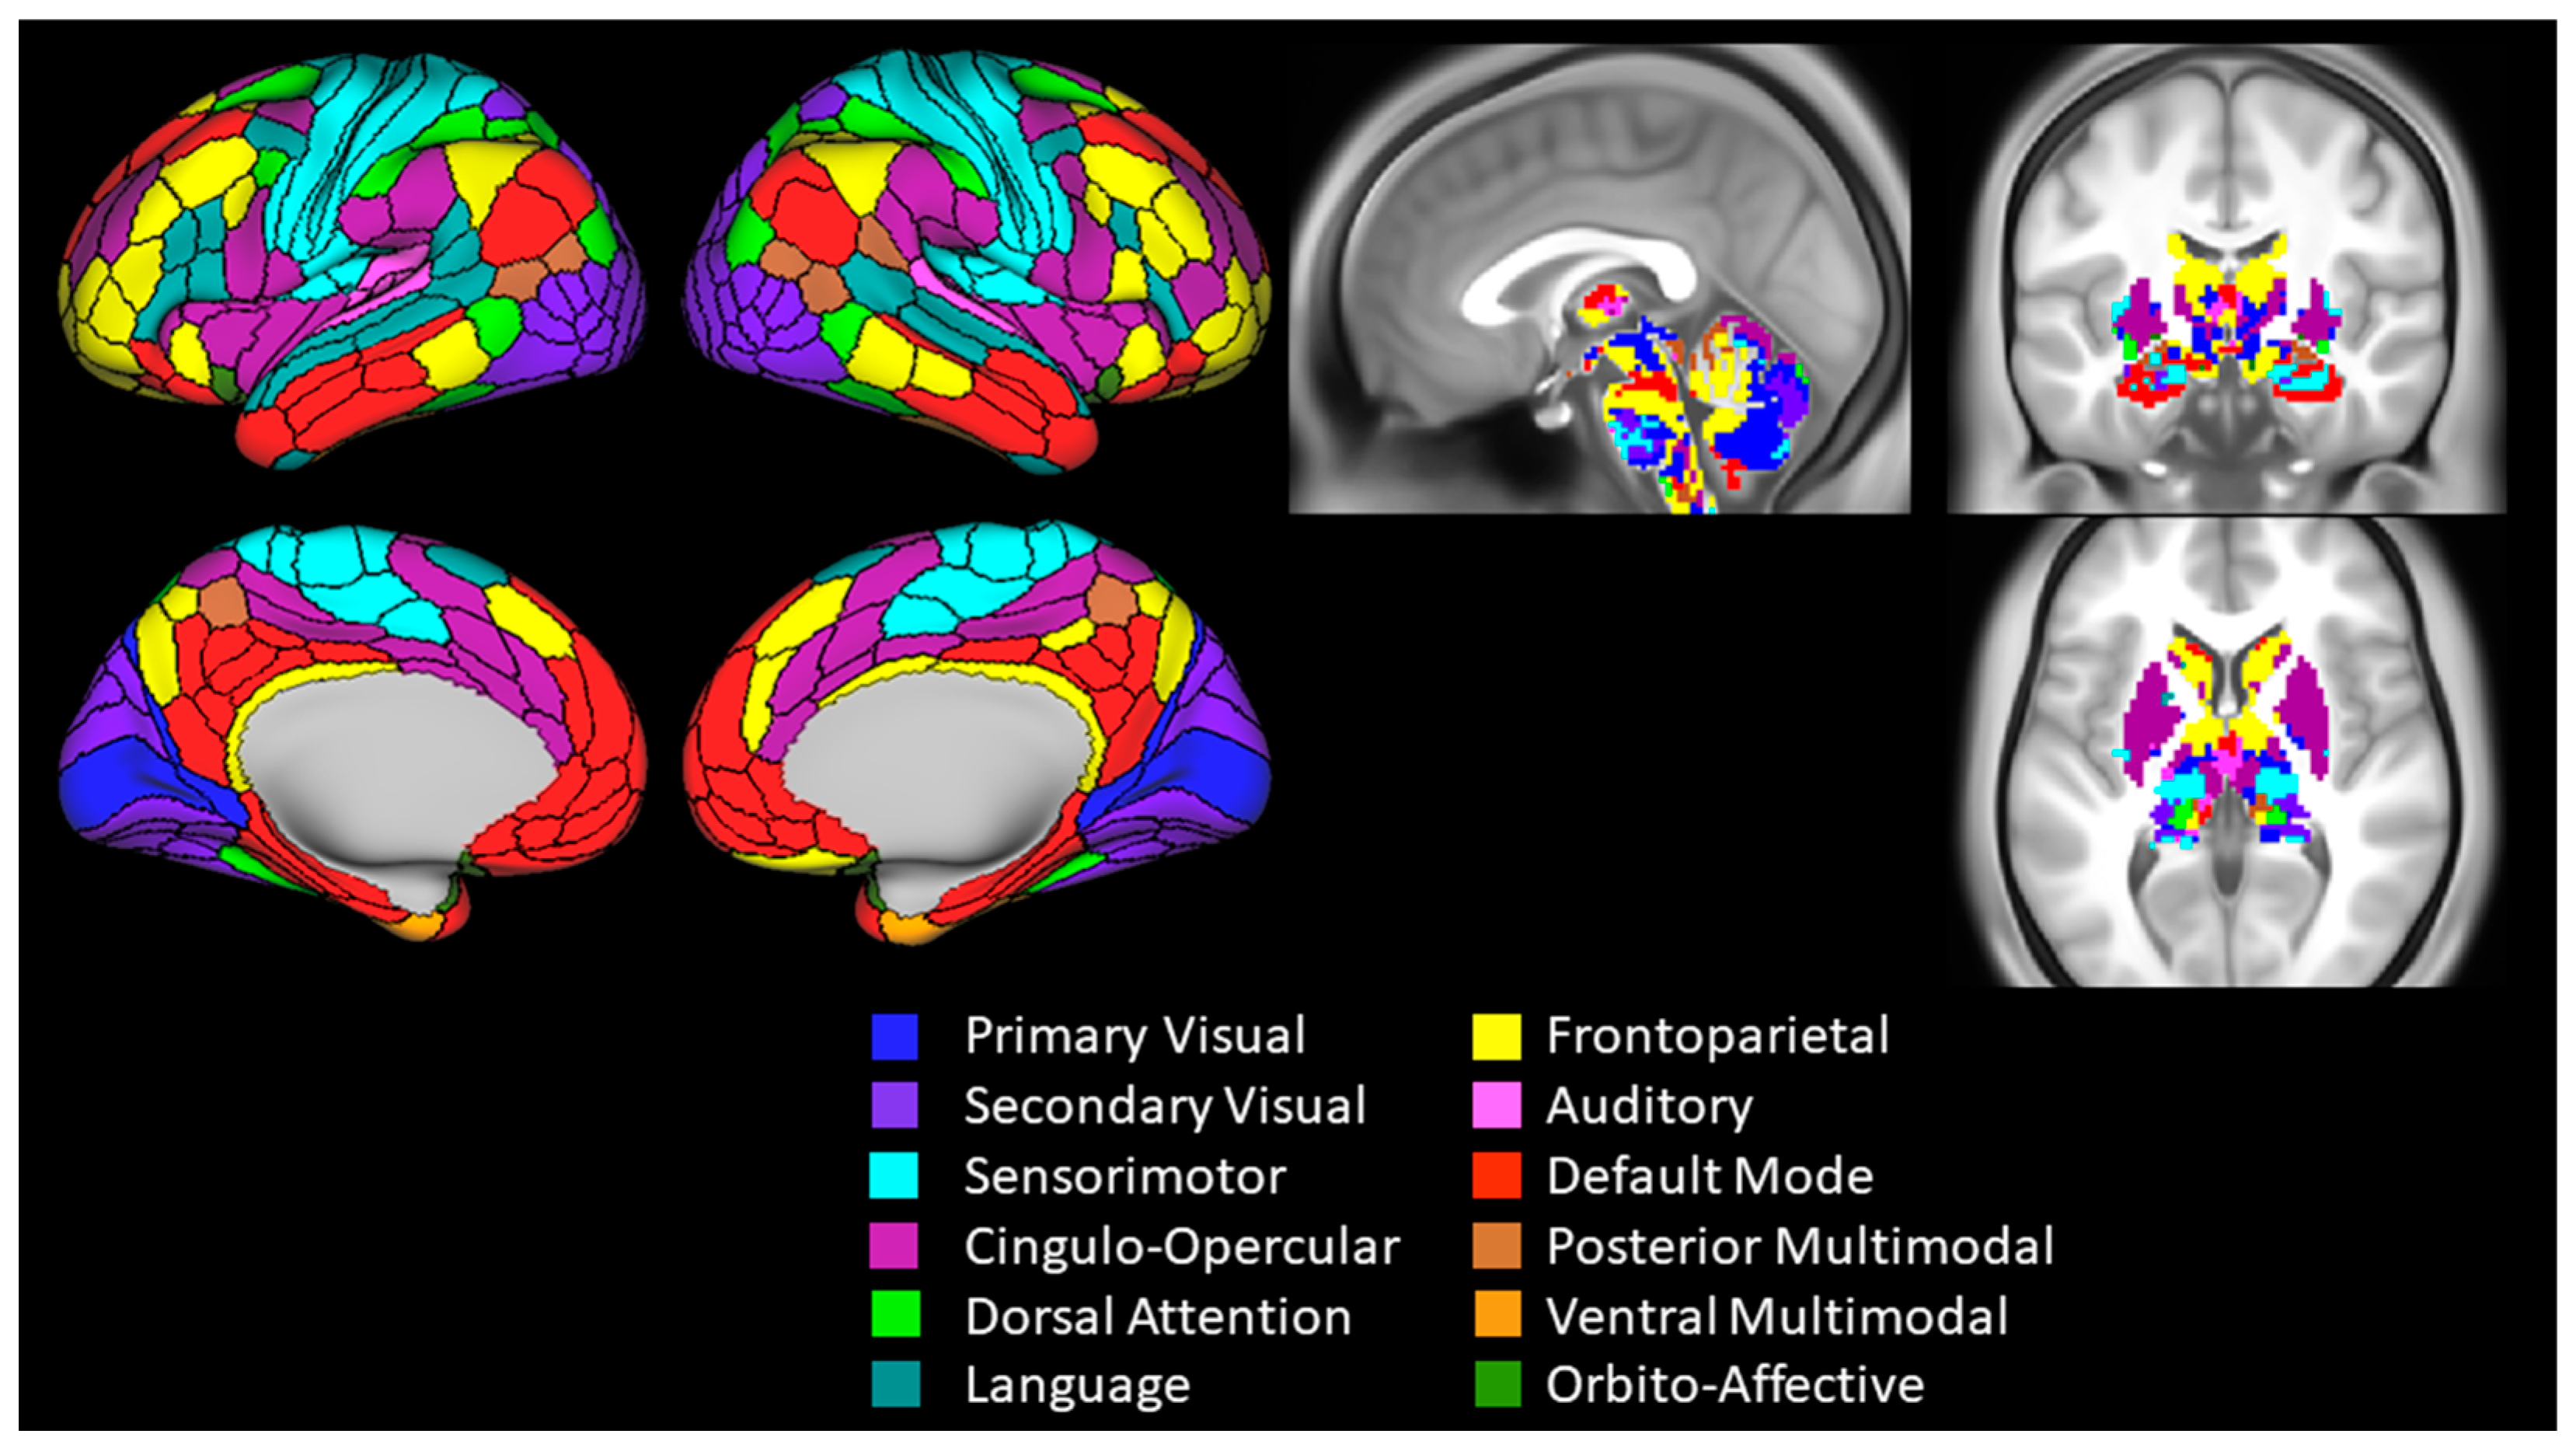
2.6. Functional Connectivity Analysis and Outcomes
2.7. Statistical Analysis
3. Results
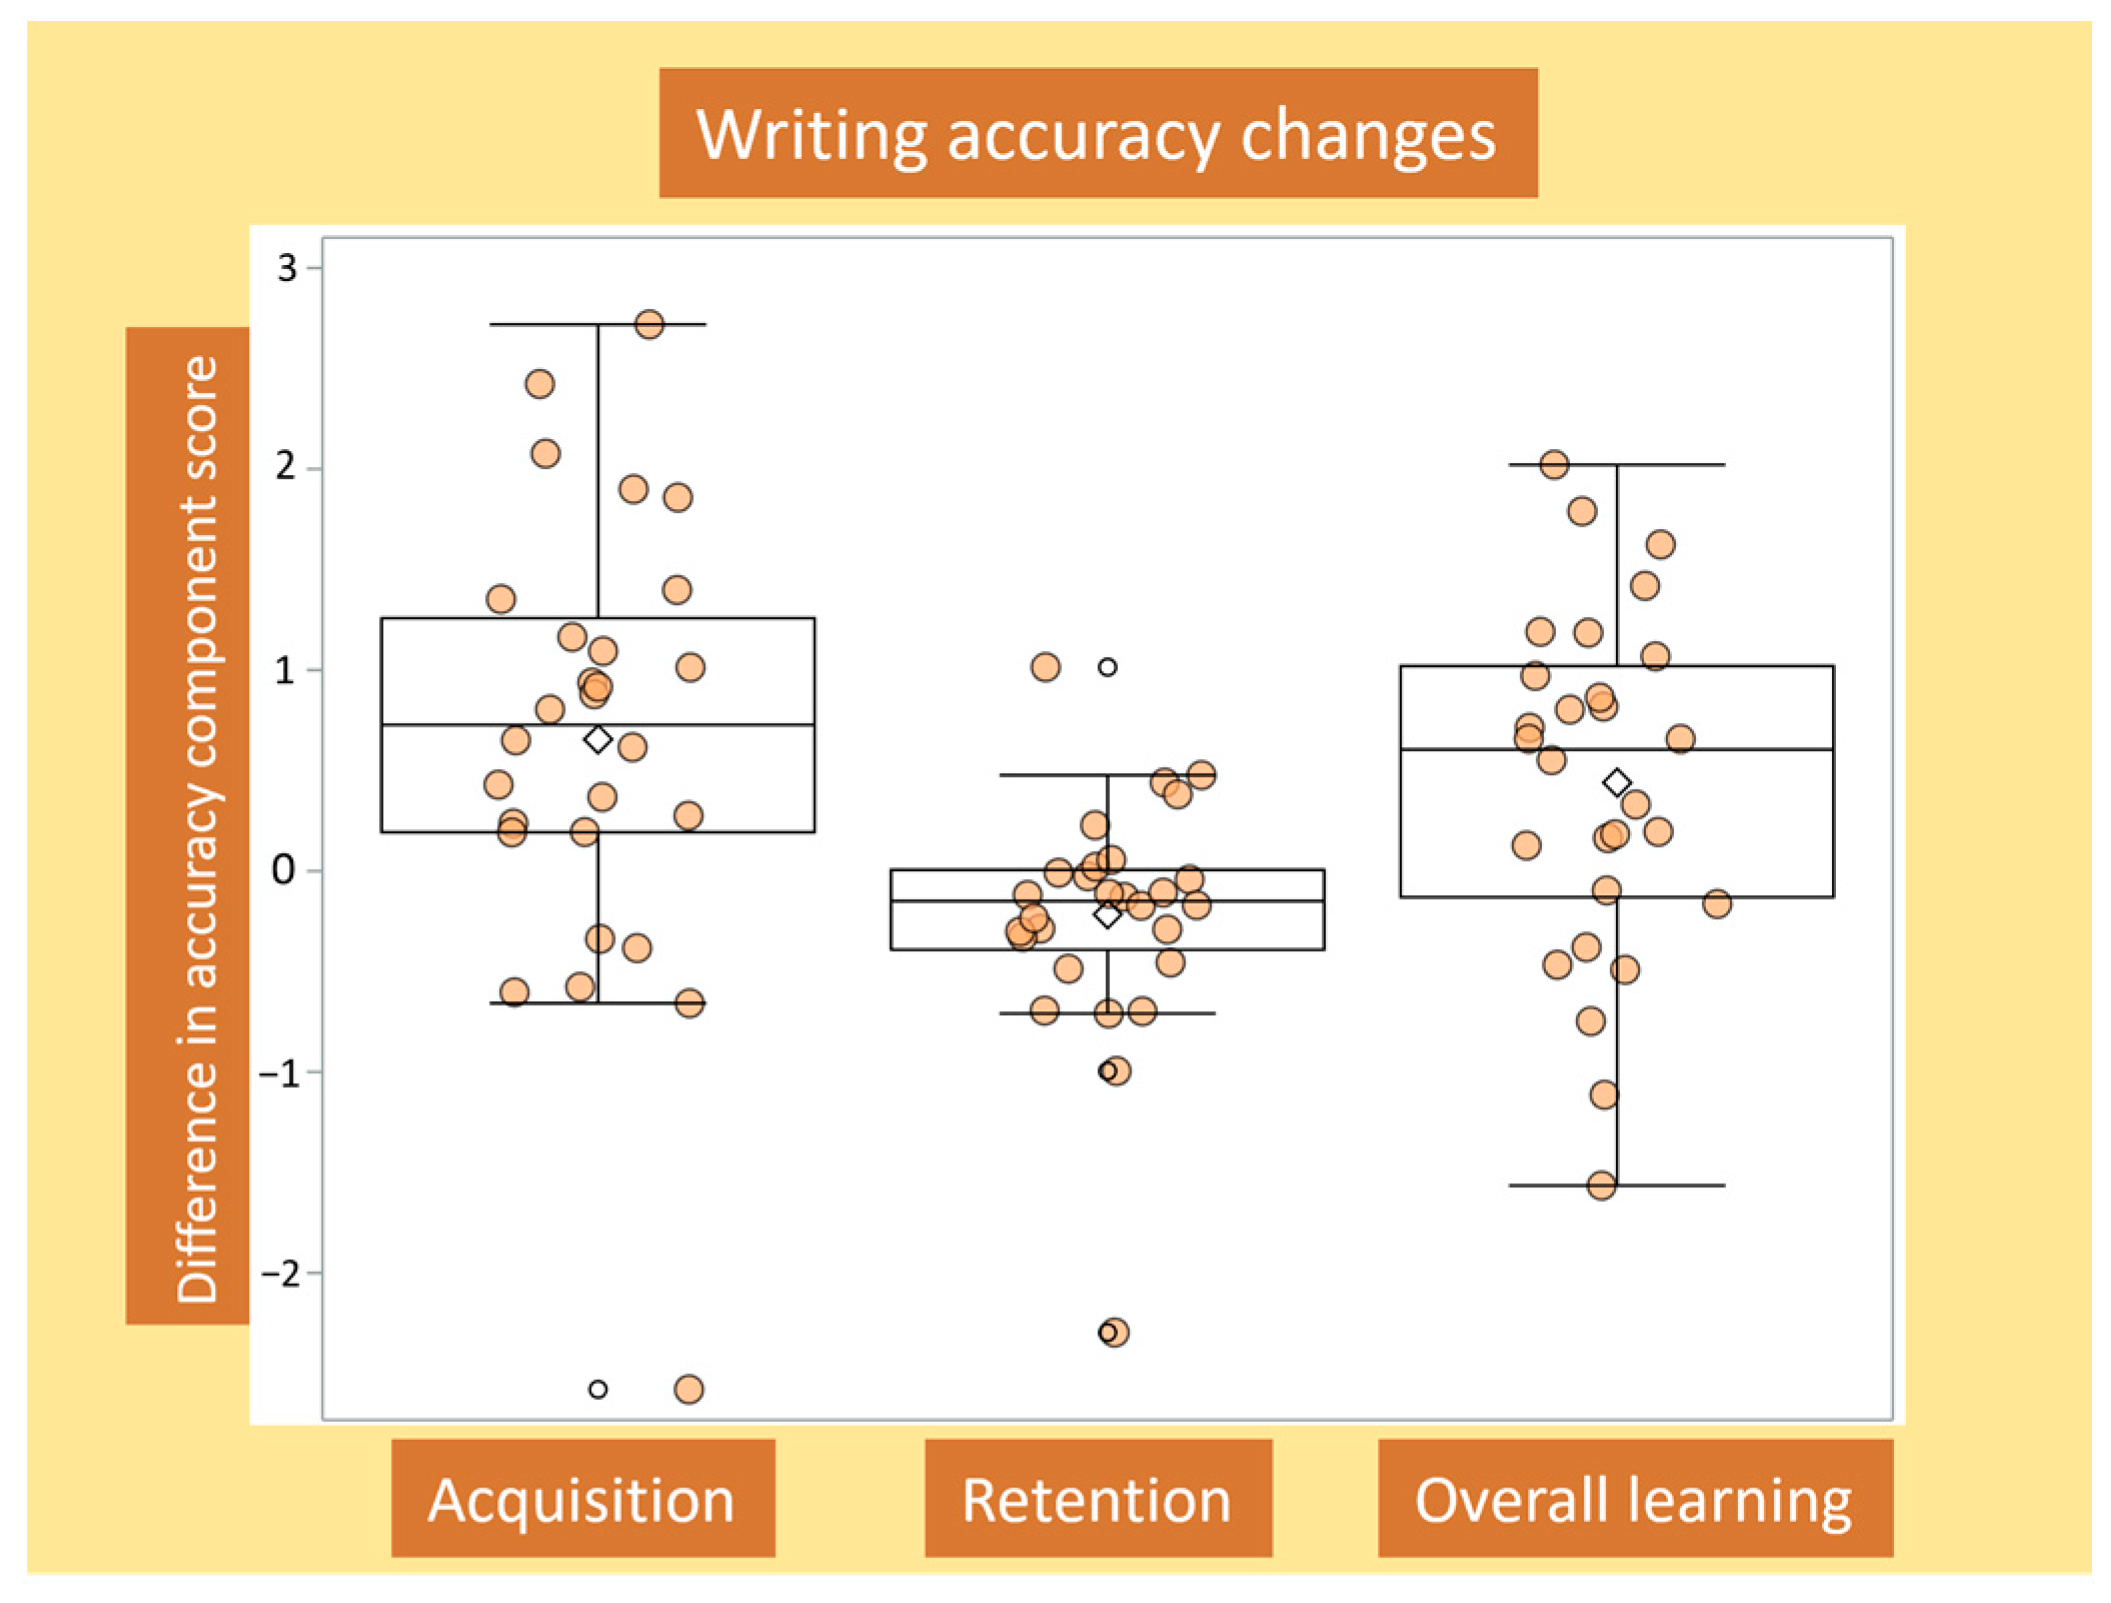
3.1. Determining Writing Accuracy Outcomes
3.2. Changes in Writing Accuracy for Acquisition, Retention and Overall Learning, and Associations with Baseline Writing Accuracy
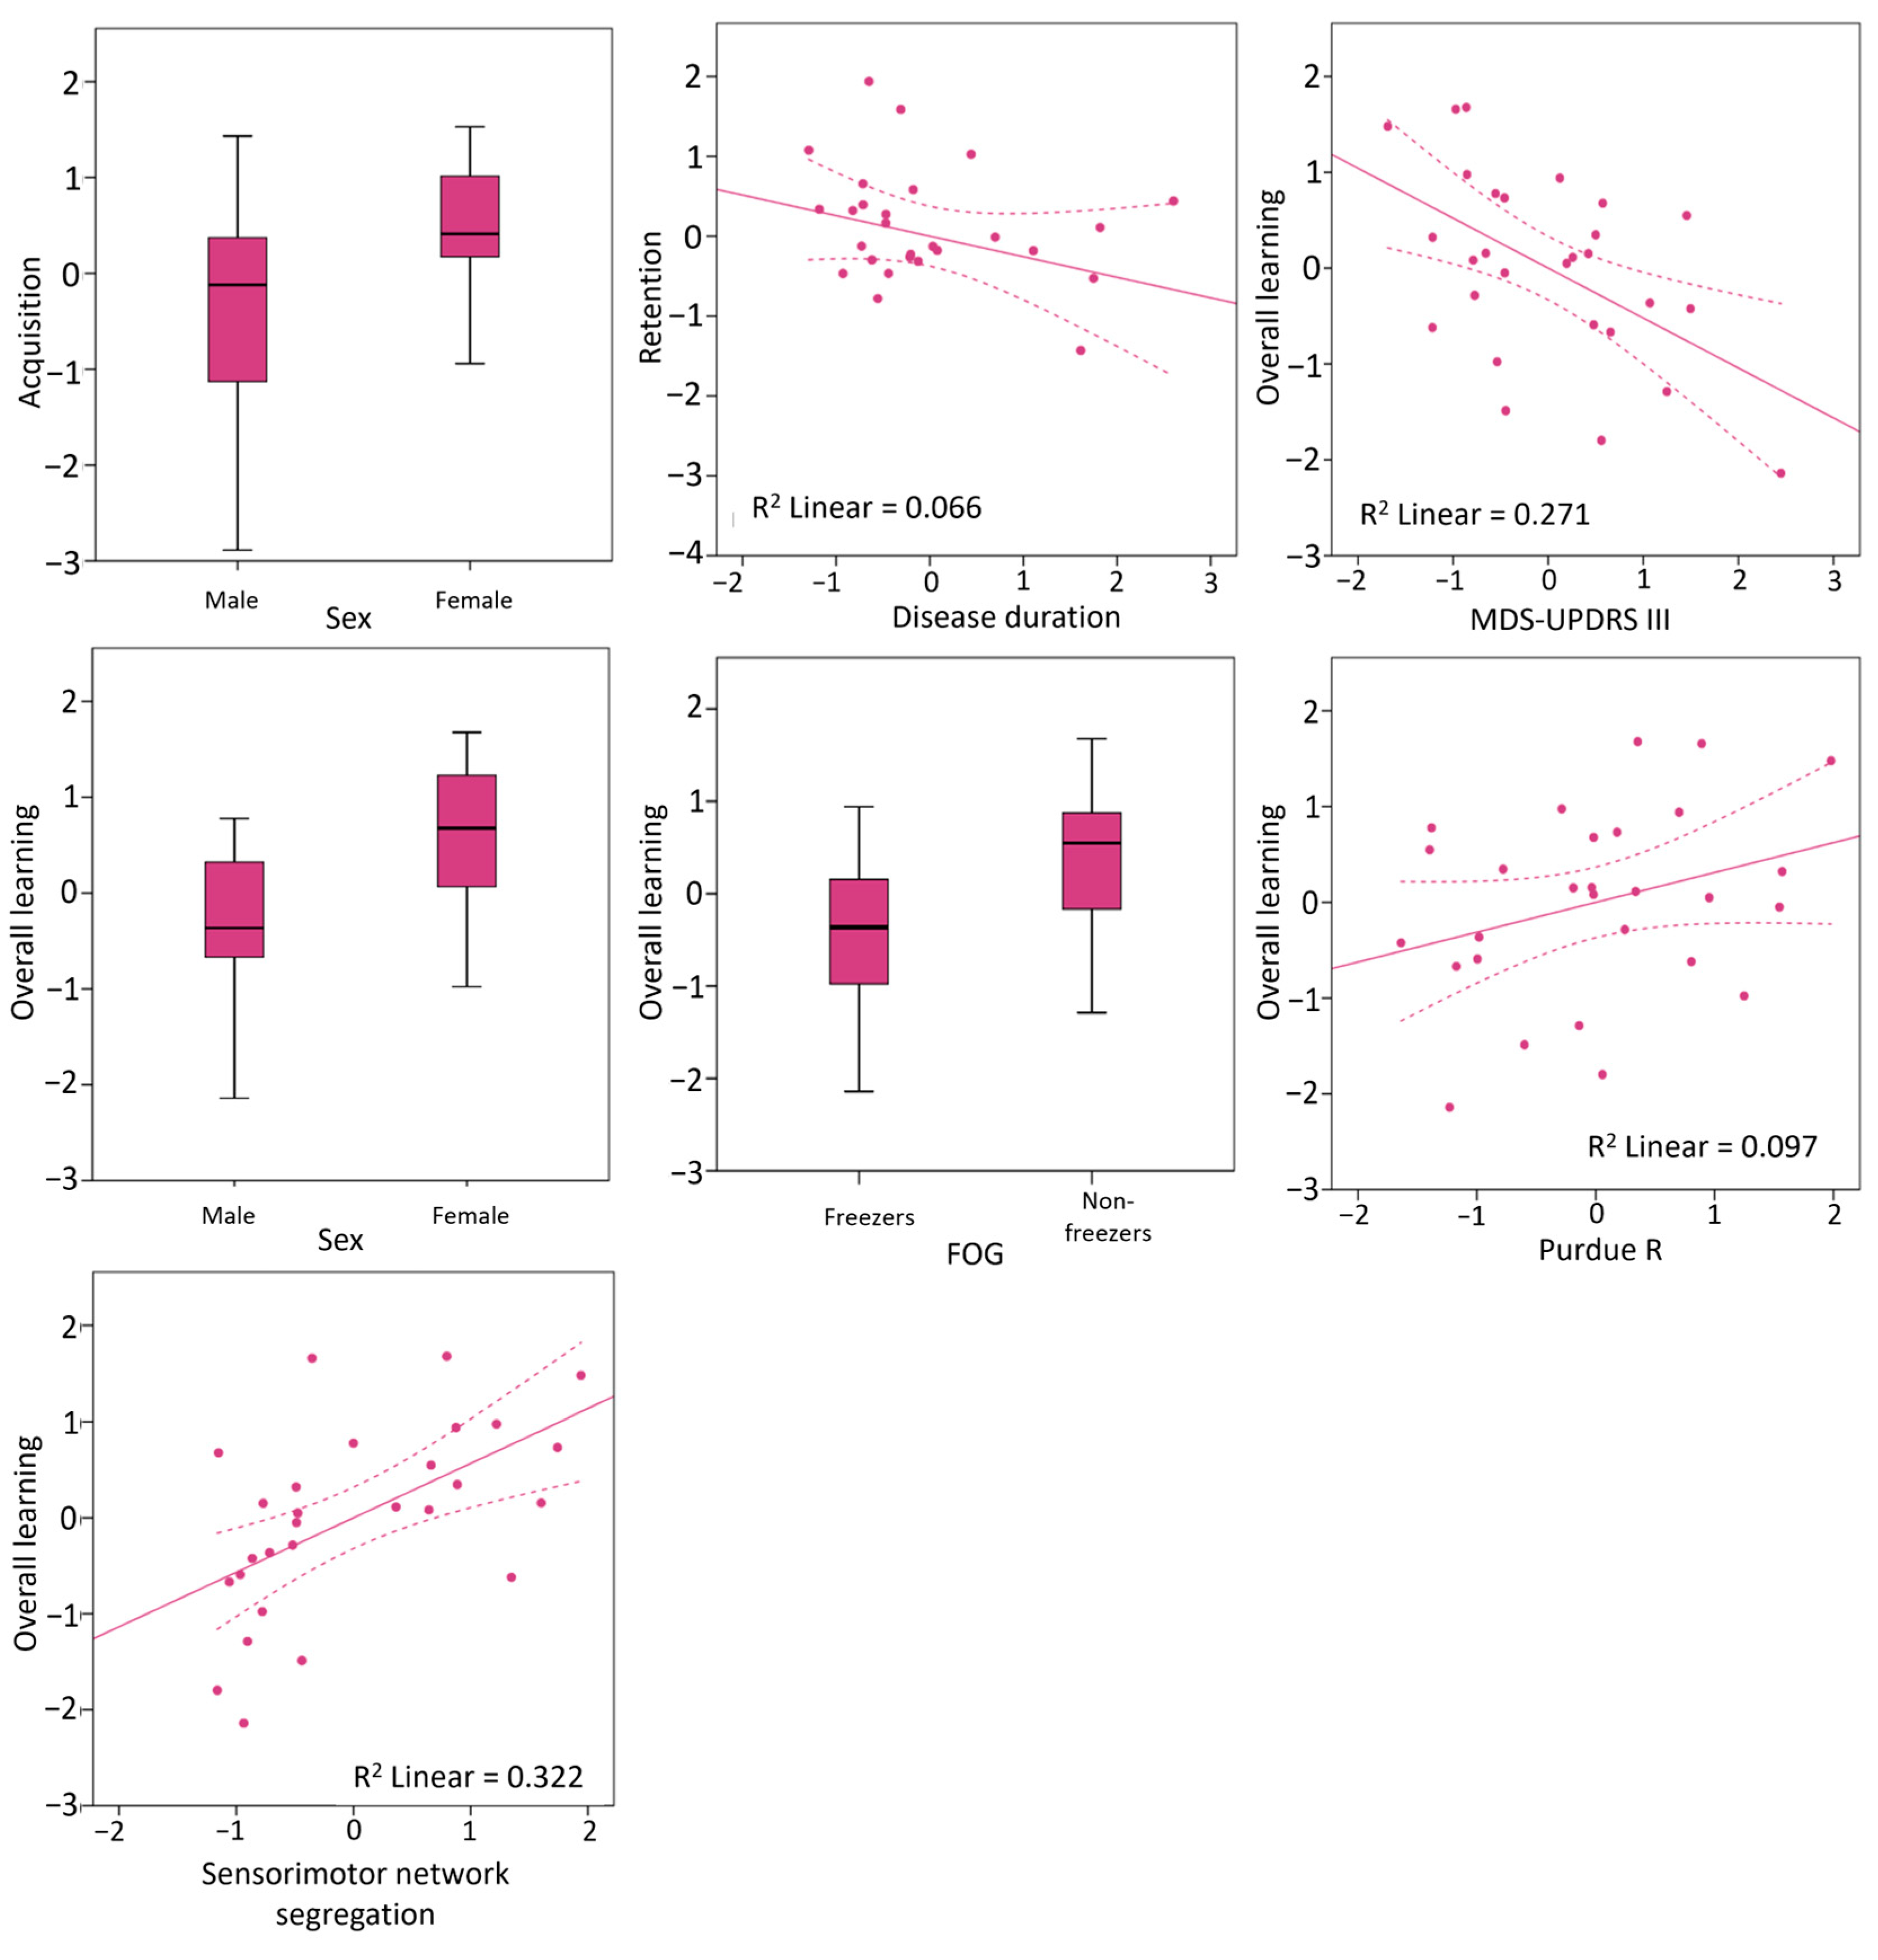
3.3. Clinical and Neural Predictors of Writing Accuracy Improvements
4. Discussion
4.1. Clinical Predictors of Motor Learning after Accounting for Baseline Accuracy
4.2. Sensorimotor Network Segregation as a Neural Signature of Motor Learning Capacity
4.3. Two to Tango—Preserved System Hardware and the Room to Improve
4.4. Clinical Implications and Limitations
5. Conclusions
Supplementary Materials
Author Contributions
Funding
Institutional Review Board Statement
Informed Consent Statement
Data Availability Statement
Acknowledgments
Conflicts of Interest
References
- Jankovic, J. Parkinson’s Disease: Clinical Features and Diagnosis. J. Neurol. Neurosurg. Psychiatry 2008, 79, 368–376. [Google Scholar] [CrossRef] [PubMed]
- Kish, S.J.; Shannak, K.; Hornykiewicz, O. Uneven Pattern of Dopamine Loss in the Striatum of Patients with Idiopathic Parkinson’s Disease. N. Engl. J. Med. 1988, 318, 876–880. [Google Scholar] [CrossRef] [PubMed]
- Lehericy, S.; Benali, H.; Van de Moortele, P.-F.; Pelegrini-Issac, M.; Waechter, T.; Ugurbil, K.; Doyon, J. Distinct Basal Ganglia Territories Are Engaged in Early and Advanced Motor Sequence Learning. Proc. Natl. Acad. Sci. USA 2005, 102, 12566–12571. [Google Scholar] [CrossRef] [PubMed]
- Wu, T.; Hallett, M.; Chan, P. Motor Automaticity in Parkinson’s Disease. Neurobiol. Dis. 2015, 82, 226–234. [Google Scholar] [CrossRef] [PubMed]
- Cristini, J.; Parwanta, Z.; De las Heras, B.; Medina-Rincon, A.; Paquette, C.; Doyon, J.; Dagher, A.; Steib, S.; Roig, M. Motor Memory Consolidation Deficits in Parkinson’s Disease: A Systematic Review with Meta-Analysis. J. Park. Dis. 2023, 13, 865–892. [Google Scholar] [CrossRef] [PubMed]
- Nieuwboer, A.; Rochester, L.; Müncks, L.; Swinnen, S.P. Motor Learning in Parkinson’s Disease: Limitations and Potential for Rehabilitation. Park. Relat. Disord. 2009, 15, 53–58. [Google Scholar] [CrossRef] [PubMed]
- Olson, M.; Lockhart, T.E.; Lieberman, A. Motor Learning Deficits in Parkinson’s Disease (PD) and Their Effect on Training Response in Gait and Balance: A Narrative Review. Front. Neurol. 2019, 10, 62. [Google Scholar] [CrossRef] [PubMed]
- Wu, T.; Hallett, M. A Functional MRI Study of Automatic Movements in Patients with Parkinson’s Disease. Brain 2005, 128, 2250–2259. [Google Scholar] [CrossRef]
- Wu, T.; Chan, P.; Hallett, M. Effective Connectivity of Neural Networks in Automatic Movements in Parkinson’s Disease. NeuroImage 2010, 49, 2581–2587. [Google Scholar] [CrossRef]
- Shukla, A.W.; Ounpraseuth, S.; Okun, M.S.; Gray, V.; Schwankhaus, J.; Metzer, W.S. Micrographia and Related Deficits in Parkinson’s Disease: A Cross-Sectional Study. BMJ Open 2012, 2, e000628. [Google Scholar] [CrossRef]
- Oliveira, R.M.; Gurd, J.M.; Nixon, P.; Marshall, J.C.; Passingham, R.E. Micrographia in Parkinson’s Disease: The Effect of Providing External Cues. J. Neurol. Neurosurg. Psychiatry 1997, 63, 429–433. [Google Scholar] [CrossRef]
- Latimer, N.; Reelfs, A.; Halbert, J.; Hansen, J.; Miller, A.; Barton, C.; Stuhr, J.; Zaman, A.; Stegemöller, E.L. The Effects of Auditory Cues and Weighted Pens on Handwriting in Individuals with Parkinson’s Disease. J. Hand Ther. 2024, 37, 144–152. [Google Scholar] [CrossRef] [PubMed]
- Gardoni, A.; Sarasso, E.; Agosta, F.; Filippi, M.; Corbetta, D. Rehabilitative Interventions for Impaired Handwriting in People with Parkinson’s Disease: A Scoping Review. Neurol. Sci. 2023, 44, 2667–2677. [Google Scholar] [CrossRef]
- Nackaerts, E.; Heremans, E.; Vervoort, G.; Smits-Engelsman, B.C.M.; Swinnen, S.P.; Vandenberghe, W.; Bergmans, B.; Nieuwboer, A. Relearning of Writing Skills in Parkinson’s Disease After Intensive Amplitude Training. Mov. Disord. 2016, 31, 1209–1216. [Google Scholar] [CrossRef]
- Heremans, E.; Nackaerts, E.; Vervoort, G.; Broeder, S.; Swinnen, S.P.; Nieuwboer, A. Impaired Retention of Motor Learning of Writing Skills in Patients with Parkinson’s Disease with Freezing of Gait. PLoS ONE 2016, 11, e0148933. [Google Scholar] [CrossRef]
- Peterson, D.S.; Horak, F.B. Effects of Freezing of Gait on Postural Motor Learning in People with Parkinson’s Disease. Neuroscience 2016, 334, 283–289. [Google Scholar] [CrossRef]
- Vandenbossche, J.; Deroost, N.; Soetens, E.; Coomans, D.; Spildooren, J.; Vercruysse, S.; Nieuwboer, A.; Kerckhofs, E. Impaired Implicit Sequence Learning in Parkinson’s Disease Patients with Freezing of Gait. Neuropsychology 2013, 27, 28–36. [Google Scholar] [CrossRef] [PubMed]
- Löfgren, N.; Conradsson, D.; Joseph, C.; Leavy, B.; Hagströmer, M.; Franzén, E. Factors Associated With Responsiveness to Gait and Balance Training in People with Parkinson Disease. J. Neurol. Phys. Ther. 2019, 43, 42. [Google Scholar] [CrossRef] [PubMed]
- Strouwen, C.; Molenaar, E.A.L.M.; Münks, L.; Broeder, S.; Ginis, P.; Bloem, B.R.; Nieuwboer, A.; Heremans, E. Determinants of Dual-Task Training Effect Size in Parkinson Disease: Who Will Benefit Most? J. Neurol. Phys. Ther. 2019, 43, 3–11. [Google Scholar] [CrossRef]
- Mattar, M.G.; Wymbs, N.F.; Bock, A.S.; Aguirre, G.K.; Grafton, S.T.; Bassett, D.S. Predicting Future Learning from Baseline Network Architecture. NeuroImage 2018, 172, 107–117. [Google Scholar] [CrossRef]
- Biswal, B.; Zerrin Yetkin, F.; Haughton, V.M.; Hyde, J.S. Functional Connectivity in the Motor Cortex of Resting Human Brain Using Echo-Planar Mri. Magn. Reson. Med. 1995, 34, 537–541. [Google Scholar] [CrossRef] [PubMed]
- Ma, L.; Narayana, S.; Robin, D.A.; Fox, P.T.; Xiong, J. Changes Occur in Resting State Network of Motor System during 4 Weeks of Motor Skill Learning. NeuroImage 2011, 58, 226–233. [Google Scholar] [CrossRef] [PubMed]
- Solesio-Jofre, E.; Beets, I.A.M.; Woolley, D.G.; Pauwels, L.; Chalavi, S.; Mantini, D.; Swinnen, S.P. Age-Dependent Modulations of Resting State Connectivity Following Motor Practice. Front. Aging Neurosci. 2018, 10, 25. [Google Scholar] [CrossRef] [PubMed]
- Droby, A.; Maidan, I.; Jacob, Y.; Giladi, N.; Hausdorff, J.M.; Mirelman, A. Distinct Effects of Motor Training on Resting-State Functional Networks of the Brain in Parkinson’s Disease. Neurorehabil. Neural Repair 2020, 34, 795–803. [Google Scholar] [CrossRef] [PubMed]
- De Vleeschhauwer, J.; Nackaerts, E.; D’Cruz, N.; Vandendoorent, B.; Micca, L.; Vandenberghe, W.; Nieuwboer, A. Associations between Resting-State Functional Connectivity Changes and Prolonged Benefits of Writing Training in Parkinson’s Disease. J. Neurol. 2022, 269, 4696–4707. [Google Scholar] [CrossRef] [PubMed]
- King, B.R.; Van Ruitenbeek, P.; Leunissen, I.; Cuypers, K.; Heise, K.F.; Santos Monteiro, T.; Hermans, L.; Levin, O.; Albouy, G.; Mantini, D.; et al. Age-Related Declines in Motor Performance Are Associated with Decreased Segregation of Large-Scale Resting State Brain Networks. Cereb. Cortex 2018, 28, 4390–4402. [Google Scholar] [CrossRef]
- Monteiro, T.S.; Zivari Adab, H.; Chalavi, S.; Gooijers, J.; King, B.R.; Cuypers, K.; Mantini, D.; Swinnen, S.P. Reduced Modulation of Task-Related Connectivity Mediates Age-Related Declines in Bimanual Performance. Cereb. Cortex 2020, 30, 4346–4360. [Google Scholar] [CrossRef]
- McGregor, H.R.; Gribble, P.L. Functional Connectivity between Somatosensory and Motor Brain Areas Predicts Individual Differences in Motor Learning by Observing. J. Neurophysiol. 2017, 118, 1235–1243. [Google Scholar] [CrossRef]
- Hughes, A.J.; Daniel, S.E.; Kilford, L.; Lees, A.J. Accuracy of Clinical Diagnosis of Idiopathic Parkinson’s Disease: A Clinico-Pathological Study of 100 Cases. J. Neurol. Neurosurg. Psychiatry 1992, 55, 181–184. [Google Scholar] [CrossRef]
- Oldfield, R.C. The Assessment and Analysis of Handedness: The Edinburgh Inventory. Neuropsychologia 1971, 9, 97–113. [Google Scholar] [CrossRef]
- Hoehn, M.; Yahr, M. Parkinsonism: Onset, Progression and Mortality. Neurology 1967, 17, 427–442. [Google Scholar] [CrossRef] [PubMed]
- Goetz, C.G.; Tilley, B.C.; Shaftman, S.R.; Stebbins, G.T.; Fahn, S.; Martinez-Martin, P.; Poewe, W.; Sampaio, C.; Stern, M.B.; Dodel, R.; et al. Movement Disorder Society-Sponsored Revision of the Unified Parkinson’s Disease Rating Scale (MDS-UPDRS): Scale Presentation and Clinimetric Testing Results. Mov. Disord. 2008, 23, 2129–2170. [Google Scholar] [CrossRef] [PubMed]
- Folstein, M.F.; Folstein, S.E.; McHugh, P.R. “Mini-Mental State” A Practical Method for Grading the Cognitive State of Patients for the Clinician. J. Psychiat. Res. 1975, 12, 189–198. [Google Scholar] [CrossRef] [PubMed]
- Nackaerts, E.; Nieuwboer, A.; Broeder, S.; Swinnen, S.; Vandenberghe, W.; Heremans, E. Altered Effective Connectivity Contributes to Micrographia in Patients with Parkinson’s Disease and Freezing of Gait. J. Neurol. 2018, 265, 336–347. [Google Scholar] [CrossRef]
- Nackaerts, E.; Michely, J.; Heremans, E.; Swinnen, S.; Smits-Engelsman, B.; Vandenberghe, W.; Grefkes, C.; Nieuwboer, A. Being on Target: Visual Information during Writing Affects Effective Connectivity in Parkinson’s Disease. Neuroscience 2018, 371, 484–494. [Google Scholar] [CrossRef]
- Nackaerts, E.; Michely, J.; Heremans, E.; Swinnen, S.P.; Smits-Engelsman, B.C.M.; Vandenberghe, W.; Grefkes, C.; Nieuwboer, A. Training for Micrographia Alters Neural Connectivity in Parkinson’s Disease. Front. Neurosci. 2018, 12, 3. [Google Scholar] [CrossRef] [PubMed]
- Nasreddine, Z.S.; Phillips, N.A.; Bédirian, V.; Charbonneau, S.; Whitehead, V.; Collin, I.; Cummings, J.L.; Chertkow, H. The Montreal Cognitive Assessment, MoCA: A Brief Screening Tool For Mild Cognitive Impairment. J. Am. Geriatr. Soc. 2005, 53, 695–699. [Google Scholar] [CrossRef]
- Zigmond, A.S.; Snaith, R.P. The Hospital Anxiety and Depression Scale. Acta Psychiatr. Scand. 1983, 67, 361–370. [Google Scholar] [CrossRef]
- Schade, S.; Mollenhauer, B.; Trenkwalder, C. Levodopa Equivalent Dose Conversion Factors: An Updated Proposal Including Opicapone and Safinamide. Mov. Disord. Clin. Pract. 2020, 7, 343–345. [Google Scholar] [CrossRef]
- Tomlinson, C.L.; Stowe, R.; Patel, S.; Rick, C.; Gray, R.; Clarke, C.E. Systematic Review of Levodopa Dose Equivalency Reporting in Parkinson’s Disease. Mov. Disord. 2010, 25, 2649–2653. [Google Scholar] [CrossRef]
- Nieuwboer, A.; Rochester, L.; Herman, T.; Vandenberghe, W.; Emil, G.E.; Thomaes, T.; Giladi, N. Reliability of the New Freezing of Gait Questionnaire: Agreement between Patients with Parkinson’s Disease and Their Carers. Gait Posture 2009, 30, 459–463. [Google Scholar] [CrossRef]
- Tiffin, J.; Asher, E.J. The Purdue Pegboard: Norms and Studies of Reliability and Validity. J. Appl. Psychol. 1948, 32, 234–247. [Google Scholar] [CrossRef]
- Van Gemmert, A.W.A.; Adler, C.H.; Stelmach, G.E. Parkinson’s Disease Patients Undershoot Target Size in Handwriting and Similar Tasks. J. Neurol. Neurosurg. Psychiatry 2003, 74, 1502–1508. [Google Scholar] [CrossRef]
- Esteban, O.; Markiewicz, C.J.; Blair, R.W.; Moodie, C.A.; Isik, A.I.; Erramuzpe, A.; Kent, J.D.; Goncalves, M.; DuPre, E.; Snyder, M.; et al. fMRIPrep: A Robust Preprocessing Pipeline for Functional MRI. Nat. Methods 2019, 16, 111–116. [Google Scholar] [CrossRef] [PubMed]
- Gorgolewski, K.; Burns, C.D.; Madison, C.; Clark, D.; Halchenko, Y.O.; Waskom, M.L.; Ghosh, S.S. Nipype: A Flexible, Lightweight and Extensible Neuroimaging Data Processing Framework in Python. Front. Neuroinform. 2011, 5, 13. [Google Scholar] [CrossRef]
- Whitfield-Gabrieli, S.; Nieto-Castanon, A. Conn: A Functional Connectivity Toolbox for Correlated and Anticorrelated Brain Networks. Brain Connect. 2012, 2, 125–141. [Google Scholar] [CrossRef] [PubMed]
- Satterthwaite, T.D.; Elliott, M.A.; Gerraty, R.T.; Ruparel, K.; Loughead, J.; Calkins, M.E.; Eickhoff, S.B.; Hakonarson, H.; Gur, R.C.; Gur, R.E.; et al. An Improved Framework for Confound Regression and Filtering for Control of Motion Artifact in the Preprocessing of Resting-State Functional Connectivity Data. NeuroImage 2013, 64, 240–256. [Google Scholar] [CrossRef] [PubMed]
- Ji, J.L.; Spronk, M.; Kulkarni, K.; Repovš, G.; Anticevic, A.; Cole, M.W. Mapping the Human Brain’s Cortical-Subcortical Functional Network Organization. NeuroImage 2019, 185, 35–57. [Google Scholar] [CrossRef]
- Glasser, M.F.; Coalson, T.S.; Robinson, E.C.; Hacker, C.D.; Harwell, J.; Yacoub, E.; Ugurbil, K.; Andersson, J.; Beckmann, C.F.; Jenkinson, M.; et al. A Multi-Modal Parcellation of Human Cerebral Cortex. Nature 2016, 536, 171–178. [Google Scholar] [CrossRef]
- Murphy, K.; Birn, R.M.; Handwerker, D.A.; Jones, T.B.; Bandettini, P.A. The Impact of Global Signal Regression on Resting State Correlations: Are Anti-Correlated Networks Introduced? NeuroImage 2009, 44, 893–905. [Google Scholar] [CrossRef]
- Buckner, R.L.; Krienen, F.M.; Yeo, B.T.T. Opportunities and Limitations of Intrinsic Functional Connectivity MRI. Nat. Neurosci. 2013, 16, 832–837. [Google Scholar] [CrossRef]
- Chan, M.Y.; Park, D.C.; Savalia, N.K.; Petersen, S.E.; Wig, G.S. Decreased Segregation of Brain Systems across the Healthy Adult Lifespan. Proc. Natl. Acad. Sci. USA 2014, 111, E4997–E5006. [Google Scholar] [CrossRef] [PubMed]
- Jung, S.H.; Hasegawa, N.; Mancini, M.; King, L.A.; Carlson-Kuhta, P.; Smulders, K.; Peterson, D.S.; Barlow, N.; Harker, G.; Morris, R.; et al. Effects of the Agility Boot Camp with Cognitive Challenge (ABC-C) Exercise Program for Parkinson’s Disease. npj Park. Dis. 2020, 6, 31. [Google Scholar] [CrossRef] [PubMed]
- Lingo VanGilder, J.; Lopez-Lennon, C.; Paul, S.S.; Dibble, L.E.; Duff, K.; Schaefer, S.Y. Relating Global Cognition with Upper-Extremity Motor Skill Retention in Individuals with Mild-to-Moderate Parkinson’s Disease. Front. Rehabil. Sci. 2021, 2, 754118. [Google Scholar] [CrossRef]
- Silva-Batista, C.; Ragothaman, A.; Mancini, M.; Carlson-Kuhta, P.; Harker, G.; Jung, S.H.; Nutt, J.G.; Fair, D.A.; Horak, F.B.; Miranda-Domínguez, O. Cortical Thickness as Predictor of Response to Exercise in People with Parkinson’s Disease. Hum. Brain Mapp. 2021, 42, 139–153. [Google Scholar] [CrossRef]
- Tsai, S.-Y.; Tai, C.-H.; Lee, Y.-Y. Exploring Potential Predictors of Treadmill Training Effects in People With Parkinson Disease. Arch. Phys. Med. Rehabil. 2023, 105, 525–530. [Google Scholar] [CrossRef]
- Carpenter, J.; Bithell, J. Bootstrap Confidence Intervals: When, Which, What? A Practical Guide for Medical Statisticians. Stat. Med. 2000, 19, 1141–1164. [Google Scholar] [CrossRef]
- Puth, M.-T.; Neuhäuser, M.; Ruxton, G.D. On the Variety of Methods for Calculating Confidence Intervals by Bootstrapping. J. Anim. Ecol. 2015, 84, 892–897. [Google Scholar] [CrossRef] [PubMed]
- Ophey, A.; Rehberg, S.; Giehl, K.; Eggers, C.; Reker, P.; van Eimeren, T.; Kalbe, E. Predicting Working Memory Training Responsiveness in Parkinson’s Disease: Both “System Hardware” and Room for Improvement Are Needed. Neurorehabil. Neural Repair 2021, 35, 117–130. [Google Scholar] [CrossRef]
- Afshari, M.; Yang, A.; Bega, D. Motivators and Barriers to Exercise in Parkinson’s Disease. J. Park. Dis. 2017, 7, 703–711. [Google Scholar] [CrossRef]
- Schootemeijer, S.; van der Kolk, N.M.; Ellis, T.; Mirelman, A.; Nieuwboer, A.; Nieuwhof, F.; Schwarzschild, M.A.; de Vries, N.M.; Bloem, B.R. Barriers and Motivators to Engage in Exercise for Persons with Parkinson’s Disease. J. Park. Dis. 2020, 10, 1293–1299. [Google Scholar] [CrossRef] [PubMed]
- Reilly, D.; Neumann, D.L.; Andrews, G. Gender Differences in Reading and Writing Achievement: Evidence from the National Assessment of Educational Progress (NAEP). Am. Psychol. 2019, 74, 445–458. [Google Scholar] [CrossRef]
- Yang, Y.; Tam, F.; Graham, S.J.; Sun, G.; Li, J.; Gu, C.; Tao, R.; Wang, N.; Bi, H.-Y.; Zuo, Z. Men and Women Differ in the Neural Basis of Handwriting. Hum. Brain Mapp. 2020, 41, 2642–2655. [Google Scholar] [CrossRef] [PubMed]
- Appleman, E.R.; Albouy, G.; Doyon, J.; Cronin-Golomb, A.; King, B.R. Sleep Quality Influences Subsequent Motor Skill Acquisition. Behav. Neurosci. 2016, 130, 290–297. [Google Scholar] [CrossRef] [PubMed]
- Shine, J.M.; Poldrack, R.A. Principles of Dynamic Network Reconfiguration across Diverse Brain States. NeuroImage 2018, 180, 396–405. [Google Scholar] [CrossRef] [PubMed]
- Titone, S.; Samogin, J.; Peigneux, P.; Swinnen, S.; Mantini, D.; Albouy, G. Connectivity in Large-Scale Resting-State Brain Networks Is Related to Motor Learning: A High-Density EEG Study. Brain Sci. 2022, 12, 530. [Google Scholar] [CrossRef] [PubMed]
- Heitger, M.H.; Ronsse, R.; Dhollander, T.; Dupont, P.; Caeyenberghs, K.; Swinnen, S.P. Motor Learning-Induced Changes in Functional Brain Connectivity as Revealed by Means of Graph-Theoretical Network Analysis. NeuroImage 2012, 61, 633–650. [Google Scholar] [CrossRef] [PubMed]
- Pauwels, L.; Chalavi, S.; Gooijers, J.; Maes, C.; Albouy, G.; Sunaert, S.; Swinnen, S.P. Challenge to Promote Change: The Neural Basis of the Contextual Interference Effect in Young and Older Adults. J. Neurosci. 2018, 38, 3333–3345. [Google Scholar] [CrossRef] [PubMed]
- Lövdén, M.; Brehmer, Y.; Li, S.-C.; Lindenberger, U. Training-Induced Compensation versus Magnification of Individual Differences in Memory Performance. Front. Hum. Neurosci. 2012, 6, 141. [Google Scholar] [CrossRef]
- Chung, Y.-C.; Fisher, B.E.; Finley, J.M.; Kim, A.; Petkus, A.J.; Schiehser, D.M.; Jakowec, M.W.; Petzinger, G.M. Cognition and Motor Learning in a Parkinson’s Disease Cohort: Importance of Recall in Episodic Memory. NeuroReport 2021, 32, 1153. [Google Scholar] [CrossRef]
- Aarsland, D.; Kurz, M.W. The Epidemiology of Dementia Associated with Parkinson Disease. J. Neurol. Sci. 2010, 289, 18–22. [Google Scholar] [CrossRef] [PubMed]
- Muslimović, D.; Post, B.; Speelman, J.D.; Schmand, B. Cognitive Profile of Patients with Newly Diagnosed Parkinson Disease. Neurology 2005, 65, 1239–1245. [Google Scholar] [CrossRef] [PubMed]
- Abraham, A.; Pedregosa, F.; Eickenberg, M.; Gervais, P.; Mueller, A.; Kossaifi, J.; Gramfort, A.; Thirion, B.; Varoquaux, G. Machine learning for neuroimaging with scikit-learn. Front. Neurosci. 2014, 8, 14. [Google Scholar] [CrossRef] [PubMed]
- Avants, B.; Epstein, C.; Grossman, M.; Gee, J. Symmetric diffeomorphic image registration with cross-correlation: Evaluating automated labeling of elderly and neurodegenerative brain. Med Image Anal. 2008, 12, 26–41. [Google Scholar] [CrossRef] [PubMed]
- Behzadi, Y.; Restom, K.; Liau, J.; Liu, T.T. A component based noise correction method (CompCor) for BOLD and perfusion based fMRI. NeuroImage 2007, 37, 90–101. [Google Scholar] [CrossRef] [PubMed]
- Cox, R.W.; Hyde, J.S. Software Tools for Analysis and Visualization of fMRI Data. NMR Biomed. 1997, 10, 171–178. [Google Scholar] [CrossRef]
- Dale, A.M.; Fischl, B.; Sereno, M.I. Cortical surface-based analysis. I. Segmentation and surface reconstruction. NeuroImage 1999, 9, 179–194. [Google Scholar] [CrossRef]
- Esteban, O.; Blair, R.; Markiewicz, C.J.; Berleant, S.L.; Moodie, C.; Ma, F.; Isik, A.I.; Erramuzpe, A.; Kent, J.D.; Goncalves, M.; et al. FMRIPrep. Software. Zenodo. 2018. Available online: https://doi.org/10.5281/zenodo.852659 (accessed on 15 February 2020).
- Evans, A.C.; Janke, A.L.; Collins, D.L.; Baillet, S. Brain templates and atlases. NeuroImage 2012, 62, 911–922. [Google Scholar] [CrossRef] [PubMed]
- Fonov, V.; Evans, A.; McKinstry, R.; Almli, C.; Collins, D. Unbiased nonlinear average age-appropriate brain templates from birth to adulthood. NeuroImage 2009, 47, S102. [Google Scholar] [CrossRef]
- Glasser, M.F.; Sotiropoulos, S.N.; Wilson, J.A.; Coalson, T.S.; Fischl, B.; Andersson, J.L.; Xu, J.; Jbabdi, S.; Webster, M.; Polimeni, J.R.; et al. The minimal preprocessing pipelines for the Human Connectome Project. NeuroImage 2013, 80, 105–124. [Google Scholar] [CrossRef]
- Gorgolewski, K.J.; Esteban, O.; Markiewicz, C.J.; Ziegler, E.; Ellis, D.G.; Notter, M.P.; Jarecka, D.; Johnson, H.; Burns, C.; Manhães-Savio, A.; et al. Nipype. Software. Zenodo. 2018. Available online: https://doi.org/10.5281/zenodo.596855 (accessed on 15 February 2020).
- Greve, D.N.; Fischl, B. Accurate and robust brain image alignment using boundary-based registration. NeuroImage 2009, 48, 63–72. [Google Scholar] [CrossRef] [PubMed]
- Jenkinsona, M.; Bannisterab, P.; Bradyb, M.; Smitha, S. Improved Optimization for the Robust and Accurate Linear Registration and Motion Correction of Brain Images. NeuroImage 2002, 17, 825–841. [Google Scholar] [CrossRef]
- Klein, A.; Ghosh, S.S.; Bao, F.S.; Giard, J.; Häme, Y.; Stavsky, E.; Lee, N.; Rossa, B.; Reuter, M.; Neto, E.C.; et al. Mindboggling morphometry of human brains. PLoS Comput. Biol. 2017, 13, e1005350. [Google Scholar] [CrossRef] [PubMed]
- Lanczos, C. Evaluation of Noisy Data. J. Soc. Ind. Appl. Math. Ser. B Numer. Anal. 1964, 1, 76–85. [Google Scholar] [CrossRef]
- Power, J.D.; Mitra, A.; Laumann, T.O.; Snyder, A.Z.; Schlaggar, B.L.; Petersen, S.E. Methods to detect, characterize, and remove motion artifact in resting state fMRI. NeuroImage 2014, 84, 320–341. [Google Scholar] [CrossRef] [PubMed]
- Pruim, R.H.R.; Mennes, M.; van Rooij, D.; Llera, A.; Buitelaar, J.K.; Beckmann, C.F. ICA-AROMA: A robust ICA-based strategy for removing motion artifacts from fMRI data. NeuroImage 2015, 112, 267–277. [Google Scholar] [CrossRef] [PubMed]
- Tustison, N.J.; Avants, B.B.; A Cook, P.; Zheng, Y.; Egan, A.; A Yushkevich, P.; Gee, J.C. N4ITK: Improved N3 Bias Correction. IEEE Trans. Med. Imaging 2010, 29, 1310–1320. [Google Scholar] [CrossRef] [PubMed]
- Zhang, Y.; Brady, M.; Smith, S. Segmentation of brain MR images through a hidden Markov random field model and the expectation-maximization algorithm. IEEE Trans. Med. Imaging 2001, 20, 45–57. [Google Scholar] [CrossRef]


| Measure (Units) | Mean (SD) | Range |
|---|---|---|
| Age (years) | 63.93 ± 8.58 | 46–78 |
| Sex (M/F) | 17/11 | |
| EHI (%) | 100 (80; 100) | 7.7–100 |
| H&Y (1–5) | 2 (2; 2) | 1–4 |
| Disease duration (years) | 6.89 ± 3.93 | 1–17 |
| FOG presence (Yes/No) | 13/15 | |
| LEDD (mg/24 h) | 641.5 ± 288.47 | 126–1417.5 |
| MDS-UPDRS-III (0–132) | 31.14 ± 15.07 | 6–63 |
| Sleep complaints (0–8) | 3.71 ± 1.71 | 0–7 |
| Purdue Pegboard Right | 8.64 ± 2.71 | 3–14 |
| MMSE (0–30) | 29 (28; 29) | 25–30 |
| MoCA (0–30) | 26.54 ± 1.73 | 22–29 |
| HADS-anxiety (0–21) | 6.32 ± 4.16 | 0–14 |
| HADS-depression (0–21) | 5.29 ± 3.21 | 0–13 |
| Acquisition (Pre to Post-Training) | Retention (Post-Training to Follow-Up) | Overall Learning (Pre-Training to Follow-Up) | ||||||||||
|---|---|---|---|---|---|---|---|---|---|---|---|---|
| R | p | BCa 95%CI | R | p | BCa 95%CI | R | p | BCa 95%CI | ||||
| Lower | Upper | Lower | Upper | Lower | Upper | |||||||
| Clinical measures | ||||||||||||
| Age | 0.00 | 0.985 | −0.45 | 0.55 | −0.16 | 0.433 | −0.55 | 0.27 | −0.10 | 0.611 | −0.45 | 0.30 |
| Female sex | 0.43 | 0.024 | 0.10 | 0.69 | −0.02 | 0.935 | −0.40 | 0.26 | 0.51 | 0.007 | 0.20 | 0.74 |
| LEDD | 0.13 | 0.523 | −0.23 | 0.47 | −0.18 | 0.377 | −0.61 | 0.20 | 0.03 | 0.868 | −0.39 | 0.59 |
| Non-freezer | 0.26 | 0.183 | −0.15 | 0.61 | 0.19 | 0.351 | −0.26 | 0.51 | 0.44 | 0.021 | 0.06 | 0.74 |
| Disease duration | −0.02 | 0.930 | −0.43 | 0.40 | −0.26 | 0.195 | −0.53 | −0.01 | −0.20 | 0.326 | −0.60 | 0.22 |
| MDS-UPDRS III | −0.45 | 0.020 | −0.82 | 0.23 | 0.02 | 0.923 | −0.39 | 0.40 | −0.52 | 0.005 | −0.79 | −0.08 |
| Sleep complaints | 0.23 | 0.245 | −0.28 | 0.59 | −0.40 | 0.038 | −0.72 | 0.18 | 0.00 | 0.982 | −0.45 | 0.39 |
| MoCA | 0.13 | 0.525 | −0.25 | 0.55 | −0.02 | 0.912 | −0.23 | 0.14 | 0.14 | 0.493 | −0.28 | 0.56 |
| HADS-anxiety | 0.04 | 0.841 | −0.48 | 0.52 | −0.09 | 0.640 | −0.47 | 0.32 | −0.02 | 0.939 | −0.52 | 0.46 |
| HADS-depression | −0.06 | 0.782 | −0.40 | 0.35 | −0.08 | 0.678 | −0.35 | 0.23 | −0.12 | 0.539 | −0.48 | 0.26 |
| Purdue Unimanual Right | 0.21 | 0.306 | −0.20 | 0.48 | 0.10 | 0.628 | −0.47 | 0.55 | 0.31 | 0.114 | 0.02 | 0.56 |
| Network Segregation | ||||||||||||
| Primary visual | 0.00 | 0.986 | −0.52 | 0.51 | 0.13 | 0.523 | −0.35 | 0.45 | 0.08 | 0.680 | −0.42 | 0.53 |
| Secondary visual | 0.01 | 0.964 | −0.47 | 0.35 | −0.06 | 0.755 | −0.41 | 0.32 | −0.03 | 0.875 | −0.41 | 0.29 |
| Sensorimotor | 0.31 | 0.111 | −0.08 | 0.60 | 0.28 | 0.156 | −0.11 | 0.62 | 0.57 | 0.002 | 0.29 | 0.78 |
| Cingulo-opercular | −0.16 | 0.423 | −0.47 | 0.18 | 0.15 | 0.449 | −0.22 | 0.51 | −0.09 | 0.658 | −0.39 | 0.23 |
| Dorsal attention | 0.27 | 0.178 | −0.11 | 0.58 | −0.09 | 0.660 | −0.29 | 0.16 | 0.26 | 0.191 | −0.15 | 0.55 |
| Language | −0.20 | 0.306 | −0.49 | 0.18 | 0.02 | 0.910 | −0.26 | 0.37 | −0.23 | 0.249 | −0.49 | 0.12 |
| Frontoparietal | −0.06 | 0.752 | −0.49 | 0.26 | 0.11 | 0.579 | −0.25 | 0.44 | 0.00 | 0.998 | −0.46 | 0.40 |
| Auditory | 0.23 | 0.252 | −0.22 | 0.56 | −0.10 | 0.607 | −0.50 | 0.41 | 0.20 | 0.310 | −0.21 | 0.50 |
| Default | 0.00 | 0.988 | −0.37 | 0.39 | 0.09 | 0.651 | −0.20 | 0.36 | 0.06 | 0.772 | −0.32 | 0.48 |
| Posterior multimodal | 0.16 | 0.423 | −0.12 | 0.41 | −0.18 | 0.369 | −0.48 | 0.08 | 0.07 | 0.727 | −0.33 | 0.43 |
| Ventral multimodal | −0.24 | 0.236 | −0.52 | 0.26 | 0.24 | 0.230 | −0.33 | 0.57 | −0.12 | 0.550 | −0.46 | 0.37 |
| Orbito-affective | −0.11 | 0.576 | −0.49 | 0.24 | −0.14 | 0.500 | −0.51 | 0.42 | −0.23 | 0.254 | −0.59 | 0.15 |
Disclaimer/Publisher’s Note: The statements, opinions and data contained in all publications are solely those of the individual author(s) and contributor(s) and not of MDPI and/or the editor(s). MDPI and/or the editor(s) disclaim responsibility for any injury to people or property resulting from any ideas, methods, instructions or products referred to in the content. |
© 2024 by the authors. Licensee MDPI, Basel, Switzerland. This article is an open access article distributed under the terms and conditions of the Creative Commons Attribution (CC BY) license (https://creativecommons.org/licenses/by/4.0/).
Share and Cite
D’Cruz, N.; De Vleeschhauwer, J.; Putzolu, M.; Nackaerts, E.; Gilat, M.; Nieuwboer, A. Sensorimotor Network Segregation Predicts Long-Term Learning of Writing Skills in Parkinson’s Disease. Brain Sci. 2024, 14, 376. https://doi.org/10.3390/brainsci14040376
D’Cruz N, De Vleeschhauwer J, Putzolu M, Nackaerts E, Gilat M, Nieuwboer A. Sensorimotor Network Segregation Predicts Long-Term Learning of Writing Skills in Parkinson’s Disease. Brain Sciences. 2024; 14(4):376. https://doi.org/10.3390/brainsci14040376
Chicago/Turabian StyleD’Cruz, Nicholas, Joni De Vleeschhauwer, Martina Putzolu, Evelien Nackaerts, Moran Gilat, and Alice Nieuwboer. 2024. "Sensorimotor Network Segregation Predicts Long-Term Learning of Writing Skills in Parkinson’s Disease" Brain Sciences 14, no. 4: 376. https://doi.org/10.3390/brainsci14040376