

Normative Values of Brainstem Auditory-Evoked Responses in Sheep

 , , , , , and
Abstract
1. Introduction
2. Methods
2.1. Animal Enrollment
2.2. BAER Assessments
3. Results
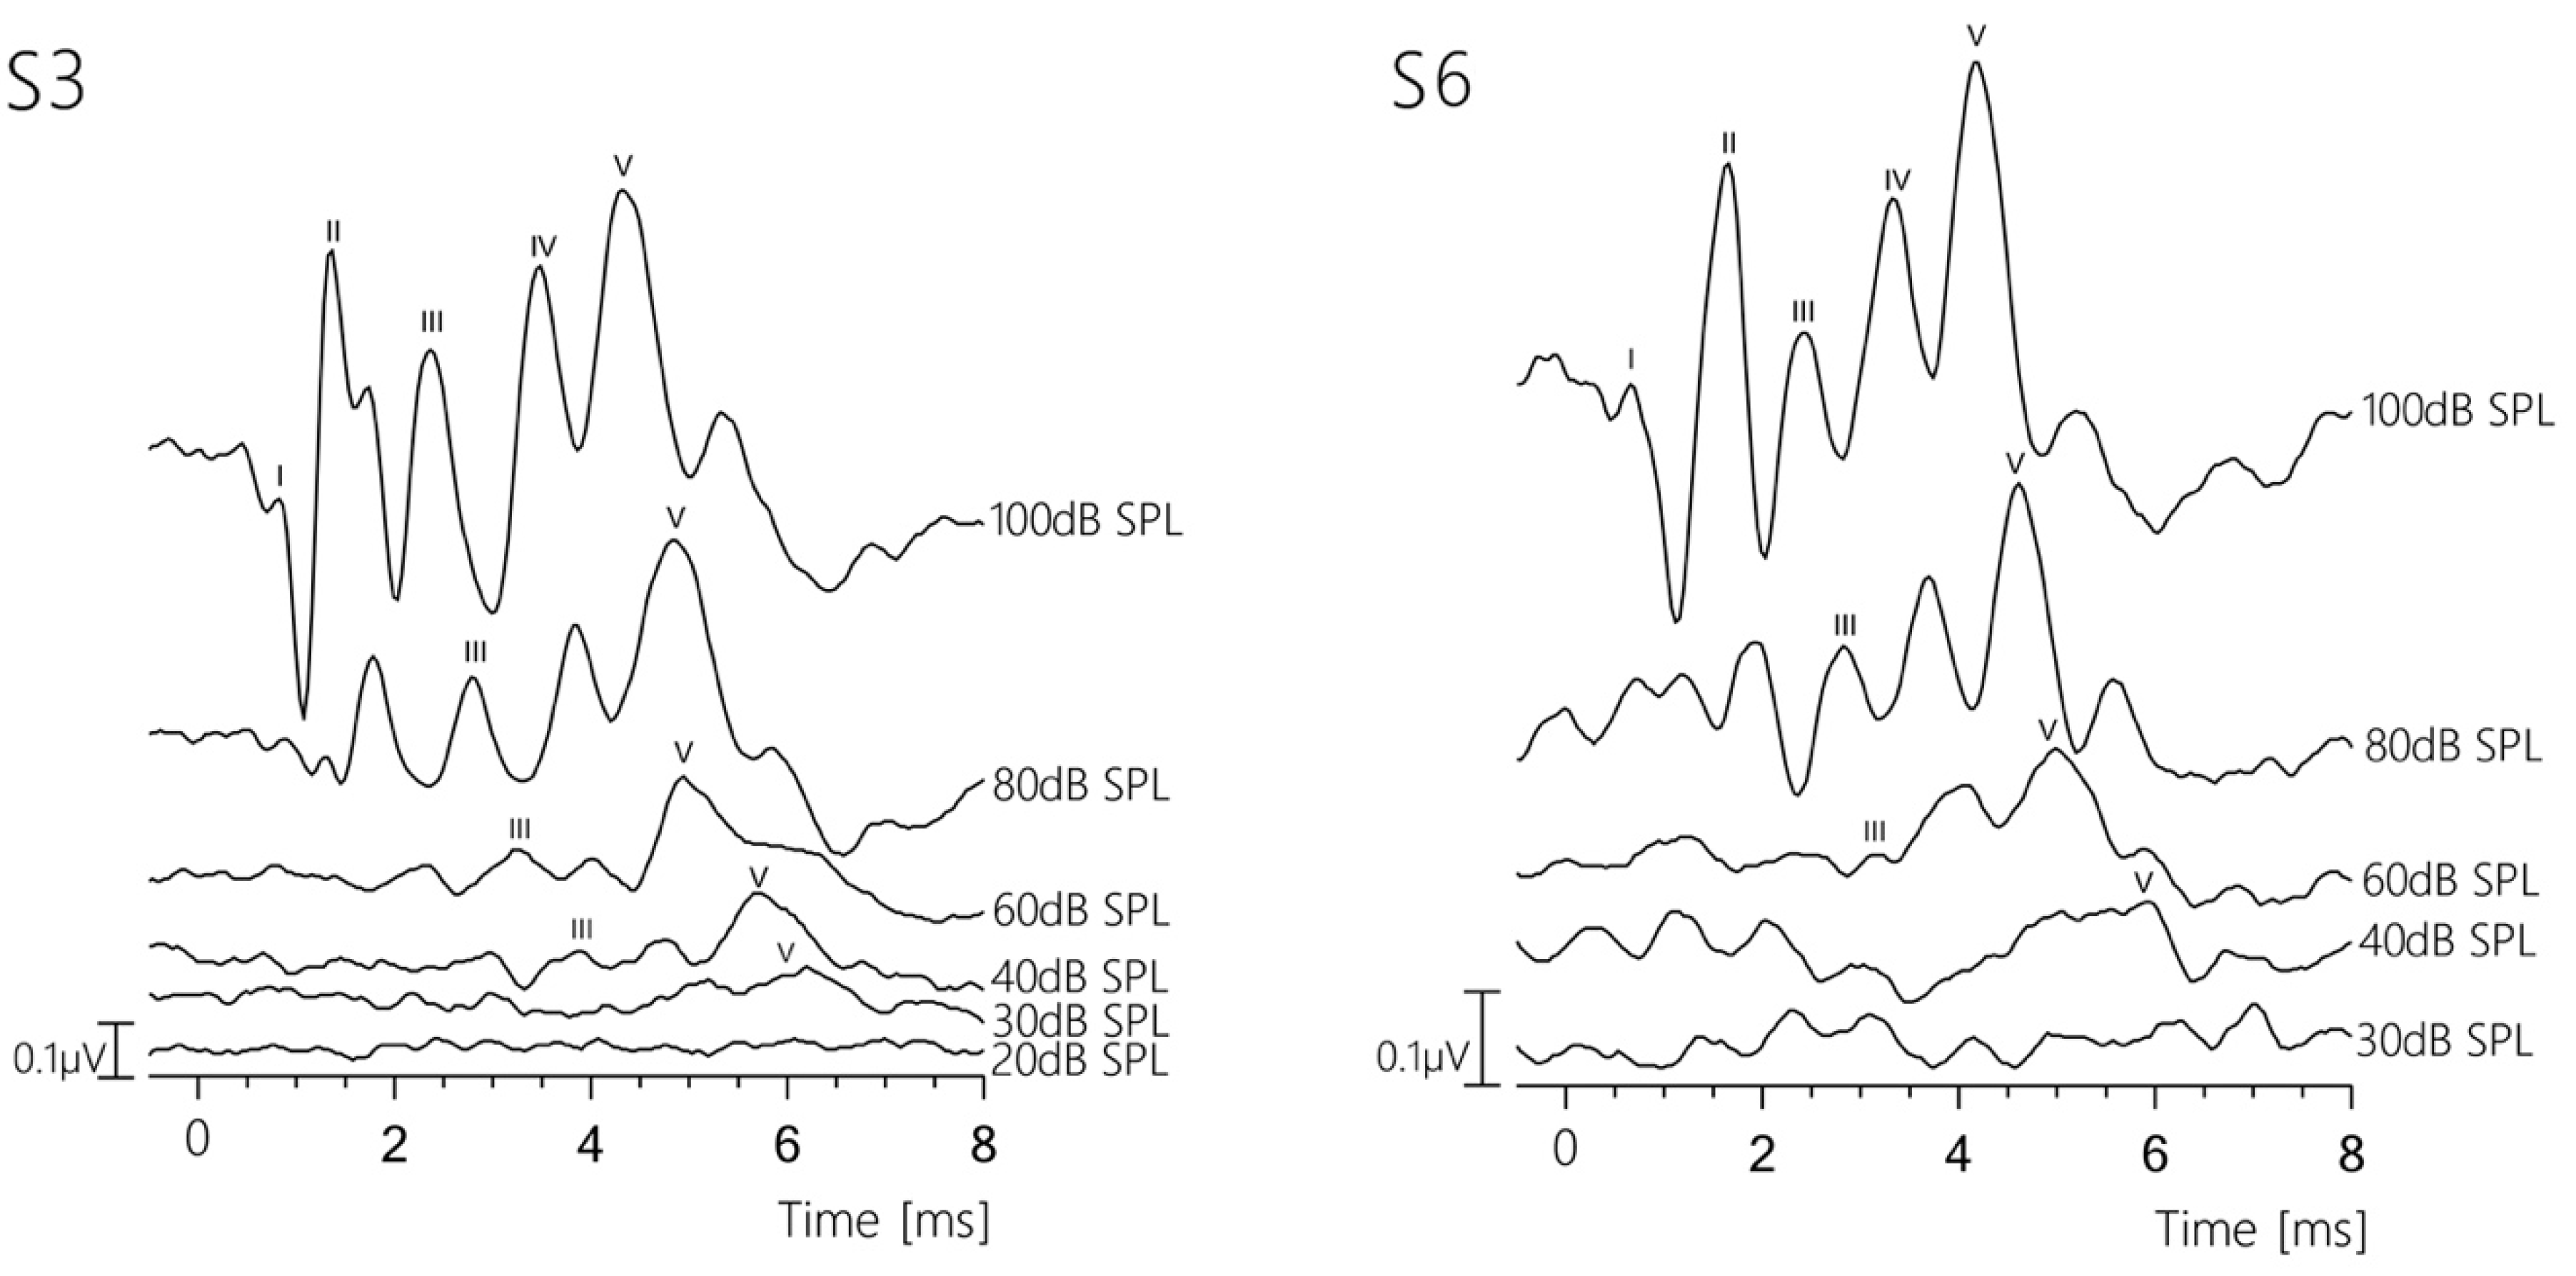
3.1. Sample Data
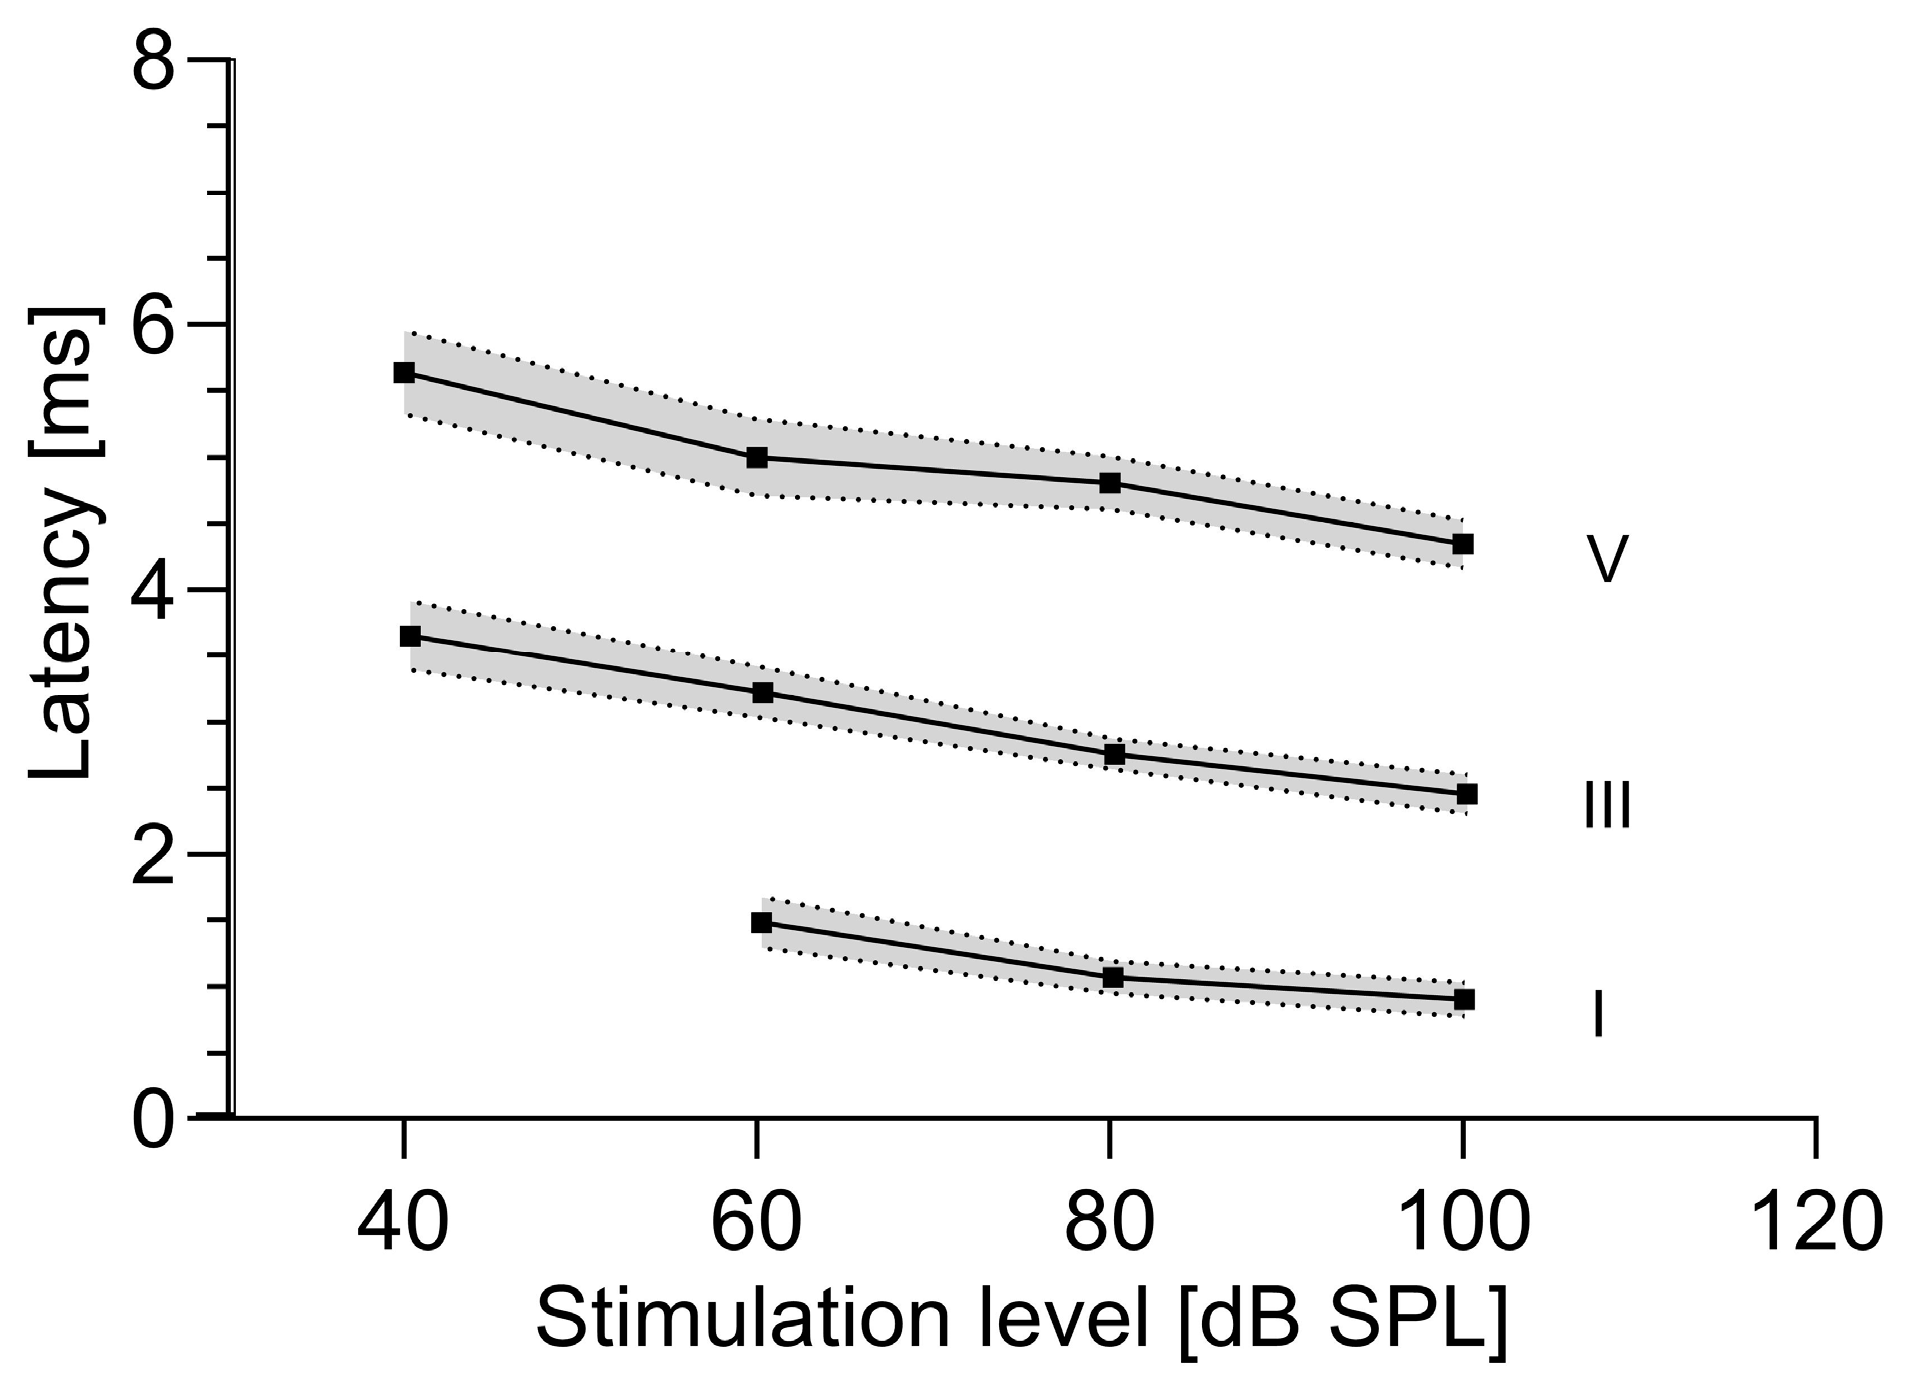
3.2. Absolute Latencies
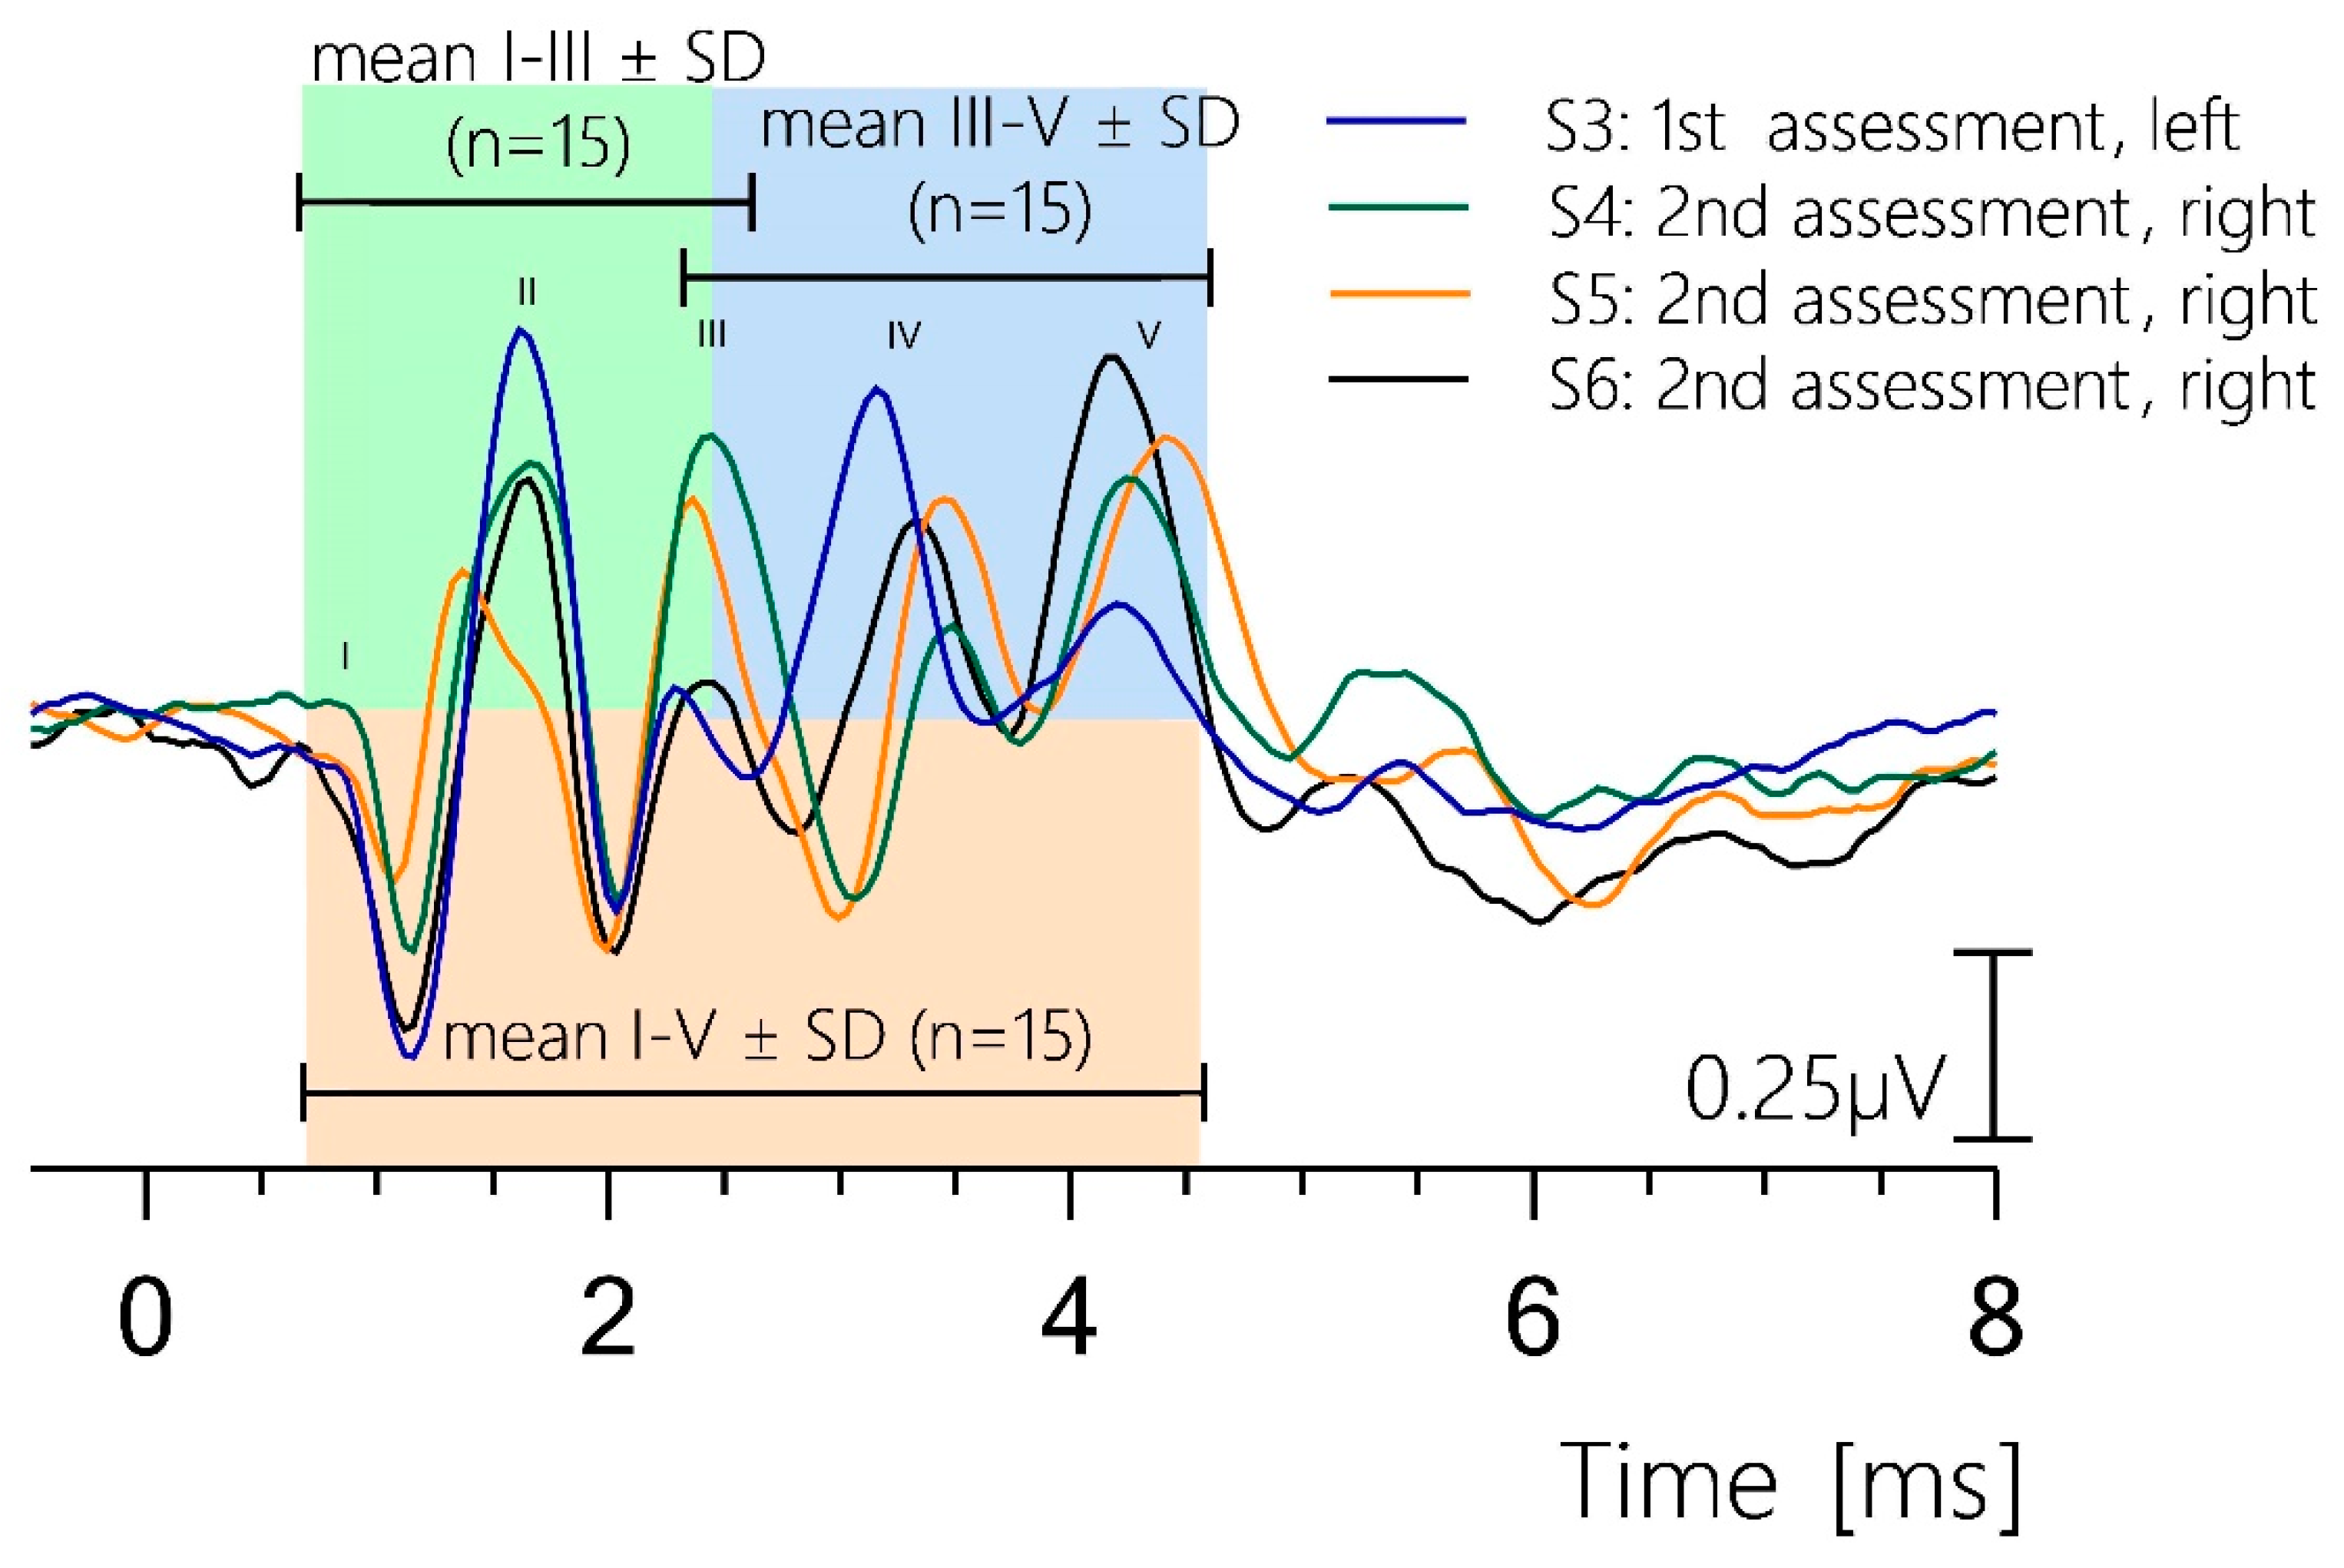
3.3. Interpeak Latencies
3.4. Peak-to-Trough Amplitudes
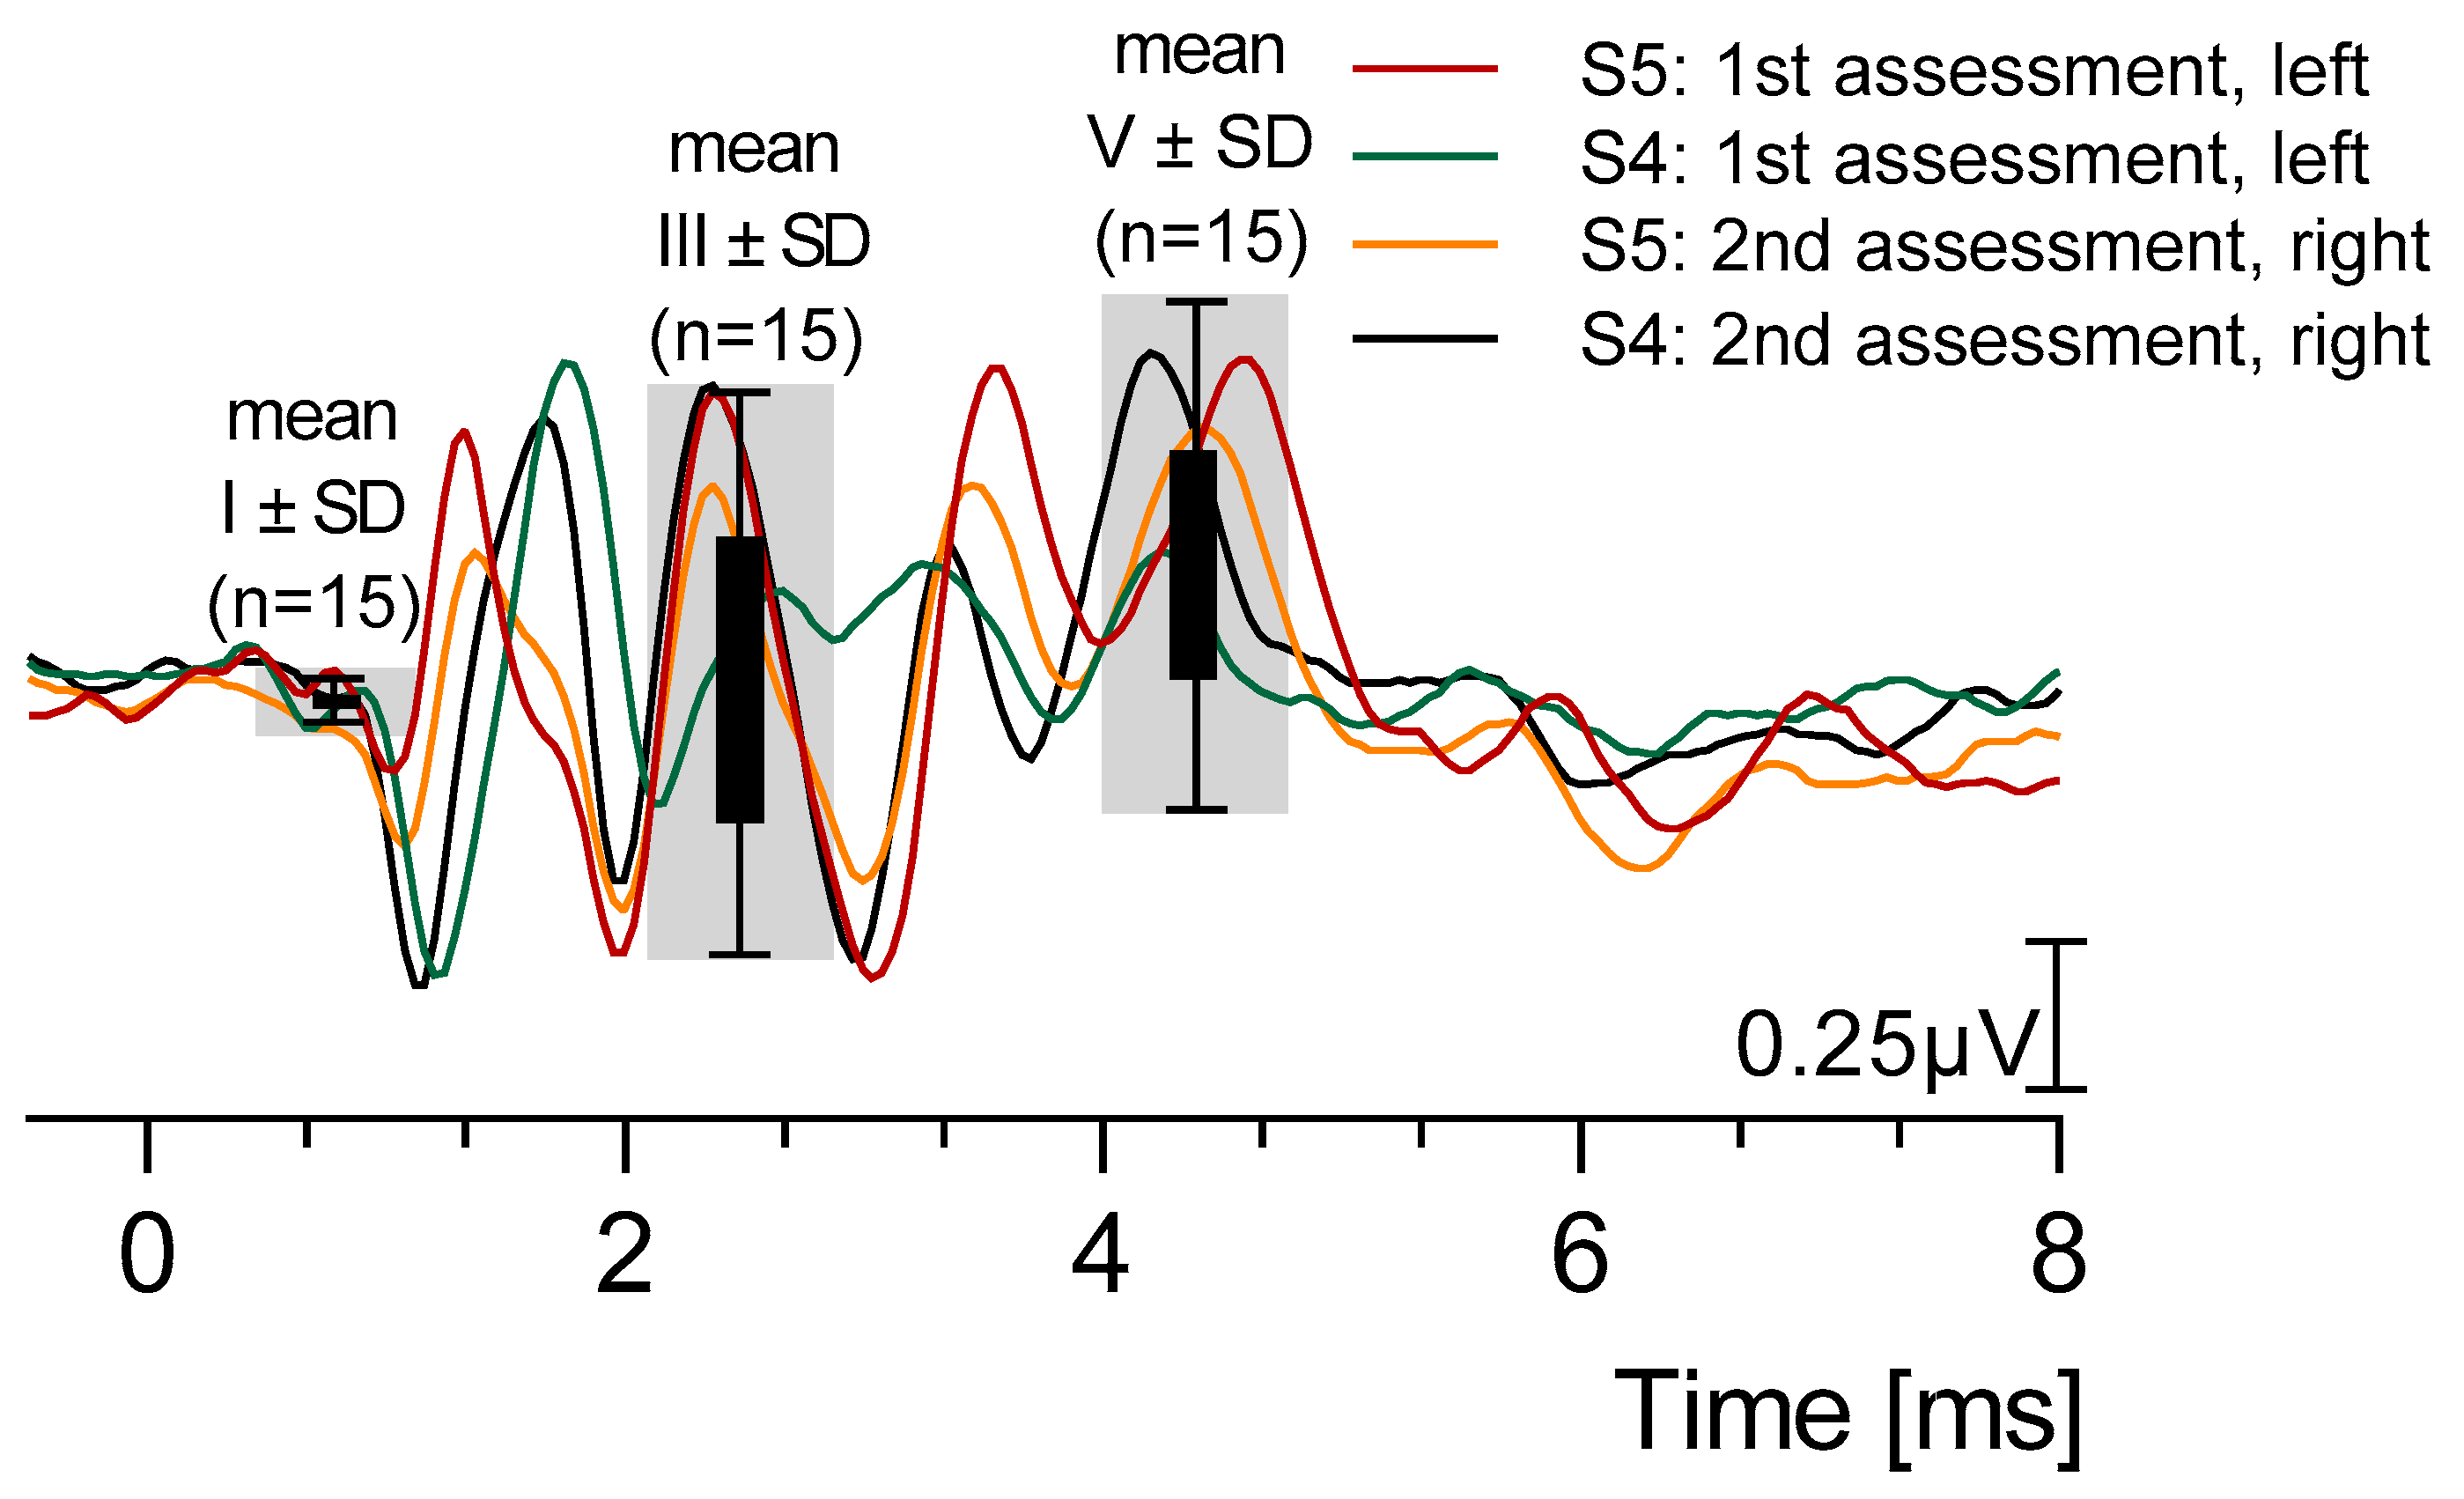
3.5. Reproducibility
4. Discussion
5. Conclusions
Author Contributions
Funding
Institutional Review Board Statement
Informed Consent Statement
Data Availability Statement
Conflicts of Interest
References
- Moore, J.K. The human auditory brain stem as a generator of auditory evoked potentials. Hear. Res. 1987, 29, 33–43. [Google Scholar] [CrossRef] [PubMed]
- Seibel, V.A.; Lavinsky, L.; De Oliveira, J.A. Morphometric study of the external and middle ear anatomy in sheep: A possible model for ear experiments. Clin. Anat. 2006, 19, 503–509. [Google Scholar] [CrossRef]
- Lue, P.Y.; Oliver, M.H.; Neeff, M.; Thorne, P.R.; Suzuki-Kerr, H. Sheep as a large animal model for hearing research: Comparison to common laboratory animals and humans. Lab. Anim. Res. 2023, 39, 31. [Google Scholar] [CrossRef]
- Peus, D.; Dobrev, I.; Prochazka, L.; Thoele, K.; Dalbert, A.; Boss, A.; Newcomb, N.; Probst, R.; Röösli, C.; Pfiffner, F. Sheep as a large animal ear model: Middle-ear ossicular velocities and intracochlear sound pressure. Hear. Res. 2017, 351, 88–97. [Google Scholar] [CrossRef] [PubMed]
- Han, S.; Suzuki-Kerr, H.; Suwantika, M.; Telang, R.; Gerneke, D.A.; Anekal, P.V.; Bird, P.; Vlajkovic, S.M.; Thorne, P.R. Characterization of the Sheep Round Window Membrane. J. Assoc. Res. Otolaryngol. 2021, 22, 1–17. [Google Scholar] [CrossRef]
- Trinh, T.T.; Cohen, C.; Boullaud, L.; Cottier, J.; Bakhos, D. Sheep as a large animal model for cochlear implantation. Braz. J. Otorhinolaryngol. 2022, 88, S24–S32. [Google Scholar] [CrossRef]
- Waring, N.A.; Chern, A.; Vilarello, B.J.; Lang, J.H.; Olson, E.S.; Nakajima, H.H. Sheep as a Large-Animal Model for Otology Research: Temporal Bone Extraction and Transmastoid Facial Recess Surgical Approach. J. Assoc. Res. Otolaryngol. 2023, 24, 487–497. [Google Scholar] [CrossRef] [PubMed]
- Mantokoudis, G.; Huth, M.E.; Weisstanner, C.; Friedrich, H.M.; Nauer, C.; Candreia, C.; Caversaccio, M.D.; Senn, P. Lamb Temporal Bone as a Surgical Training Model of Round Window Cochlear Implant Electrode Insertion. Otol. Neurotol. 2016, 37, 52–56. [Google Scholar] [CrossRef] [PubMed]
- Anschuetz, L.; Bonali, M.; Ghirelli, M.; Mattioli, F.; Villari, D.; Caversaccio, M.; Presutti, L. An Ovine Model for Exclusive Endoscopic Ear Surgery. JAMA Otolaryngol. Head Neck Surg. 2017, 143, 247–252. [Google Scholar] [CrossRef]
- Miller, F.; Burghard, A.; Salcher, R.; Scheper, V.; Leibold, W.; Lenarz, T.; Paasche, G. Treatment of middle ear ventilation disorders: Sheep as animal model for stenting the human Eustachian tube—A cadaver study. PLoS ONE 2014, 9, e113906. [Google Scholar] [CrossRef] [PubMed]
- Kerneis, S.; Escoffre, J.-M.; Galvin, J.J.; Bouakaz, A.; Presset, A.; Alix, C.; Oujagir, E.; Lefèvre, A.; Emond, P.; Blasco, H.; et al. Sonoporation of the Round Window Membrane on a Sheep Model: A Safety Study. Pharmaceutics 2023, 15, 442. [Google Scholar] [CrossRef] [PubMed]
- Pfiffner, F.; Prochazka, L.; Dobrev, I.; Klein, K.; Sulser, P.; Péus, D.; Sim, J.H.; Dalbert, A.; Röösli, C.; Obrist, D.; et al. Proof of Concept for an Intracochlear Acoustic Receiver for Use in Acute Large Animal Experiments. Sensors 2018, 18, 3565. [Google Scholar] [CrossRef]
- Kaufmann, C.R.; Tejani, V.D.; Fredericks, D.C.; Henslee, A.M.; Sun, D.Q.; Abbas, P.J.; Hansen, M.R. Pilot Evaluation of Sheep as In Vivo Model for Cochlear Implantation. Otol. Neurotol. 2020, 41, 596–604. [Google Scholar] [CrossRef] [PubMed]
- Quinonez, R.E.; Widness, J.A. Increased wave latency in auditory brainstem response to anemia in newborn and adult sheep. Neonatology 2003, 84, 179–186. [Google Scholar] [CrossRef]
- Konold, T.; Phelan, L.J.; Cawthraw, S.; Simmons, M.M.; Chaplin, M.J.; González, L. Abnormalities in Brainstem Auditory Evoked Potentials in Sheep with Transmissible Spongiform Encephalopathies and Lack of a Clear Pathological Relationship. Front. Vet. Sci. 2016, 3, 60. [Google Scholar] [CrossRef]
- Griffiths, S.K.; Pierson, L.L.; Gerhardt, K.J.; Abrams, R.M.; Peters, A.J. Auditory brainstem response in sheep. Part II: Postnatal development. Dev. Psychobiol. 1996, 29, 53–68. [Google Scholar] [CrossRef]
- Norrix, L.W.; DeYoung, D.W.; Krausman, P.R.; Etchberger, R.C.; Glattke, T.J. Conductive hearing loss in bighorn sheep. J. Wildl. Dis. 1995, 31, 223–227. [Google Scholar] [CrossRef] [PubMed]
- Deyoung, D.W.; Krausman, P.R.; Weiland, L.E.; Etchberger, R.C. Baseline auditory brain stem responses in mountain sheep and desert mule deer. In Proceedings of the Sixth International Congress on Noise as a Public Health Problem, Nice, France, 5–9 July 1993; Volume 6, pp. 251–254. [Google Scholar]
- Hill, M.W.; Heavens, R.P.; Baldwin, B.A. Auditory evoked potentials recorded from conscious sheep. Brain Res. Bull. 1985, 15, 453–458. [Google Scholar] [CrossRef]
- Wilson, W.J.; Mills, P.C. Brainstem auditory-evoked response in dogs. Am. J. Vet. Res. 2005, 66, 2177–2187. [Google Scholar] [CrossRef]
- Pierson, L.L.; Gerhardt, K.J.; Griffiths, S.K.; Abrams, R.M. Auditory brainstem response in sheep. Part I: Fetal development. Dev. Psychobiol. 1995, 28, 293–305. [Google Scholar] [CrossRef] [PubMed]
- Wollack, C.H. The Auditory Acuity of the Sheep (Ovisaries); Princeton University: Princeton, NJ, USA, 1963. [Google Scholar]
- Ames, D.R.; Arehart, L.A. Physiological Response of Lambs to Auditory Stimuli. J. Anim. Sci. 1972, 34, 994–998. [Google Scholar] [CrossRef] [PubMed]
- Strain, G.M.; Olcott, B.M.; Braun, W.F. Electroencephalogram and Evoked-Potentials in Naturally-Occurring Scrapie in Sheep. Am. J. Vet. Res. 1986, 47, 828–836. [Google Scholar]
- Gerhardt, K.J.; Huang, X.; Arrington, K.E.; Meixner, K.; Abrams, R.M.; Antonelli, P.J. Fetal sheep in utero hear through bone conduction. Am. J. Otolaryngol. 1996, 17, 374–379. [Google Scholar] [CrossRef] [PubMed]
- Kay, R.; Palmer, A.C.; Taylor, P.M. Hearing in the dog as assessed by auditory brainstem evoked potentials. Vet. Rec. 1984, 114, 81–84. [Google Scholar] [CrossRef] [PubMed]
- Poncelet, L.; Coppens, A.; Deltenre, P. Brainstem auditory evoked potential wave V latency-intensity function in normal Dalmatian and Beagle puppies. J. Vet. Intern. Med. 2000, 14, 424–428. [Google Scholar]
- Strain, G.M.; Tedford, B.L.; Jackson, R.M. Postnatal-Development of the Brain-Stem Auditory-Evoked Potential in Dogs. Am. J. Vet. Res. 1991, 52, 410–415. [Google Scholar] [CrossRef] [PubMed]
- Meij, B.P.; Venker-van Haagen, A.J.; van den Brom, W.E. Relationship between latency of brainstem auditory-evoked potentials and head size in dogs. Vet. Q. 1992, 14, 121–126. [Google Scholar] [CrossRef] [PubMed]
- Munro, K.J.; Shiu, J.N.; Cox, C.L. The effect of head size on the auditory brainstem response for two breeds of dog. Br. J. Audiol. 1997, 31, 309–314. [Google Scholar] [CrossRef]
- Maurer, K.; Leitner, H.; Schäfer, E.; Hopf, H.C. Early auditory evoked potentials, triggered by a sine-wave stimulus (author’s transl). Dtsch. Med. Wochenschr. 1979, 104, 546–550. [Google Scholar] [CrossRef] [PubMed]
- Hood, L.J. Clinical Applications of the Auditory Brainstem Response; Singular Publishing Group: San Diego, CA, USA, 1998. [Google Scholar]


| Sheep No. | BAER Recorded Ear [Left/Right/Bilateral] | Included Recordings [n] | Time Between Assessments [Days] | ||
|---|---|---|---|---|---|
| First Assessment | Second Assessment | Third Assessment | |||
| S1 * | right | right | right | 3 | 3/4 * |
| S2 | right | n/a | n/a | 1 | n/a |
| S3 | bilateral | right | n/a | 3 | 65 |
| S4 | bilateral | right | n/a | 3 | 64 |
| S5 | bilateral | right | n/a | 3 | 64 |
| S6 | left | right | n/a | 2 | 63 |
| total | 9 (right: 5/left: 4) | 5 | 1 | N = 15 | |
| Intensity [dB SPL] | Number of BAERs | Mean Latency (and Standard Deviation) [ms] | ||||
|---|---|---|---|---|---|---|
| Wave I | Wave II | Wave III | Wave IV | Wave V | ||
| 100 | 15 | 0.88 (0.13) | 1.62 (0.15) | 2.44 (0.15) | 3.36 (0.15) | 4.35 (0.18) |
| 80 | 15 | 1.04 (0.13) | 1.85 (0.13) | 2.74 (0.12) | 3.74 (0.15) | 4.80 (0.20) |
| 60 | 15 | 1.45 (0.19) | 2.40 (0.13) | 3.21 (0.19) | 4.02 (0.22) | 5.00 (0.29) |
| 40 | 0/2/8/8/11 | n.i. | 2.95 (0.06) | 3.65 (0.26) | 4.50 (0.18) | 5.64 (0.31) |
| Sound Pressure Level [dB SPL] | Number of BAERs | Mean Interpeak Latency [ms] and SD | ||
|---|---|---|---|---|
| I–III (±SD) | III–V (±SD) | I–V (±SD) | ||
| 100 | 15 | 1.56 (0.18) | 1.91 (0.16) | 3.47 (0.20) |
| 80 | 15 | 1.70 (0.10) | 2.06 (0.19) | 3.76 (0.26) |
| 60 | 15 | 1.76 (0.20) | 1.79 (0.20) | 3.54 (0.30) |
| Sound Pressure Level [dB SPL] | Subjects [n] | Mean Amplitude [µV] + SD | |||||||||
|---|---|---|---|---|---|---|---|---|---|---|---|
| I | ±SD | II | ±SD | III | ±SD | IV | ±SD | V | ±SD | ||
| 100 | 15 | 0.04 | 0.03 | 0.84 | 0.46 | 0.50 | 0.24 | 0.63 | 0.28 | 0.40 | 0.25 |
| 80 | 15 | 0.04 | 0.02 | 0.19 | 0.13 | 0.23 | 0.15 | 0.29 | 0.15 | 0.22 | 0.14 |
| 60 | 15 | 0.03 | 0.02 | 0.05 | 0.06 | 0.07 | 0.03 | 0.09 | 0.06 | 0.16 | 0.09 |
| 40 | 0/2/8/8/11 | n.i. | n.i. | 0.08 | 0.08 | 0.06 | 0.02 | 0.07 | 0.03 | 0.10 | 0.05 |
| Latency | Subjects [n] | Mean Difference [ms] ± SD | |
|---|---|---|---|
| Mean [ms] | ±SD | ||
| I–III | 5 | 0.29 | 0.18 |
| III–V | 5 | 0.13 | 0.10 |
| I–V | 5 | 0.29 | 0.17 |
| I | 5 | 0.18 | 0.11 |
| III | 5 | 0.12 | 0.10 |
| V | 5 | 0.16 | 0.12 |
| Stimulation Level | Subject | Mean Latency (and Standard Deviation) and Interpeak Latency in [ms] | |||||
|---|---|---|---|---|---|---|---|
| Wave I (ms) | Wave III (ms) | Wave V (ms) | Wave I–III (ms) | III–V (ms) | I–V (ms) | ||
| 80 dB SPL | Sheep | 1.04 (0.13) | 2.74 (0.12) | 4.80 (0.20) | 1.70 (0.10) | 2.06 (0.19) | 3.76 (0.26) |
| 70 dB HL | Human [31] | 1.56 (0.12) | 3.83 (0.2) | 5.76 (0.22) | 2.27 | 1.93 | 4.20 |
| 80 dBnHL | Human [32] | 1.37–1.93 | 3.44–4.16 | 5.18–6.10 | 1.87–2.43 | 1.56–2.12 | 3.59–4.39 |
Disclaimer/Publisher’s Note: The statements, opinions and data contained in all publications are solely those of the individual author(s) and contributor(s) and not of MDPI and/or the editor(s). MDPI and/or the editor(s) disclaim responsibility for any injury to people or property resulting from any ideas, methods, instructions or products referred to in the content. |
© 2025 by the authors. Licensee MDPI, Basel, Switzerland. This article is an open access article distributed under the terms and conditions of the Creative Commons Attribution (CC BY) license (https://creativecommons.org/licenses/by/4.0/).
Share and Cite
Suntinger, K.; Dalbert, A.; Prochazka, L.; Tegelkamp, M.; Kronen, P.; Klein, K.; Röösli, C.; Huber, A.; Pfiffner, F. Normative Values of Brainstem Auditory-Evoked Responses in Sheep. Brain Sci. 2025, 15, 69. https://doi.org/10.3390/brainsci15010069
Suntinger K, Dalbert A, Prochazka L, Tegelkamp M, Kronen P, Klein K, Röösli C, Huber A, Pfiffner F. Normative Values of Brainstem Auditory-Evoked Responses in Sheep. Brain Sciences. 2025; 15(1):69. https://doi.org/10.3390/brainsci15010069
Chicago/Turabian StyleSuntinger, Katharina, Adrian Dalbert, Lukas Prochazka, Milena Tegelkamp, Peter Kronen, Karina Klein, Christof Röösli, Alexander Huber, and Flurin Pfiffner. 2025. "Normative Values of Brainstem Auditory-Evoked Responses in Sheep" Brain Sciences 15, no. 1: 69. https://doi.org/10.3390/brainsci15010069
APA StyleSuntinger, K., Dalbert, A., Prochazka, L., Tegelkamp, M., Kronen, P., Klein, K., Röösli, C., Huber, A., & Pfiffner, F. (2025). Normative Values of Brainstem Auditory-Evoked Responses in Sheep. Brain Sciences, 15(1), 69. https://doi.org/10.3390/brainsci15010069