Article

Gamma Transcranial Alternating Current Stimulation Enhances Working Memory Ability in Healthy People: An EEG Microstate Study

1
School of Life Science, Beijing Institute of Technology, Beijing 100081, China
2
School of Mechatronical Engineering, Beijing Institute of Technology, Beijing 100081, China
3
School of Medical Technology, Beijing Institute of Technology, Beijing 100081, China
4
Advanced Research Institute for Multidisciplinary Science, Beijing Institute of Technology, Beijing 100081, China
5
Research Center for Medical Artificial Intelligence, Shenzhen Institute of Advanced Technology, Chinese Academy of Sciences, Shenzhen 518055, China
6
Department of Psychiatry, Graduate School of Medicine, Kyoto University, Kyoto 606-8501, Japan
*
Authors to whom correspondence should be addressed.
Brain Sci. 2025, 15(4), 381; https://doi.org/10.3390/brainsci15040381
Submission received: 23 December 2024 / Revised: 28 March 2025 / Accepted: 31 March 2025 / Published: 7 April 2025

Abstract

:
Background:Working memory (WM) is a core cognitive function closely linked to various cognitive processes including language, decision making, and reasoning. Transcranial alternating current stimulation (tACS), a non-invasive brain stimulation technique, has been shown to modulate cognitive abilities and treat psychiatric disorders. Although gamma tACS ( γ -tACS) has demonstrated positive effects on WM, its underlying neural mechanisms remain unclear. Methods: In this study, we employed electroencephalogram (EEG) microstate analysis to investigate the spatiotemporal dynamics of γ -tACS effects on WM performance. Healthy participants (N = 104) participated in two-back and three-back WM tasks before and after two types (sine and triangular) of γ -tACS, with sham stimulation as a control. Results: Our results revealed that γ -tACS improved performance in both the two-back and three-back tasks, with triangular γ -tACS showing greater accuracy improvement in the three-back task than the sham group. Furthermore, γ -tACS significantly modulated EEG microstate dynamics, specifically downregulating microstate Class C and upregulating microstate Classes D and B. These changes were positively correlated with reduced reaction times in the three-back task. Conclusions: Our findings establish microstate analysis as an effective approach for evaluating γ -tACS-induced changes in global brain activity and advance the understanding of how γ -tACS influences WM.

1. Introduction

Transcranial alternating current (tACS) is a non-invasive brain stimulation technique that applies specific frequencies of low-intensity currents to specific brain regions through electrodes which can achieve regulation of brain neural activity. As a form of transcranial electrical stimulation, tACS has the characteristics of high cost-effectiveness, easier application, and higher tolerance, demonstrating positive potential in treating various mental illnesses [1,2,3,4] and improving cognitive function [5,6,7].
Recent studies have focused on tACS applications for working memory (WM) [8,9,10]. WM is a limited-capacity memory system that can temporarily store and manipulate information required for complex cognitive tasks [11,12]. Clinically, WM impairments are observed in patients with mild cognitive impairment and psychiatric disorders such as schizophrenia, autism, and hyperactivity disorder [13,14,15,16]. The memory process is associated with brain oscillations such as delta, theta, alpha, beta, and gamma oscillations [17], and tACS theoretically provides oscillation frequencies related to neural discharges and affects the cognitive processes directly [18,19], but the underlying mechanism of tACS remains an open question.
Two meta-analyses have demonstrated that tACS can modestly to moderately improve cognitive function, with frequency-specific effects on different cognitive abilities [20,21]. α -tACS is more correlated with attentional control [22] and inhibitory control [23] compared with WM, and θ -tACS is linked with WM’s capacity, while the effects were opposite at different frequencies, with 4 Hz increasing the WM capacity and 7 Hz decreasing the WM capacity [24,25]. Meanwhile, β -tACS has been shown to improve short-term memory ability [26] and voluntary risk decision making [27], and γ -tACS enhances fluid intelligence [28] and significantly improves WM recall precision compared with alpha-frequency stimulation [29]. A behavioral study showed that γ -tACS regulation in the prefrontal area enhances the performance of participants in n-back tasks that require WM [30], indicating that γ -tACS has the potential to directly influence cognitive processes, but the explanation of its mechanism is not yet complete. The results of the analysis combined with electroencephalography (EEG) indicated that the superposition of γ -tACS significantly improves spatial WM performance [31]. Numerous studies have shown that γ -tACS has a positive impact on WM ability, and neurophysiological data help to better understand the potential mechanisms of γ -tACS effects.
Resting-state electroencephalography (EEG) is widely used to describe cognitive performance and evaluate cognitive function. The microstate analysis of resting-state EEG reflects the spatiotemporal dynamics of brain activity, reflecting the synchronous activity of neuronal populations within the brain [32,33]. By utilizing k-means clustering and establishing the ideal cluster count through cross-validation metrics, the preferred range for the number of maps across participants was found to be within 4–7 [34]. BOLD-fMRI analysis showed a significant correlation between resting-state microstates and brain functional networks [35,36,37]. Regarding the four typical types—Class A (right-frontal left-posterior), Class B (left-frontal right-posterior), Class C (midline frontal-occipital), and Class D (midline frontal)—a range of exciting results have been found [38,39,40,41]. The typical microstates have revealed the disorder of brain network organization and cognitive deficits in different stages of schizophrenia [42,43], and an elevated Class C in patients with schizophrenia showed a significant decrease after positive treatment outcomes [44]. The biomarker role of microstates is also reflected in healthy populations. In the mental arithmetic tasks, good performers showed a decrease in the Class C and an increase in Class D [45]. In WM research, the transition of microstates has been considered the core of WM function [46]. Therefore, it is reasonable for EEG microstates to play a significant role in the study of WM regulation mechanisms.
The aim of this study is to evaluate the regulatory effect of γ -tACS on regulating WM ability using EEG microstates. In previous studies, we characterized the changes in global brain activities before and after pure tACS using microstates [41]. On this basis, we applied microstates to the study of tACS regulation, targeting WM. Given that the activity of the prefrontal cortex is highly correlated with WM ability, we selected the bilateral dorsolateral prefrontal cortex (DLPFC) as the stimulation target. Participants underwent WM tasks before and after three types (sham, sine, and triangular wave) of γ -tACS, and their resting-state EEG signals were analyzed using the microstate method. We hypothesized that γ -tACS had an impact on the participants’ WM performance and microstate dynamics which was related to the type of stimulation. Furthermore, the association between the microstate and behavior parameters was investigated to find the patterns of brain activity dynamics under γ -tACS intervention.

2. Materials and Methods

2.1. Participants

This study involved 104 healthy participants between 18 and 37 years of age (mean age: 23.49 ± 3.14 standard deviation), including 64 males and 40 females. All participants reported normal or corrected-to-normal vision and were right-handed. The inclusion criterion was no history of neuropsychiatric diseases such as migraines, epilepsy, depression, or chronic insomnia. All participants received explanations of the experimental procedure and signed an informed consent form before the beginning of the study. After the experiment, all participants filled out a scale for their perception during the experiment period. This study followed the Declaration of Helsinki and obtained approval from the Medical and Experimental Animal Ethics Committee of the Beijing Institute of Technology (No. BIT-EC-H-2022080).

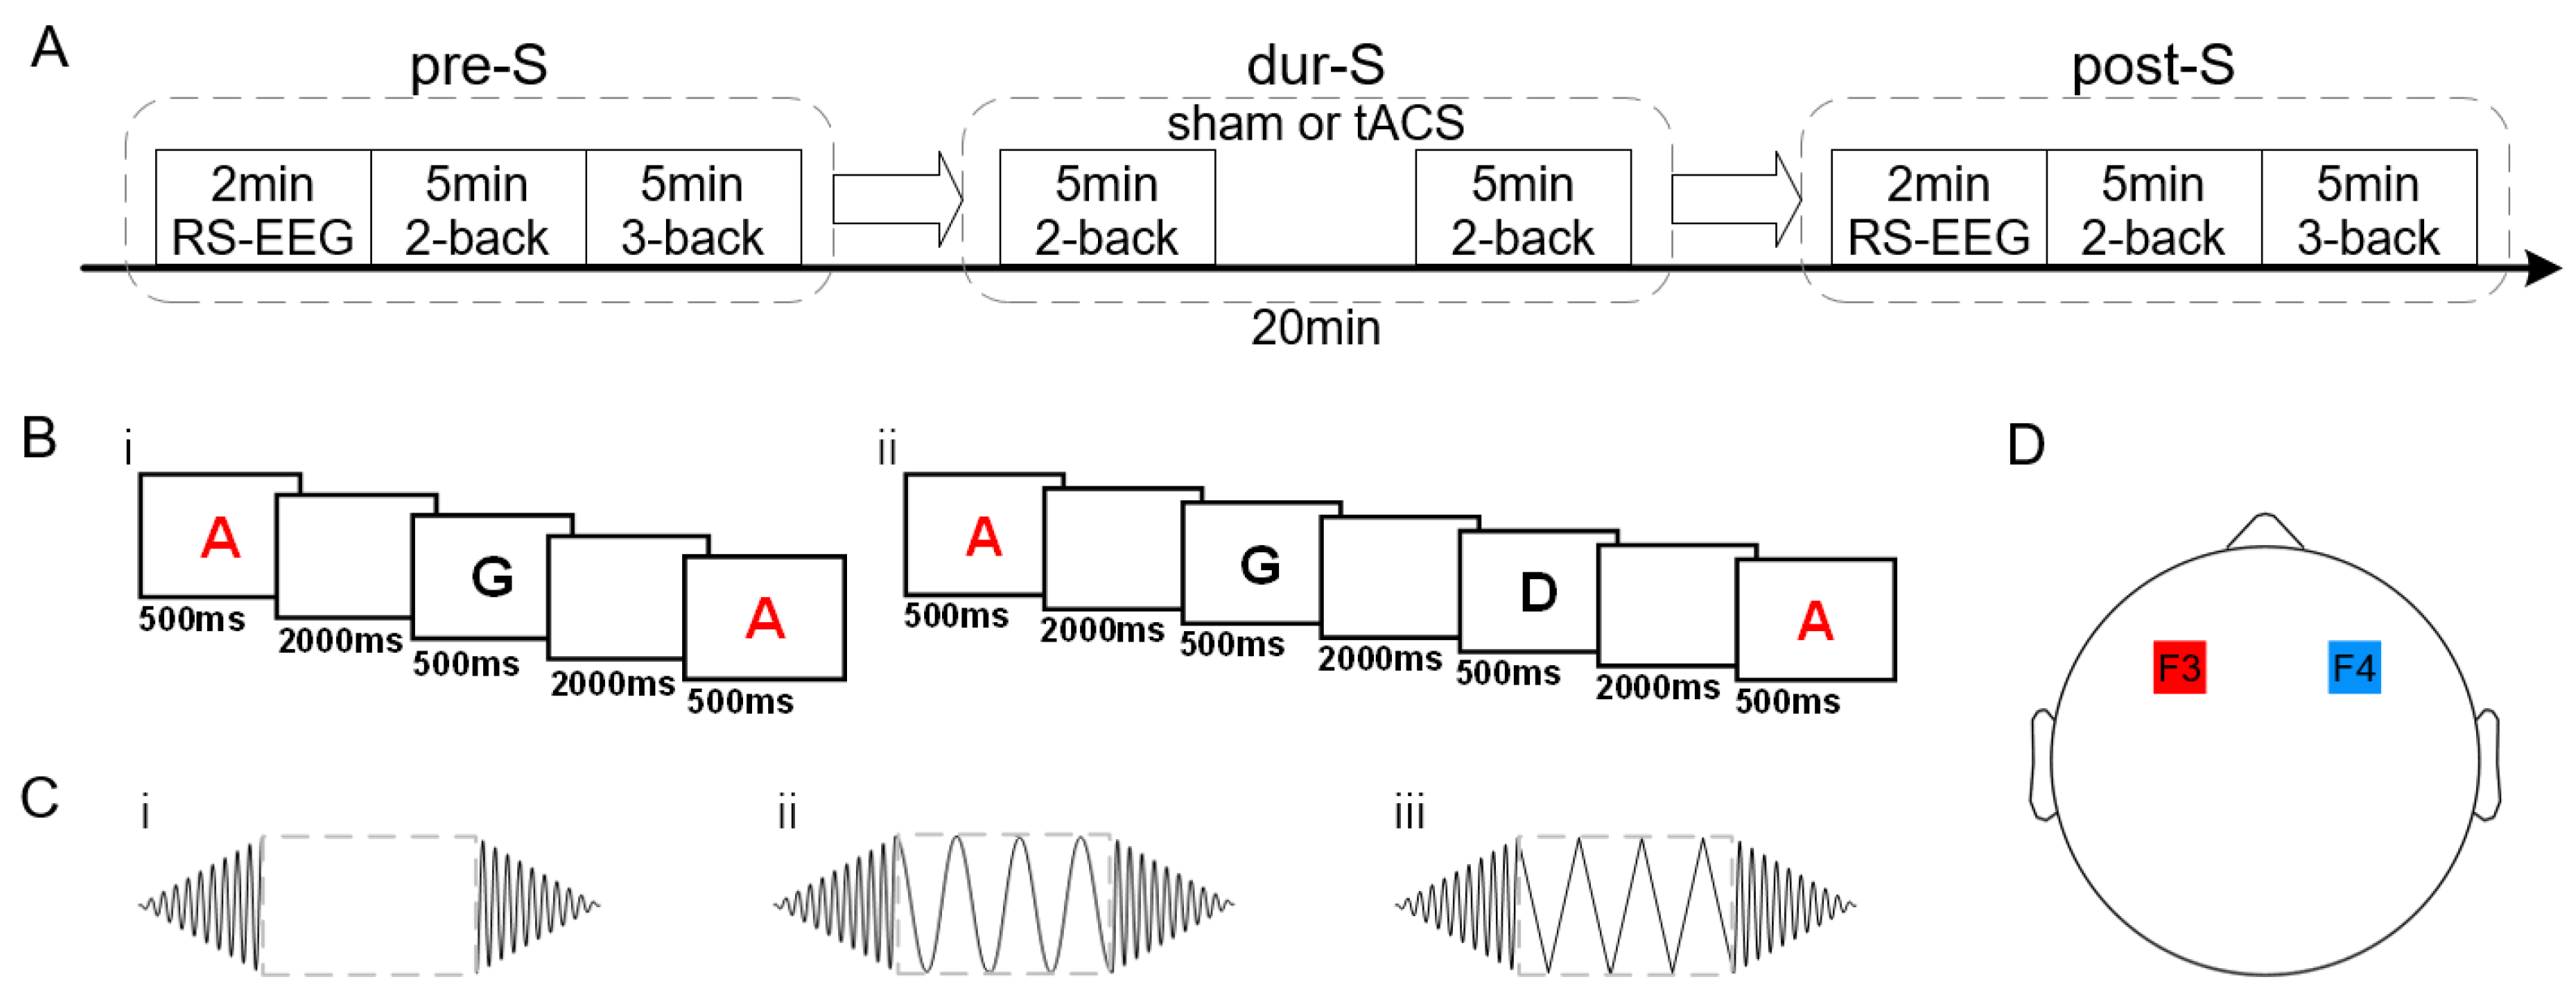
2.2. Experimental Procedures

The experiment in this study adopted a randomized, single-blind, controlled experimental design. According to the different stimulus waveform conditions, all 104 participants were randomly divided into three groups, including 38 in the sham stimulation group, 28 in the sine stimulation group, and 38 in the triangular stimulation group. The experiment was conducted in an electromagnetic shielding room. Participants sat calmly and comfortably in the same chair. The experiment consisted of three main parts (Figure 1A). In the pre-stimulation (pre-S) period, 2 min of eyes-open resting-state EEG data were first collected, followed by a behavioral experiment consisting of a 5-min two-back task and a 5-min three-back task for the participants. During the stimulation (dur-S) period, participants received 20 min of electrical stimulation, during which the participants performed a 5-min two-back task twice (2.5–7.5 min and 12.5–17.5 min). The intra-stimulation WM task has shown an enhanced regulatory effect [30,47,48]. In the post-stimulation (post-S) period, the participants underwent the same experimental procedure as in the pre-S period.
The n-back task paradigm is one of the most popular paradigms in WM research [49]. The behavioral experiments in this study were controlled by an E-Prime 3.0 software (Psychology Software Tools, Pittsburgh, PA, USA) customized program. The experiment started with a cross at the center of the screen, which could remind participants to focus. A series of pseudo-random letters (A–J) was continuously presented at the screen’s center, and each letter appeared for 500 ms with an interval of 2000 ms (Figure 1B). Each block comprised 130 trials, of which 32 were targets. The participants were required to press the left mouse button when the letters that appeared were consistent with the second (two-back) or third (three-back) letter before them, and the maximum reaction time was specified to not exceed 2500 ms. The accuracy and response times (RTs) of the participants were used to evaluate the WM performance.
The developed electrical stimulator [50] was applied to provide three forms of stimuli (sham, sine, and triangular; Figure 1C) that met the research requirements. The stimulation duration was 20 min, the stimulation intensity was 2 mA from peak to peak, and the stimulation frequency was 40 Hz. The stimulator was set to fade in and fade out at the start and end of the stimulation for 30 s, respectively. After 30 s of ascending stimulation of the sham group, the stimulator was switched off to induce a typical tingling sensation [51]. The stimulation was transmitted through two electrodes (5 cm × 7 cm) which were placed at the bilateral DLPFC, corresponding to F3 and F4 of the international 10–20 system [52] (Figure 1D). Each electrode was covered with a sponge pad soaked in saline solution (0.9%) to reduce resistance and minimize discomfort during stimulation.

2.3. EEG Acquisition and Preprocessing

The Neuroscan system was used to collect 2-min resting-state EEG data during the pre-S and post-S stages, comprising 64 sintered Ag/AgCl electrodes, and it was arranged according to the international 10–20 system. The reference electrode was placed between Cz and CPz, and the ground electrode was placed between FPz and Fz. The impedances of the electrodes were maintained below 10 kΩ, and the data sampling frequency was 1000 Hz. The EEGLAB toolbox version 2021.1 (http://sccn.ucsd.edu/eeglab/, accessed on 19 September 2023) in MATLAB R2020b (Mathworks, Natick, MA, USA) was applied for data preprocessing. The average value of the left and right mastoid electrodes was used for re-reference, and the EEG data were bandpass filtered at 1–40 Hz. The EEGLAB toolbox provides a “runica” function for automated independent component analysis (ICA) decomposition [53], which can identify artifact components corresponding to eye movements, eye blinks, muscle artifacts, and cardiac artifacts. Ocular artifacts exhibit a strong frontal scalp distribution, being concentrated at a low frequency (below 5 Hz) power, as well as distinctive vertical and horizontal components. Muscle artifacts show a higher frequency (20 Hz and above) power and focal temporal topography. Cardiac artifacts contain a clear QRS complex at about 1 Hz, with a nearly linear gradient scalp topography and no peaks in the power spectrum. Components matching these criteria were removed through visual inspection prior to further analysis. The above preprocessing process conformed to the preprocessing steps proposed by the Organization for Human Brain Mapping [54]. The so-cleaned EEG data were further downsampled to 500 Hz.

2.4. Microstate Analysis

The MST1.0 EEGLAB toolbox was used to conduct the microstate analysis [55] while following a universal pipeline [32,56,57]. First, the global field power (GFP) was calculated, which represented the standard deviation of the voltages across all the scalp electrodes at a certain time and whose local maxima represented the instants of the highest field strength [58]. To ensure robustness, GFP peaks were selected with a minimum inter-peak interval of 10 ms, and outliers exceeding 2 standard deviations from the mean GFP amplitude were excluded. Next, the modified k-means algorithm was used to cluster these topographic maps, which disregarded voltage polarity to avoid redundant classification of inverse polarity patterns [33]. The microstate templates were calculated using four different cluster numbers (k = 4–7). For each k, the clustering process was repeated 50 times with random initializations and up to 1000 iterations to optimize convergence. The optimal k was determined based on the two criteria of the GEV and cross-validation criterion. Based on the computational results and previous studies [34,59], the number of microstate categories was determined to be four. Subsequently, the four microstate templates were back-fitted to the continuous EEG signals by calculating the spatial correlation between each template and the EEG topography at every time point. Each time frame was assigned to the microstate class with the highest correlation coefficient. To mitigate noise-induced fragmentation, transient microstate segments shorter than 30 ms were merged into adjacent states using global map dissimilarity criteria. Finally, four key parameters were computed for each microstate class.
For each participant, the four key parameters (duration, coverage, occurrence, and transition probability) of the four microstates were computed [60]. The duration, measured in milliseconds, represents the average length of time that a microstate remained stable. Coverage indicates the percentage of time records in which microstates dominated. Occurrence measures the average number of occurrences per second of a microstate. Finally, the transition probability refers to the percentage of transitions from one microstate to another over all transitions during a certain time.

2.5. Statistical Analysis

Demographic analysis was performed based on experimental grouping (sham stimulation group, sine stimulation group, and triangular stimulation group), univariate analysis of variance (ANOVA) based on age, and a chi-squared test based on gender. The behavioral performance data of the participants were analyzed using univariate ANOVA and a post hoc paired t-test. The WM behavioral performances of the participants were described in terms of accuracy and RT, and statistical analysis was conducted using paired t-tests and two-sample t-tests. Cohen’s d was used to evaluate the effect size [61].
After conducting microstate analysis, we obtained the topographies of four microstate classes (Class A, Class B, Class C, and Class D) for before and after the three stimulation types, with each template corresponding to four microstate parameters (duration, coverage, occurrence, and transition probability). To quantify the topographical similarity between the microstate topographies under different stimulation types, the +microstate toolbox was applied to conduct topographical ANOVA (TANOVA) [62]. For the microstate duration, coverage, and occurrence, we conducted two-way repeated measures ANOVA (rmANOVA) with the group and microstate class as factors [42]. When the main effects or interactions in the rmANOVA were significant, the post hoc pairwise Dunn’s test was employed. Data were expressed as the mean ± the standard error of the mean (SEM).
To compare the microstate dynamic differences between the pre-S and post-S stages in different stimulation groups, a paired t-test was conducted on the microstate parameters pre-S and post-S. Similarly, a paired t-test was employed to analyze the statistical significance of the 12 transition probabilities (A → B, B → A, A → C, C → A, A → D, D → A, B → C, C → B, B → D, D → B, C → D, and D → C).
To further investigate whether the microstate parameters were significantly correlated with the behavioral parameters, the linear model analysis was fitted between the behavioral accuracy and RT with EEG microstate parameters. This analysis was only used for microstate parameters with significant pre-S and post-S differences. To maintain consistency during the calculation process, the x axis (behavioral parameters) and y axis (microstate parameters) were obtained by calculating the rate of change.
The p values were corrected with the Bonferroni test (corrected p value < 0.05) to minimize the risk of type I errors. The statistical tests were conducted using R (version 4.3.1).

3. Results

3.1. Demographic Details

The 104 participants were randomly divided into three groups corresponding to three different stimuli, as 38 (aged 23.9 ± 3.3 years), 28 (aged 22.8 ± 2.4 years) and 38 (aged 23.5 ± 3.2 years) healthy participants were involved in the sham, sine, and triangular groups, respectively. No significant differences in age or gender across the groups were found (Table 1).

3.2. WM Performances

We analyzed the behavioral performance of the participants participating in WM tasks (Figure 2). Regardless of whether the participants were in the sham, sine, or triangular group, the accuracy was heightened and the RT shortened post stimulation, and all of the effects were statistically significant (all p < 0.001, paired t-test). The accuracy results were as follows: Cohen’s d (sham, two-back) = −0.52, Cohen’s d (sine, two-back) = −0.80, Cohen’s d (triangular, two-back) = −0.82, Cohen’s d (sham, two-back) = −0.46, Cohen’s d (sine, three-back) = −0.54, and Cohen’s d (triangular, three-back) = −0.78. The RT were as follows: Cohen’s d (sham, two-back) = 1.04, Cohen’s d (sine, two-back) = 1.13, Cohen’s d (triangular, two-back) = 1.14, Cohen’s d (sham, three-back) = 0.54, Cohen’s d (sine, three-back) = 0.65, and Cohen’s d (triangular, three-back) = 0.79. A two-sample t-test was applied to perform intergroup analysis on the changes in accuracy and RT. In the three-back task (Figure 2B), the change in accuracy for triangular group was significantly higher than that for the sham group (p = 0.039, Cohen’s d = −0.58, two-sample t-test; Figure 2B(iii)), while the change in RT showed no statistical difference across the groups (p > 0.05, Cohen’s d < 0.07, two-sample t-test). In the two-back task (Figure 2A), no statistical differences in the changes in accuracy or RT were observed in the intergroup comparisons (all p > 0.05, all Cohen’s d < 0.32, two-sample t-test).

3.3. Microstate Topographies

The archetypal four microstate patterns were calculated for each wave group in the pre-S and post-S stages (Figure 3), which were represented as Class A, Class B, Class C, and Class D based on other research studies [34,63,64]. Significant topographical differences between the templates under each condition were not detected through TANOVA. The GEV values were confirmed when the microstate template was back-fitted to the individual data of each condition (pre-sham: 0.71 ± 0.04; post-sham: 0.74 ± 0.05; pre-sine: 0.74 ± 0.06; post-sine: 0.76 ± 0.04; pre-triangular: 0.72 ± 0.04; post-triangular: 0.74 ± 0.05). When using two-sample t-tests, there were no significant differences found in the GEV values between the groups (all p > 0.05).

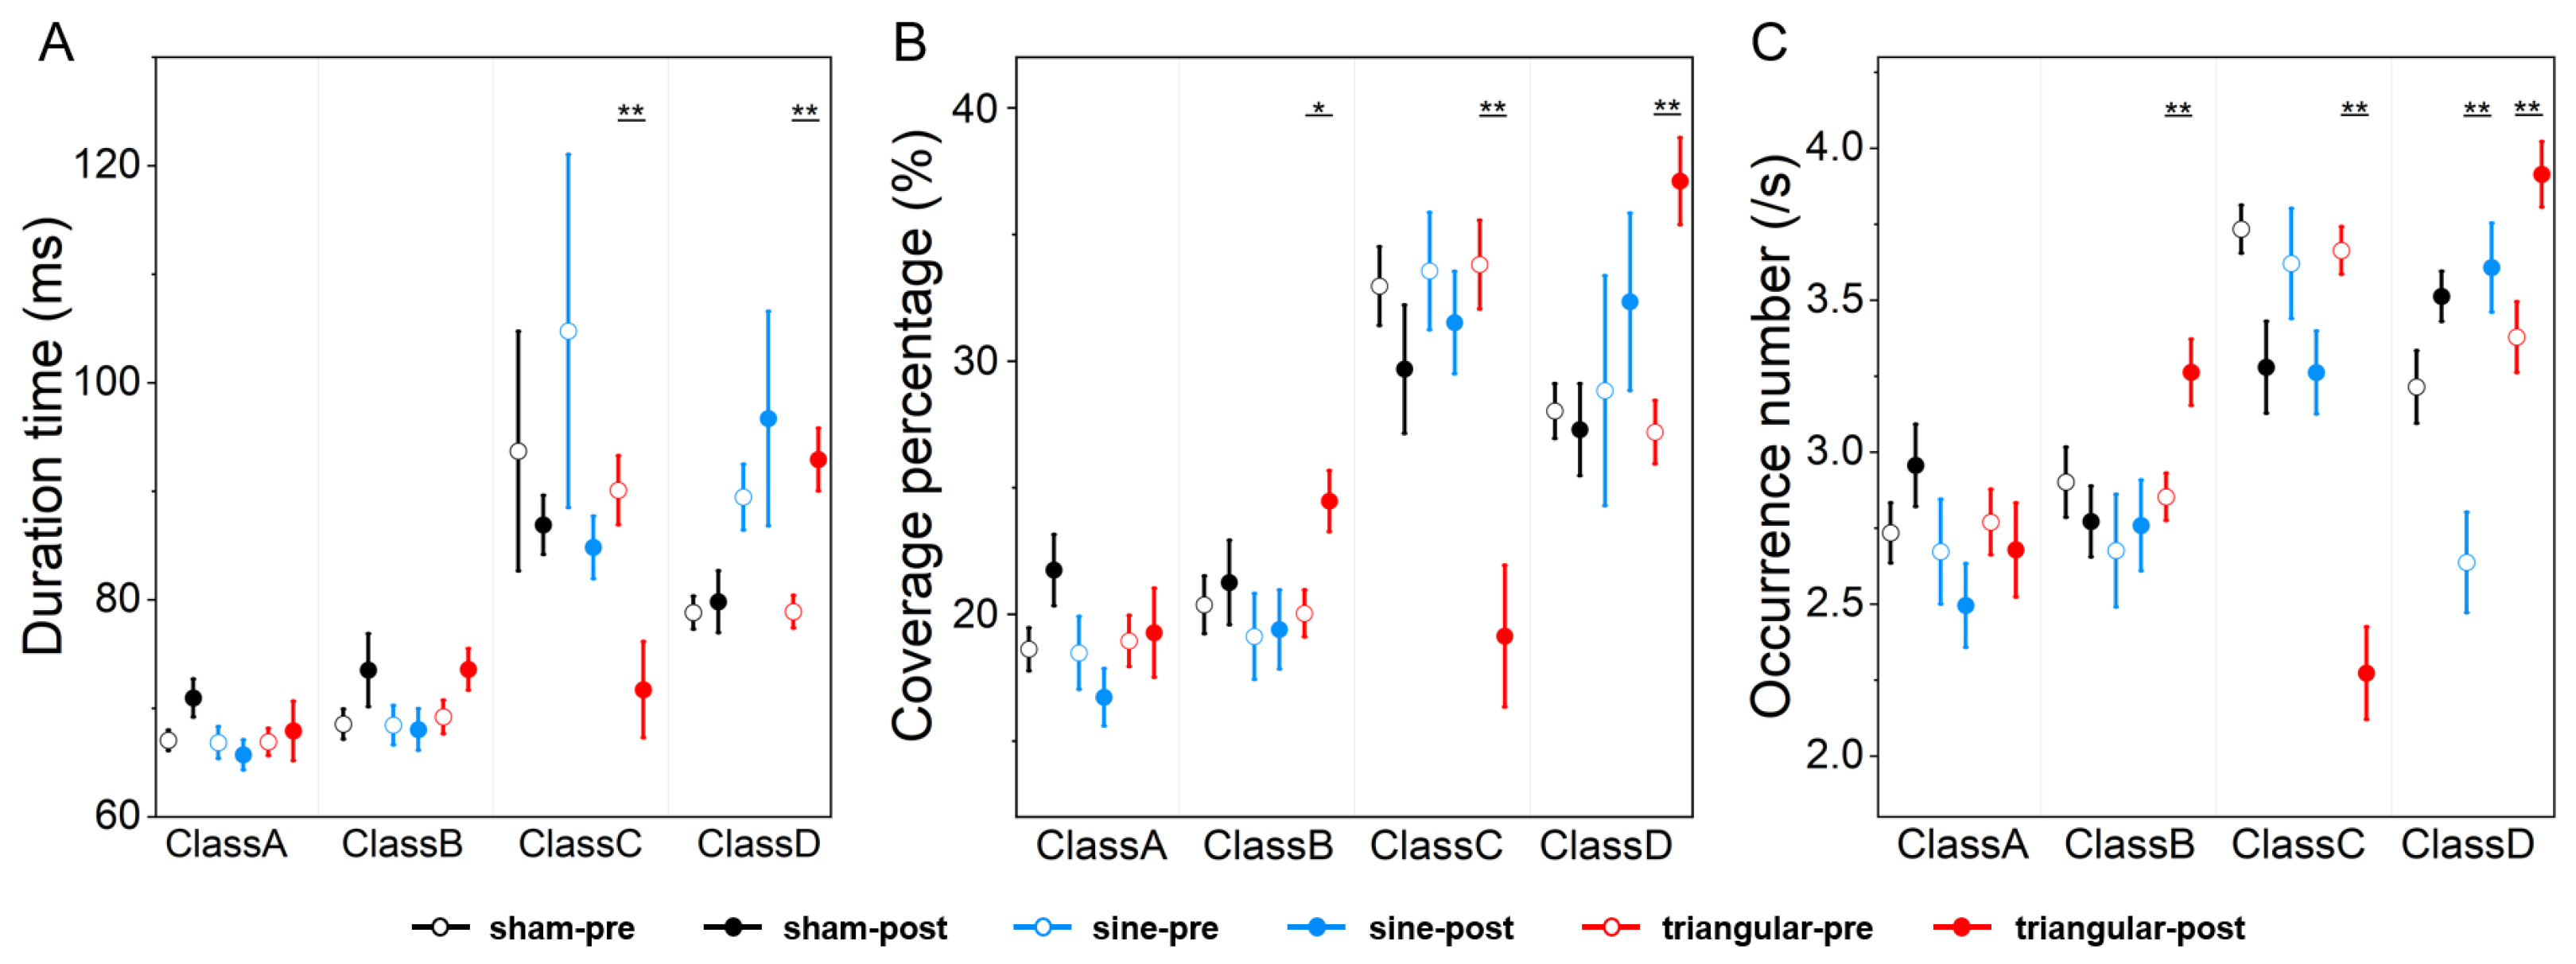
3.4. Microstate Parameters

Two-way rmANOVAs for the pre-S stage showed nonsignificant group × microstate class interaction in terms of duration (F(3,303) = 0.834, p = 0.544), coverage (F(3,303) = 0.206, p = 0.975), and occurrence (F(3,303) = 1.857, p = 0.088), while the analysis for the post-S stage showed significant group × microstate class interaction in terms of duration (F(3,303) = 4.093, p < 0.001), coverage (F(3,303) = 4.072, p < 0.001), and occurrence (F(3,303) = 11.04, p < 0.001). Post hoc pairwise group comparisons (Table 2) showed that the sine group had decreased coverage (p = 0.047) and occurrence levels (p = 0.049) for Class A compared with the sham group. The triangular group had increased coverage (p = 0.037) and occurrence levels (p = 0.002) for Class B, decreased duration (p < 0.001), coverage (p = 0.002), and occurrence levels (p < 0.001) for Class C, and increased duration (p = 0.010), coverage (p = 0.002), and occurrence levels (p < 0.001) for Class D compared with the sham group. For the sine and triangular groups, the duration (p = 0.034), coverage (p = 0.010), and occurrence levels (p = 0.005) of Class B, as well as the coverage (p = 0.019) of Class D, increased significantly. The duration (p < 0.001), coverage (p < 0.001), and occurrence levels (p = 0.001) of Class C decreased significantly.
The comparison results for the microstate parameters (duration, coverage, and occurrence) pre- and post-stimulation under three different stimulation conditions (Figure 4) showed that the occurrence (p = 0.001) of Class D increased significantly post sine stimulation. For the triangular stimulation group, the coverage (p = 0.011) and occurrence (p = 0.007) of Class B increased. The duration (p = 0.001), coverage (p < 0.001), and occurrence (p < 0.001) of Class C decreased. The duration (p < 0.001), coverage (p < 0.001), and occurrence (p = 0.001) of Class D increased. No significant changes were observed in the microstate parameters between the pre-S and post-S sham groups.
The statistical results of the transition probability changes in the four states of the different conditions are presented in Figure 5. There was no significant change in the transition probability between the sham pre-S and post-S periods. For the sine group, the transition probabilities of A → D (pre-S: 0.31 ± 0.21; post-S: 0.37 ± 0.18, p = 0.044) and C → D (pre-S: 0.39 ± 0.24; post-S: 0.45 ± 0.19, p = 0.027) significantly increased, while the transition probability of C → A (pre-S: 0.30 ± 0.13; post-S: 0.25 ± 0.09, p = 0.002) significantly decreased. For the triangular group, the transition probabilities of A → B (pre-S: 0.28 ± 0.08; post-S: 0.33 ± 0.09, p = 0.003), B → D (pre-S: 0.40 ± 0.11; post-S: 0.49 ± 0.14, p = 0.014), and D → B (pre-S: 0.30 ± 0.08; post-S: 0.41 ± 0.13, p < 0.001) significantly increased, while the transition probabilities of A → C (pre-S: 0.33 ± 0.09; post-S: 0.23 ± 0.15, p = 0.002), C → A (pre-S: 0.27 ± 0.08; post-S: 0.23 ± 0.10, p = 0.033), B → C (pre-S: 0.34 ± 0.09; post-S: 0.24 ± 0.16, p = 0.003), and D → C (pre-S: 0.40 ± 0.09; post-S: 0.28 ± 0.20, p = 0.002) significantly decreased.

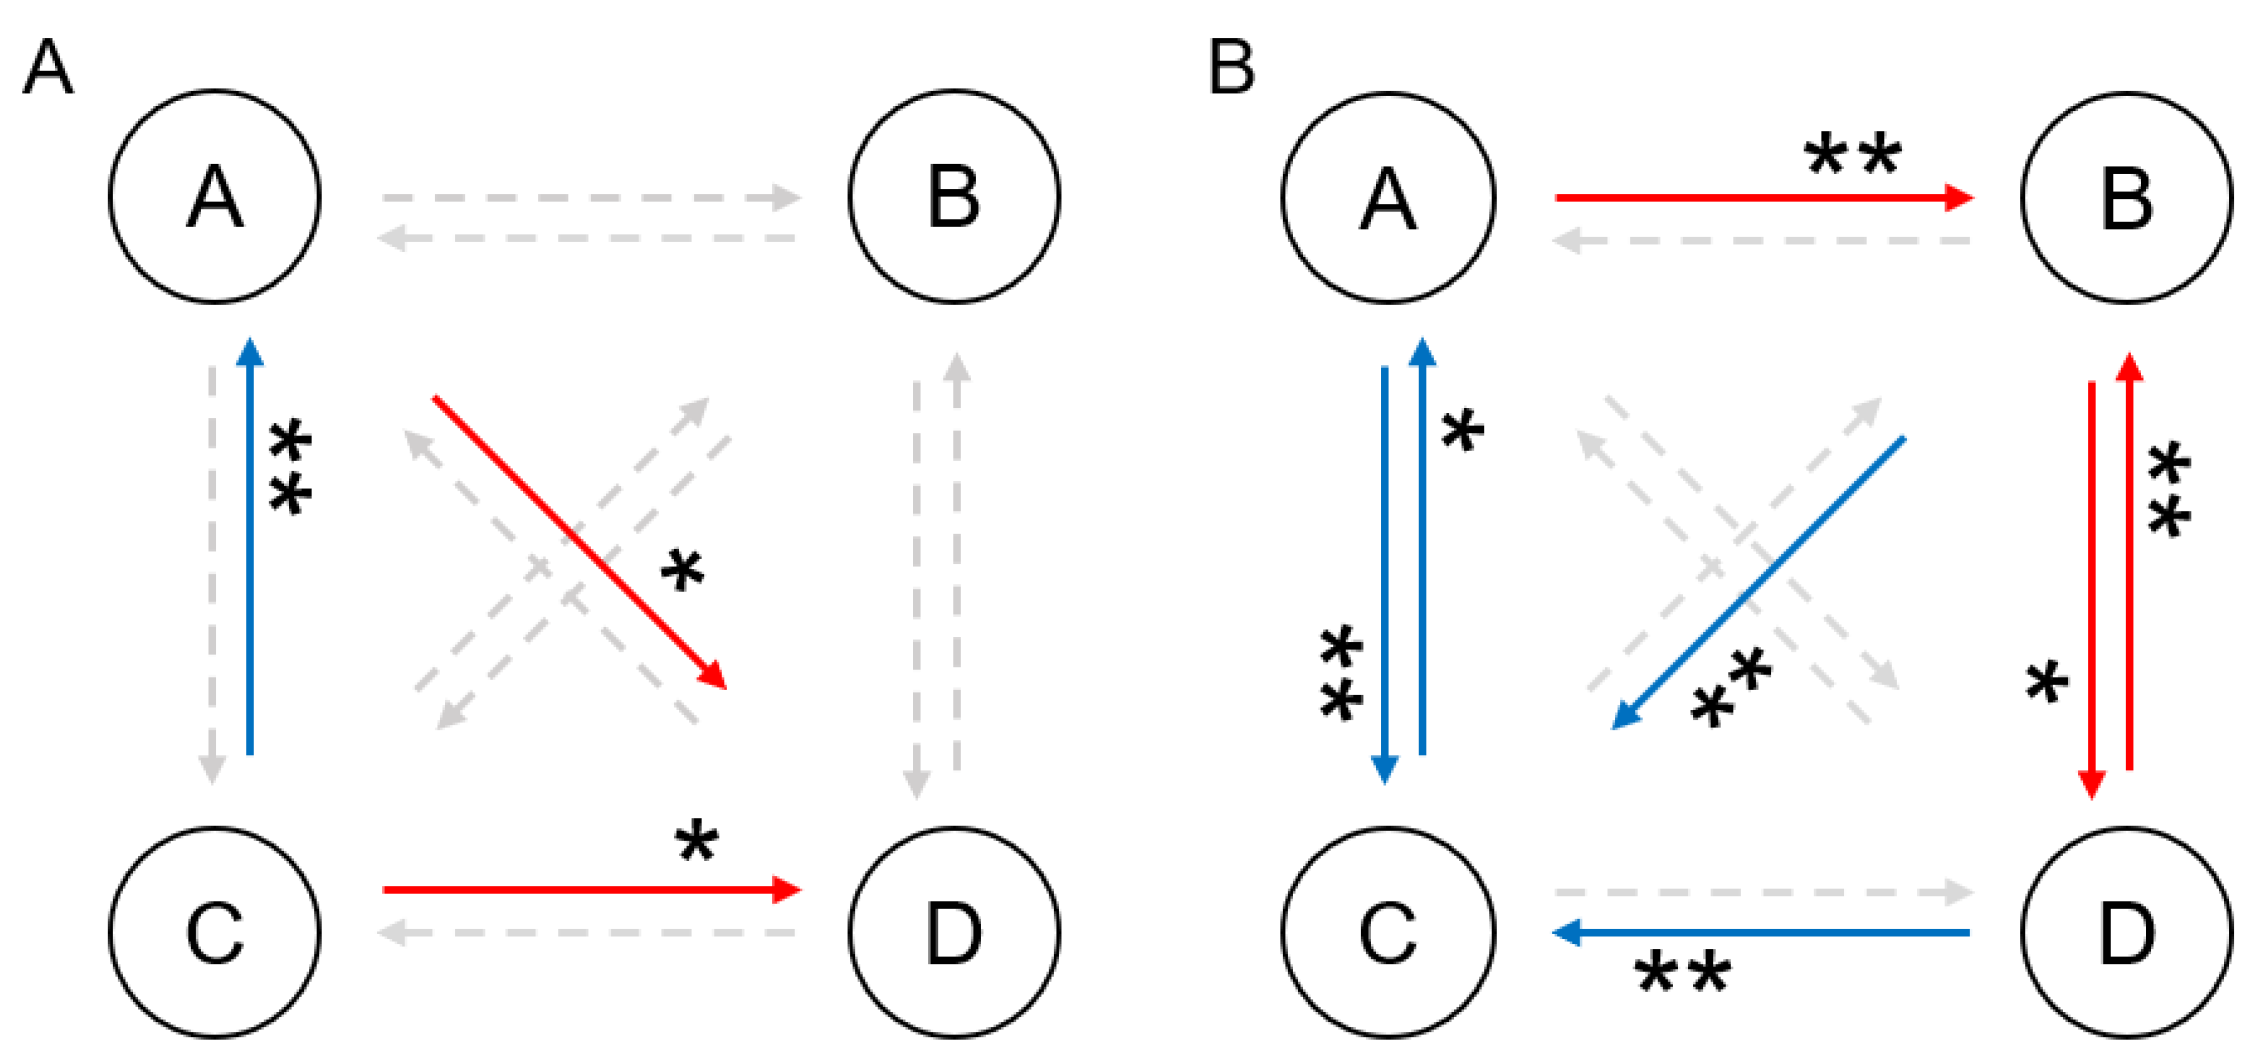
3.5. Correlation Between Microstate and Behavior Parameters

Regression analysis was used to further calculate the correlation between the microstate parameters and behavioral parameters under different stimulus conditions. The duration (p = 0.002; R2 = 0.267) and coverage (p < 0.001; R2 = 0.405) of Class C were found to have a significant positive correlation with the RTs of the participants in the three-back task post triangular stimulation (Figure 6A). The transition probabilities were also found to have significant correlations with the RTs. Specifically, the transition probabilities of A → B (p = 0.037; R2 = 0.128), B → D (p = 0.048; R2 = 0.086), and D → B (p = 0.048; R2 = 0.090) had negative correlations with the RTs of the participants, and the transition probabilities of A → C (p = 0.003; R2 = 0.245), B → C (p = 0.048; R2 = 0.101), and D → C (p = 0.003; R2 = 0.265) had positive correlations (Figure 6B).

4. Discussion

The high enthusiasm for research on the impact of tACS on WM has sparked many discussions. Therefore, further work is needed to improve the understanding of how tACS affects WM. Brain-derived biomarkers hold promise in assisting us with evaluating the effect of γ -tACS on regulating WM ability. In this study, we conducted research using three types of brain stimulation (sham, sine, and triangular) on bilateral frontal lobe targets combined with recognized visual two-back and three-back WM behavioral paradigms. Our findings demonstrated that γ -tACS significantly improved WM performance. Compared with sham stimulation, both the sine and triangular stimulations notably influenced the EEG microstates. Furthermore, the post-S EEG microstate parameters following triangular stimulation exhibited significant changes which were correlated with behavioral outcomes. These findings provide valuable insights into the neural mechanisms underlying tACS-mediated modulation of WM.
In tACS studies on cognitive modulation, selection of the stimulation frequencies, stimulation targets, and stimulation waveform may lead to different outcomes. Studies have shown that gamma tACS is closely related to the maintenance and manipulation of information in WM, especially under high cognitive load, and is more suitable for regulating WM [30,65,66]. In terms of target selection, some studies focused on the parietal cortex or frontoparietal cortex to investigate visuospatial WM [24,25,67,68]. In our study, we chose the more widely used bilateral DLPFC [21], a region known for its central role in performing functions and WM maintenance. This choice could explain the significant improvements we observed in the two-back and three-back tasks [49]. In addition, compared with single-region modulation, bilateral modulation provides more robust regulation [8]. In terms of waveform selection, in addition to the sine waveform used in most studies, we incorporated triangular waveforms, which have clearer transitions and can more effectively entrain neural oscillations [69,70], allowing us to explore the impact of richer harmonic content on gamma oscillations.
The behavioral results indicate that γ -tACS enhanced the participants’ performances in WM tasks (Figure 2), confirming the positive effect of tACS, which is in agreement with previous studies [28,29,30,65]. In our study, the participants performed n-back tasks before and after stimulation, which might have led to improved performance in the sham stimulation group, but the effect of the sham group was lower than those of the sine and triangular groups. Moreover, for the higher-workload three-back task, in the inter-group comparison of behavioral changes, the accuracy improvement of the triangular group showed a significant increase compared with the sham group (p = 0.039, Cohen’s d = −0.58), indicating that the triangular wave group had the relatively best effect in regulating WM performance. Gamma oscillations are thought to reflect active processing of information, which may have facilitated maintaining the memory of the initially presented stimuli [71]. In other tACS studies, γ -tACS was shown to potentially enhance gamma power [72], thereby promoting improvement in the recall accuracy. Thus, γ -tACS can be effective in improving WM performance.
The resting-state EEG microstate analysis can extract information from unstructured EEG signals and is a powerful technique for studying the temporal dynamics of whole-brain neural networks, with high test-retest reliability [59]. Studies have shown that EEG microstates are closely related to the resting-state networks (RSNs) identified by functional magnetic resonance [35,36,37] and allow interpretation from the perspective of neuroscience. To our knowledge, we are the first to apply the biomarker effects of microstates to describe the mechanism by which tACS regulates WM. The modified k-means method was employed to extract the microstate characteristics in this study, and the most typical four microstate templates were defined (Figure 3). The GEV of the four microstate topographies under different groups was from 71% to 76%, which is a reasonable range [34]. Moreover, the TANOVA [62] showed no significant differences in the microstate topographies among the three conditions. Therefore, we obtained four typical topographical templates of Classes A, B, C, and D.
The four temporal parameters (duration, coverage, occurrence, and transition probability) of the four microstates can be used to quantify the dynamic changes in the brain [32]. Our research indicated that γ -tACS caused a significant increase in the coverage and occurrence of Class B, a significant decrease in the duration, coverage, and occurrence for Class C, and a significant increase in the duration, coverage, and occurrence for Class D. The microstates of Classes A and B are related to sensory processes, with Class A linking to the auditory resting-state network [35,37] and Class B correlating with the visual resting-state network and visual imagery thoughts [73]. Seitzman et al. reported that the variation in the Class B features depended on the presence or absence of visual input [74]. The microstates of Classes C and D are associated with the saliency network and dorsal attention network, respectively [35]. The results of Seitzman et al. showed that Class C was task-negative, and Class D was task-positive [74]. For participants who performed well in the mental arithmetic tasks, Class C decreased, and Class D increased [45]. In clinical terms, a recent study showed that the dynamics of Classes C and D are candidate endogenous phenotypes of schizophrenia [42], which is characterized by an increase in Class C and a decrease in Class D. The downregulation of Class C [44] and the upregulation of Class D [75] may be related to a positive impact on schizophrenia. Therefore, the impact of tACS on Classes B, C, and D may reflect the neural mechanisms by which it enhances WM performance.
In the present study, γ -tACS also triggered mutual transitions between microstates, where the transition probabilities (A → B, B → D, and D → B) were negatively correlated with the three-back RT, and the transition probabilities (A → C, B → C, and D → C) were positively correlated with the three-back RT. The microstate transition probabilities are nonrandom [60], which can reflect considerable cognitive changes [45]. Research on task-state microstates indicates that the drastic transition between Classes C and D is crucial for executing WM n-back tasks [46]. Complex cognitive tasks require cross-domain coordinated planning of the prefrontal control network [76], and the tACS of the prefrontal cortex might enhance this activity. Neuro-electrophysiological studies have found that WM tasks are related to neural oscillations of different frequencies. Specifically, the maintenance of WM information is related to γ oscillation [66]. As the workload of WM increases, the amplitude of the γ rhythms also increases [77]. Park et al. reported that high-gamma tACS can significantly increase WM capacity [78]. Triangular waves have more components in the spectrum and can generate higher frequency gamma stimulation, potentially explaining the more significant behavioral results and microstate parameter changes produced by triangular wave stimulation.
Although this study indicated that microstates can be used to investigate the internal neural regulatory mechanisms of tACS, several limitations should be noted. Our research focused on healthy young adults, subjectively excluding age and disease factors. Future studies could be conducted in a larger age range or by introducing clinical data to enrich research dimensions. EEG-fMRI simultaneous measurement will help to obtain more detailed information related to cognitive tasks, and the integration of machine learning algorithms can enhance the analysis of these multimodal data [43,79]. Moreover, our research concentrated on the immediate effects of a single γ -tACS session. Future studies could explore the potential of cross-frequency coupling stimulation [31,67,68,80], and the inclusion of a follow-up session [2,3] would allow for the evaluation of whether the cognitive benefits are sustained over time. This would provide valuable insights into the potential for long-term cognitive enhancement through tACS. Future studies could also expand the scope of cognitive assessment by including tasks that evaluate other domains, such as attention, executive function, or long-term memory. This would help determine whether the observed effects of γ -tACS are specific to WM or extend to broader cognitive functions. The current research has found that tACS downregulates Class C and upregulates Classes B and D, which may explain the potential mechanism of tACS in regulating WM performance.

5. Conclusions

We analyzed the WM performance and microstate parameters of healthy participants before and after participating in three types of γ -tACS. The results showed that γ -tACS improved WM performance, and the regulatory effect of triangular waves was better. The regulatory effect of γ -tACS was observed in the microstate Classes B, C, and D, with a significant decrease in microstate Class C and an increase in the microstates of Classes B and D. Consequently, microstate analysis serves as a crucial tool for assessing brain function related to tACS and is anticipated to elucidate its regulatory process.

Author Contributions

Conceptualization, B.G., S.F., J.W. and J.Z. (Jian Zhang); methodology, B.G. and J.Z. (Jinyan Zhang); software, B.G. and J.Z. (Jinyan Zhang); validation, B.G. and J.Z. (Jinyan Zhang); formal analysis, J.Z. (Jianxu Zhang) and L.W.; investigation, J.Z. (Jianxu Zhang) and G.P.; resources, J.Z. (Jian Zhang) and Z.Z.; data curation, B.G., J.Z. (Jianxu Zhang) and T.L.; writing—original draft preparation, B.G.; writing—review and editing, J.Z. (Jinyan Zhang), J.Z. (Jian Zhang) and G.P.; project administration, J.Z. (Jian Zhang) and Z.Z.; funding acquisition, G.P., T.L., L.W., S.F., J.W., J.Z. (Jian Zhang) and Z.Z. All authors have read and agreed to the published version of the manuscript.

Funding

This research was funded by the Key-Area Research and Development Program of Guangdong Province (grant number 2023B0303030002); National Natural Science Foundation of China (grant numbers 82202291, 62306035, 62373056, and 62406025); Natural Science Foundation of Beijing Municipal (grant numbers IS23114 and 7242274); China Postdoctoral Science Foundation (grant numbers 2023TQ0027 and 2024M754099); International Cooperation Projects of Science and Technology of Guangdong Province (grant number 2023A0505050162); Guangdong Basic and Applied Basic Research Foundation (grant number 2023A1515012929); and Shenzhen Basic Research Program (grant numbers JCYJ20241202124859016 and JCYJ20241202124804007).

Institutional Review Board Statement

This study was conducted in accordance with the Declaration of Helsinki and approved by the Medical and Experimental Animal Ethics Committee of the Beijing Institute of Technology (No. BIT-EC-H-2022080, 19 September 2022).

Informed Consent Statement

Informed consent was obtained from all subjects involved in this study.

Data Availability Statement

The data that support the findings of this study are available on request from the corresponding author. The data are not publicly available due to privacy or ethical restrictions.

Conflicts of Interest

The authors declare no conflicts of interest.

References

  1. Huang, Y.X.; Shen, L.J.; Huang, J.; Xu, X.R.; Wang, Y.; Jin, H. Efficacy and Safety of tDCS and tACS in Treatment of Major Depressive Disorder: A Randomized, Double-Blind, Factorial Placebo-Controlled Study Design. Neuropsychiatr. Dis. Treat. 2021, 17, 1459–1468. [Google Scholar] [CrossRef]
  2. Liu, Y.; Gu, N.N.; Cao, X.Y.; Zhu, Y.K.; Wang, J.J.; Smith, R.C.; Li, C.B. Effects of transcranial electrical stimulation on working memory in patients with schizophrenia: A systematic review and meta-analysis. Psychiatry Res. 2021, 296, 113656. [Google Scholar] [CrossRef]
  3. Sagliano, L.; Atripaldi, D.; De Vita, D.; D’Olimpio, F.; Trojano, L. Non-invasive brain stimulation in generalized anxiety disorder: A systematic review. Prog. Neuro-Psychopharmacol. Biol. Psychiatry 2019, 93, 31–38. [Google Scholar] [CrossRef]
  4. Philip, N.S.; Nelson, B.G.; Frohlich, F.; Lim, K.O.; Widge, A.S.; Carpenter, L.L. Low-Intensity Transcranial Current Stimulation in Psychiatry. Am. J. Psychiatry 2017, 174, 628–639. [Google Scholar] [CrossRef]
  5. Alexander, M.L.; Alagapan, S.; Lugo, C.E.; Mellin, J.M.; Lustenberger, C.; Rubinow, D.R.; Frohlich, F. Double-blind, randomized pilot clinical trial targeting alpha oscillations with transcranial alternating current stimulation (tACS) for the treatment of major depressive disorder (MDD). Transl. Psychiatry 2019, 9, 106. [Google Scholar] [CrossRef]
  6. Ali, M.M.; Sellers, K.K.; Frohlich, F. Transcranial Alternating Current Stimulation Modulates Large-Scale Cortical Network Activity by Network Resonance. J. Neurosci. 2013, 33, 11262–11275. [Google Scholar] [CrossRef]
  7. Marshall, L.; Helgadóttir, H.; Mölle, M.; Born, J. Boosting slow oscillations during sleep potentiates memory. Nature 2006, 444, 610–613. [Google Scholar] [CrossRef]
  8. Senkowski, D.; Sobirey, R.; Haslacher, D.; Soekadar, S.R. Boosting working memory: Uncovering the differential effects of tDCS and tACS. Cereb. Cortex Commun. 2022, 3, tgac018. [Google Scholar] [CrossRef]
  9. Booth, S.J.; Taylor, J.R.; Brown, L.J.E.; Pobric, G. The effects of transcranial alternating current stimulation on memory performance in healthy adults: A systematic review. Cortex 2022, 147, 112–139. [Google Scholar] [CrossRef] [PubMed]
  10. Polanía, R.; Nitsche, M.A.; Ruff, C.C. Studying and modifying brain function with non-invasive brain stimulation. Nat. Neurosci. 2018, 21, 174–187. [Google Scholar] [CrossRef] [PubMed]
  11. Baddeley, A.D. Working memory: Theories, models, and controversies. Annu. Rev. Psychol. 2012, 63, 1–29. [Google Scholar] [CrossRef]
  12. Baddeley, A.D. Working memory: Looking back and looking forward. Nat. Rev. Neurosci. 2003, 4, 829–839. [Google Scholar] [CrossRef]
  13. Dienel, S.J.; Lewis, D.A. Alterations in cortical interneurons and cognitive function in schizophrenia. Neurobiol. Dis. 2019, 131, 104208. [Google Scholar] [CrossRef]
  14. Craig, F.; Margari, F.; Legrottaglie, A.R.; Palumbi, R.; de Giambattista, C.; Margari, L. A review of executive function deficits in autism spectrum disorder and attention-deficit/hyperactivity disorder. Neuropsychiatr. Dis. Treat. 2016, 12, 1191–1202. [Google Scholar] [CrossRef]
  15. Kirova, A.M.; Bays, R.B.; Lagalwar, S. Working Memory and Executive Function Decline across Normal Aging, Mild Cognitive Impairment, and Alzheimer’s Disease. BioMed Res. Int. 2015, 2015, 748212. [Google Scholar] [CrossRef]
  16. Ozonoff, S.; Strayer, D.L. Further Evidence of Intact Working Memory in Autism. J. Autism Dev. Disord. 2001, 31, 257–263. [Google Scholar] [CrossRef] [PubMed]
  17. Hanslmayr, S.; Axmacher, N.; Inman, C.S. Modulating Human Memory via Entrainment of Brain Oscillations. Trends Neurosci. 2019, 42, 485–499. [Google Scholar] [CrossRef]
  18. Herrmann, C.S.; Rach, S.; Neuling, T.; Strüber, D. Transcranial alternating current stimulation: A review of the underlying mechanisms and modulation of cognitive processes. Front. Hum. Neurosci. 2013, 7, 279. [Google Scholar] [CrossRef]
  19. Vossen, A.Y.; Gross, J.; Thut, G. Alpha Power Increase After Transcranial Alternating Current Stimulation at Alpha Frequency (alpha-tACS) Reflects Plastic Changes Rather Than Entrainment. Brain Stimul. 2015, 8, 499–508. [Google Scholar] [CrossRef]
  20. Lee, T.L.; Lee, H.; Kang, N. A meta-analysis showing improved cognitive performance in healthy young adults with transcranial alternating current stimulation. npj Sci. Learn. 2023, 8, 1. [Google Scholar] [CrossRef] [PubMed]
  21. Grover, S.; Fayzullina, R.; Bullard, B.M.; Levina, V.; Reinhart, R.M.G. A meta-analysis suggests that tACS improves cognition in healthy, aging, and psychiatric populations. Sci. Transl. Med. 2023, 15, eabo2044. [Google Scholar] [CrossRef]
  22. Hilla, Y.; Link, F.; Sauseng, P. Alpha-tACS alters attentional control but not cognitive functions as video games do: A psychophysical investigation based on the theory of visual attention. Eur. J. Neurosci. 2023, 57, 1705–1722. [Google Scholar] [CrossRef]
  23. Daughters, S.B.; Yi, J.Y.; Phillips, R.D.; Carelli, R.M.; Fröhlich, F. Alpha-tACS effect on inhibitory control and feasibility of administration in community outpatient substance use treatment. Drug Alcohol Depend. 2020, 213, 108132. [Google Scholar] [CrossRef] [PubMed]
  24. Wolinski, N.; Cooper, N.R.; Sauseng, P.; Romei, V. The speed of parietal theta frequency drives visuospatial working memory capacity. PLoS Biol. 2018, 16, e2005348. [Google Scholar] [CrossRef]
  25. Guo, X.; Li, Z.; Zhang, L.; Liu, Q. Modulation of Visual Working Memory Performance via Different Theta Frequency Stimulations. Brain Sci. 2021, 11, 1358. [Google Scholar] [CrossRef]
  26. Feurra, M.; Galli, G.; Pavone, E.F.; Rossi, A.; Rossi, S. Frequency-specific insight into short-term memory capacity. J. Neurophysiol. 2016, 116, 153–158. [Google Scholar] [CrossRef]
  27. Yaple, Z.; Martinez-Saito, M.; Awasthi, B.; Feurra, M.; Shestakova, A.; Klucharev, V. Transcranial Alternating Current Stimulation Modulates Risky Decision Making in a Frequency-Controlled Experiment. eNeuro 2017, 4, 6. [Google Scholar] [CrossRef]
  28. Santarnecchi, E.; Polizzotto, N.R.; Godone, M.; Giovannelli, F.; Feurra, M.; Matzen, L.; Rossi, A.; Rossi, S. Frequency-dependent enhancement of fluid intelligence induced by transcranial oscillatory potentials. Curr. Biol. 2013, 23, 1449–1453. [Google Scholar] [CrossRef] [PubMed]
  29. Thompson, L.; Khuc, J.; Saccani, M.S.; Zokaei, N.; Cappelletti, M. Gamma oscillations modulate working memory recall precision. Exp. Brain Res. 2021, 239, 2711–2724. [Google Scholar] [CrossRef]
  30. Hoy, K.E.; Bailey, N.; Arnold, S.; Windsor, K.; John, J.; Daskalakis, Z.J.; Fitzgerald, P.B. The effect of gamma-tACS on working memory performance in healthy controls. Brain Cogn. 2015, 101, 51–56. [Google Scholar] [CrossRef]
  31. Alekseichuk, I.; Turi, Z.; Amador de Lara, G.; Antal, A.; Paulus, W. Spatial Working Memory in Humans Depends on Theta and High Gamma Synchronization in the Prefrontal Cortex. Curr. Biol. 2016, 26, 1513–1521. [Google Scholar] [CrossRef]
  32. Khanna, A.; Pascual-Leone, A.; Michel, C.M.; Farzan, F. Microstates in resting-state EEG: Current status and future directions. Neurosci. Biobehav. Rev. 2015, 49, 105–113. [Google Scholar] [CrossRef]
  33. Lehmann, D.; Ozaki, H.; Pal, I. EEG alpha map series: Brain micro-states by space-oriented adaptive segmentation. Electroencephalogr. Clin. Neurophysiol. Pract. 1987, 67, 271–288. [Google Scholar] [CrossRef]
  34. Michel, C.M.; Koenig, T. EEG microstates as a tool for studying the temporal dynamics of whole-brain neuronal networks: A review. Neuroimage 2018, 180, 577–593. [Google Scholar] [CrossRef]
  35. Britz, J.; Van De Ville, D.; Michel, C.M. BOLD correlates of EEG topography reveal rapid resting-state network dynamics. Neuroimage 2010, 52, 1162–1670. [Google Scholar] [CrossRef]
  36. Pascual-Marqui, R.D.; Lehmann, D.; Faber, P.; Milz, P.; Kochi, K.; Yoshimura, M.; Nishida, K.; Isotani, T.; Kinoshita, T. The resting microstate networks (RMN): Cortical distributions, dynamics, and frequency specific information flow. arXiv 2014, arXiv:1411.1949. [Google Scholar] [CrossRef]
  37. Custo, A.; Van De Ville, D.; Wells, W.M.; Tomescu, M.I.; Brunet, D.; Michel, C.M. Electroencephalographic Resting-State Networks: Source Localization of Microstates. Brain Connect. 2017, 7, 671–682. [Google Scholar] [CrossRef]
  38. Du, M.; Peng, Y.; Li, Y.; Zhu, Y.; Yang, S.; Li, J.; Zou, F.; Wang, Y.; Wu, X.; Zhang, Y.; et al. Effect of trait anxiety on cognitive flexibility: Evidence from event-related potentials and resting-state EEG. Biol. Psychol. 2022, 170, 108319. [Google Scholar] [CrossRef]
  39. Nash, K.; Kleinert, T.; Leota, J.; Scott, A.; Schimel, J. Resting-state networks of believers and non-believers: An EEG microstate study. Biol. Psychol. 2022, 169, 108283. [Google Scholar] [CrossRef]
  40. Spring, J.N.; Sallard, E.F.; Trabucchi, P.; Millet, G.P.; Barral, J. Alterations in spontaneous electrical brain activity after an extreme mountain ultramarathon. Biol. Psychol. 2022, 171, 108348. [Google Scholar] [CrossRef]
  41. Gao, B.; Suo, D.; Yan, T.; Zhang, J.; Zhang, J.; Funahashi, S.; Wu, J. EEG Microstate Analysis of Transcranial Alternating Current Stimulation in Healthy People. In Proceedings of the 2022 16th ICME International Conference on Complex Medical Engineering (CME), Zhongshan, China, 4–6 November 2022; pp. 165–168. [Google Scholar] [CrossRef]
  42. Da Cruz, J.R.; Favrod, O.; Roinishvili, M.; Chkonia, E.; Brand, A.; Mohr, C.; Figueiredo, P.; Herzog, M.H. EEG microstates are a candidate endophenotype for schizophrenia. Nat. Commun. 2020, 11, 3089. [Google Scholar] [CrossRef]
  43. Yan, T.; Wang, G.; Liu, T.; Li, G.; Wang, C.; Funahashi, S.; Suo, D.; Pei, G. Effects of Microstate Dynamic Brain Network Disruption in Different Stages of Schizophrenia. IEEE Trans. Neural Syst. Rehabil. Eng. 2023, 31, 2688–2697. [Google Scholar] [CrossRef]
  44. Sverak, T.; Albrechtova, L.; Lamos, M.; Rektorova, I.; Ustohal, L. Intensive repetitive transcranial magnetic stimulation changes EEG microstates in schizophrenia: A pilot study. Schizophr. Res. 2018, 193, 451–452. [Google Scholar] [CrossRef]
  45. Kim, K.; Duc, N.T.; Choi, M.; Lee, B. EEG microstate features according to performance on a mental arithmetic task. Sci. Rep. 2021, 11, 343. [Google Scholar] [CrossRef]
  46. Tamano, R.; Ogawa, T.; Katagiri, A.; Cai, C.; Asai, T.; Kawanabe, M. Event-related microstate dynamics represents working memory performance. NeuroImage 2022, 263, 119669. [Google Scholar] [CrossRef]
  47. Andrews, S.C.; Hoy, K.E.; Enticott, P.G.; Daskalakis, Z.J.; Fitzgerald, P.B. Improving working memory: The effect of combining cognitive activity and anodal transcranial direct current stimulation to the left dorsolateral prefrontal cortex. Brain Stimul. 2011, 4, 84–89. [Google Scholar] [CrossRef]
  48. Hoy, K.E.; Whitty, D.; Bailey, N.; Fitzgerald, P.B. Preliminary investigation of the effects of gamma-tACS on working memory in schizophrenia. J. Neural Transm. 2016, 123, 1205–1212. [Google Scholar] [CrossRef]
  49. Owen, A.M.; McMillan, K.M.; Laird, A.R.; Bullmore, E.T. N-back working memory paradigm: A meta-analysis of normative functional neuroimaging studies. Hum. Brain Mapp. 2005, 25, 46–59. [Google Scholar] [CrossRef]
  50. Wang, H.; Shi, Z.; Sun, W.; Zhang, J.; Wang, J.; Shi, Y.; Yang, R.; Li, C.; Chen, D.; Wu, J.; et al. Development of a Non-invasive Deep Brain Stimulator With Precise Positioning and Real-Time Monitoring of Bioimpedance. Front. Neuroinform. 2020, 14, 574189. [Google Scholar] [CrossRef]
  51. Chen, C.; Yuan, K.; Chu, W.C.w.; Tong, R.K.y. The Effects of 10 Hz and 20 Hz tACS in Network Integration and Segregation in Chronic Stroke: A Graph Theoretical fMRI Study. Brain Sci. 2021, 11, 377. [Google Scholar] [CrossRef] [PubMed]
  52. Kim, J.; Jang, K.I.; Roh, D.; Kim, H.; Kim, D.H. A direct comparison of the electrophysiological effects of transcranial direct and alternating current stimulation in healthy subjects. Brain Res. 2020, 1747, 147065. [Google Scholar] [CrossRef]
  53. Delorme, A.; Makeig, S. EEGLAB: An open source toolbox for analysis of single-trial EEG dynamics including independent component analysis. J. Neurosci. Methods 2004, 134, 9–21. [Google Scholar] [CrossRef] [PubMed]
  54. Pernet, C.; Garrido, M.I.; Gramfort, A.; Maurits, N.; Michel, C.M.; Pang, E.; Salmelin, R.; Schoffelen, J.M.; Valdes-Sosa, P.A.; Puce, A. Issues and recommendations from the OHBM COBIDAS MEEG committee for reproducible EEG and MEG research. Nat. Neurosci. 2020, 23, 1473–1483. [Google Scholar] [CrossRef]
  55. Poulsen, A.; Pedroni, A.; Langer, N.; Hansen, L. Microstate EEGlab toolbox An introductory guide. bioRxiv 2018. [Google Scholar] [CrossRef]
  56. Yao, R.; Song, M.; Shi, L.; Pei, Y.; Li, H.; Tan, S.; Wang, B. Microstate D as a Biomarker in Schizophrenia: Insights from Brain State Transitions. Brain Sci. 2024, 14, 985. [Google Scholar] [CrossRef]
  57. Lin, G.; Wu, Z.; Chen, B.; Zhang, M.; Wang, Q.; Liu, M.; Zhang, S.; Yang, M.; Ning, Y.; Zhong, X. Altered Microstate Dynamics and Spatial Complexity in Late-Life Schizophrenia. Front. Psychiatry 2022, 13, 907802. [Google Scholar] [CrossRef]
  58. Lehmann, D.; Skrandies, W. Reference-free identification of components of checkerboard-evoked multichannel potential fields. Electroencephalogr. Clin. Neurophysiol. 1980, 48, 609–621. [Google Scholar] [CrossRef]
  59. Khanna, A.; Pascual-Leone, A.; Farzan, F. Reliability of resting-state microstate features in electroencephalography. PLoS ONE 2014, 9, e114163. [Google Scholar] [CrossRef]
  60. Lehmann, D.; Faber, P.L.; Galderisi, S.; Herrmann, W.M.; Kinoshita, T.; Koukkou, M.; Mucci, A.; Pascual-Marqui, R.D.; Saito, N.; Wackermann, J.; et al. EEG microstate duration and syntax in acute, medication-naïve, first-episode schizophrenia: A multi-center study. Psychiatry Res. Neuroimaging 2005, 138, 141–156. [Google Scholar] [CrossRef]
  61. Lakens, D. Calculating and reporting effect sizes to facilitate cumulative science: A practical primer for t-tests and ANOVAs. Front. Psychol. 2013, 4, 863. [Google Scholar] [CrossRef]
  62. Tait, L.; Zhang, J. +microstate: A MATLAB toolbox for brain microstate analysis in sensor and cortical EEG/MEG. Neuroimage 2022, 258, 119346. [Google Scholar] [CrossRef] [PubMed]
  63. Koenig, T.; Prichep, L.S.; Lehmann, D.; Valdés-Sosa, P.A.; Braeker, E.; Kleinlogel, H.; Isenhart, R.; John, E.R. Millisecond by Millisecond, Year by Year: Normative EEG Microstates and Developmental Stages. NeuroImage 2002, 16, 41–48. [Google Scholar] [CrossRef]
  64. Koenig, T.; Lehmann, D.; Merlo, M.C.G.; Kochi, K.; Hell, D.; Koukkou, M. A deviant EEG brain microstate in acute, neuroleptic-naive schizophrenics at rest. Eur. Arch. Psychiatry Clin. Neurosci. 1999, 249, 205–211. [Google Scholar] [CrossRef]
  65. Reinhart, R.M.G.; Nguyen, J.A. Working memory revived in older adults by synchronizing rhythmic brain circuits. Nat. Neurosci. 2019, 22, 820–827. [Google Scholar] [CrossRef] [PubMed]
  66. Roux, F.; Uhlhaas, P.J. Working memory and neural oscillations: alpha-gamma versus theta-gamma codes for distinct WM information? Trends Cogn. Sci. 2014, 18, 16–25. [Google Scholar] [CrossRef] [PubMed]
  67. Pahor, A.; Jaušovec, N. The Effects of Theta and Gamma tACS on Working Memory and Electrophysiology. Front. Hum. Neurosci. 2017, 11, 651. [Google Scholar] [CrossRef]
  68. Kleinert, M.L.; Szymanski, C.; Müller, V. Frequency-Unspecific Effects of θ-tACS Related to a Visuospatial Working Memory Task. Front. Hum. Neurosci. 2017, 11, 367. [Google Scholar] [CrossRef]
  69. Dowsett, J.; Herrmann, C.S. Transcranial Alternating Current Stimulation with Sawtooth Waves: Simultaneous Stimulation and EEG Recording. Front. Hum. Neurosci. 2016, 10, 135. [Google Scholar] [CrossRef]
  70. Potok, W.; van der Groen, O.; Sivachelvam, S.; Bächinger, M.; Fröhlich, F.; Kish, L.B.; Wenderoth, N. Contrast detection is enhanced by deterministic, high-frequency transcranial alternating current stimulation with triangle and sine waveform. J. Neurophysiol. 2023, 130, 458–473. [Google Scholar] [CrossRef]
  71. Bertrand, O.; Tallon-Baudry, C. Oscillatory gamma activity in humans: A possible role for object representation. Int. J. Psychophysiol. 2000, 38, 211–223. [Google Scholar] [CrossRef]
  72. Witkowski, M.; Garcia-Cossio, E.; Chander, B.S.; Braun, C.; Birbaumer, N.; Robinson, S.E.; Soekadar, S.R. Mapping entrained brain oscillations during transcranial alternating current stimulation (tACS). NeuroImage 2016, 140, 89–98. [Google Scholar] [CrossRef]
  73. Lehmann, D.; Strik, W.; Henggeler, B.; Koenig, T.; Koukkou, M. Brain electric microstates and momentary conscious mind states as building blocks of spontaneous thinking: I. Visual imagery and abstract thoughts. Int. J. Psychophysiol. 1998, 29, 1–11. [Google Scholar] [CrossRef]
  74. Seitzman, B.A.; Abell, M.; Bartley, S.C.; Erickson, M.A.; Bolbecker, A.R.; Hetrick, W.P. Cognitive manipulation of brain electric microstates. NeuroImage 2017, 146, 533–543. [Google Scholar] [CrossRef]
  75. Diaz Hernandez, L.; Rieger, K.; Baenninger, A.; Brandeis, D.; Koenig, T. Towards Using Microstate-Neurofeedback for the Treatment of Psychotic Symptoms in Schizophrenia. A Feasibility Study in Healthy Participants. Brain Topogr. 2016, 29, 308–321. [Google Scholar] [CrossRef]
  76. Spreng, R.N.; Stevens, W.D.; Chamberlain, J.P.; Gilmore, A.W.; Schacter, D.L. Default network activity, coupled with the frontoparietal control network, supports goal-directed cognition. NeuroImage 2010, 53, 303–317. [Google Scholar] [CrossRef]
  77. Roux, F.; Wibral, M.; Mohr, H.M.; Singer, W.; Uhlhaas, P.J. Gamma-Band Activity in Human Prefrontal Cortex Codes for the Number of Relevant Items Maintained in Working Memory. J. Neurosci. 2012, 32, 12411–12420. [Google Scholar] [CrossRef]
  78. Park, J.; Lee, C.; Lee, S.; Im, C.H. 80 Hz but not 40 Hz, transcranial alternating current stimulation of 80 Hz over right intraparietal sulcus increases visuospatial working memory capacity. Sci. Rep. 2022, 12, 13762. [Google Scholar] [CrossRef]
  79. Ochab, J.K.; Wątorek, M.; Ceglarek, A.; Fafrowicz, M.; Lewandowska, K.; Marek, T.; Sikora-Wachowicz, B.; Oświęcimka, P. Task-dependent fractal patterns of information processing in working memory. Sci. Rep. 2022, 12, 17866. [Google Scholar] [CrossRef] [PubMed]
  80. Pileckyte, I.; Soto-Faraco, S. Sensory stimulation enhances visual working memory capacity. Commun. Psychol. 2024, 2, 109. [Google Scholar] [CrossRef] [PubMed]
Figure 1. (A) Overview of the experiment’s design. (B) Overview of the behavioral experiments. (i) The two-back WM task. (ii) The three-back WM task. The letters appeared pseudo-random from A to J. (C) Three types of stimulus waveforms. (i) The sham stimulus. (ii) The sine wave. (iii) The triangular wave. (D) The stimulus electrodes’ setting positions. The two electrodes were applied at the bilateral DLPFC.
Brainsci 15 00381 g001
Figure 2. (A) Behavioral performances of participants in two-back WM tasks. (i) Accuracy comparison in pre-S and post-S stages for each group. (ii) RT comparison in pre-S and post-S stages for each group. (iii) The Δ accuracy across the groups. (iv) The Δ RT across the groups. (B) Behavioral performances of participants in three-back WM tasks. (i) Accuracy comparison in pre-S and post-S stages for each group. (ii) RT comparison in pre-S and post-S stages for each group. (iii) The Δ accuracy across the groups. (iv) The Δ RT across the groups. The black lines represent sham stimulation, the blue lines represent sine stimulation, the red lines represent triangular stimulation, dashed lines indicate the pre-S stage, and solid lines indicate the post-S stage (* p < 0.05; ** p < 0.01; Δ = (post-S − pre-S)/pre-S).
Brainsci 15 00381 g002
Figure 3. The four microstate templates under each stimulation condition. Color is used to depict the voltage, with red indicating positive values and blue indicating negative values. As the microstates were polarity-insensitive, the polarity could be inverted.
Brainsci 15 00381 g003
Figure 4. The statistical results for the (A) duration time, (B) coverage percentage, and (C) occurrence number under the three stimulation conditions. Error graphs show the mean ± SEM of the microstate parameters for the four microstates. The black, blue, and red lines indicate sham, sine, and triangular stimulation, respectively. Hollow circles represent the pre-S period, while solid circles represent the post-S period. The significance markers were the results of the paired t-test after Bonferroni correction (* p < 0.05; ** p < 0.01).
Brainsci 15 00381 g004
Figure 5. The statistical results of the transition probabilities for the four microstates of the (A) sine and (B) triangular groups. A red arrow indicates that the transition from one microstate to another was significantly increased compared with the pre-S stage, and a blue arrow indicates a significant decrease. The significance markers are the results of a paired t-test after Bonferroni correction (* p < 0.05; ** p < 0.01).
Brainsci 15 00381 g005
Figure 6. Correlations between triangular stimulation microstate parameters and three-back task behavior parameters. (A) The (i) coverage and (ii) duration of Class C were positively correlated with the RTs. (B) The transition probabilities of (i) A → B, (ii) B → D, and (iii) D → B were negatively correlated with the RTs, while those of (iv) A → C, (v) B → C, and (vi) D → C were positively correlated with the RTs. Each dot indicates the data of each participant. The range outlined by the dashed lines indicates the 95% confidence interval, and the solid lines represent linear regression. Δ = (post-S − pre-S)/pre-S.
Brainsci 15 00381 g006
Table 1. Demographics of the participants.
ShamSineTriangular χ 2 / t p
(n = 38)(n = 28)(n = 38)
Age (years, mean ± SD)23.9 ± 3.322.8 ± 2.423.5 ± 3.20.9210.401 1
Gender (F/M)23/1517/1124/140.0670.967 2
1 Two-sample t-test. 2 Chi-squared test.
Table 2. Sham vs. sine vs. triangular groups for microstate parameters in post-S period and for each microstate class.
ParameterMicrostateShamSineTriangularSham vs. SineSham vs. TriangularSine vs. Triangular
Mean ± SEMp
Duration (ms)Class A70.95 ± 1.7565.72 ± 1.3967.92 ± 2.740.8291.0001.000
Class B73.52 ± 3.3668.04 ± 1.9173.59 ± 1.910.4310.7380.034(↑)
Class C86.90 ± 2.7284.84 ± 2.8871.72 ± 4.431.000<0.001(↓)<0.001(↓)
Class D79.82 ± 2.8696.70 ± 9.8992.92 ± 2.870.402<0.010(↑)0.676
Coverage (%)Class A21.75 ± 1.4016.73 ± 1.1319.27 ± 1.760.047(↓)0.3520.997
Class B21.26 ± 1.6619.40 ± 1.5524.47 ± 1.211.0000.037(↑)0.010(↑)
Class C29.69 ± 2.5331.52 ± 2.0219.14 ± 2.800.5720.002(↓)<0.001(↓)
Class D27.30 ± 1.8232.35 ± 3.5037.11 ± 1.721.0000.002(↑)0.019(↑)
Occurrence (/s)Class A2.96 ± 0.142.50 ± 0.142.68 ± 0.150.049(↓)0.4530.842
Class B2.77 ± 0.122.76 ± 0.153.26 ± 0.111.0000.002(↑)0.005(↑)
Class C3.28 ± 0.153.26 ± 0.142.27 ± 0.151.000<0.001(↓)0.001(↓)
Class D3.51 ± 0.083.61 ± 0.153.91 ± 0.110.365<0.001(↑)0.123
The up or down arrows indicate significantly increased or decreased results for the corresponding parameters in the corresponding comparisons, respectively (corrected p < 0.05). The values of the microstate parameters (duration, coverage, and occurrence) are represented in the form of mean ± SEM.
Disclaimer/Publisher’s Note: The statements, opinions and data contained in all publications are solely those of the individual author(s) and contributor(s) and not of MDPI and/or the editor(s). MDPI and/or the editor(s) disclaim responsibility for any injury to people or property resulting from any ideas, methods, instructions or products referred to in the content.

