
Early Blood Glucose Level Post-Admission Correlates with the Outcomes and Oxidative Stress in Neonatal Hypoxic-Ischemic Encephalopathy


Abstract
:
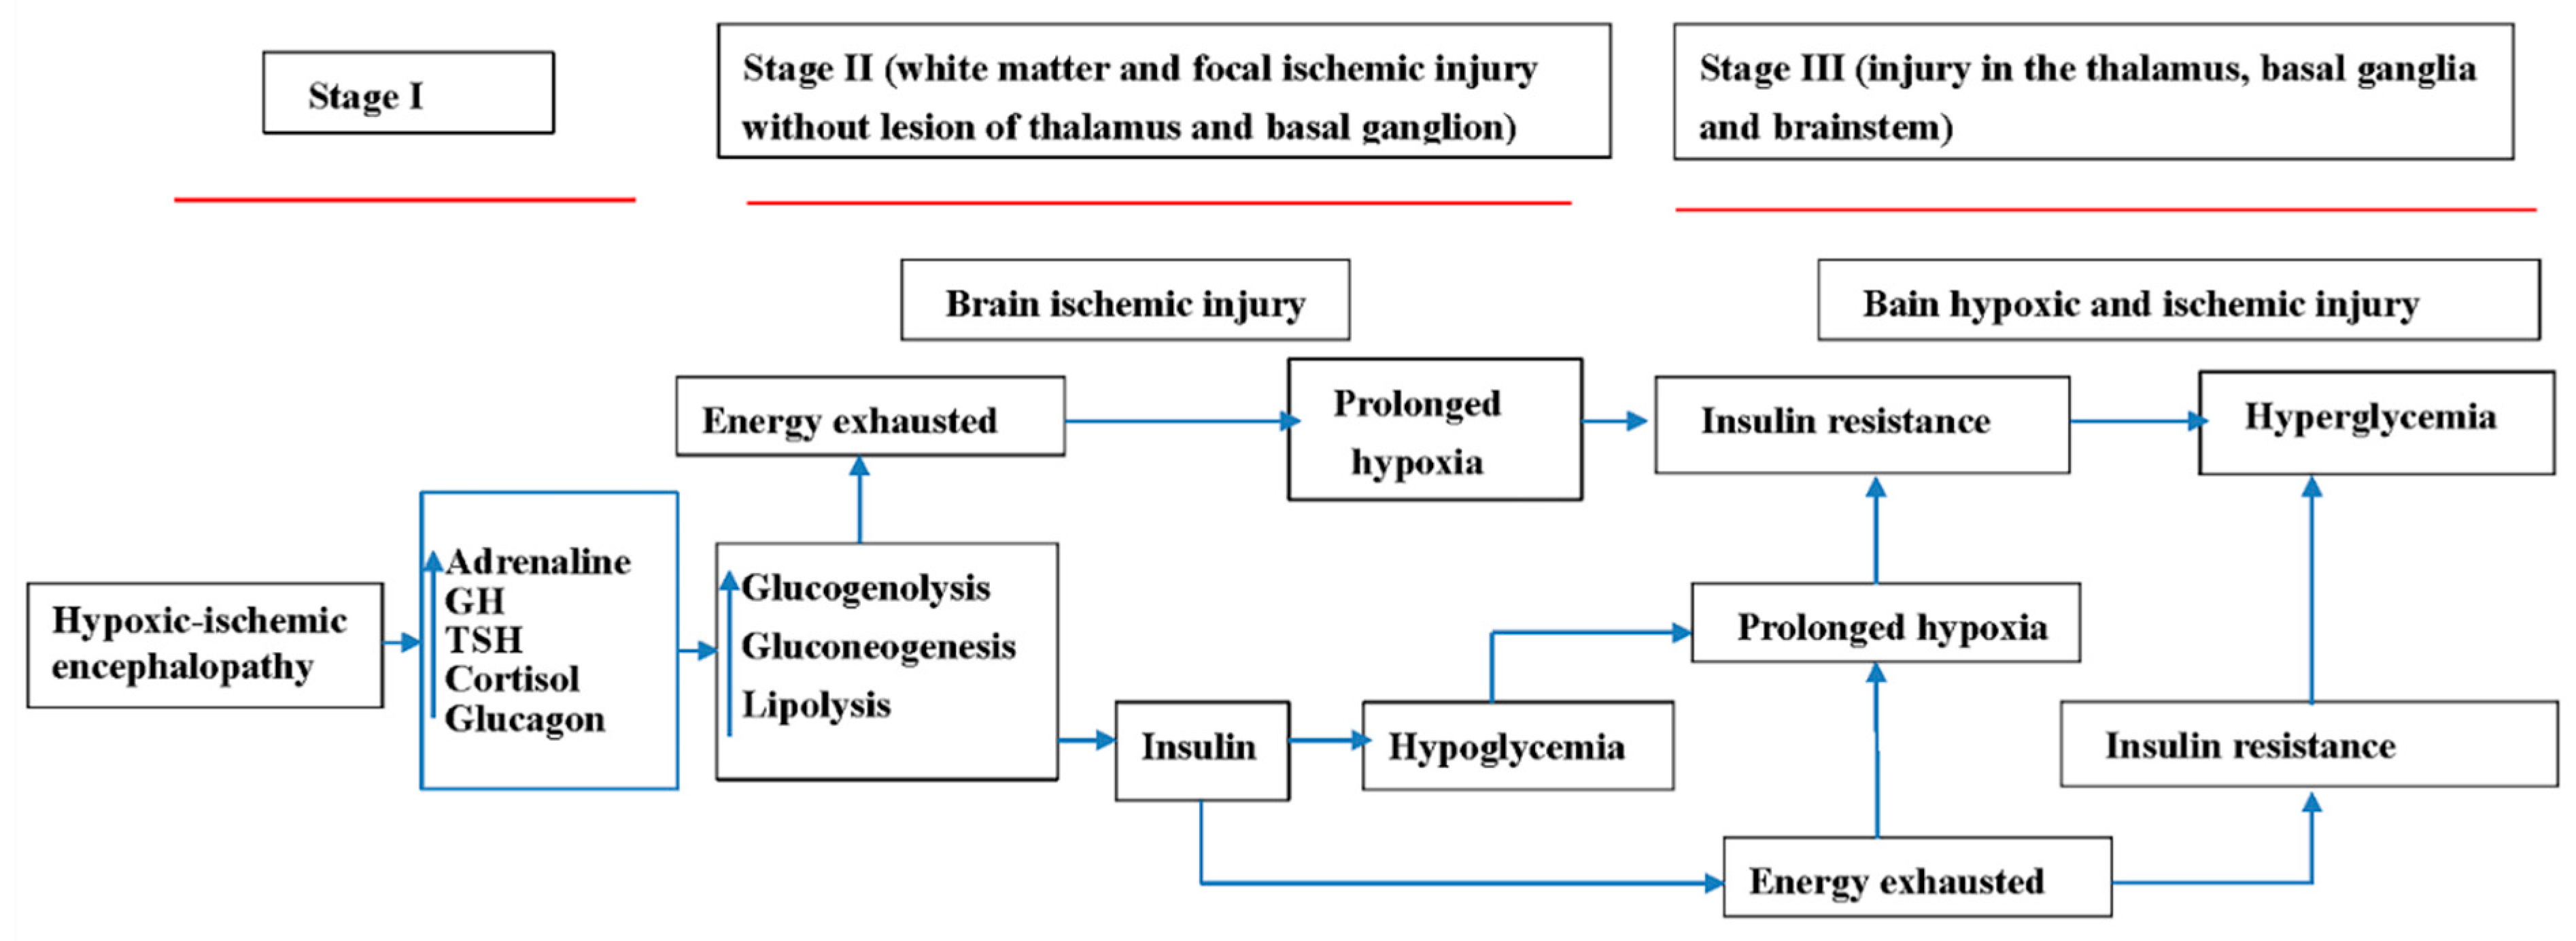
1. Introduction
2. Patients and Methods
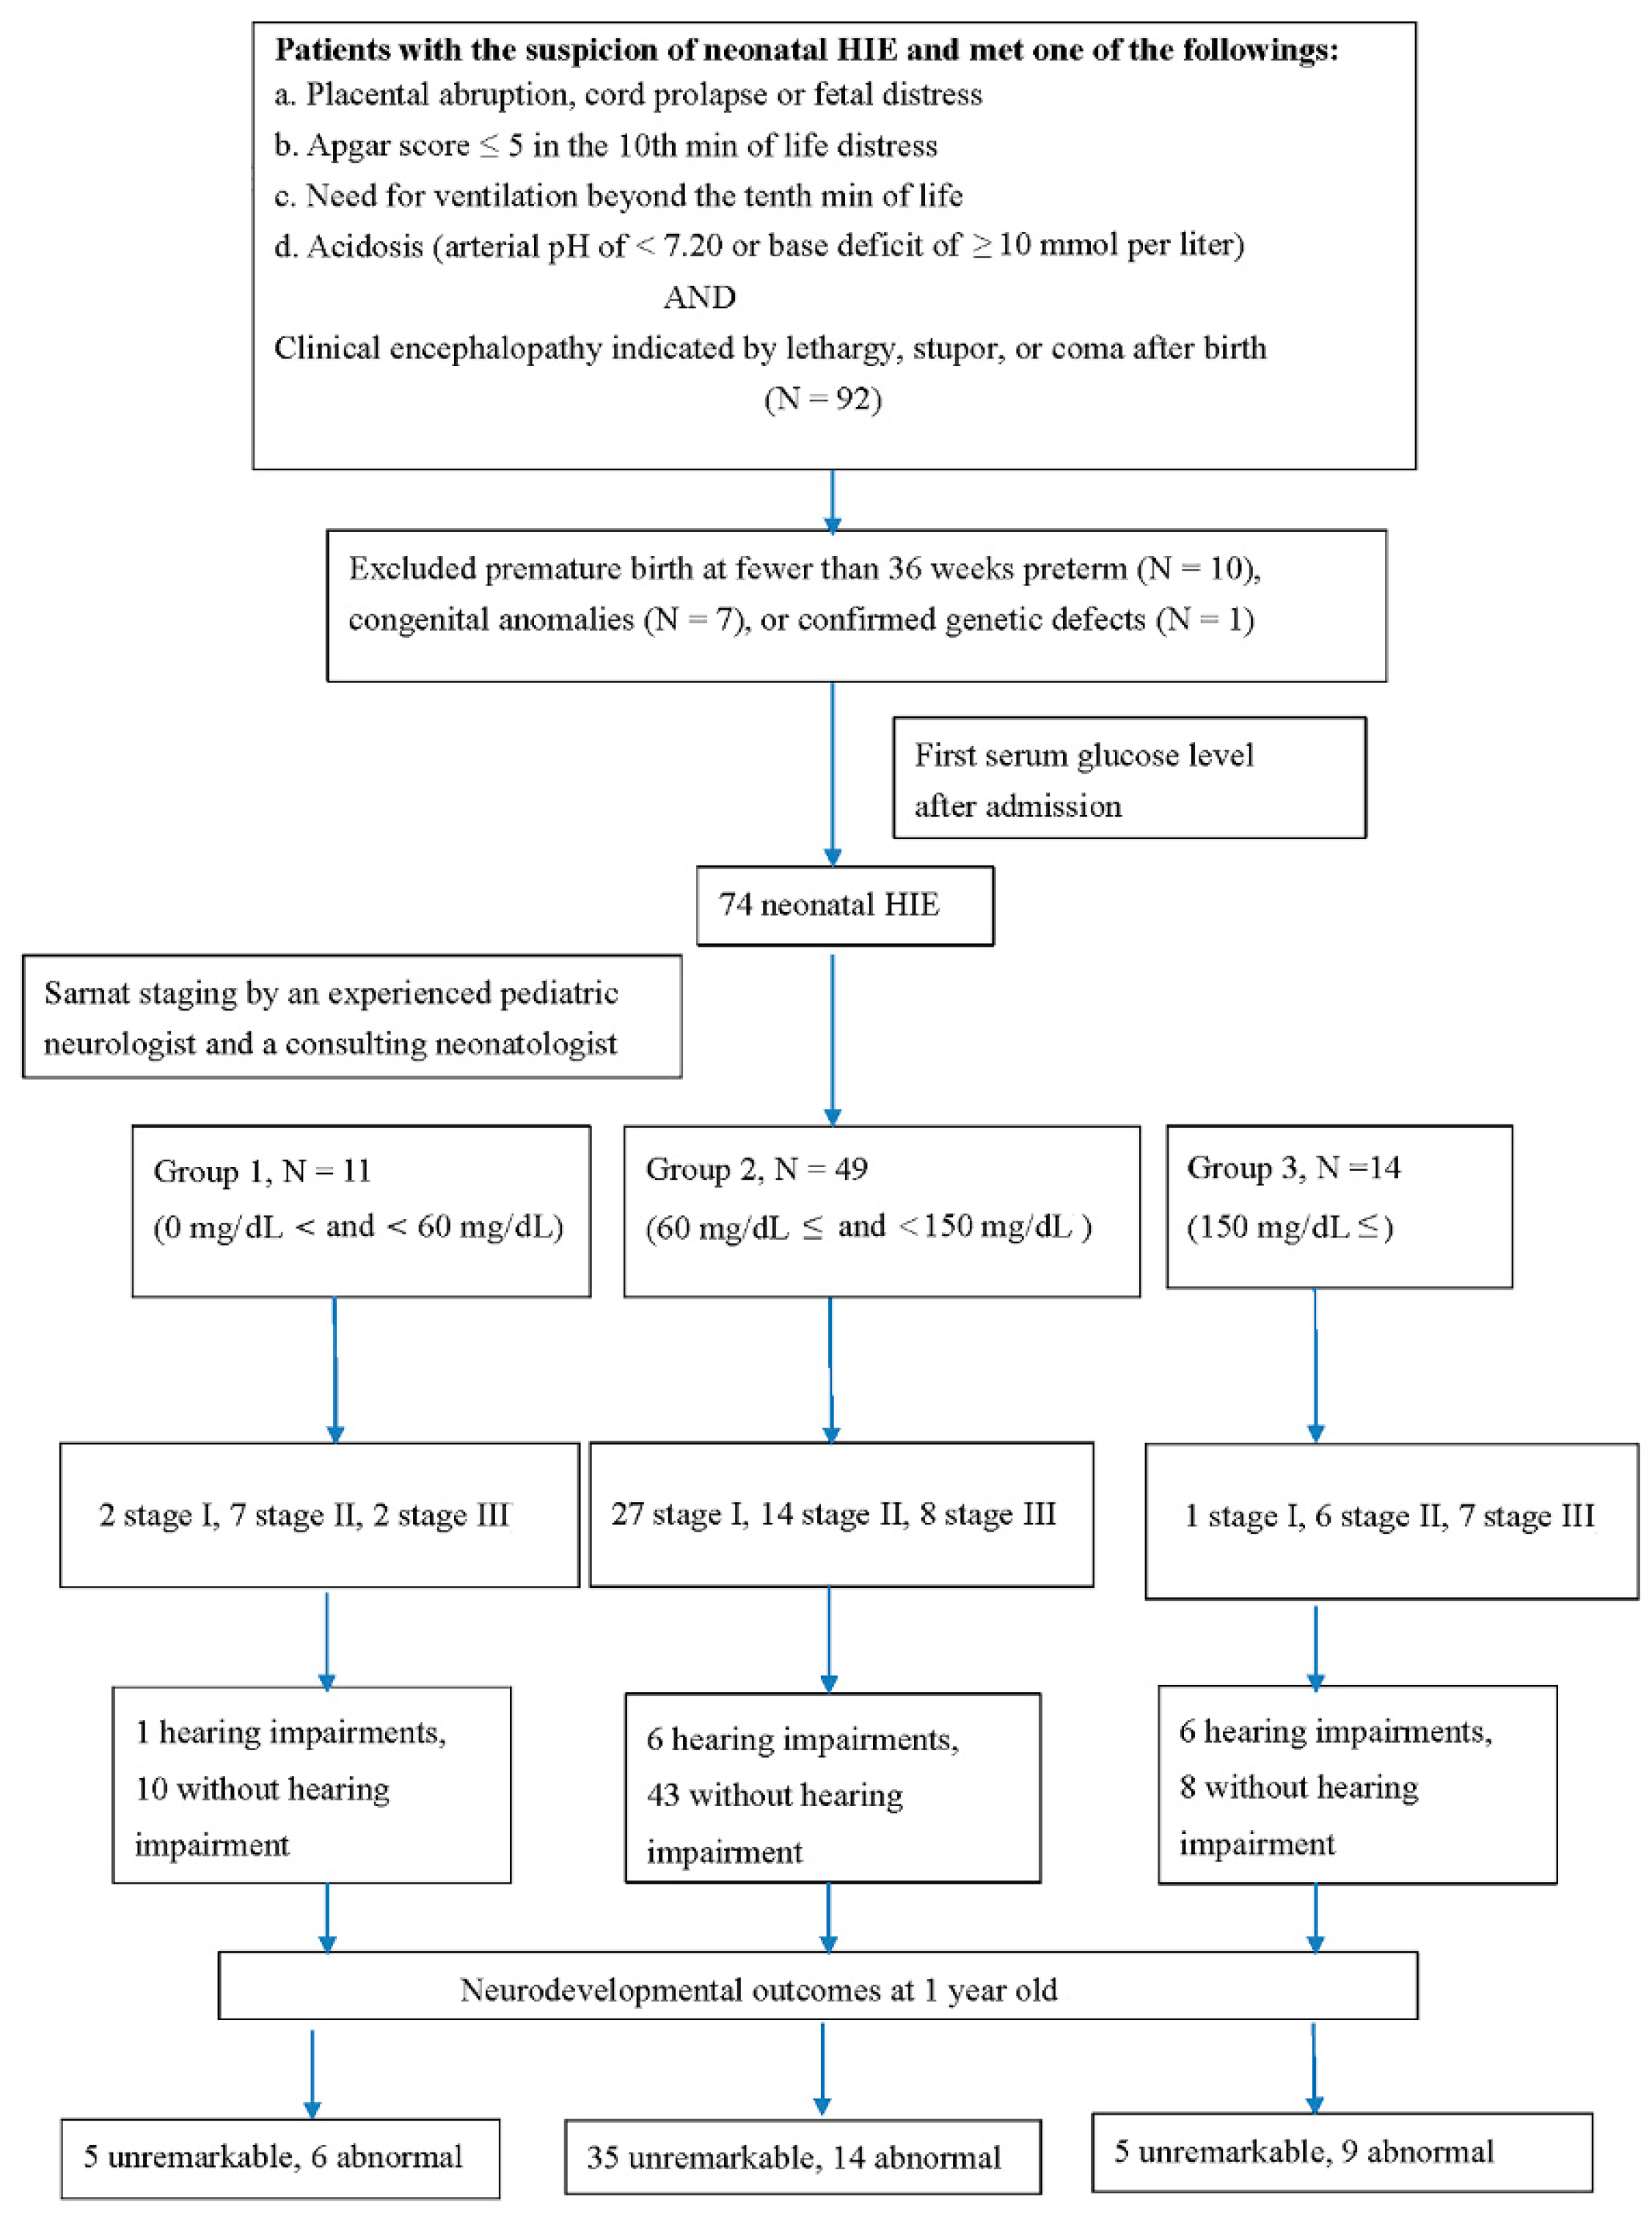
2.1. Patients
2.2. MRI Classification
2.3. Hearing Tests before First Discharge
2.4. Measurement of Neurodevelopmental Outcome at >1 Year of Age
2.5. Statistical Analysis
2.6. Informed Consent Statement
3. Results
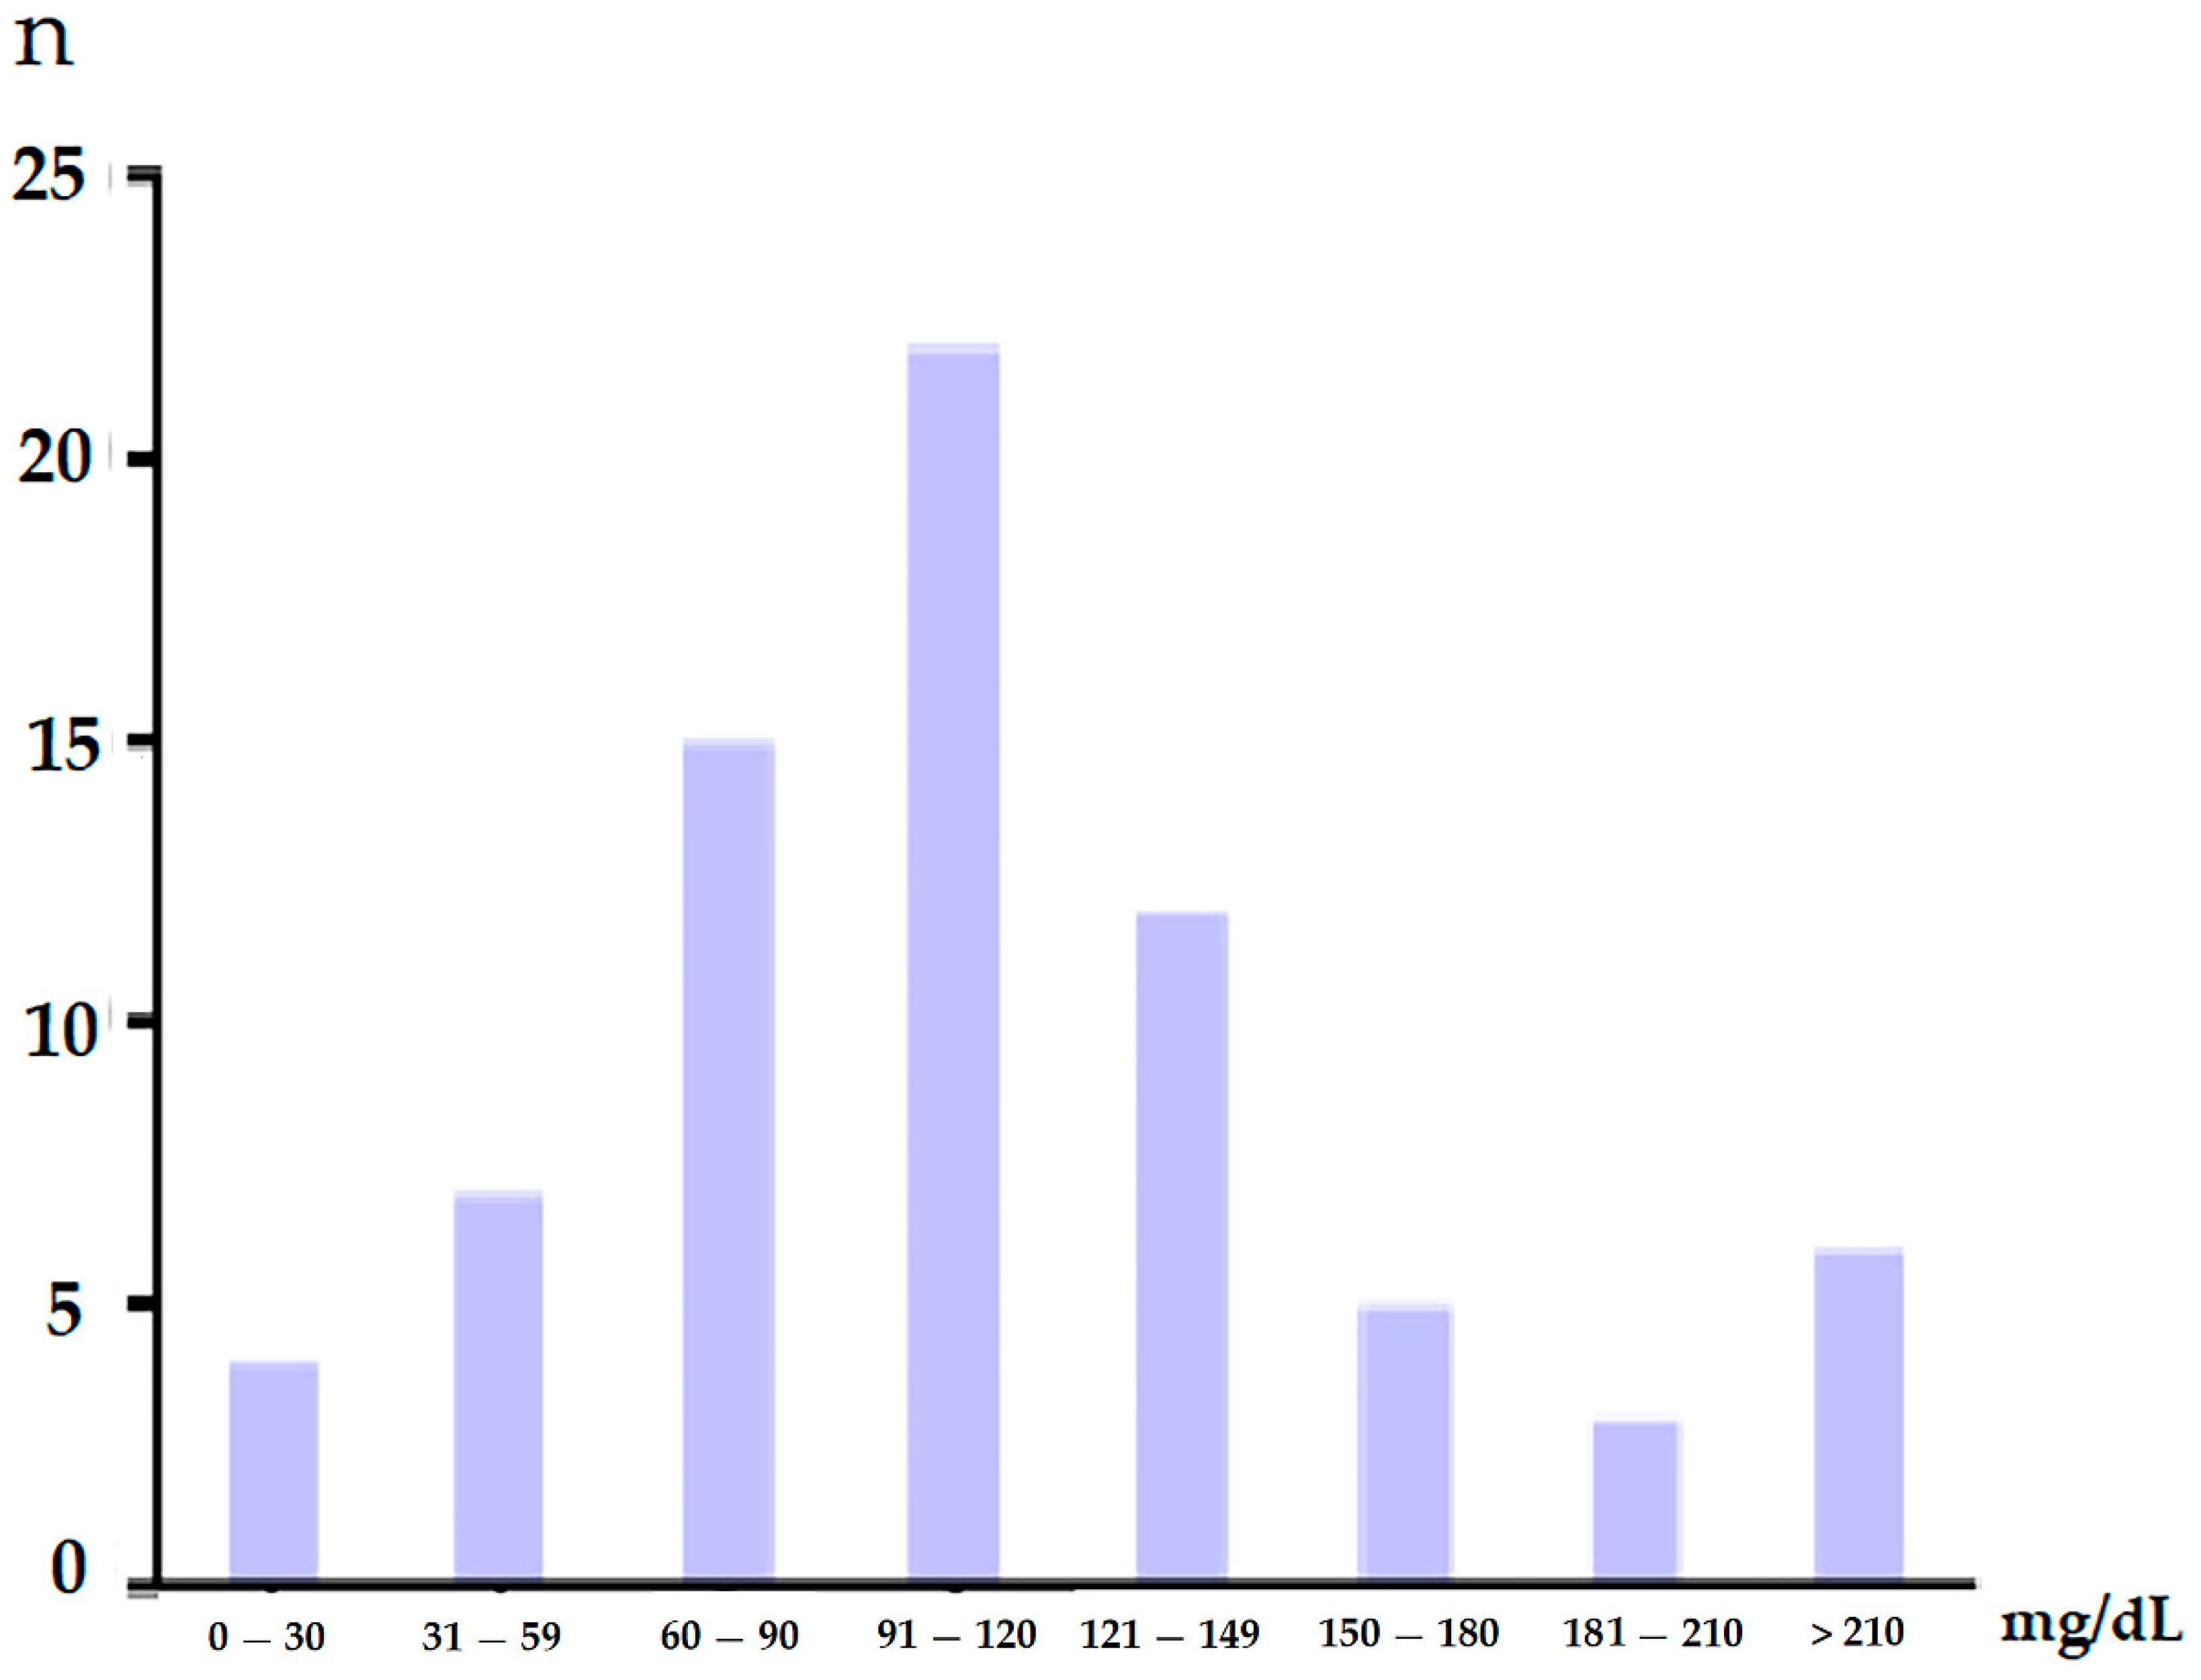
3.1. Demographic Data in Newborns with HIEs
3.2. Clinical Staging and Glucose Level
3.3. Correlation of Parenchymal Brain Lesion and Glucose Level
3.4. Correlation of Hearing Impairments and Glucose Level
3.5. Correlation of Neurodevelopmental Outcomes and Glucose Level
3.6. The Differences of Other Blood Biomarkers in the Group 1, Group 2, and Group 3 Patients
4. Discussion
5. Conclusions
Author Contributions
Funding
Institutional Review Board Statement
Informed Consent Statement
Data Availability Statement
Acknowledgments
Conflicts of Interest
References
- Badurdeen, S.; Roberts, C.; Blank, D.; Miller, S.; Stojanovska, V.; Davis, P.; Hooper, S.; Polglase, G. Haemodynamic Instability and Brain Injury in Neonates Exposed to Hypoxia(-)Ischaemia. Brain Sci. 2019, 9, 49. [Google Scholar] [CrossRef] [Green Version]
- Armstrong, K.; Franklin, O.; Sweetman, D.; Molloy, E.J. Cardiovascular dysfunction in infants with neonatal encephalopathy. Arch. Dis. Child. 2012, 97, 372–375. [Google Scholar] [CrossRef]
- Saugstad, O.D.; Rootwelt, T.; Aalen, O. Resuscitation of asphyxiated newborn infants with room air or oxygen: An international controlled trial: The Resair 2 study. Pediatrics 1998, 102, e1. [Google Scholar] [CrossRef] [Green Version]
- Deorari, A.K.; Broor, S.; Maitreyi, R.S.; Agarwal, D.; Kumar, H.; Paul, V.K.; Singh, M. Incidence, clinical spectrum, and outcome of intrauterine infections in neonates. J. Trop. Pediatr. 2000, 46, 155–159. [Google Scholar] [CrossRef] [PubMed] [Green Version]
- Azzopardi, D.V.; Strohm, B.; Edwards, A.D.; Dyet, L.; Halliday, H.L.; Juszczak, E.; Kapellou, O.; Levene, M.; Marlow, N.; Porter, E.; et al. Moderate hypothermia to treat perinatal asphyxial encephalopathy. N. Engl. J. Med. 2009, 361, 1349–1358. [Google Scholar] [CrossRef] [Green Version]
- Edwards, A.D.; Brocklehurst, P.; Gunn, A.J.; Halliday, H.; Juszczak, E.; Levene, M.; Strohm, B.; Thoresen, M.; Whitelaw, A.; Azzopardi, D. Neurological outcomes at 18 months of age after moderate hypothermia for perinatal hypoxic ischaemic encephalopathy: Synthesis and meta-analysis of trial data. BMJ 2010, 340, c363. [Google Scholar] [CrossRef] [Green Version]
- Nakamura, T.; Asanuma, H.; Kusuda, S.; Imai, K.; Hosono, S.; Kato, R.; Suzuki, S.; Yokoi, K.; Kokubo, M.; Yamada, S.; et al. Multicenter study for brain/body hypothermia for hypoxic-ischemic encephalopathy: Changes in HMGB-1. Pediatr. Int. 2017, 59, 1074–1079. [Google Scholar] [CrossRef]
- Laptook, A.; Tyson, J.; Shankaran, S.; McDonald, S.; Ehrenkranz, R.; Fanaroff, A.; Donovan, E.; Goldberg, R.; O’Shea, T.M.; Higgins, R.D.; et al. Elevated temperature after hypoxic-ischemic encephalopathy: Risk factor for adverse outcomes. Pediatrics 2008, 122, 491–499. [Google Scholar] [CrossRef] [PubMed] [Green Version]
- Murray, D.M. Biomarkers in neonatal hypoxic-ischemic encephalopathy-Review of the literature to date and future directions for research. Handb. Clin. Neurol. 2019, 162, 281–293. [Google Scholar]
- El-Dib, M.; Parziale, M.P.; Johnson, L.; Benson, C.B.; Grant, P.E.; Robinson, J.; Volpe, J.J.; Inder, T. Encephalopathy in neonates with subgaleal hemorrhage is a key predictor of outcome. Pediatr. Res. 2019, 86, 234–241. [Google Scholar] [CrossRef] [PubMed]
- Chakkarapani, E.; Davis, J.; Thoresen, M. Therapeutic hypothermia delays the C-reactive protein response and suppresses white blood cell and platelet count in infants with neonatal encephalopathy. Arch. Dis. Child. Fetal Neonatal Ed. 2014, 99, F458–F463. [Google Scholar] [CrossRef]
- Goswami, I.R.; Whyte, H.; Wintermark, P.; Mohammad, K.; Shivananda, S.; Louis, D.; Yoon, E.W.; Shah, P.S. Characteristics and short-term outcomes of neonates with mild hypoxic-ischemic encephalopathy treated with hypothermia. J. Perinatol. 2020, 40, 275–283. [Google Scholar] [CrossRef] [PubMed]
- Saw, C.L.; Rakshasbhuvankar, A.; Rao, S.; Bulsara, M.; Patole, S. Current Practice of Therapeutic Hypothermia for Mild Hypoxic Ischemic Encephalopathy. J. Child Neurol. 2019, 34, 402–409. [Google Scholar] [CrossRef]
- DuPont, T.L.; Chalak, L.F.; Morriss, M.C.; Burchfield, P.J.; Christie, L.; Sanchez, P.J. Short-term outcomes of newborns with perinatal acidemia who are not eligible for systemic hypothermia therapy. J. Pediatr. 2013, 162, 35–41. [Google Scholar] [CrossRef] [Green Version]
- Schmidt-Kastner, R. Genomic approach to selective vulnerability of the hippocampus in brain ischemia-hypoxia. Neuroscience 2015, 309, 259–279. [Google Scholar] [CrossRef] [PubMed]
- Alexander, G.E.; Crutcher, M.D. Functional architecture of basal ganglia circuits: Neural substrates of parallel processing. Trends Neurosci. 1990, 13, 266–271. [Google Scholar] [CrossRef]
- McQuillen, P.S.; Sheldon, R.A.; Shatz, C.J.; Ferriero, D.M. Selective vulnerability of subplate neurons after early neonatal hypoxia-ischemia. J. Neurosci. 2003, 23, 3308–3315. [Google Scholar] [CrossRef] [Green Version]
- Johnston, M.V.; Trescher, W.H.; Ishida, A.; Nakajima, W. Neurobiology of hypoxic-ischemic injury in the developing brain. Pediatr. Res. 2001, 49, 735–741. [Google Scholar] [CrossRef]
- Nakajima, W.; Ishida, A.; Lange, M.S.; Gabrielson, K.L.; Wilson, M.A.; Martin, L.J.; Blue, M.E.; Johnston, M.V. Apoptosis has a prolonged role in the neurodegeneration after hypoxic ischemia in the newborn rat. J. Neurosci. 2000, 20, 7994–8004. [Google Scholar] [CrossRef] [Green Version]
- Li, Y.; Powers, C.; Jiang, N.; Chopp, M. Intact, Injured, Necrotic and apoptotic cells after focal cerebral ischemia in the rat. J. Neurol. Sci. 1998, 156, 119–132. [Google Scholar] [CrossRef]
- Arteaga, O.; Álvarez, A.; Revuelta, M.; Santaolalla, F.; Urtasun, A.; Hilario, E. Role of Antioxidants in Neonatal Hypoxic-Ischemic Brain Injury: New Therapeutic Approaches. Int. J. Mol. Sci. 2017, 18, 265. [Google Scholar] [CrossRef] [PubMed] [Green Version]
- Wu, Q.; Chen, W.; Sinha, B.; Tu, Y.; Manning, S.; Thomas, N.; Zhou, S.; Jiang, H.; Ma, H.; Kroessler, D.A.; et al. Neuroprotective agents for neonatal hypoxic-ischemic brain injury. Drug Discov. Today 2015, 20, 1372–1381. [Google Scholar] [CrossRef] [Green Version]
- Davidson, J.O.; Wassink, G.; van den Heuij, L.G.; Bennet, L.; Gunn, A.J. Therapeutic Hypothermia for Neonatal Hypoxic-Ischemic Encephalopathy—Where to from Here? Front. Neurol. 2015, 6, 198. [Google Scholar] [CrossRef] [Green Version]
- Vannucci, R.C. Experimental biology of cerebral hypoxia-ischemia: Relation to perinatal brain damage. Pediatr. Res. 1990, 27, 317–326. [Google Scholar] [CrossRef] [Green Version]
- Jensen, A.; Berger, R. Fetal circulatory responses to oxygen lack. J. Dev. Physiol. 1991, 16, 181–207. [Google Scholar]
- Esih, K.; Goričar, K.; Soltirovska-Šalamon, A.; Dolžan, V.; Rener-Primec, Z. Genetic Polymorphisms, Gene-Gene Interactions and Neurologic Sequelae at Two Years Follow-Up in Newborns with Hypoxic-Ischemic Encephalopathy Treated with Hypothermia. Antioxidants 2021, 10, 1495. [Google Scholar] [CrossRef] [PubMed]
- Esih, K.; Goričar, K.; Dolžan, V.; Rener-Primec, Z. The association between antioxidant enzyme polymorphisms and cerebral palsy after perinatal hypoxic-ischaemic encephalopathy. Eur. J. Paediatr. Neurol. 2016, 20, 704–708. [Google Scholar] [CrossRef] [PubMed]
- Qin, X.; Cheng, J.; Zhong, Y.; Mahgoub, O.K.; Akter, F.; Fan, Y.; Aldughaim, M.; Xie, Q.; Qin, L.; Gu, L.; et al. Mechanism and Treatment Related to Oxidative Stress in Neonatal Hypoxic-Ischemic Encephalopathy. Front. Mol. Neurosci. 2019, 12, 88. [Google Scholar] [CrossRef]
- Piwkowska, A.; Rogacka, D.; Audzeyenka, I.; Jankowski, M.; Angielski, S. High glucose concentration affects the oxidant-antioxidant balance in cultured mouse podocytes. J. Cell. Biochem. 2011, 112, 1661–1672. [Google Scholar] [CrossRef]
- Cascant-Vilaplana, M.M.; Sánchez-Illana, Á.; Piñeiro-Ramos, J.D.; Llorens-Salvador, R.; Quintás, G.; Oger, C.; Galano, J.M.; Vigor, C.; Durand, T.; Kuligowski, J.; et al. Do Levels of Lipid Peroxidation Biomarkers Reflect the Degree of Brain Injury in Newborns? Antioxid. Redox Signal. 2021, 35, 1467–1475. [Google Scholar] [CrossRef]
- Vlassaks, E.; Nikiforou, M.; Strackx, E.; Hütten, M.; Bekers, O.; Gazzolo, D.; Li Volti, G.; Martinez-Martinez, P.; Kramer, B.W.; Gavilanes, A.W. Acute and chronic immunomodulatory changes in rat liver after fetal and perinatal asphyxia. J. Dev. Orig. Health Dis. 2014, 5, 98–108. [Google Scholar] [CrossRef]
- Nicholl, R. What is the normal range of blood glucose concentrations in healthy term newborns? Arch. Dis. Child. 2003, 88, 238–239. [Google Scholar] [CrossRef] [Green Version]
- Brooks, G.A.; Butterfield, G.E.; Wolfe, R.R.; Groves, B.M.; Mazzeo, R.S.; Sutton, J.R.; Wolfel, E.E.; Reeves, J.T. Increased dependence on blood glucose after acclimatization to 4300 m. J. Appl. Physiol. 1991, 70, 919–927. [Google Scholar] [CrossRef] [PubMed]
- Oltmanns, K.M.; Gehring, H.; Rudolf, S.; Schultes, B.; Rook, S.; Schweiger, U.; Born, J.; Fehm, H.L.; Peters, A. Hypoxia causes glucose intolerance in humans. Am. J. Respir. Crit. Care Med. 2004, 169, 1231–1237. [Google Scholar] [CrossRef] [PubMed] [Green Version]
- Polotsky, V.Y.; Li, J.; Punjabi, N.M.; Rubin, A.E.; Smith, P.L.; Schwartz, A.R.; O’Donnell, C.P. Intermittent hypoxia increases insulin resistance in genetically obese mice. J. Physiol. 2003, 552, 253–264. [Google Scholar] [CrossRef] [PubMed]
- Cheng, N.; Cai, W.; Jiang, M.; Wu, S. Effect of hypoxia on blood glucose, hormones, and insulin receptor functions in newborn calves. Pediatr. Res. 1997, 41, 852–856. [Google Scholar] [CrossRef] [Green Version]
- Chen, X.Q.; Dong, J.; Niu, C.Y.; Fan, J.M.; Du, J.Z. Effects of hypoxia on glucose, insulin, glucagon, and modulation by corticotropin-releasing factor receptor type 1 in the rat. Endocrinology 2007, 148, 3271–3278. [Google Scholar] [CrossRef]
- Raff, H.; Bruder, E.D.; Jankowski, B.M. The effect of hypoxia on plasma leptin and insulin in newborn and juvenile rats. Endocrine 1999, 11, 37–39. [Google Scholar] [CrossRef]
- Sawhney, R.C.; Malhotra, A.S.; Singh, T. Glucoregulatory hormones in man at high altitude. Eur. J. Appl. Physiol. Occup. Physiol. 1991, 62, 286–291. [Google Scholar] [CrossRef]
- Young, P.M.; Sutton, J.R.; Green, H.J.; Reeves, J.T.; Rock, P.B.; Houston, C.S.; Cymerman, A. Operation Everest II: Metabolic and hormonal responses to incremental exercise to exhaustion. J. Appl. Physiol. 1992, 73, 2574–2579. [Google Scholar] [CrossRef]
- Wong, D.S.; Poskitt, K.J.; Chau, V.; Miller, S.P.; Roland, E.; Hill, A.; Tam, E.W. Brain injury patterns in hypoglycemia in neonatal encephalopathy. AJNR Am. J. Neuroradiol. 2013, 34, 1456–1461. [Google Scholar] [CrossRef] [PubMed] [Green Version]
- Basu, S.K.; Ottolini, K.; Govindan, V.; Mashat, S.; Vezina, G.; Wang, Y.; Ridore, M.; Chang, T.; Kaiser, J.R.; Massaro, A.N. Early Glycemic Profile Is Associated with Brain Injury Patterns on Magnetic Resonance Imaging in Hypoxic Ischemic Encephalopathy. J. Pediatr. 2018, 203, 137–143. [Google Scholar] [CrossRef] [PubMed]
- Tam, E.W.; Haeusslein, L.A.; Bonifacio, S.L.; Glass, H.C.; Rogers, E.E.; Jeremy, R.J.; Barkovich, A.J.; Ferriero, D.M. Hypoglycemia is associated with increased risk for brain injury and adverse neurodevelopmental outcome in neonates at risk for encephalopathy. J. Pediatr. 2012, 161, 88–93. [Google Scholar] [CrossRef] [PubMed] [Green Version]
- Basu, S.K.; Kaiser, J.R.; Guffey, D.; Minard, C.G.; Guillet, R.; Gunn, A.J. Hypoglycaemia and hyperglycaemia are associated with unfavourable outcome in infants with hypoxic ischaemic encephalopathy: A post hoc analysis of the CoolCap Study. Arch. Dis. Child. Fetal Neonatal Ed. 2016, 101, F149–F155. [Google Scholar] [CrossRef] [PubMed] [Green Version]
- Al Shafouri, N.; Narvey, M.; Srinivasan, G.; Vallance, J.; Hansen, G. High glucose variability is associated with poor neurodevelopmental outcomes in neonatal hypoxic ischemic encephalopathy. J. Neonatal-Perinat. Med. 2015, 8, 119–124. [Google Scholar] [CrossRef]
- Fitzgerald, M.P.; Reynolds, A.; Garvey, C.M.; Norman, G.; King, M.D.; Hayes, B.C. Hearing impairment and hypoxia ischaemic encephalopathy: Incidence and associated factors. Eur. J. Paediatr. Neurol. 2019, 23, 81–86. [Google Scholar] [CrossRef] [Green Version]
- Wroblewska-Seniuk, K.E.; Dabrowski, P.; Szyfter, W.; Mazela, J. Universal newborn hearing screening: Methods and results, obstacles, and benefits. Pediatr. Res. 2017, 81, 415–422. [Google Scholar] [CrossRef]
- Hsueh, C.Y.; Huang, C.Y.; Yang, C.F.; Chang, C.C.; Lin, W.S.; Cheng, H.L.; Wu, S.L.; Cheng, Y.F.; Niu, D.M. Hearing characteristics of infantile-onset Pompe disease after early enzyme-replacement therapy. Orphanet J. Rare Dis. 2021, 16, 348. [Google Scholar] [CrossRef]
- Viswanathan, N.; Vidler, M.; Richard, B. Hearing thresholds in newborns with a cleft palate assessed by auditory brain stem response. Cleft Palate-Craniofac. J. 2008, 45, 187–192. [Google Scholar] [CrossRef]
- Tas, E.; Garibaldi, L.; Muzumdar, R. Glucose Homeostasis in Newborns: An Endocrinology Perspective. NeoReviews 2020, 21, e14–e29. [Google Scholar] [CrossRef]
- Hoehn, K.L.; Salmon, A.B.; Hohnen-Behrens, C.; Turner, N.; Hoy, A.J.; Maghzal, G.J.; Stocker, R.; Van Remmen, H.; Kraegen, E.W.; Cooney, G.J.; et al. Insulin resistance is a cellular antioxidant defense mechanism. Proc. Natl. Acad. Sci. USA 2009, 106, 17787–17792. [Google Scholar] [CrossRef] [PubMed] [Green Version]


| First Glucose Level after Admission | >0 mg/dL and <60 mg/dL | ≥60 mg/dL and <150 mg/dL | ≥150 mg/dL | p between Group 1 and Group 2 | p between Group 2 and Group 3 | p between Group 1 and Group 3 |
|---|---|---|---|---|---|---|
| (Group 1, n = 11) | (Group 2, n = 49) | (Group 3, n = 14) | ||||
| Mean ± SD (Range) | 35.1 ± 19.3 (9.0–58.0) | 104.4 ± 23.4 (60.0–145.0) | 222.0 ± 62.4 (152.0–332.0) | |||
| Gestational age (weeks) | 38.3 ± 2.0 | 38.7 ± 1.3 | 38.6 ± 1.2 | t(58) = −1.13, p = 0.263 | t(61) = −0.628, p = 0.533 | t(23) = −0.47, p = 0.642 |
| Birth weight (gm) | 3251.2 ± 729.1 | 2972.2 ± 368.6 | 2798.3 ± 446.2 | t(58) = 1.77, p = 0.082 | t(61) = −1.4, p = 0.164 | t(23) = 1.82, p = 0.084 |
| Gender | ||||||
| Male | 6 (54.5%) | 27 (55.1%) | 8 (57.1%) | χ2 (1, n = 60) = 0.01, p = 0.973 | χ2 (1, n = 63) = 0.02, p = 0.892 | χ2 (1, n = 25) = 0.02, p = 0.897 |
| Female | 5 (45.5%) | 22 (44.9%) | 6 (42.9%) | |||
| Inborn | 5 (45.5%) | 19 (38.8%) | 5 (35.7%) | χ2 (1, n = 60) = 0.17, p = 0.683 | χ2 (1, n = 63) = 0.04, p = 0.835 | χ2 (1, n = 25) = 0.24, p = 0.623 |
| Outborn | 6 (54.5%) | 30 (61.2%) | 9 (64.3%) | |||
| Method of delivery | ||||||
| Cesarean section | 4 (36.4%) | 18 (36.7%) | 5 (35.7%) | χ2 (1, n = 60) = 0.01, p = 0.982 | χ2 (1, n = 63) = 0.01, p = 0.944 | χ2 (1, n = 25) = 0.01, p = 0.973 |
| Vaginal delivery | 7 (63.6%) | 31 (63.3%) | 9 (64.3%) | |||
| Apgar score at one minute | 4.4 ± 2.1 | 3.7 ± 2.1 | 3.5 ± 2.9 | t(58) = 0.74, p = 0.466 | t(61) = 0.45, p = 0.656 | t(23) = 1.01, p = 0.325 |
| Apgar score at five minutes | 6.3 ± 2.1 | 5.4 ± 2.4 | 4.7 ± 2.6 | t(58) = −0.86, p = 0.397 | t(61) = 0.93, p = 0.358 | t(23) = 1.85, p = 0.078 |
| Group 1, n = 11 | Group 2, n = 49 | Group 3, n = 14 | p Values Among Group 1, Group 2, and Group 3 | p Values between Group 1 and Group 3 | |
|---|---|---|---|---|---|
| Clinical staging | |||||
| Stage I (n = 30) | 2 (18.2%) | 27 (55.1%) | 1 (7.1%) | χ2 (4, n = 74) = 16.5, p= 0.002 | χ2 (2, n = 25) = 2.9, p = 0.238 |
| Stage II (n = 22) | 7 (63.6%) | 14 (28.6%) | 6 (42.9%) | ||
| Stage III (n = 22) | 2 (18.2%) | 8 (16.3%) | 7 (50.0%) | ||
| Image finding + | |||||
| Patients without detected lesion in brain parenchyma (n = 46) | 4 (36.4%) | 37 (75.5%) | 5 (35.7%) | χ2 (2, n = 74) = 11.0, p = 0.004 | χ2 (1, n = 25) = 0.001, p = 0.97 |
| Patients with detected lesion in brain parenchyma (n = 28) | 7 (63.6%) | 12 (24.5%) | 9 (64.3%) | ||
| Abnormal MRI or CT | |||||
| Basal ganglion, thalamus, and brain stem (n = 20) | 1 (14.3%) | 10 (83.3%) (8 cases > 110 mg/ dL) | 9 (100%) | χ2 (2, n = 28) = 12.3, p = 0.002 | χ2 (1, n =16) = 8.9, p = 0.002 |
| White matter or focal ischemic injury without lesion of basal ganglion, thalamus, and brain stem (n = 8) | 6 (85.7%) | 2 (16.7%) | 0 (0%) | ||
| Hearing outcomes | |||||
| Patients with hearing impairments (n = 13) | 1 (8.1%) | 6 (12.2%) | 6 (42.9%) | χ2 (2, n = 74) = 7.7, p = 0.021 | χ2 (1, n = 25) = 3.5, p = 0.062 |
| Patients without hearing impairments (n = 61) | 10 (91.9%) | 43 (87.8%) | 8 (57.1%) | ||
| Neurodevelopmental outcomes at 1 year old | |||||
| Unremarkable (n = 45) | 5 (45.5%) | 35 (71.4%) | 5 (35.7%) | χ2 (2, n = 74) = 7.11, p= 0.029 | χ2 (1, n = 25) = 0.24, p = 0.622 |
| Abnormal (n = 29) | 6 (54.5%) | 14 (28.6%) | 9 (64.3%) |
| Biomarkers | Group 1, n = 11 | Group 2, n = 49 | Group 3, n = 14 | p Values between Group 1 and Group 2 | p Values between Group 2 and Group 3 | p Values between Group 1 and Group 3 |
|---|---|---|---|---|---|---|
| WBCs (9100–34,000 mm3 µL) | 23,372.0 ± 17,485.5 | 19,784.2 ± 7501.3 | 23,688.6 ± 8536.4 | U = 199, p = 0.935 | U = 214, p = 0.072 | U = 41, p = 0.166 |
| Platelet (84–478 mm3 µL) | 164,888.9 ± 58,650.3 | 238,977.8 ± 74,946.5 | 246,714.3 ± 67,271.5 | U = 87, p = 0.007 | U = 297, p = 0.748 | U = 21, p = 0.008 |
| Hemoglobin (13.88 ± 1.34 g/dL) | 17.3 ± 2.6 | 16.8 ± 2.1 | 18.9 ± 12.1 | U = 160, p = 0.318 | U = 256, p = 0.297 | U = 42, p = 0.176 |
| SGOT (30–100 U/L) | 504.0 ± 539.0 | 129.8 ± 160.4 | 113.0 ± 89.9 | U = 90, p = 0.019 | U = 276, p = 0.945 | U = 31, p = 0.044 |
| SGPT (6–40 U/L) | 162.8 ± 163.2 | 36.5 ± 58.9 | 33.4 ± 30.3 | U = 84, p = 0.009 | U = 244, p = 0.411 | U = 32, p = 0.046 |
| BUN (3–12 mg/dL) | 11.2 ± 4.1 | 10.7 ± 3.8 | 11.9 ± 5.7 | U = 173, p = 0.691 | U = 264, p = 0.568 | U = 63, p = 0.975 |
| Creatinine (0.03–0.50 mg/dL) | 1.0 ± 0.2 | 0.9 ± 0.2 | 1.1 ± 0.3 | U = 156, p = 0.472 | U = 198, p = 0.085 | U = 54, p = 0.549 |
| Lactate (4.4 to 14.4 mg/dL) | 86.9 ± 76.8 | 68.6 ± 46.9 | 92.5 ± 33.7 | U = 213, p = 0.964 | U = 173, p = 0.017 | U = 55, p = 0.403 |
| LDH (170–580 U/L) | 3560.4 ± 2851.1 | 875.7 ± 657.8 | 863.3 ± 510.3 | U = 60, p = 0.001 | U = 300, p = 0.985 | U = 22, p = 0.009 |
| PT (13.0 ± 1.43 s) | 19.8 ± 15.8 | 16.4 ± 6.1 | 16.8 ± 3.0 | U = 179, p = 0.726 | U = 235, p = 0.217 | U = 60, p = 0.850 |
| aPTT (42.9 ± 5.80 s) | 62.4 ± 23.7 | 56.0 ± 25.5 | 71.0 ± 23.0 | U =155, p = 0.352 | U = 173, p = 0.018 | U = 46, p = 0.284 |
| Albumin (2.5–3.4 g/dL) | 3.3 ± 0.8 | 3.5 ± 0.4 | 3.7 ± 0.3 | U = 164, p = 0.363 | U = 236, p = 0.294 | U = 44, p = 0.315 |
| Na (133–146 mmol/L) | 135.6 ± 1.8 | 136.0 ± 3.6 | 135.1 ± 3.9 | U = 182, p = 0.631 | U = 230, p = 0.127 | U = 46, p = 0.262 |
| K (3.2–5.5 mmol/L) | 3.8 ± 0.6 | 4.1 ± 0.7 | 4.2 ± 0.7 | U = 155, p = 0.269 | U = 294, p = 0.714 | U = 46, p = 0.218 |
| CK (39–308 U/L) | 5080.1 ± 7238.7 | 1986.1 ± 2398.8 | 1830.2 ± 2808.8 | U = 106, p = 0.047 | U = 225, p = 0.401 | U = 29, p = 0.043 |
| CK-MB (0–4.5 ng/mL) | 75.9 ± 70.8 | 68.7 ± 94.5 | 23.7 ± 19.7 | U = 61, p = 0.736 | U = 64, p = 0.084 | U = 11, p = 0.188 |
| Troponin I (0–30 pg/mL) | 915.7 ± 1365.1 | 154.9 ± 420.0 | 97.8 ± 62.3 | U = 77, p = 0.076 | U = 195, p = 0.459 | U = 28, p = 0.236 |
| CRP (1.5–20 mg/L) | 4.3 ± 5.9 | 5.1 ± 19.6 | 0.04 ± 0.2 | U = 122, p = 0.025 | U = 249, p = 0.102 | U = 23, p = 0.002 |
Publisher’s Note: MDPI stays neutral with regard to jurisdictional claims in published maps and institutional affiliations. |
© 2021 by the authors. Licensee MDPI, Basel, Switzerland. This article is an open access article distributed under the terms and conditions of the Creative Commons Attribution (CC BY) license (https://creativecommons.org/licenses/by/4.0/).
Share and Cite
Lee, I.-C.; Yang, J.-J.; Liou, Y.-M. Early Blood Glucose Level Post-Admission Correlates with the Outcomes and Oxidative Stress in Neonatal Hypoxic-Ischemic Encephalopathy. Antioxidants 2022, 11, 39. https://doi.org/10.3390/antiox11010039
Lee I-C, Yang J-J, Liou Y-M. Early Blood Glucose Level Post-Admission Correlates with the Outcomes and Oxidative Stress in Neonatal Hypoxic-Ischemic Encephalopathy. Antioxidants. 2022; 11(1):39. https://doi.org/10.3390/antiox11010039
Chicago/Turabian StyleLee, Inn-Chi, Jiann-Jou Yang, and Ying-Ming Liou. 2022. "Early Blood Glucose Level Post-Admission Correlates with the Outcomes and Oxidative Stress in Neonatal Hypoxic-Ischemic Encephalopathy" Antioxidants 11, no. 1: 39. https://doi.org/10.3390/antiox11010039