Abstract
Oxidative stress is pivotal in the pathology of many diseases. This study investigated the antioxidant phytochemistry of avocado (Persea americana Mill.) peel. Different solvent extracts (dichloromethane, ethyl acetate, methanol, and water) of avocado peel were subjected to total phenol and flavonoid quantification, as well as in vitro radical scavenging and ferric reducing evaluation. The methanol extract was subjected to gradient column chromatographic fractionation. Fraction 8 (eluted with hexane:chloroform:methanol volume ratio of 3:6.5:0.5, respectively) was subjected to LC-MS analysis. It was assessed for cellular inhibition of lipid peroxidation and lipopolysaccharide (LPS)-induced ROS and NO production. The DPPH radical scavenging mechanism of chlorogenic acid was investigated using Density Functional Theory (DFT). The methanol extract and fraction 8 had the highest phenol content and radical scavenging activity. Chlorogenic acid (103.5 mg/mL) and 1-O-caffeoylquinic acid (102.3 mg/mL) were the most abundant phenolics in the fraction. Fraction 8 and chlorogenic acid dose-dependently inhibited in vitro (IC50 = 5.73 and 6.17 µg/mL) and cellular (IC50 = 15.9 and 9.34 µg/mL) FeSO4-induced lipid peroxidation, as well as LPS-induced ROS (IC50 = 39.6 and 28.2 µg/mL) and NO (IC50 = 63.5 and 107 µg/mL) production, while modulating antioxidant enzyme activity. The fraction and chlorogenic acid were not cytotoxic. DFT analysis suggest that an electron transfer, followed by proton transfer at carbons 3′OH and 4′OH positions may be the radical scavenging mechanism of chlorogenic acid. Considering this study is bioassay-guided, it is logical to conclude that chlorogenic acid strongly influences the antioxidant capacity of avocado fruit peel.
1. Introduction
Oxidative stress remains a culprit in the development and progression of many chronic diseases [1]. It is caused by a disruption in the balance between the biological production of deleterious reactive oxygen species (ROS)/reactive nitrogen species (RNS) and mitigating antioxidant actions [2,3]. ROS and RNS play important roles in redox balance and signaling, immune response, and cellular homeostasis [2]. However, most ROS and RNS are radical species, which are very reactive [3,4]. Thus, their uncontrolled production could lead to oxidative alteration or damage of important biological molecules [1,3,4]. Oxygen, unlike other elements that exists as bi-atomic molecules, has better stability in the triplet state of electron spin (the state of unpaired electrons) than in the singlet state of electron spin (the state of paired electrons), which plays a major role in the reactivity of ROS [2].
ROS and RNS are mostly by-products of biological signaling and/or metabolism. The commonly generated ROS and RNS include hydroxyl radicals, hydrogen peroxide, nitric oxide, peroxides, peroxynitrite, singlet oxygen, and superoxides, which are common by-products of the mitochondrial electron transport, cytochrome P450, and NADH oxidase pathways [5]. They have been reported to have detrimental effects on biological molecules, which have been implicated in oxidative stress associated diseases [1,4].
Oxidative stress is a common denominator in the pathology of many chronic diseases (diabetes, cancer, cardiovascular diseases, renal disease, mental and neurological disorders, and pulmonary diseases) and aging due to the oxidative damage caused by ROS and RNS on DNA, proteins, and membrane lipids [1]. Redox signaling is important for proper myocardial functioning and is regulated by several kinases. Oxidative stress can dysregulate this signaling, which can lead to cardiovascular disorders [1]. Oxidative stress can cause oxidative damage to contractile proteins, which may lead to contractile dysfunctions and vascular impairments [6]. ROS may induce pro-tumorigenic signaling, which may promote cancer cell proliferation and survival [7]. In diabetic state, glycation processes can lead to advanced glycation end product (AGE) production [8]. AGEs can induce oxidative stress, which induces several stress-induced transcription factors and pro-inflammatory processes. Lipid peroxidation causes oxidative modifications to biological lipids, including membrane lipids, which compromises cell membrane integrity [1]. Oxidative modifications of lipids, such as apo-lipoprotein B, may lead to formation of oxidized low-density lipoproteins, which has been implicated in the pathology of atherosclerosis [1].
The body is equipped with antioxidant mechanisms to mop deleterious ROS and mitigate the damages caused by oxidative stress [9]. These include antioxidant enzyme systems, such as catalase, superoxide dismutase, and glutathione-related enzyme systems, as well as endogenous antioxidant molecules that quench pro-oxidants or enable the functioning of antioxidant pathways [9]. Dietary or plant-derived polyphenols are known to possess antioxidant capacity, which is key for their medicinal potential in different diseases [10]. Many fruits and vegetables contain these antioxidant phenolics, which contribute to their health benefits [11]. Despite the antioxidant benefits of fruit consumption, studies have shown that the non-edible wastes of many fruits are notable sources of phenolics, which is influential in their reported medicinal properties [12,13,14]. For instance, the seed of avocado fruit has ethnomedicinal applications in mental disorders and obesity [15], while the peel has cosmetic applications [16].
Avocado fruit (Persea americana Mill.) is a globally consumed fruit. The cosmetic applications and documented anticancer, antibacterial, anti-inflammatory, and anti-hypertensive potentials of the peel have been strongly linked to its antioxidant properties [16,17]. Phenolic acids, including hydroxybenzoic and hydroxycinnamic acids and flavonoids, including anthocyanins, flavanols, flavanones, and flavonols, are some of the classes of polyphenols reported in the avocado peel, which could contribute to its antioxidant effects [18,19,20]. The radical scavenging activity of the peel extract has been documented [18,19,20,21]. Also, the peel has been shown to exert anti-inflammatory effects in lipopolysaccharide (LPS)-treated murine macrophage cells by suppressing TNF-α expression and NO production [18].
Despite the antioxidant and anti-inflammatory potential of avocado peel, previous studies have not been able to link or correlate its principal phytoconstituents to its bioactivity through comparative experimental analysis, which will give more insight into the antioxidant phytochemistry of the fruit’s peel. In the present study, computational, in vitro, and cell-based experimental models were employed to elucidate the antioxidant phytochemistry of avocado fruit peel.
2. Materials and Methods
2.1. Procurement of Fruit and Solvent Extraction of Peel
Avocado (Persea americana Mill.) fruit (Var. Fuerte) was procured from a local fruit shop. The fruits were washed, and the peel was neatly removed. The peel was air dried and pulverized. Approximately 125 g of the pulverized peel were first defatted with hexane. Thereafter, it was sequentially extracted with dichloromethane, ethyl acetate, methanol, and water, respectively. Extraction was done at a sample-to-solvent ratio of 125 g:1.25 L, respectively, on an orbital shaker [OrbiShake, Model 262, Labotec (Pty) Ltd., Johannesburg, South Africa] set at 125 rpm. For each solvent, extraction was done three times under ambient temperature for 72 h. The organic solvent extracts were recovered by filtering, evaporating [Buchi Rotavapor® R-300, Labotec (Pty) Ltd., Johannesburg, South Africa], and drying under a fume hood. The water extract was recovered by filtering and freeze-drying (Martin Christ Alpha 1–2 LDplus Freeze Dryer, Separations, Johannesburg, South Africa). Tannins were removed from the methanol extract via solid-phase extraction in a polyamide column. All extracts were stored at −20 °C.
2.2. Preliminary Phenolic Content and In Vitro Antioxidant Activity Measurements
Total phenol and flavonoid content and Fe3+ reducing antioxidant activity (FRAP), as well as 2,2-diphenyl-1-picrylhydrazyl (DPPH), 2,2′-azinobis-(3-ethylbenzothiazoline-6-sulfonic acid) (ABTS), and NO radical scavenging activities were measured in the extracts using methods reported in previous publications. For total phenol and flavonoid content, FRAP, and NO radical scavenging activity, the methods reported by Chukwuma et al. [12] were used. For DPPH and ABTS radical scavenging activities, the methods reported by [22] were used. For the antioxidant assays, ascorbic acid and Trolox were used as the positive controls. For all the above-mentioned assays, the extracts and the positive controls were tested at a concentration of 45 µg/mL.
2.3. Fractionation of the Methanol Extract
About 4.1 g of the methanol extract (without tannin) was subjected to a gradient column (silica gel) fractionation. Thin layer chromatography (TLC) was first used to determine the appropriate solvent system for the gradient column fractionation. The mobile phase started with a solvent system volume ratio of 8:1.5:0.5 (hexane, chloroform, and methanol, respectively) and ended with a volume ratio of 0:9:1 (hexane, chloroform, and methanol, respectively). Collected fractions with fairly similar TLC profiles were pooled together into nine different groups labelled as fractions 2 to 10. The fractions were recovered by air drying.
2.4. Antioxidant Evaluation of Fractions
Total phenol and flavonoid content, FRAP, and DPPH and ABTS radical scavenging activities were measured for all the 9 fractions and compared to positive controls (ascorbic acid and Trolox). For all the above-mentioned assays, the fractions and positive controls were tested at a concentration of 25 µg/mL.
Fraction 8 (a pool of fractions with similar TLC profile), obtained from a mobile phase solvent system volume ratio of 3:6.5:0.5 (hexane, chloroform, and methanol, respectively), had the highest total phenol content and the most potent FRAP and radical scavenging activity compared to the other fractions. Thus, fraction 8 was subjected to LC-MS analysis.
2.5. Liquid Chromatography—Mass Spectroscopic (LC-MS) Quantification
To perform the LC-MS protocol, the following were used: A Waters Synapt G2 (Waters Corporation, Milford, MA, USA), ESI probe, and ESI Pos, at a 15 V cone voltage. The operation of liquid chromatography was done using an Acquity binary solvent manager. The chromatographic column used was a HSS T3 (Waters Corporation, Milford, MA, USA). It had a dimension of 2.1 × 150 mm and a particle size of 1.8 µm. Two solvent systems (A and B) were used as the mobile phase. Solvent system A was water containing 0.1% methanoic acid, while solvent system B was acetonitrile containing 0.1% methanoic acid. A 0.25 mL/min flow rate was applied for the gradient chromatographic separation at 30 °C. The gradient condition followed the following sequence: 100% (A):0% (B), 10 min; 72% (A):28% (B), 21 min; 60% (A):40% (B), 50 s; 0% (A):100% (B), 2 min. The fraction was dissolved in a mixture of acetonitrile and water (1:1 v/v), passed through a 0.22 µm filter, and injected at a volume of 20 μL. The signals of the separated compounds were recorded at 254 nm. Using the accurate masses, the compounds in the fraction were tentatively determined and semi-quantified (mg/L) relative to rutin standard, and according to the extracted ions.
2.6. Dose-Dependent Antioxidant Evaluation of Fraction 8 and Chlorogenic Acid
Dose-dependent in vitro and cell-based models were used to compare the antioxidant effect of fraction 8 with that of chlorogenic acid, which, together with 1-O-caffeoylquinic acid (1-CQA), were the most abundant compounds in the fraction. Commercial chlorogenic acid (5-O-caffeoylquinic or 5-CQA) purchased form Merck, Johannesburg, South Africa, was used for the assays.
2.6.1. Measurement of Dose-Dependent DPPH Radical Scavenging Activity
The dose-dependent DPPH radical scavenging activity of the samples and positive controls (ascorbic acid and Trolox) were measured at 3.75, 7.5, 15, 30, and 60 µg/mL concentrations.
2.6.2. Measurement of Linoleic Acid Peroxidation Inhibition
The ability of fraction 8 and chlorogenic acid to inhibit FeSO4-induced (FS) linoleic acid peroxidation was performed. The detailed protocol for this assay has recently been reported in our publication [23]. In summary, linoleic acid (50 mM) peroxidation was induced using FeSO4·7H2O (FS) (2 mM in assay volume) after pre-treatment with the different concentrations (5, 10, 20, 40, and 80 µg/mL in assay volume) of the samples and ascorbic acid (positive control). The thiobarbituric acid (TBA) method was used to measure the level of lipid peroxidation. Absorbance readings at 532 nm were used to compute the inhibitory potential of the tested samples on linoleic acid peroxidation as follows:
where “A” means “absorbance readings”; the “Normal control” denotes reaction with sample solvent or vehicle, without FS; the “Negative control” denotes reaction with sample solvent or vehicle and FS; and the “Test” denotes reaction with sample and FS.
2.6.3. Measurement of the Antioxidant Capacity in Chang Cells
The effect of the tested samples (fraction 8 and chlorogenic acid) and ascorbic acid (positive control) on lipid peroxidation and the activity of key antioxidant enzymes was measured in Chang liver cells (ATCC® CCL-13™) induced with oxidative stress. The detailed protocol for this assay has recently been reported in our publication [23]. In summary, oxidative stress was induced in cultured cells using FS (1 mM in assay volume) after pre-treatment with the different concentrations (10, 20, 40, and 80 µg/mL in assay volume) of the fraction 8, chlorogenic acid and ascorbic acid. The thiobarbituric acid (TBA) method was used to measure the level of lipid peroxidation in the cell lysate, which was extrapolated from an MDA standard plot as thiobarbituric acid reactive substances (TBARS). Also, the activities of catalase and superoxide dismutase (SOD) were measured in the lysate of cells treated with the highest concentration (80 µg/mL) of the samples using the following assay kits purchased from Merck, Johannesburg, South Africa: Catalase Assay Kit (catalog number: CAT100) and SOD Assay Kit (product number: 19160). The inhibitory potential of the tested samples on lipid peroxidation was computed using the formula below:
where “T” is the level of lipid peroxidation in the form of TBARS; the “Normal control” denotes cells treated with the sample solvent/vehicle, without FS; the “Negative control” denotes cells treated with the sample solvent/vehicle and FS; and the “Test” denotes cells treated with the sample and FS.
2.6.4. Measurement of ROS and NO Production Inhibition in RAW 264.7 Cells
The effect of the tested samples (fraction 8 and chlorogenic acid) and ascorbic acid (positive control) on ROS and NO production was measured in RAW 264.7 macrophages [American Type Culture Collection (ATCC) Rockville, MD, USA; ATCC No.: TIB-71 ™] treated with lipopolysaccharide (LPS) (Merck, Johannesburg, South Africa). For ROS and NO production assays, the methods reported by Marrazzo et al. [24] and Njoya et al. [25] were adopted, respectively, with slight modifications.
RAW 264.7 macrophages were grown in Roswell Park Memorial Institute (RPMI) 1640 medium (Separations, Johannesburg, South Africa) supplemented with 10% fetal bovine serum (FBS) and 1% penicillin/streptomycin in a CO2 incubator (EC 160, Nϋve; Separations, Johannesburg, South Africa) under standard cell culture conditions (37 °C in a humidified environment with 95% air and 5% CO2). At about 80% confluence, the cells were trypsinized with 0.25% trypsin/EDTA (Cytiva Hyclone, USA) and split at a ratio of 1:5 for further passaging. Next, the cytotoxic effect of the tested samples on the RAW 264.7 macrophages was measured at concentrations of (6.25–100 µg/mL) using standard MTT assay protocol.
For the ROS and NO production inhibition assay, confluent RAW 264.7 macrophages were seeded in black/clear-bottom 96-well plate at a density of 10,000 cells per well and incubated for 24 h. The cells were then pre-treated for 2 h with the tested samples. For the ROS production inhibition assay, the cells were treated at sample concentrations of 25, 50, and 100 µg/mL in incubation volume. For the NO production inhibition assay the cells were treated at sample concentrations of 6.25, 12.5, 25, 50, and 100 µg/mL in incubation volume. Some wells were assigned the control and negative control groups, which contained cells treated with the sample solvents/vehicle (≤0.5% DMSO). Next, LPS (200 ng/mL in final incubation volume) was added to the wells containing the samples and the wells assigned as the negative control group, while an equivalent volume of the 0.5% DMSO was added to the wells assigned as the control group. The plates were further incubated for 24 h.
To analyze the cells for ROS production, the cells were washed with phosphate buffered saline (PBS). Next, 100 µL of fresh FBS-free culture medium, containing a 2′,7′dichlorodihydrofluorescein diacetate (DCFH-DA) (Merck, South Africa) fluorescent probe (10 µM in incubation volume), was added into each well with minimal exposure to light, and the plates were further incubated for 30 min. Thereafter, the media containing the fluorescent probe was replaced with PBS, and fluorescence was measured at 485 nm (excitation) and 535 nm (emission) using a SpectraMax iD3 multi-mode microplate reader (Molecular Devices, San Jose, USA). Also, cell images were obtained using a Leica DM IL LED inverted fluorescent microscope (Separations, Johannesburg, South Africa). The inhibitory potential of the tested samples on ROS production was calculated as follows:
where “F” means “fluorescence reading”.
To analyze the cells for NO production post-LPS treatment, 100 µL of the incubation medium from each well of the 96-well microtitre plates was aliquoted into designated wells of a new 96-well transparent plate. An equal volume of Griess reagent (Merck, South Africa) was added to the wells and the plate was kept in the dark at room temperature for 15 min. Absorbance values were measured at 540 nm. The concentration of nitrite (µM) was calculated from a sodium nitrite standard linear plot (y = 0.0029x + 0.0114). The inhibitory potential of the tested samples on NO production was calculated as follows:
where “C” is the nitrite concentration (μM) extrapolated from the sodium nitrite standard plot.
2.7. IC50 Computation
The IC50 values of the tested samples were computed on GraphPad Prism 7 and/or MS excel 2016 software using the non-linear or linear plot of transformed (log 10) sample concentrations (x-axis) versus the corresponding inhibitory bioactivities.
2.8. Statistical Analysis
Experimental data was presented as mean ± standard deviation of triplicate analysis (n = 3). The statistical analysis was done on the IBM SPSS Statistics (Windows version 29.0) software using the one-way ANOVA and Tukey post-hoc multiple comparative analysis. Statistical significance was set at p < 0.05.
2.9. Density Functional Theory (DFT) Analysis
The hydrogen atom transfer (HAT), single electron transfer followed by proton transfer (SET-PT), and sequential proton loss followed by electron transfer (SPLET) mechanisms were used to computationally study the DPPH radical scavenging activity of chlorogenic acid. The equations below sequentially denote the mechanisms for HAT, SET-PT, and SPLET, respectively.
where ArO●, ArO−, ArOH●+, R−, and RH denote phenolic radical, phenolic anion, phenolic cation, anion radical, and neutral molecule, respectively.
ArOH + R● → ArO● + RH
ArOH + R● → ArOH●+ + R− → ArO● + RH
ArOH + R● → ArO− + R● → ArO● + R− → ArO● + RH
Geometry optimization of all the reaction species was performed using B3LYP together with the 6-311++g (d,p) basis set. This computational method is largely used for radical scavenging mechanisms and has been shown to accurately estimate the geometries and thermodynamic parameters of the reaction species [26]. The bond dissociation enthalpy (BDE), adiabatic ionization potential (AIP), proton dissociation enthalpy (PDE), proton affinity (PA), and electron transfer enthalpy (ETE) (in kcal/mol) of the reaction species for the capture of the DPPH radical by chlorogenic acid (5-CQA) were computed for a methanol-solvent-based reaction, which are parameters that inform the above-mentioned radical reaction mechanism.
3. Results
The methanol extract of the fruit peel had the highest (p < 0.05) total phenol, while the ethyl acetate extract had the highest (p < 0.05) total flavonoid content compared to the other extracts (Table 1). The Fe3+ reducing antioxidant activity of the methanol and dichloromethane extracts was significantly (p < 0.05) more potent than that of the other extracts and Trolox, but significantly (p < 0.05) less potent than that of ascorbic acid (Table 1). The DPPH, ABTS, and NO radical scavenging activity of the methanol extract were stronger than those of the other extracts and in some instances stronger and/or comparable to those of ascorbic acid and Trolox (Table 1).

Table 1.
Total phenol and flavonoid contents and in vitro Fe3+ reducing and radical scavenging activity of crude extract at 45 µg/mL.
Among the fractions (fractions 2 to 10) obtained from the methanol extract, fraction 8 consistently showed the highest (p < 0.05) total phenol content, as well as DPPH and ABTS radical scavenging and Fe3+ reducing antioxidant activity (Table 2). The antioxidant activity of fraction 8 was statistical comparable to that of ascorbic acid and/or Trolox (Table 2).
Table 2.
Total phenol and flavonoid contents and in vitro Fe3+ reducing and radical scavenging activity of crude extract at 25 µg/mL.
LC-MS analysis of fraction 8 showed the presence of several phenolic compounds, with chlorogenic acid (5-CQA) and 1-O-caffeoylquinic acid (1-CQA) being the compounds with the highest concentrations (Table 3, Figure 1, and Supplementary Material). Chlorogenic acid (5-CQA) was the compound of interest in this study.
Table 3.
LC-MS data of fraction 8.
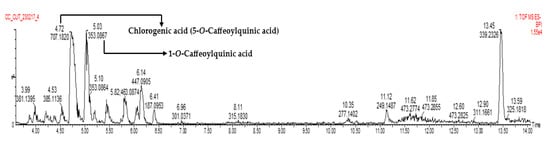
Figure 1.
LC-MS chromatogram of fraction 8.
Dose-dependently, the DPPH radical scavenging activity of fraction 8 was statistically (p > 0.05) as potent as chlorogenic acid, ascorbic acid, and Trolox (Table 4 and Figure 2a). Although not significantly (p > 0.05), the inhibitory effect of fraction 8 (IC50 = 5.73 µg/mL) and chlorogenic acid (IC50 = 6.17 µg/mL) on FS-induced linoleic acid peroxidation was stronger than that of ascorbic acid (IC50 = 8.41 µg/mL) (Table 4 and Figure 2b).
Table 4.
IC50 values for the dose-dependent activities of the tested samples.
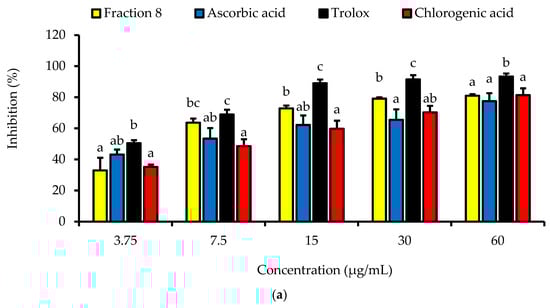
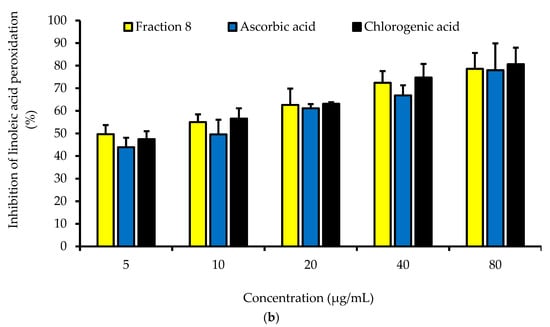
Figure 2.
Dose-dependent (a) DPPH radical scavenging and (b) anti-linoleic acid peroxidative activities of fraction 8 and chlorogenic acid. Data are presented as mean ± SD of triplicate analysis. For each assay, the letters at the top of the bars represent significant differences (p < 0.05) between groups when there are no similar letters.
In Chang cells induced with oxidative stress, the anti-lipid peroxidative of ascorbic acid (IC50 = 5.74 µg/mL) was significantly (p < 0.05) and non-significantly (p > 0.05) stronger than that of fraction 8 (IC50 = 15.9 µg/mL) and chlorogenic acid (IC50 = 9.34 µg/mL), respectively (Table 4 and Figure 3a). Nevertheless, fraction 8, chlorogenic acid, and ascorbic acid (at 80 µg/mL) appreciably mitigated oxidative stress-induced depletion of catalase and SOD enzymes in the Chang cells (Figure 3b).
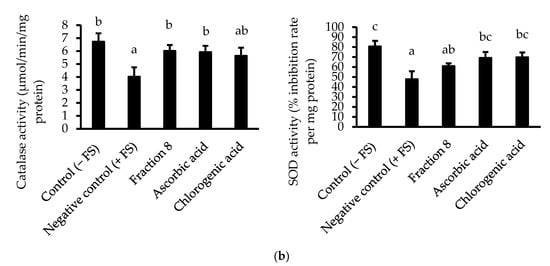
Figure 3.
(a) Dose-dependent anti-lipid peroxidative and (b) antioxidant enzyme modulatory activities of fraction 8 and chlorogenic acid in FS-treated Chang cells. Data are presented as mean ± SD of triplicate analysis. For each assay, statistical comparison was done between the controls (control and negative control) and treatment groups at a given concentration or among the treatment groups at a given concentration. The letters at the top of the bars represent significant differences (p < 0.05) between groups when there are no similar letters. “FS” means FeSO4·7H2O.
Although not as potent as ascorbic acid (IC50 = 8.08 µg/mL; p < 0.05), fraction 8 (IC50 = 39.6 µg/mL) and chlorogenic acid (IC50 = 28.2 µg/mL) showed promising inhibition of LPS-induced ROS production in RAW 264.7 macrophages (Table 4 and Figure 4). However, the ability of fraction 8 (IC50 = 63.5 µg/mL) and chlorogenic acid (IC50 = 107 µg/mL) to inhibit NO production in LPS-treated RAW 264.7 macrophages significantly (p < 0.05) outperformed that of ascorbic acid (IC50 = 203 µg/mL) (Table 4 and Figure 5a). Interestingly, both fraction 8 and chlorogenic acid were not toxic to the RAW 264.7 macrophages (Figure 5b).
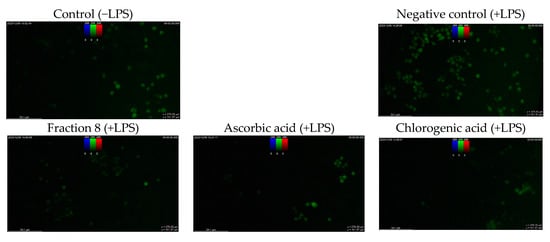
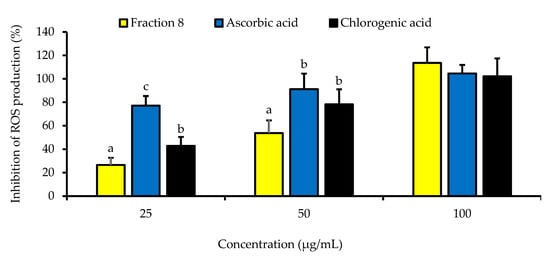
Figure 4.
Dose-dependent inhibitory effect of fraction 8 and chlorogenic acid on ROS production in LPS-treated RAW 264.7 macrophages. Data are presented as mean ± SD of triplicate analysis. The letters at the top of the bars represent significant differences (p < 0.05) between groups when there are no similar letters. “LPS” means lipopolysaccharide.
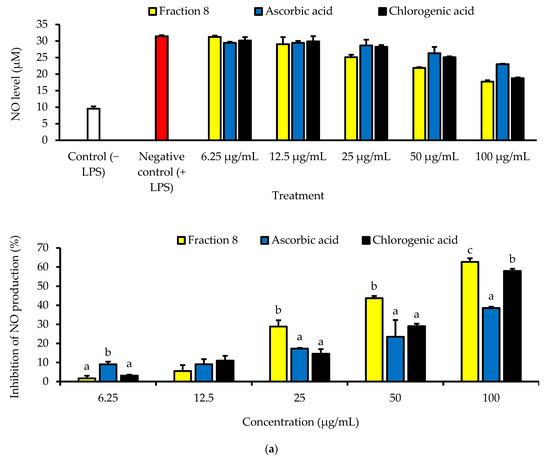
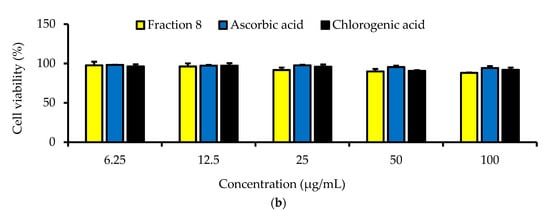
Figure 5.
Dose-dependent inhibitory effect of fraction 8 and chlorogenic acid on (a) NO production in LPS-treated RAW 264.7 macrophages and (b) the viability of RAW 264.7 macrophages. Data are presented as mean ± SD of triplicate analysis. Data are presented as mean ± SD of triplicate analysis. Statistical comparison was done between the controls (control and negative control) and treatment groups at a given concentration or among the treatment groups at a given concentration. The letters at the top of the bars represent significant differences (p < 0.05) between groups when there are no similar letters. “LPS” denotes “lipopolysaccharide”.
The DFT analysis data are presented in Table 5 and Figure 6. Figure 6a depicts the chemical structure of 5-CQA and the selected hydroxyl group numbering, as well as the lowest energy structural conformer of chlorogenic acid (5-CQA). Figure 6b shows the electron spin density of the optimized structures of 5-CQA radicals for HAT mechanism of DPPH radical scavenging.
Table 5.
Bond dissociation enthalpy (BDE), adiabatic ionization potential (AIP), proton dissociation enthalpy (PDE), proton affinity (PA), and electron transfer enthalpy (ETE) obtained (in kcal/mol) of the reaction species for the capture of the DPPH radical via 5-CQA.
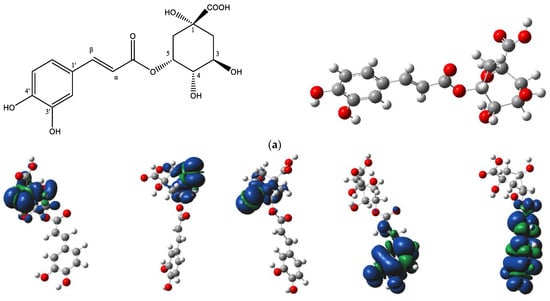
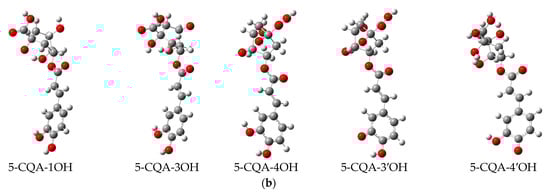
Figure 6.
(a) Chemical structure of chlorogenic acid (5-O-caffeoylquinic acid) and its lowest-energy structural conformer; (b) the electron spin density of the optimized structures of 5-O-caffeoylquinic acid radicals.
For the HAT mechanism, 5-CQA-4′OH H-atom abstraction appears to be the favored mechanism for quenching DPPH radical according to the low BDE value (Table 5) and stable electron distribution on the phenolic radical (Figure 6b). For the SET-PT mechanism, the proton transfer step is more highly favored at positions 3′ and 4′ based on the low PDE values (Table 5). Overall, the SET-PT mechanism at the 5-CQA-3′OH and 5-CQA-4′OH positions appear to be the preferred mechanism for DPPH radical scavenging compared to the HAT and SPLET mechanisms due to the low enthalpy values (Table 5).
4. Discussion
Oxidative stress is pivotal in the pathological outcomes of many diseases, which has been linked to the oxidative damage caused by deleterious ROS on biological molecules [1]. The peel of avocado fruit has been shown to have antioxidant effects [18,19,20]. In this study, we presented the antioxidant phytochemistry of avocado fruit peel.
The highly reactive nature of biological radicals notably influences their ability to oxidatively damage biomolecules. Plant polyphenols, on the other hand, are known radical scavengers, due to their ability to transfer hydroxyl H-atom and form stable phenoxy radicals [27]. Also, the iron-chelating ability of polyphenols contributes to their antioxidant potential [28]. In the present study, the methanol extract of avocado fruit peel had the highest polyphenol content and consistently had the highest radical scavenging and Fe3+ reducing activity relative to the other extracts (Table 1). Although not on the same variety, previous studies have documented the potent radical scavenging effects of the peel’s methanol extract [21,29]. Consistent with our study, the methanol extract was more potent than ethyl acetate extract [29]. Among all the fractions form the methanol extract, fraction 8 had the most potent radical scavenging and Fe3+ reducing activity (Table 2). The activity correlates with the total phenol content (Table 2), confirming the influence of polyphenols on the radical quenching potential of plants. Supporting documented evidence has also shown correlations between the phenolic contents of avocado peel extract and its radical scavenging and in vitro antioxidant capacity [20,29]. In fact, relative to the pulp and seed, studies have shown that the peel possessed more phenolic content, and thus had stronger radical scavenging and antioxidant capacity [20,30,31].
Previous studies have reported the presence of phenolic acids, including hydroxybenzoic and hydroxycinnamic acids and flavonoids, including anthocyanins, flavanols, flavanones, and flavonols in avocado peel [18,19,20], which were partly identified in fraction 8 (Table 3). Also, the phenol content of fraction 8 was higher than the flavonoid content (Table 2), which suggests phenolic compounds may have influenced its antioxidant capacity more than the flavonoids. A consistent trend of data has previously been reported in fractions obtained from the methanol and ethyl acetate extracts of peel of an avocado variety grown in Ampelgading, Indonisa [28]. It was shown that the phenolic content contributed more to the radical scavenging and ferric reducing activity of the fractions than the flavonoids content [28]. In the study, 1,2,4-trihidroksiheptadek-12,16-diyne and 1,2,4-trihidroksiheptadek-16-yne-18-ene were identified as the possible antioxidant compounds in the fraction obtained from the methanol and ethyl acetate extracts, respectively [28]. However, this study [28], like other studies [18,19,20], did not compare the antioxidant activity of the identified compounds with that of the potent extracts or fractions in which they were identified. Thus, the study was not able to ascertain whether the identified compounds influence the antioxidant capacity of the peel extracts or fractions. This suggests a gap in these studies and provides the rationale and relevance of our study.
In our study, there was a predominant presence of chlorogenic and 1-O-caffeoylquinic acid in fraction 8 (Table 3). Chlorogenic acid and derivatives have been reported in avocado peel [Rodríguez-Martínez; Hirasawa]. The data of our study further showed that the radical scavenging activity chlorogenic acid was comparable to that of fraction 8 and ascorbic acid (Table 4 and Figure 2a), suggesting that chlorogenic acid may strongly influence the antioxidant effect of fraction 8. Moreover, chlorogenic acid is a known dietary phenolic acid with antioxidant and anti-inflammatory potentials [32,33,34]. Further computational DFT analysis suggests that the favored radical scavenging mechanism of chlorogenic acid is a single electron transfer followed by proton transfer at 3′OH and 4′OH positions (Table 5 and Figure 6).
Furthermore, the radical scavenging potency of fraction 8 and chlorogenic acid (Table 4) may be relevant in their anti-lipid peroxidative attributes. This is because during lipid peroxidation free radicals can oxidatively attack biological lipids, including membrane lipids, compromising cell integrity, and exacerbating oxidative stress [35]. In vitro and in Chang cells, fraction 8 and chlorogenic acid dose-dependently inhibited lipid peroxidation (Table 4 and Figure 2b and Figure 3a). In Chang cells, the anti-lipid peroxidative effect of fraction 8 and chlorogenic acid was accompanied by the modulation of SOD and catalase activities (Figure 3b), which are key antioxidants enzymes. The anti-lipid peroxidative and antioxidant enzyme modulatory effect of chlorogenic acid was comparable to that of ascorbic acid and fraction 8, suggesting chlorogenic acid may notably influence the anti-lipid peroxidative effect of fraction 8. Moreover, the anti-lipid peroxidative and antioxidant enzyme modulatory effect of chlorogenic acid has been documented in animal disease models [36,37].
In LPS-treated RAW 264.7 macrophages, fraction 8 and chlorogenic acid dose-dependently suppressed oxidative stress by suppressing ROS production (Table 4 and Figure 4). This data, together with the potent anti-lipid peroxidative and antioxidant enzyme modulatory action of chlorogenic acid (Figure 3) strongly supports the documented modulatory action of chlorogenic acid on biological redox status [32,33,36,37], and further supports its notable contribution to the antioxidant properties of avocado peel. Furthermore, both fraction 8 and chlorogenic acid dose-dependently suppressed NO production in LPS-treated RAW 264.7 macrophages (Table 4 and Figure 5a) without causing cytotoxicity (Figure 5b). In fact, they outperformed ascorbic acid. Immune myeloid cells, like macrophages, are known to produce more cytokines and NO in response to inflammatory signals [38]. Thus, the inhibitory action of fraction 8 on NO production in RAW 264.7 macrophages induced with inflammation suggests an anti-inflammatory potential. Through the suppressive action on LPS-induced NO production and TNF-α expression in RAW 264.7 macrophages, existing data have shown the anti-inflammatory action of the hydroalcoholic extract of avocado peel [18]. Data of our study further shows that the anti-inflammatory potential of avocado peel may be strongly influenced by the presence of chlorogenic acid, considering the promising suppressive effect of chlorogenic acid on LPS-induced NO production (Table 4 and Figure 5a). Moreover, chlorogenic acid has been reported to potentiate anti-inflammatory action by moderating the production and action of inflammatory mediators, including TNF-α, IL-1β, IL-6, IL-8, NO, and PGE2, while modulating signaling processes associated with NF-κB, MAPK, Nrf2, etc. [34].
5. Conclusions
In this study, a bioassay-guided approach was used to elucidate the antioxidant phytochemistry of avocado peel. Fractionation of the peel’s methanol extract yielded a fraction that had promising ability to scavenge free radical, inhibit lipid peroxidation, suppress ROS and NO production and modulate antioxidant enzyme activity. The fraction also showed the predominant presence of chlorogenic acid. Data further showed that chlorogenic acid had antioxidant activities that were comparable to that of the fraction and ascorbic acid. It scavenged DPPH radical through a single electron transfer, followed by proton transfer at its carbons 3′OH and 4′OH positions. Considering that our investigation was bioassay-guided, it is logical to conclude that chlorogenic acid is a bioactive principle that notably influences the antioxidant capacity of avocado fruit peel.
Supplementary Materials
The following supporting information can be downloaded at: https://www.mdpi.com/article/10.3390/antiox13040456/s1.
Author Contributions
G.O.I.: methodology, formal analysis, investigation, data curation, writing—original draft; E.M.N.: methodology, formal analysis, investigation, data curation, writing—review and editing; G.T.T.: methodology, formal analysis, data curation, writing—review and editing; J.N.: methodology, data curation, formal analysis, writing—review and editing; K.P.O.: methodology, data curation, formal analysis, writing—review and editing; S.E.T.: methodology, formal analysis, data curation, writing—review and editing; V.O.F.: methodology, data curation, writing—review and editing; A.M.A.: methodology, data curation, writing—review and editing; O.L.E.: formal analysis, data curation, writing—review and editing; S.S.M.: resources, supervision, writing—review and editing; T.J.M.: resources, writing—review and editing; M.P.S.: resources, writing—review and editing; C.I.C.: conceptualization, resources, supervision, funding acquisition, formal analysis, writing—review and editing. All authors have read and agreed to the published version of the manuscript.
Funding
The study was funded by the postgraduate scholarship (reference: MND200429517886) and incentive funding for rated researchers (Grant No: 150945) of the National Research Foundation, South Africa.
Institutional Review Board Statement
The protocol reported in this study was approved by the Faculty Research and Innovation Committee of the Faculty of Health and Environmental Sciences, Central University of Technology, Bloemfontein on 18 May 2021.
Informed Consent Statement
Not applicable.
Data Availability Statement
The data of this study is available from the corresponding author on request.
Conflicts of Interest
The authors declare no conflicts of interest.
References
- Jomova, K.; Raptova, R.; Alomar, S.Y.; Alwasel, S.H.; Nepovimova, E.; Kuca, K.; Valko, M. Reactive oxygen species, toxicity, oxidative stress, and antioxidants: Chronic diseases and aging. Arch. Toxicol. 2023, 97, 2499–2574. [Google Scholar] [CrossRef] [PubMed]
- Bardaweel, S.K.; Gul, M.; Alzweiri, M.; Ishaqat, A.; ALSalamat, H.A.; Bashatwah, R.M. Reactive oxygen species: The dual role in physiological and pathological conditions of the human body. Eurasian J. Med. 2018, 50, 193–201. [Google Scholar] [CrossRef] [PubMed]
- Hameister, R.; Kaur, C.; Dheen, S.T.; Lohmann, C.H.; Singh, G. Reactive oxygen/nitrogen species (ROS/RNS) and oxidative stress in arthroplasty. J. Biomed. Mater. Res. 2020, 108, 2073–2087. [Google Scholar] [CrossRef] [PubMed]
- Mandal, M.; Sarkar, M.; Khan, A.; Biswas, M.; Masi, A.; Rakwal, R.; Agrawal, G.K.; Srivastava, A.; Sarkar, A. Reactive oxygen species (ROS) and reactive nitrogen species (RNS) in plants– maintenance of structural individuality and functional blend. Adv. Red. Res. 2022, 5, 100039. [Google Scholar] [CrossRef]
- Jha, N.; Ryu, J.J.; Choi, E.H.; Kaushik, N.K. Generation and role of reactive oxygen and nitrogen species induced by plasma, lasers, chemical agents, and other systems in dentistry. Oxidative Med. Cell. Longev. 2017, 2017, 7542540. [Google Scholar] [CrossRef] [PubMed]
- Steinberg, S.F. Oxidative stress and sarcomeric proteins. Cir. Res. 2013, 112, 393–405. [Google Scholar] [CrossRef] [PubMed]
- Reczek, C.R.; Chandel, N.S. The two faces of reactive oxygen species in cancer. Annu. Rev. Cancer Biol. 2017, 1, 79–98. [Google Scholar] [CrossRef]
- Perrone, A.; Giovino, A.; Benny, J.; Martinelli, F. Advanced Glycation End Products (AGEs): Biochemistry, signaling, analytical methods, and epigenetic effects. Oxidative Med. Cell. Longev. 2020, 2020, 3818196. [Google Scholar] [CrossRef] [PubMed]
- Birben, E.; Sahiner, U.M.; Sackesen, C.; Erzurum, S.; Kalayci, O. Oxidative stress and antioxidant defense. World Allergy Organ J. 2012, 5, 9–19. [Google Scholar] [CrossRef]
- Sun, C.; Zhao, C.; Guven, E.C.; Paoli, P.; Simal-Gandara, J.; Ramkumar, K.M.; Wang, S.; Buleu, F.; Pah, A.; Turi, V.; et al. Dietary polyphenols as anti-diabetic agents: Advances and opportunities. Food Front. 2020, 1, 18–44. [Google Scholar] [CrossRef]
- Afam, I.O.J.; Silungwe, H.; Takalani, T.; Omolola, A.O.; Udeh, H.O.; Anyasi, T.A. Antioxidant-rich natural fruit and vegetable products and human health. Int. J. Food Prop. 2021, 24, 41–67. [Google Scholar]
- Chukwuma, C.I.; Mashele, S.S.; Akuru, E.A. Evaluation of the in vitro ⍺-amylase inhibitory, antiglycation, and antioxidant properties of Punica granatum L. (pomegranate) fruit peel acetone extract and its effect on glucose uptake and oxidative stress in hepatocytes. J. Food Biochem. 2020, 44, e13175. [Google Scholar] [CrossRef] [PubMed]
- Sha, S.P.; Modak, D.; Sarkar, S.; Roy, S.K.; Sah, S.P.; Ghatani, K.; Bhattacharjee, S. Fruit waste: A current perspective for the sustainable production of pharmacological, nutraceutical, and bioactive resources. Front. Microbiol. 2023, 14, 1260071. [Google Scholar] [CrossRef]
- Hussain, H.; Mamadalieva, N.Z.; Hussain, A.; Hassan, U.; Rabnawaz, A.; Ahmed, I.; Green, I.R. Fruit Peels: Food Waste as a Valuable Source of Bioactive Natural Products for Drug Discovery. Curr. Issues Mol. Biol. 2022, 44, 1960–1994. [Google Scholar] [CrossRef]
- Oboh, G.; Odubanjo, V.O.; Bello, F.; Ademosun, A.O.; Oyeleye, S.I.; Nwanna, E.E.; Ademiluyi, A.O. Aqueous extracts of avocado pear (Persea americana Mill.) leaves and seeds exhibit anti-cholinesterases and antioxidant activities in vitro. J. Basic Clin. Physiol. Pharmacol. 2016, 27, 131–140. [Google Scholar] [CrossRef]
- Ferreira, S.M.; Falé, Z.; Santos, L. Sustainability in skin care: Incorporation of avocado peel extracts in topical formulations. Molecules 2022, 27, 1782. [Google Scholar] [CrossRef]
- Araujo, R.G.; Rodríguez-Jasso, R.M.; Ruíz, H.A.; Govea-Salas, M.; Pintado, M.; Aguilar, C.N. Recovery of bioactive components from avocado peels using microwave-assisted extraction. Food Bioprod. Process. 2021, 127, 152–161. [Google Scholar] [CrossRef]
- Tremocoldi, M.A.; Rosalen, P.L.; Franchin, M.; Massarioli, A.P.; Denny, C.; Daiuto, É.R.; Paschoal, J.A.R.; Melo, P.S.; Alencar, S.M. Exploration of avocado by-products as natural sources of bioactive compounds. PLoS ONE 2018, 13, e0192577. [Google Scholar] [CrossRef] [PubMed]
- Rodríguez-Martínez, B.; Ferreira-Santos, P.; Gullón, B.; Teixeira, J.; Botelho, C.; Yáñez, R. Exploiting the potential of bioactive molecules extracted by ultrasounds from avocado peels—Food and nutraceutical applications. Antioxidants 2021, 10, 1475. [Google Scholar] [CrossRef]
- Lyu, X.; Agar, O.T.; Barrow, C.J.; Dunshea, F.R.; Suleria, H.A.R. Phenolic compounds profiling and their antioxidant capacity in the peel, pulp, and seed of Australian grown avocado. Antioxidants 2023, 12, 185. [Google Scholar] [CrossRef]
- Rahman, N.; Sabang, S.M.; Abdullah, R.; Bohari, B. Antioxidant properties of the methanolic extract of avocado fruit peel (Persea americana Mill.) from Indonesia. J. Adv. Pharm. Technol. Res. 2022, 13, 166–170. [Google Scholar] [PubMed]
- Motloung, D.M.; Mashele, S.S.; Matowane, G.R.; Swain, S.S.; Bonnet, S.L.; Noreljaleel, A.E.M.; Oyedemi, S.O.; Chukwuma, C.I. Synthesis, characterization, antidiabetic and antioxidative evaluation of a novel Zn (II)-gallic acid complex with multi-facet activity. J. Pharm. Pharmacol. 2020, 72, 1412–1426. [Google Scholar] [CrossRef] [PubMed]
- Mashile, B.; Setlhodi, R.; Izu, G.O.; Erukainure, O.L.; Mashele, S.S.; Makhafola, T.J.; Eze, K.C.; Chukwuma, C.I. Temperature-dependent extraction and chromatographic recovery and characterization of ellagitannins with potent antioxidant and glycemic control properties from “Wonderful” pomegranate peel. J. Food Sci. Technol. 2024, 59, 408–424. [Google Scholar] [CrossRef]
- Marrazzo, P.; Angeloni, C.; Freschi, M.; Lorenzini, A.; Prata, C.; Maraldi, T.; Hrelia, S. Combination of epigallocatechin gallate and sulforaphane counteracts in vitro oxidative stress and delays stemness loss of amniotic fluid stem cells. Oxidative Med. Cell. Longev. 2018, 2018, 30647811. [Google Scholar] [CrossRef] [PubMed]
- Mfotie, E.; Ndemangou, B.; Akinyelu, J.; Munvera, A.M.; Chukwuma, C.I.; Mkounga, P.; Mashele, S.S.; Makhafola, T.J.; McGaw, L.J. In vitro antiproliferative, anti-inflammatory effects and molecular docking studies of natural compounds isolated from Sarcocephalus pobeguinii (Hua ex Pobeg). Front. Pharmacol. 2023, 14, 1205414. [Google Scholar] [CrossRef] [PubMed]
- Galano, A.; Alvarez-Idaboy, J.R. A computational methodology for accurate predictions of rate constants in solution: Application to the assessment of primary antioxidant activity. J. Comput. Chem. 2013, 34, 2430–2445. [Google Scholar] [CrossRef]
- Chen, J.; Yang, J.; Ma, L.; Li, J.; Shahzad, N.; Kim, C.K. Structure-antioxidant activity relationship of methoxy, phenolic hydroxyl, and carboxylic acid groups of phenolic acids. Sci. Rep. 2020, 10, 2611. [Google Scholar] [CrossRef]
- Scarano, A.; Laddomada, B.; Blando, F.; De Santis, S.; Verna, G.; Chieppa, M.; Santino, A. The chelating ability of plant polyphenols can affect iron homeostasis and gut microbiota. Antioxidants 2023, 12, 630. [Google Scholar] [CrossRef] [PubMed]
- Antasionasti, I.; Riyanto, S.; Rohman, A. Antioxidant activities and phenolics contents of avocado (Persea americana Mill.) peel in vitro. J. Med. Plant Res. 2017, 11, 55–61. [Google Scholar]
- Rojas-García, A.; Villegas-Aguilar, M.d.C.; García-Villegas, A.; Cádiz-Gurrea, M.d.l.L.; Fernández-Ochoa, Á.; Fernández-Moreno, P.; Arráez-Román, D.; Segura-Carretero, A. Characterization and biological analysis of avocado seed and peel extracts for the development of new therapeutical strategies. Biol. Life Sci. Forum 2022, 18, 9. [Google Scholar] [CrossRef]
- Hirasawa, M.; Shimura, K.; Shimizu, A.; Mura, K.; Tokue, C.; Arai, S. Quantification and functional analysis of dietary fiber and polyphenols in avocado. J. Jpn. Soc. Food Sci. Technol. 2008, 55, 95–101. [Google Scholar] [CrossRef][Green Version]
- Liang, N.; Kitts, D.D. Role of chlorogenic acids in controlling oxidative and inflammatory stress conditions. Nutrients 2015, 8, 16. [Google Scholar] [CrossRef] [PubMed]
- Wang, L.; Pan, X.; Jiang, L.; Chu, Y.; Gao, S.; Jiang, X.; Zhang, Y.; Chen, Y.; Luo, S.; Peng, C. The biological activity mechanism of chlorogenic acid and its applications in food industry: A review. Front. Nutr. 2022, 9, 943911. [Google Scholar] [CrossRef] [PubMed]
- Huang, J.; Xie, M.; He, L.; Song, X.; Cao, T. Chlorogenic acid: A review on its mechanisms of anti-inflammation, disease treatment, and related delivery systems. Front. Pharmacol. 2023, 14, 1218015. [Google Scholar] [CrossRef] [PubMed]
- Petrovic, S.; Arsic, A.; Ristic-Medic, D.; Cvetkovic, Z.; Vucic, V. Lipid peroxidation and antioxidant supplementation in neurodegenerative diseases: A review of human studies. Antioxidants 2020, 9, 1128. [Google Scholar] [CrossRef] [PubMed]
- Zhou, J.; Ashoori, F.; Suzuki, S.; Nishigaki, I.; Yagi, K. Protective effect of chlorogenic acid on lipid peroxidation induced in the liver of rats by carbon tetrachloride or 60Co-irradiation. J. Clin. Biochem. Nutr. 1993, 15, 119–125. [Google Scholar] [CrossRef][Green Version]
- Wang, D.; Tian, L.; Lv, H.; Pang, Z.; Li, D.; Yao, Z.; Wang, S. Chlorogenic acid prevents acute myocardial infarction in rats by reducing inflammatory damage and oxidative stress. Biomed. Pharm. 2020, 132, 110773. [Google Scholar] [CrossRef]
- Palmieri, E.M.; McGinity, C.; Wink, D.A.; McVicar, D.W. Nitric oxide in macrophage immunometabolism: Hiding in plain sight. Metabolites 2020, 10, 429. [Google Scholar] [CrossRef]


Disclaimer/Publisher’s Note: The statements, opinions and data contained in all publications are solely those of the individual author(s) and contributor(s) and not of MDPI and/or the editor(s). MDPI and/or the editor(s) disclaim responsibility for any injury to people or property resulting from any ideas, methods, instructions or products referred to in the content. |
© 2024 by the authors. Licensee MDPI, Basel, Switzerland. This article is an open access article distributed under the terms and conditions of the Creative Commons Attribution (CC BY) license (https://creativecommons.org/licenses/by/4.0/).