
Εleven Greek Legume Beans: Assessment of Genotypic Effect on Their Phytochemical Content and Antioxidant Properties
 , , and
Abstract
:1. Introduction
2. Materials and Methods
2.1. Samples
2.2. Chemicals and Standards
2.3. Samples Preparation
2.4. Total Phenolic (TPC) and Tannin (TTC) Contents
2.5. Determination of Polyphenols Composition Using LC–MS/MS Analysis
2.6. Determination of Fatty Acids Composition Using GC-FID Analysis
2.7. Evaluation of Antioxidant Properties
2.8. Statistical Analysis
3. Results
3.1. Determination of Nutritional Content
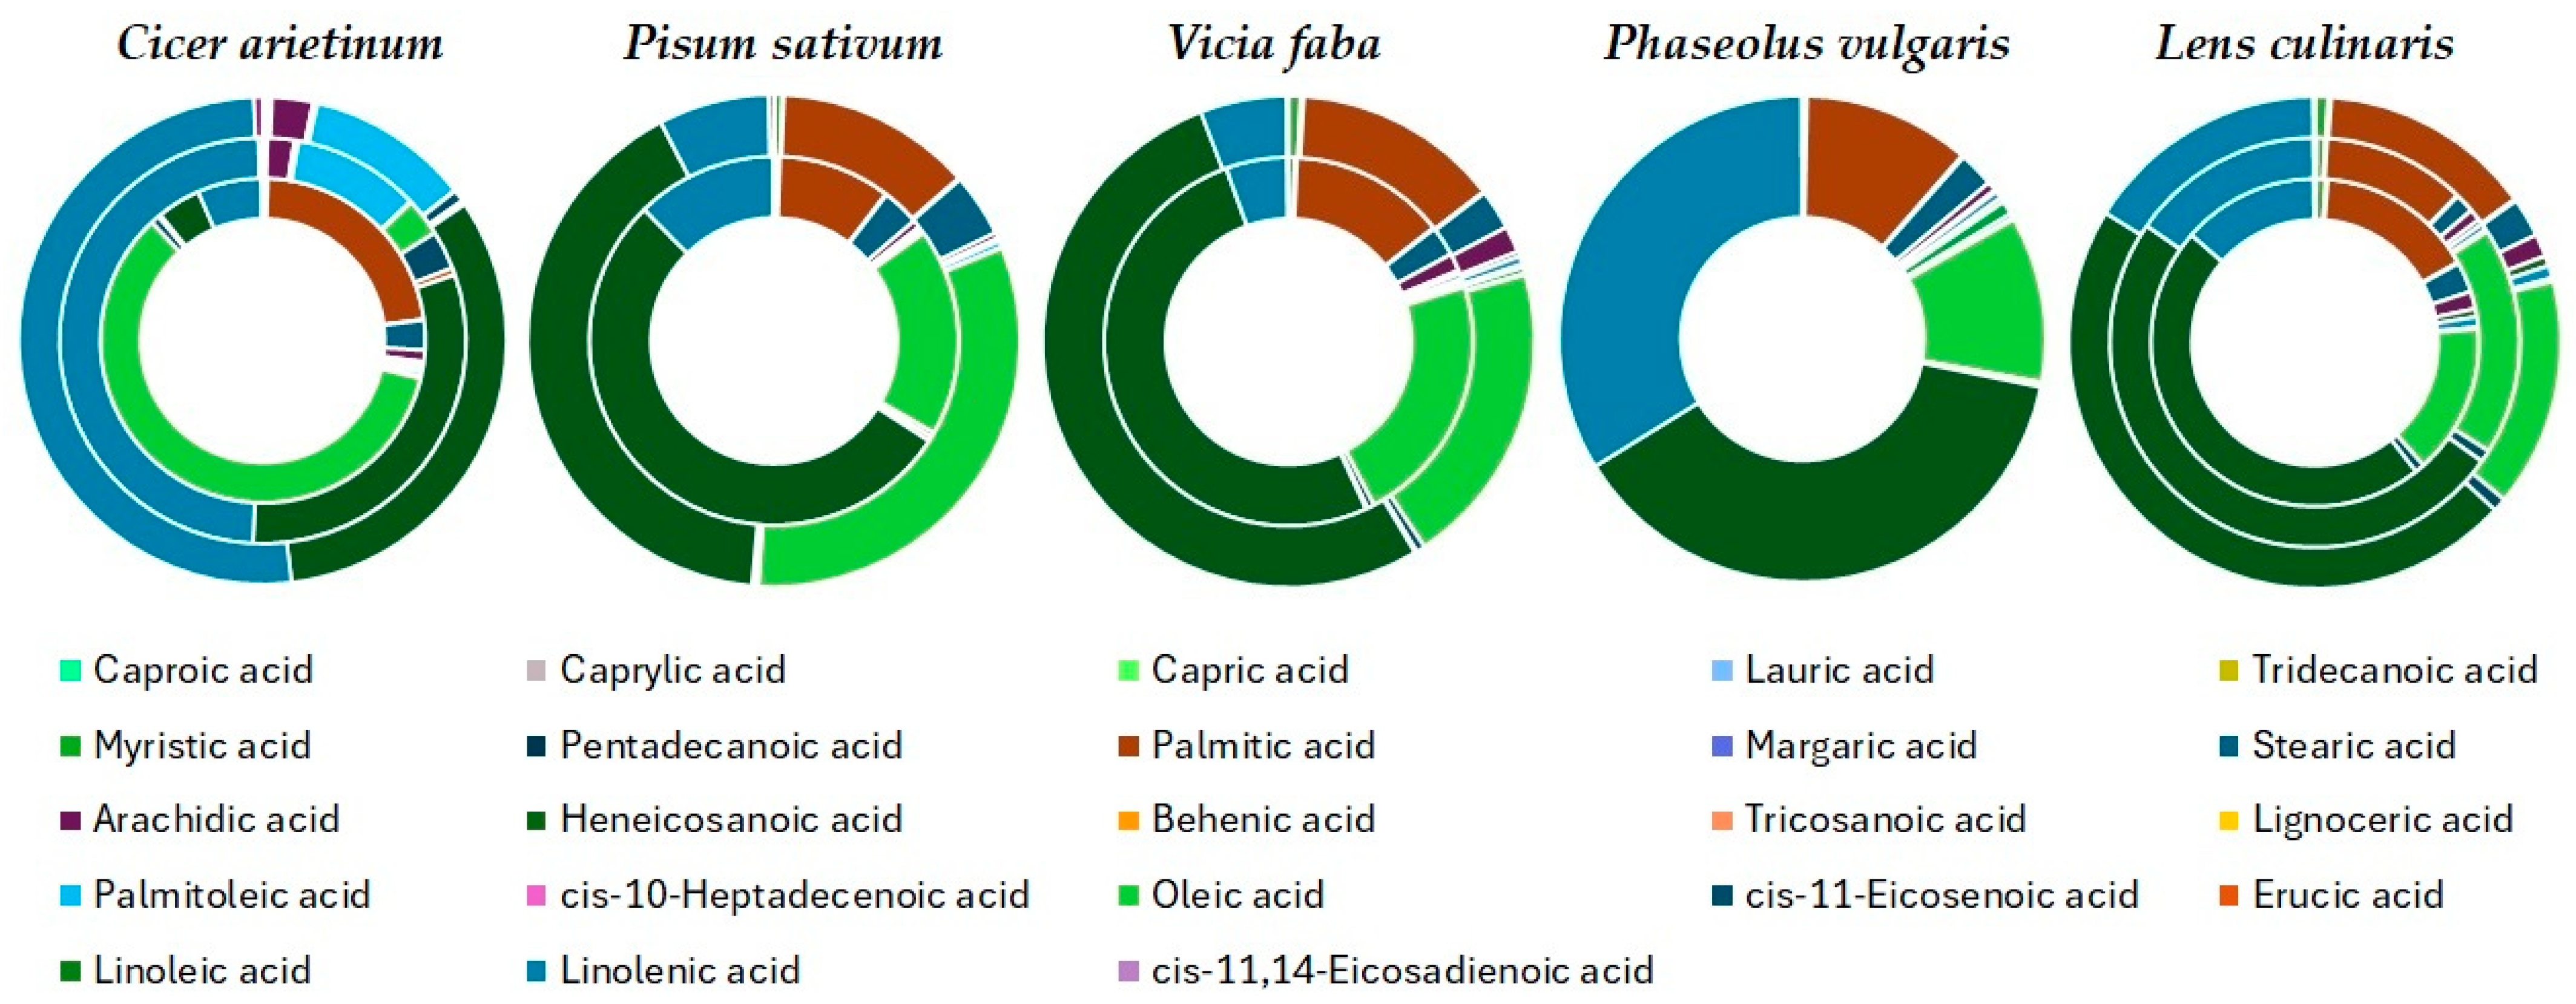
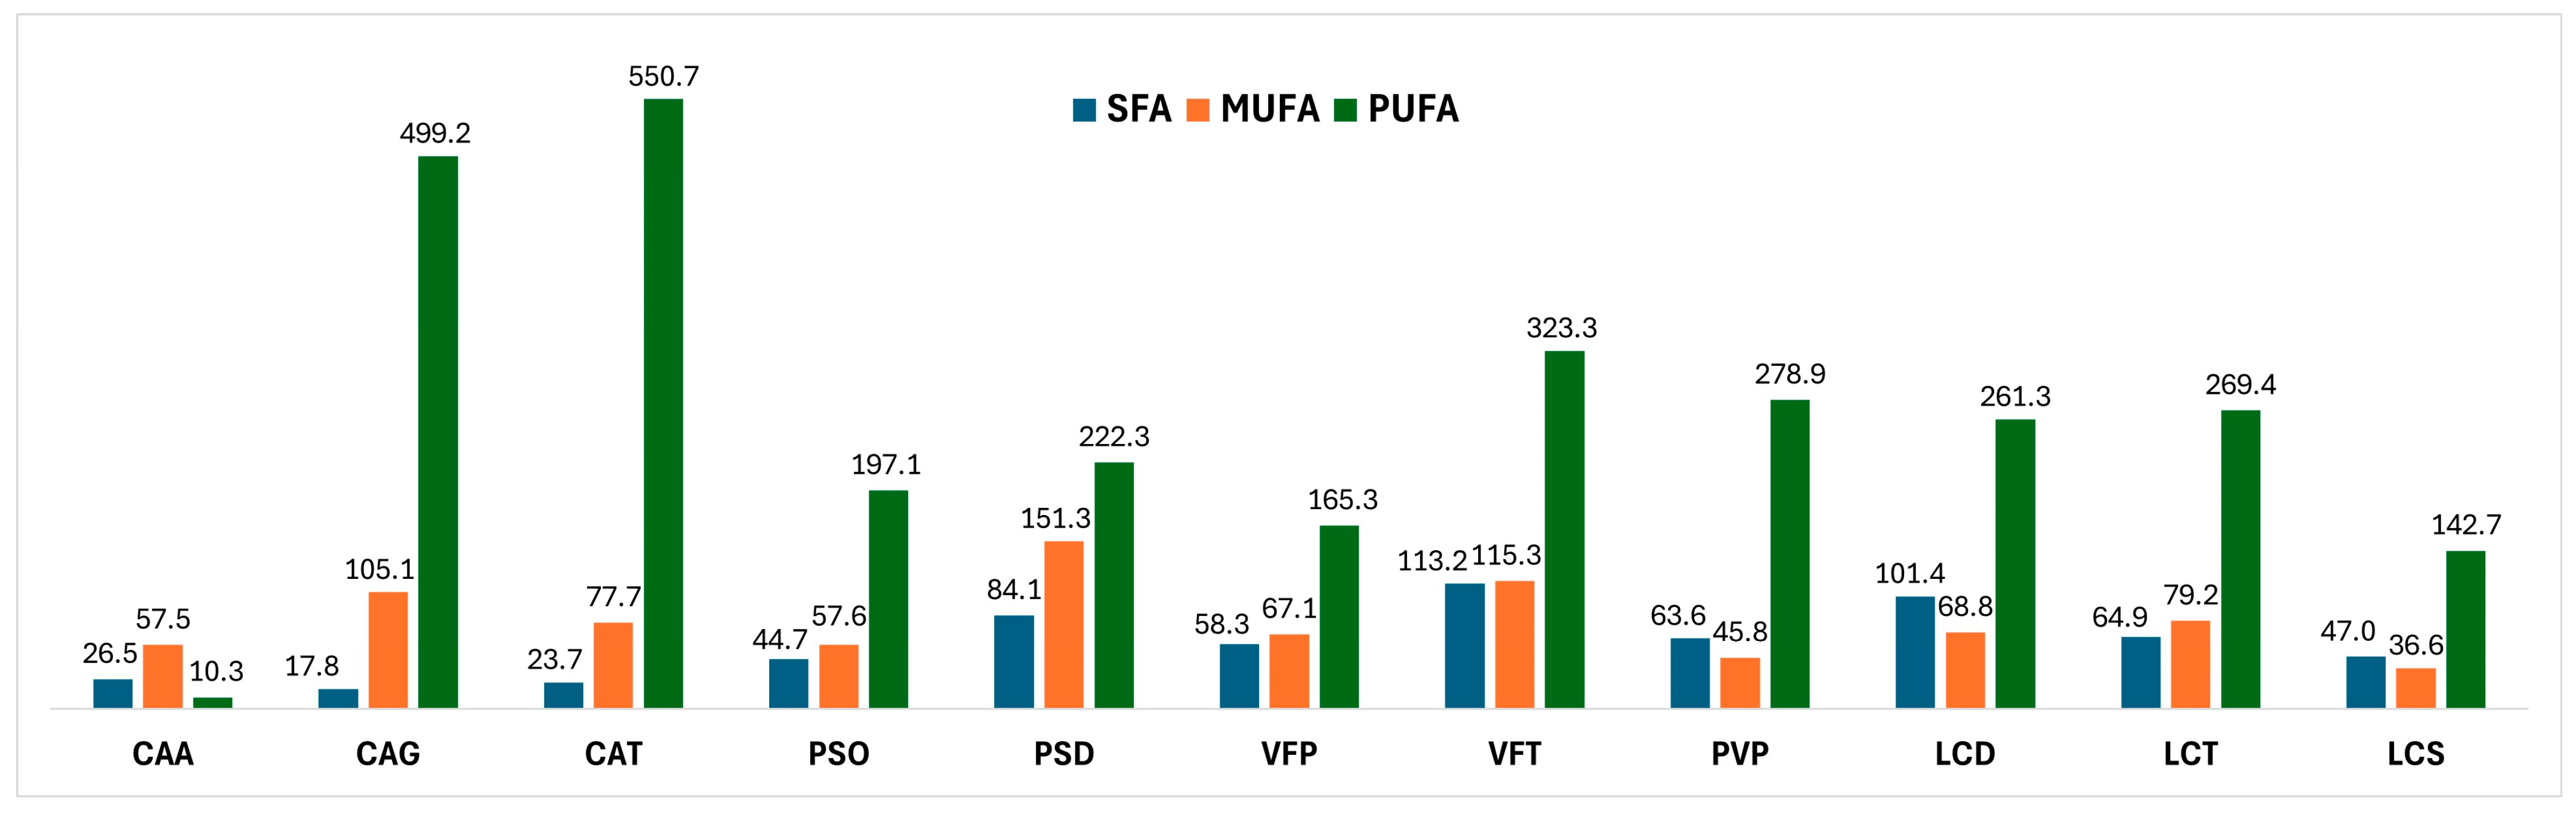
Fatty Acids Composition
3.2. Polyphenolic Content
3.2.1. Total Phenolic and Tannin Content
3.2.2. Polyphenolic Composition
3.3. Antioxidant Properties
3.4. Screening of Fabaceae Family Crops Utilizing Hierarchical Clustering Analysis (HCA) and Principal Component Analysis (PCA)
3.4.1. Principal Component Analysis (PCA)
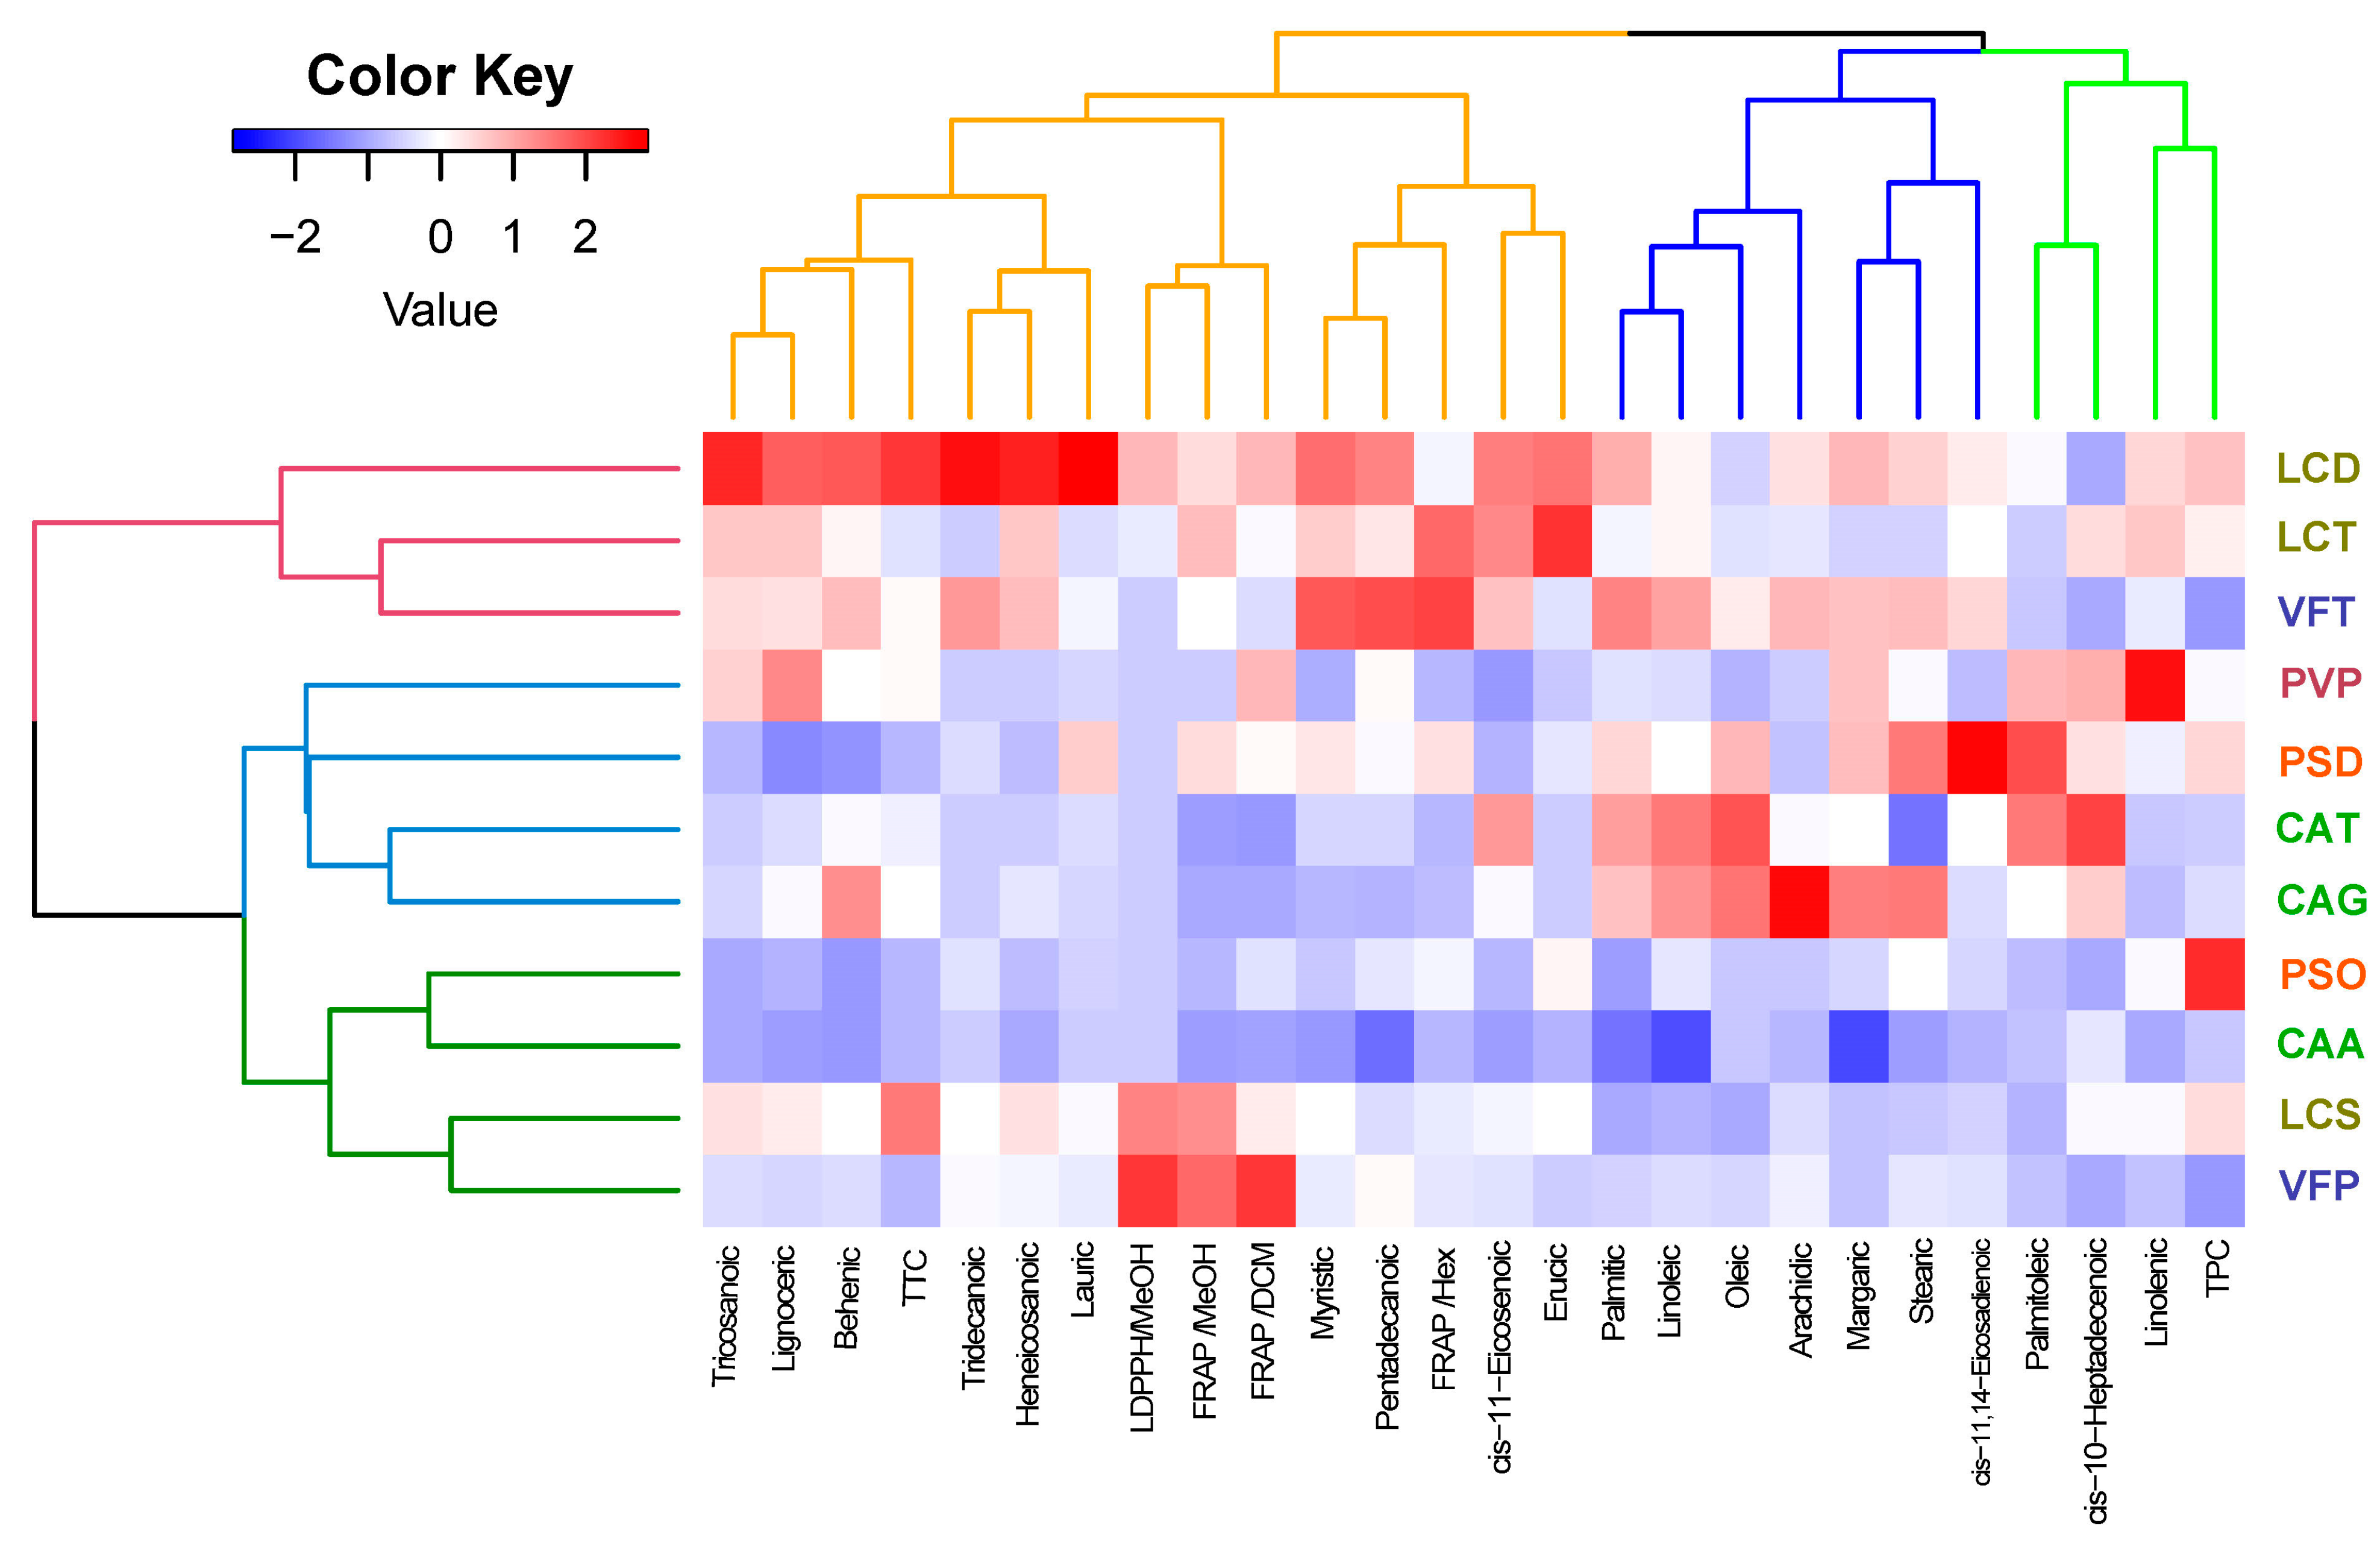
3.4.2. Hierarchical Cluster Analysis (HCA)
4. Discussion
4.1. Nutritional Content
4.1.1. Fatty Acids Composition
4.1.2. Tannin Composition
4.2. Polyphenolic Composition
4.3. Antioxidant Properties
4.4. Fabaceae Family Screening Utilizing Hierarchical Clustering Analysis (HCA) and Principal Component Analysis (PCA)
5. Conclusions
Supplementary Materials
Author Contributions
Funding
Institutional Review Board Statement
Informed Consent Statement
Data Availability Statement
Conflicts of Interest
References
- Mikić, A. Palaeolinguistics and Ancient Eurasian Pulse. Crops 2015, 108, 45–50. [Google Scholar]
- Smýkal, P.; Coyne, C.J.; Ambrose, M.J.; Maxted, N.; Schaefer, H.; Blair, M.W.; Berger, J.; Greene, S.L.; Nelson, M.N.; Besharat, N.; et al. Legume Crops Phylogeny and Genetic Diversity for Science and Breeding. Crit. Rev. Plant Sci. 2015, 34, 43–104. [Google Scholar] [CrossRef]
- Gultekin, Y.; Filley, S.J.; Smallman, M.A.; Hannaway, D.B.; Ates, S. Pasture Production, Persistence of Legumes and Lamb Growth in Summer-dry Hill Pastures. Grass Forage Sci. 2021, 76, 159–172. [Google Scholar] [CrossRef]
- Myrtsi, E.D.; Evergetis, E.; Koulocheri, S.D.; Haroutounian, S.A. Bioactivity of Wild and Cultivated Legumes: Phytochemical Content and Antioxidant Properties. Antioxidants 2023, 12, 852. [Google Scholar] [CrossRef]
- Huang, Y.F.; Gao, X.L.; Nan, Z.B.; Zhang, Z.X. Potential Value of the Common Vetch (Vicia sativa L.) as an Animal Feedstuff: A Review. J. Anim. Physiol. Anim. Nutr. 2017, 101, 807–823. [Google Scholar] [CrossRef]
- Stagnari, F.; Maggio, A.; Galieni, A.; Pisante, M. Multiple Benefits of Legumes for Agriculture Sustainability: An Overview. Chem. Biol. Technol. Agric. 2017, 4, 2. [Google Scholar] [CrossRef]
- Iqbal, A.; Khalil, I.A.; Ateeq, N.; Khan, M.S. Nutritional Quality of Important Food Legumes. Food Chem. 2006, 97, 331–335. [Google Scholar] [CrossRef]
- Makkar, H.P.S.; Tran, G.; Heuzé, V.; Giger-Reverdin, S.; Lessire, M.; Lebas, F.; Ankers, P. Seaweeds for Livestock Diets: A Review. Anim. Feed Sci. Technol. 2016, 212, 1–17. [Google Scholar] [CrossRef]
- Brummer, E.C.; Barber, W.T.; Collier, S.M.; Cox, T.S.; Johnson, R.; Murray, S.C.; Olsen, R.T.; Pratt, R.C.; Thro, A.M. Plant Breeding for Harmony between Agriculture and the Environment. Front. Ecol. Environ. 2011, 9, 561–568. [Google Scholar] [CrossRef] [PubMed]
- Myrtsi, E.D.; Vlachostergios, D.N.; Petsoulas, C.; Evergetis, E.; Koulocheri, S.D.; Haroutounian, S.A. An Interdisciplinary Assessment of Biochemical and Antioxidant Attributes of Six Greek Vicia sativa L. Varieties. Plants 2023, 12, 2807. [Google Scholar] [CrossRef] [PubMed]
- Aid, F. Plant Lipid Metabolism. In Advances in Lipid Metabolism; Valenzuela Baez, R., Ed.; IntechOpen: London, UK, 2020; ISBN 978-1-78984-458-0. [Google Scholar]
- Moghadasian, M.H. Advances in Dietary Enrichment with N-3 Fatty Acids. Crit. Rev. Food Sci. Nutr. 2008, 48, 402–410. [Google Scholar] [CrossRef]
- Sekiya, J.; Kamiuchi, H.; Hatanaka, A. Lipoxygenase, Hydroperoxide Lyase and Volatile C6-Aldehyde Formation from C18-Fatty Acids during Development of Phaseolus vulgaris L. Plant Cell Physiol. 1982, 23, 631–638. [Google Scholar] [CrossRef]
- Kermasha, S.; Van Voort, F.R.D.; Metche, M. Changes in Lipid Components during the Development of the French Bean Seed (Phaseolus vulgaris). J. Sci. Food Agric. 1986, 37, 652–658. [Google Scholar] [CrossRef]
- Lin, S.S.; Pearce, R.S. Changes in Lipids of Bean Seeds (Phaseolus vulgaris) and Corn Caryopses (Zea mays) Aged in Contrasting Environments. Ann. Bot. 1990, 65, 451–456. [Google Scholar] [CrossRef]
- Eshbekov, A.E.; Malikova, M.K.; Rakhmanberdyeva, R.K.; Mezhlumyan, L.G.; Khidoyatova, S.K.; Gusakova, S.D. Influence of Seasonal Dynamics on Carbohydrate, Lipid, and Protein Contents in Phaseolus vulgaris Pods. Chem. Nat. Compd. 2021, 57, 1–5. [Google Scholar] [CrossRef]
- Yoshida, H.; Tomiyama, Y.; Kita, S.; Mizushina, Y. Lipid Classes, Fatty Acid Composition and Triacylglycerol Molecular Species of Kidney Beans (Phaseolus vulgaris L.). Eur. J. Lipid Sci. Technol. 2005, 107, 307–315. [Google Scholar] [CrossRef]
- Lo Turco, V.; Potortì, A.G.; Rando, R.; Ravenda, P.; Dugo, G.; Di Bella, G. Functional Properties and Fatty Acids Profile of Different Beans Varieties. Nat. Prod. Res. 2016, 30, 2243–2248. [Google Scholar] [CrossRef]
- Marotti, I.; Dinelli, G.; Bregola, V.; Bosi, S. Nutritional Characterization of Italian Common Bean Landraces (Phaseolus vulgaris L.): Fatty Acid Profiles for “Genotype-Niche Diversity” Fingerprints. AIMS Agric. Food 2020, 5, 543–562. [Google Scholar] [CrossRef]
- Singh, U. Nutritional Quality of Chickpea (Cicer arietinum L.): Current Status and Future Research Needs. Plant Food Hum. Nutr. 1985, 35, 339–351. [Google Scholar] [CrossRef]
- Attia, R.S.; Aman, M.E.; Shehata, A.M.E.-T.; Hamza, M.A. Effect of Ripening Stage and Technological Treatments on the Lipid Composition, Lipase and Lipoxygenase Activities of Chickpea (Cicer arietinum L.). Food Chem. 1996, 56, 123–129. [Google Scholar] [CrossRef]
- Zia-Ul-Haq, M.; Iqbal, S.; Ahmad, S.; Imran, M.; Niaz, A.; Bhanger, M.I. Nutritional and Compositional Study of Desi Chickpea (Cicer arietinum L.) Cultivars Grown in Punjab, Pakistan. Food Chem. 2007, 105, 1357–1363. [Google Scholar] [CrossRef]
- Madurapperumage, A.; Tang, L.; Thavarajah, P.; Bridges, W.; Shipe, E.; Vandemark, G.; Thavarajah, D. Chickpea (Cicer arietinum L.) as a Source of Essential Fatty Acids—A Biofortification Approach. Front. Plant Sci. 2021, 12, 734980. [Google Scholar] [CrossRef]
- Coxon, D.T.; Wright, D.J. Analysis of Pea Lipid Content by Gas Chromatographic and Microgravimetric Methods. Genotype Variation in Lipid Content and Fatty Acid Composition. J. Sci. Food Agric. 1985, 36, 847–856. [Google Scholar] [CrossRef]
- Welch, R.W.; Wynne Griffiths, D. Variation in the Oil Content and Fatty Acid Composition of Field Beans (Vicia faba) and Peas (Pisum Spp.). J. Sci. Food Agric. 1984, 35, 1282–1289. [Google Scholar] [CrossRef]
- Bastianelli, D.; Grosjean, F.; Peyronnet, C.; Duparque, M.; Régnier, J.M. Feeding Value of Pea (Pisum sativum, L.) 1. Chemical Composition of Different Categories of Pea. Anim. Sci. 1998, 67, 609–619. [Google Scholar] [CrossRef]
- Murcia, M.; Rincón, F. Size as Source of Variance in Lipid Composition of Pea. Food Chem. 1992, 44, 29–35. [Google Scholar] [CrossRef]
- Solis, M.I.V.; Patel, A.; Orsat, V.; Singh, J.; Lefsrud, M. Fatty Acid Profiling of the Seed Oils of Some Varieties of Field Peas (Pisum sativum) by RP-LC/ESI-MS/MS: Towards the Development of an Oilseed Pea. Food Chem. 2013, 139, 986–993. [Google Scholar] [CrossRef]
- Duc, G.; Marget, P.; Esnault, R.; Le Guen, J.; Bastianelli, D. Genetic Variability for Feeding Value of Faba Bean Seeds (Vicia faba): Comparative Chemical Composition of Isogenics Involving Zero-Tannin and Zero-Vicine Genes. J. Agric. Sci. 1999, 133, 185–196. [Google Scholar] [CrossRef]
- Akpinar, N.; Ali Akpinar, M.; Türkoğlu, Ş. Total Lipid Content and Fatty Acid Composition of the Seeds of Some Vicia L. Species. Food Chem. 2001, 74, 449–453. [Google Scholar] [CrossRef]
- Kokten, K.; Ciftci, B.; Ozdemir, S.; Kardes, Y.M.; Kaplan, M. Fatty Acid Composition of the Seeds of Vicia faba Var. Major Genotypes from Turkey. Chem. Nat. Compd. 2022, 58, 524–526. [Google Scholar] [CrossRef]
- Bhatty, R.S. Composition and Quality of Lentil (Lens culinaris Medik): A Review. Can. Inst. Food Sci. Technol. J. 1988, 21, 144–160. [Google Scholar] [CrossRef]
- Pal, R.S.; Bhartiya, A.; Yadav, P.; Kant, L.; Mishra, K.K.; Aditya, J.P.; Pattanayak, A. Effect of Dehulling, Germination and Cooking on Nutrients, Anti-Nutrients, Fatty Acid Composition and Antioxidant Properties in Lentil (Lens culinaris). J. Food Sci. Technol. 2017, 54, 909–920. [Google Scholar] [CrossRef] [PubMed]
- Zhang, B.; Deng, Z.; Tang, Y.; Chen, P.X.; Liu, R.; Ramdath, D.D.; Liu, Q.; Hernandez, M.; Tsao, R. Effect of Domestic Cooking on Carotenoids, Tocopherols, Fatty Acids, Phenolics, and Antioxidant Activities of Lentils (Lens culinaris). J. Agric. Food Chem. 2014, 62, 12585–12594. [Google Scholar] [CrossRef] [PubMed]
- Hayat, I.; Ahmad, A.; Masud, T.; Ahmed, A.; Bashir, S. Nutritional and Health Perspectives of Beans (Phaseolus vulgaris L.): An Overview. Crit. Rev. Food Sci. Nutr. 2014, 54, 580–592. [Google Scholar] [CrossRef] [PubMed]
- Martín-Cabrejas, M.A.; Esteban, R.M.; Perez, P.; Maina, G.; Waldron, K.W. Changes in Physicochemical Properties of Dry Beans (Phaseolus vulgaris L.) during Long-Term Storage. J. Agric. Food Chem. 1997, 45, 3223–3227. [Google Scholar] [CrossRef]
- Granito, M.; Paolini, M.; Pérez, S. Polyphenols and Antioxidant Capacity of Phaseolus vulgaris Stored under Extreme Conditions and Processed. LWT—Food Sci. Techn. 2008, 41, 994–999. [Google Scholar] [CrossRef]
- Fahim, J.R.; Attia, E.Z.; Kamel, M.S. The Phenolic Profile of Pea (Pisum sativum): A Phytochemical and Pharmacological Overview. Phytochem. Rev. 2019, 18, 173–198. [Google Scholar] [CrossRef]
- Wang, X.; Warkentin, T.D.; Briggs, C.J.; Oomah, B.D.; Campbell, C.G.; Woods, S. Total Phenolics and Condensed Tannins in Field Pea (Pisum sativum L.) and Grass Pea (Lathyrus sativus L.). Euphytica 1998, 101, 97–102. [Google Scholar] [CrossRef]
- Meng, Z.; Liu, Q.; Zhang, Y.; Chen, J.; Sun, Z.; Ren, C.; Zhang, Z.; Cheng, X.; Huang, Y. Nutritive Value of Faba Bean (Vicia faba L.) as a Feedstuff Resource in Livestock Nutrition: A Review. Food Sci. Nutr. 2021, 9, 5244–5262. [Google Scholar] [CrossRef]
- Amarowicz, R.; Troszyñska, A. Antioxidant Activity of Extract of Pea and Its Fractions of Low Molecular Phenolics and Tannins. Pol. J. Food Nutr. Sci. 2003, 53, 10–15. [Google Scholar]
- Zhao, S.; Zhang, L.; Gao, P.; Shao, Z. Isolation and Characterisation of the Isoflavones from Sprouted Chickpea Seeds. Food Chem. 2009, 114, 869–873. [Google Scholar] [CrossRef]
- Ranilla, L.G.; Genovese, M.I.; Lajolo, F.M. Polyphenols and Antioxidant Capacity of Seed Coat and Cotyledon from Brazilian and Peruvian Bean Cultivars (Phaseolus vulgaris L.). J. Agric. Food Chem. 2007, 55, 90–98. [Google Scholar] [CrossRef]
- Kadouh, H.; Zhou, K. (Kevin) Nutraceutical and Health Properties of Common Beans (Phaseolus vulgaris). In Cereals and Pulses; Yu, L., Tsao, R., Shahidi, F., Eds.; Wiley: Hoboken, NJ, USA, 2012; pp. 187–198. ISBN 978-0-8138-1839-9. [Google Scholar]
- Madrera, R.R.; Negrillo, A.C.; Valles, B.S.; Fernández, J.J.F. Phenolic Content and Antioxidant Activity in Seeds of Common Bean (Phaseolus vulgaris L.). Foods 2021, 10, 864. [Google Scholar] [CrossRef]
- Kleintop, A.E.; Myers, J.R.; Echeverria, D.; Thompson, H.J.; Brick, M.A. Total Phenolic Content and Associated Phenotypic Traits in a Diverse Collection of Snap Bean Cultivars. J. Amer. Soc. Hort. Sci. 2016, 141, 3–11. [Google Scholar] [CrossRef]
- Lin, L.-Z.; Harnly, J.M.; Pastor-Corrales, M.S.; Luthria, D.L. The Polyphenolic Profiles of Common Bean (Phaseolus vulgaris L.). Food Chem. 2008, 107, 399–410. [Google Scholar] [CrossRef]
- Martínez, J.E.B.; Concha, D.D.R.M.; Velázquez, T.G.G.; Martínez, C.J.; Ruiz, J.C.R. Anti-Inflammatory Properties of Phenolic Extracts from Phaseolus vulgaris and Pisum sativum during Germination. Food Biosci. 2021, 42, 101067. [Google Scholar] [CrossRef]
- Fouad, A.A.; Rehab, F.M.A. Effect of Germination Time on Proximate Analysis, Bioactive Compounds and Antioxidant Activity of Lentil (Lens culinaris Medik.) Sprouts. Acta Sci. Pol. Technol. Aliment. 2015, 14, 233–246. [Google Scholar] [CrossRef]
- Bellani, L.; Muccifora, S.; Giorgetti, L. Impact of Sprouting and Cooking on Antioxidant Compounds and Activity in Different Italian Varieties of Lens culinaris L. Food Meas. 2020, 14, 333–342. [Google Scholar] [CrossRef]
- Boudjou, S.; Oomah, B.D.; Zaidi, F.; Hosseinian, F. Phenolics Content and Antioxidant and Anti-Inflammatory Activities of Legume Fractions. Food Chem. 2013, 138, 1543–1550. [Google Scholar] [CrossRef]
- Aguilera, Y.; Liébana, R.; Herrera, T.; Rebollo-Hernanz, M.; Sanchez-Puelles, C.; Benítez, V.; Martín-Cabrejas, M.A. Effect of Illumination on the Content of Melatonin, Phenolic Compounds, and Antioxidant Activity during Germination of Lentils (Lens culinaris L.) and Kidney Beans (Phaseolus vulgaris L.). J. Agric. Food Chem. 2014, 62, 10736–10743. [Google Scholar] [CrossRef]
- Dueñas, M.; Hernández, T.; Estrella, I. Phenolic Composition of the Cotyledon and the Seed Coat of Lentils (Lens culinaris L.). Eur. Food Res. Technol. 2002, 215, 478–483. [Google Scholar] [CrossRef]
- Wu, D.-T.; Li, W.-X.; Wan, J.-J.; Hu, Y.-C.; Gan, R.-Y.; Zou, L. A Comprehensive Review of Pea (Pisum sativum L.): Chemical Composition, Processing, Health Benefits, and Food Applications. Foods 2023, 12, 2527. [Google Scholar] [CrossRef] [PubMed]
- Han, X.; Akhov, L.; Ashe, P.; Lewis, C.; Deibert, L.; Irina Zaharia, L.; Forseille, L.; Xiang, D.; Datla, R.; Nosworthy, M.; et al. Comprehensive Compositional Assessment of Bioactive Compounds in Diverse Pea Accessions. Food Res. Int. 2023, 165, 112455. [Google Scholar] [CrossRef] [PubMed]
- El-Feky, A.M.; Elbatanony, M.M.; Mounier, M.M. Anti-Cancer Potential of the Lipoidal and Flavonoidal Compounds from Pisum sativum and Vicia faba Peels. Egypt. J. Basic Appl. Sci. 2018, 5, 258–264. [Google Scholar] [CrossRef]
- Guo, F.; Tsao, R.; Li, C.; Wang, X.; Zhang, H.; Jiang, L.; Sun, Y.; Xiong, H. Polyphenol Content of Green Pea (Pisum sativum L.) Hull under In Vitro Digestion and Effects of Digestive Products on Anti-Inflammatory Activity and Intestinal Barrier in the Caco-2/Raw264.7 Coculture Model. J. Agric. Food Chem. 2022, 70, 3477–3488. [Google Scholar] [CrossRef] [PubMed]
- Myrtsi, E.D.; Koulocheri, S.D.; Haroutounian, S.A. A Novel Method for the Efficient Simultaneous Quantification of 67 Phytoestrogens in Plants and Foodstuffs. Food Biosci. 2023, 56, 103357. [Google Scholar] [CrossRef]
- Castaldo, L.; Izzo, L.; Gaspari, A.; Lombardi, S.; Rodríguez-Carrasco, Y.; Narváez, A.; Grosso, M.; Ritieni, A. Chemical Composition of Green Pea (Pisum sativum L.) Pods Extracts and Their Potential Exploitation as Ingredients in Nutraceutical Formulations. Antioxidants 2021, 11, 105. [Google Scholar] [CrossRef] [PubMed]
- Castaldo, L.; Izzo, L.; Lombardi, S.; Gaspari, A.; De Pascale, S.; Grosso, M.; Ritieni, A. Analysis of Polyphenolic Compounds in Water-Based Extracts of Vicia faba L.: A Potential Innovative Source of Nutraceutical Ingredients. Antioxidants 2022, 11, 2453. [Google Scholar] [CrossRef] [PubMed]
- Johnson, J.B.; Skylas, D.J.; Mani, J.S.; Xiang, J.; Walsh, K.B.; Naiker, M. Phenolic Profiles of Ten Australian Faba Bean Varieties. Molecules 2021, 26, 4642. [Google Scholar] [CrossRef]
- Duan, S.-C.; Kwon, S.-J.; Eom, S.-H. Effect of Thermal Processing on Color, Phenolic Compounds, and Antioxidant Activity of Faba Bean (Vicia faba L.) Leaves and Seeds. Antioxidants 2021, 10, 1207. [Google Scholar] [CrossRef]
- Chaieb, N.; González, J.L.; López-Mesas, M.; Bouslama, M.; Valiente, M. Polyphenols Content and Antioxidant Capacity of Thirteen Faba Bean (Vicia faba L.) Genotypes Cultivated in Tunisia. Food Res. Int. 2011, 44, 970–977. [Google Scholar] [CrossRef]
- Raoof, G.F.A.; El-Anssary, A.A.; Younis, E.A.; Aly, H.F. Metabolomic Analysis and In Vitro Investigation of the Biological Properties of a By-Product Derived from Vicia faba. Chem. Biodivers. 2023, 20, e202301095. [Google Scholar] [CrossRef] [PubMed]
- Choudhary, D.K.; Chaturvedi, N.; Singh, A.; Mishra, A. Characterization, Inhibitory Activity and Mechanism of Polyphenols from Faba Bean (Gallic-Acid and Catechin) on α-Glucosidase: Insights from Molecular Docking and Simulation Study. Prep. Biochem. Biotech. 2020, 50, 123–132. [Google Scholar] [CrossRef] [PubMed]
- Babu, R.N. Antioxidant Activity of Pterocarpan (Phaseolus vulgaris) a Preliminary Assessment of Crude Extracts. Res. J. Pharm. Biol. Chem. Sci. 2012, 3, 271–276. [Google Scholar]
- Teixeira-Guedes, C.I.; Oppolzer, D.; Barros, A.I.; Pereira-Wilson, C. Impact of Cooking Method on Phenolic Composition and Antioxidant Potential of Four Varieties of Phaseolus vulgaris L. and Glycine max L. LWT 2019, 103, 238–246. [Google Scholar] [CrossRef]
- Han, H.; Baik, B.-K. Antioxidant Activity and Phenolic Content of Lentils (Lens culinaris), Chickpeas (Cicer arietinum L.), Peas (Pisum sativum L.) and Soybeans (Glycine max), and Their Quantitative Changes during Processing. Int. J. Food Sci. Technol. 2008, 43, 1971–1978. [Google Scholar] [CrossRef]
- Nithiyanantham, S.; Selvakumar, S.; Siddhuraju, P. Total Phenolic Content and Antioxidant Activity of Two Different Solvent Extracts from Raw and Processed Legumes, Cicer arietinum L. and Pisum sativum L. J. Food Compos. Anal. 2012, 27, 52–60. [Google Scholar] [CrossRef]
- Schaich, K.M.; Tian, X.; Xie, J. Reprint of “Hurdles and Pitfalls in Measuring Antioxidant Efficacy: A Critical Evaluation of ABTS, DPPH, and ORAC Assays”. J. Funct. Foods 2015, 18, 782–796. [Google Scholar] [CrossRef]
- Drakou, M.; Birmpa, A.; Koutelidakis, A.E.; Komaitis, M.; Panagou, E.Z.; Kapsokefalou, M. Total Antioxidant Capacity, Total Phenolic Content and Iron and Zinc Dialyzability in Selected Greek Varieties of Table Olives, Tomatoes and Legumes from Conventional and Organic Farming. Int. J. Food Sci. Nutr. 2015, 66, 197–202. [Google Scholar] [CrossRef]
- Chakraborty, A.; Bhattacharyya, S. Thermal Processing Effects on in Vitro Antioxidant Activities of Five Common Indian Pulses. J. Appl. Pharm. Sci. 2014, 4, 65–70. [Google Scholar] [CrossRef]
- Boukhanouf, S.; Louaileche, H.; Perrin, D. Phytochemical Content and in Vitro Antioxidant Activity of Faba Bean (Vicia faba L.) as Affected by Maturity Stage and Cooking Practice. Int. Food Res. J. 2016, 23, 954–961. [Google Scholar]


| Abbreviation | Samples | Extraction Yield (%) | ||
|---|---|---|---|---|
| Hex | DCM | MeOH | ||
| CAA | Cicer arietinum (clv Amorgos) | 3.15 | 1.46 | 5.89 |
| CAG | Cicer arietinum (clv Gavdos) | 3.40 | 1.65 | 9.12 |
| CAT | Cicer arietinum (clv Thiva) | 2.97 | 1.99 | 5.88 |
| PSO | Pisum sativum (clv Olympos) | 0.79 | 0.86 | 4.39 |
| PSD | Pisum sativum (clv Dodoni) | 1.25 | 0.71 | 4.48 |
| VFP | Vicia faba (clv Polykarpis) | 0.66 | 0.47 | 0.49 |
| VFT | Vicia faba (clv Tanagra) | 0.66 | 0.53 | 4.43 |
| PVP | Phaseolus vulgaris (clv Pyrgetos) | 1.06 | 0.73 | 4.23 |
| LCD | Lens culinaris (clv Dimitra) | 0.29 | 0.75 | 3.58 |
| LCT | Lens culinaris (clv Thessalia) | 1.16 | 0.92 | 5.36 |
| LCS | Lens culinaris (clv Samos) | 0.31 | 1.17 | 4.50 |
| Samples | TPC (mg GAE/g Extract) | TTC (mg CE/g Extract) |
|---|---|---|
| Cicer arietinum (clv Amorgos) | 4.2 ± 0.1 * | <LOD |
| Cicer arietinum (clv Gavdos) | 5.8 ± 0.1 * | 35.8 ± 20.9 * |
| Cicer arietinum (clv Thiva) | 4.4 ± 0.0 * | 25.3 ± 15.5 ** |
| Pisum sativum (clv Olympos) | 26.2 ± 6.0 *** | <LOD |
| Pisum sativum (clv Dodoni) | 12.7 ± 0.3 * | <LOD |
| Vicia faba (clv Polykarpis) | <LOD | <LOD |
| Vicia faba (clv Tanagra) | <LOD | 38.3 ± 22.4 * |
| Phaseolus vulgaris (clv Pyrgetos) | 8.2 ± 0.2 * | 38.5 ± 32.4 * |
| Lens culinaris (clv Dimitra) | 14.5 ± 0.5 * | 124.1 ± 76.6 * |
| Lens culinaris (clv Thessalia) | 10.5 ± 0.8 *** | 20.2 ± 12.2 * |
| Lens culinaris (clv Samos) | 12.3 ± 0.9 * | 95.4 ± 56.6 * |
| Compound | CAA | CAG | CAT | PSO | PSD | VFP | VFT | PVP | LCD | LCT | LCS |
|---|---|---|---|---|---|---|---|---|---|---|---|
| Apigenin | - | - | - | - | - | - | - | 0.035 ± 0.000 *** | - | - | - |
| Calycosin | - | - | - | - | - | - | - | - | - | - | 0.006 ± 0.000 * |
| Chlorogenic acid | - | - | - | - | tr | - | - | - | tr | - | - |
| Coumestrol | - | - | - | - | - | - | - | 0.823 ± 0.150 * | - | - | - |
| Daidzein | - | - | - | - | - | - | - | 0.293 ± 0.000 *** | - | - | - |
| Daidzin | - | - | - | - | - | - | - | 0.075 ± 0.006 *** | - | - | - |
| Diosmetin | - | - | tr | - | - | - | - | tr | - | - | - |
| Epigallocatechin gallate | - | tr | tr | - | - | - | tr | - | - | - | - |
| Genistein | - | - | - | - | - | - | - | 3.880 ± 0.004 *** | - | - | - |
| Glycitein | - | - | - | - | - | - | - | 0.011 ± 0.000 * | - | - | - |
| Glycitin | - | tr | - | tr | - | - | - | - | - | - | tr |
| Hydroxytyrosol | - | - | - | - | - | - | - | 0.258 ± 0.018 **** | - | - | - |
| Isoliquiritigenin | - | - | - | tr | tr | - | - | - | - | - | 0.002 ± 0.000 ** |
| Isoquercetin | tr | tr | tr | tr | tr | tr | tr | tr | tr | tr | tr |
| Ononin | tr | tr | - | tr | tr | tr | tr | - | - | tr | - |
| Procyanidin B1 | - | - | - | tr | - | - | - | - | 0.001 ± 0.000 * | - | 0.002 ± 0.001 * |
| Procyanidin B2 | - | - | - | tr | - | - | - | - | 0.015 ± 0.002 * | 0.006 ± 0.001 * | 0.032 ± 0.005 * |
| Quercetagetin-7-O-glucoside | - | - | - | tr | - | tr | tr | - | tr | - | - |
| Quercitrin | tr | - | - | tr | tr | tr | tr | - | tr | tr | tr |
| Sample | DPPH (mg TE/g Extract) | FRAP (mmol Fe(II)-E/g Extract) | ||||
|---|---|---|---|---|---|---|
| Hex | DCM | MeOH | Hex | DCM | MeOH | |
| Cicer arietinum (clv Amorgos) | <LOD | <LOD | <LOD | 0.08 ± 0.00 * | 0.27 ± 0.01 * | <0.01 * |
| Cicer arietinum (clv Gavdos) | <LOD | <LOD | <LOD | 0.09 ± 0.00 *** | 0.32 ± 0.00 * | 0.02 ± 0.00 * |
| Cicer arietinum (clv Thiva) | <LOD | <LOD | <LOD | 0.08 ± 0.00 ** | 0.23 ± 0.01 * | <0.01 * |
| Pisum sativum (clv Olympos) | <LOD | <LOD | <LOD | 0.17 ± 0.00 * | 0.59 ± 0.00 * | 0.03 ± 0.00 * |
| Pisum sativum (clv Dodoni) | 3.3 ± 0.2 * | <LOD | <LOD | 0.24 ± 0.00 * | 0.81 ± 0.01 | 0.13 ± 0.01 *** |
| Vicia faba (clv Polykarpis) | 0.7 ± 0.3 * | <LOD | 7.0 ± 1.0 ** | 0.15 ± 0.00 * | 1.77 ± 0.02 * | 0.23 ± 0.01 * |
| Vicia faba (clv Tanagra) | <LOD | <LOD | <LOD | 0.46 ± 0.01 * | 0.56 ± 0.00 * | 0.10 ± 0.00 * |
| Phaseolus vulgaris (clv Pyrgetos) | <LOD | <LOD | <LOD | 0.08 ± 0.00 * | 1.13 ± 0.00 * | 0.05 ± 0.00 * |
| Lens culinaris (clv Dimitra) | <LOD | <LOD | 3.5 ± 1.7 * | 0.17 ± 0.01 * | 1.13 ± 0.02 * | 0.13 ± 0.00 ** |
| Lens culinaris (clv Thessalia) | <LOD | <LOD | 0.9 ± 0.4 * | 0.41 ± 0.02 * | 0.72 ± 0.01 * | 0.16 ± 0.01 ** |
| Lens culinaris (clv Samos) | <LOD | <LOD | 5.0 ± 0.4 ** | 0.16 ± 0.00 * | 0.87 ± 0.02 * | 0.20 ± 0.00 * |
Disclaimer/Publisher’s Note: The statements, opinions and data contained in all publications are solely those of the individual author(s) and contributor(s) and not of MDPI and/or the editor(s). MDPI and/or the editor(s) disclaim responsibility for any injury to people or property resulting from any ideas, methods, instructions or products referred to in the content. |
© 2024 by the authors. Licensee MDPI, Basel, Switzerland. This article is an open access article distributed under the terms and conditions of the Creative Commons Attribution (CC BY) license (https://creativecommons.org/licenses/by/4.0/).
Share and Cite
Myrtsi, E.D.; Vlachostergios, D.N.; Petsoulas, C.; Koulocheri, S.D.; Evergetis, E.; Haroutounian, S.A. Εleven Greek Legume Beans: Assessment of Genotypic Effect on Their Phytochemical Content and Antioxidant Properties. Antioxidants 2024, 13, 459. https://doi.org/10.3390/antiox13040459
Myrtsi ED, Vlachostergios DN, Petsoulas C, Koulocheri SD, Evergetis E, Haroutounian SA. Εleven Greek Legume Beans: Assessment of Genotypic Effect on Their Phytochemical Content and Antioxidant Properties. Antioxidants. 2024; 13(4):459. https://doi.org/10.3390/antiox13040459
Chicago/Turabian StyleMyrtsi, Eleni D., Dimitrios N. Vlachostergios, Christos Petsoulas, Sofia D. Koulocheri, Epameinondas Evergetis, and Serkos A. Haroutounian. 2024. "Εleven Greek Legume Beans: Assessment of Genotypic Effect on Their Phytochemical Content and Antioxidant Properties" Antioxidants 13, no. 4: 459. https://doi.org/10.3390/antiox13040459