Article

Ubiquinone (Coenzyme Q-10) Supplementation Influences Exercise-Induced Changes in Serum 25(OH)D3 and the Methyl-Arginine Metabolites: A Double-Blind Randomized Controlled Trial

by
Jan Mieszkowski
1,2,*,
Andrzej Kochanowicz
1,
Paulina Brzezińska
1,
Magdalena Kochanowicz
3,
Katarzyna Żołądkiewicz
1,
Błażej Stankiewicz
4,
Bartłomiej Niespodziński
5,
Joanna Reczkowicz
6,
Konrad Kowalski
6 and
Jędrzej Antosiewicz
6,*
1
Department of Gymnastics and Dance, Gdańsk University of Physical Education and Sport, 80-336 Gdańsk, Poland
2
Faculty of Physical Education and Sport, Charles University, 162 52 Prague, Czech Republic
3
Department of Physical Therapy, Medical University of Gdańsk, 80-211 Gdańsk, Poland
4
Department of Biomedical Basis of Physical Education, Institute of Physical Education, Kazimierz Wielki University, 85-064 Bydgoszcz, Poland
5
Department of Biological Foundations of Physical Education, Faculty of Health Sciences and Physical Education, Kazimierz Wielki University, 85-064 Bydgoszcz, Poland
6
Department of Bioenergetics and Physiology of Exercise, Medical University of Gdańsk, 80-211 Gdańsk, Poland
*
Authors to whom correspondence should be addressed.
Antioxidants 2024, 13(7), 760; https://doi.org/10.3390/antiox13070760
Submission received: 14 May 2024 / Revised: 12 June 2024 / Accepted: 19 June 2024 / Published: 23 June 2024
(This article belongs to the Section Antioxidant Enzyme Systems)

Abstract

:
Researchers have studied the effects of exercise on serum methyl-arginine and vitamin D metabolites; however, the effects of exercise combined with antioxidants are not well documented. Since oxidative stress affects the metabolism of vitamin D and methyl-arginine, we hypothesised that the antioxidant coenzyme Q10 (CoQ10) might modulate exercise-induced changes. A group of twenty-eight healthy men participated in this study and were divided into two groups: an experimental group and a control group. The exercise test was performed until exhaustion, with gradually increasing intensity, before and after the 21-day CoQ10 supplementation. Blood samples were collected before, immediately after, and 3 and 24 h after exercise. CoQ10, vitamin D metabolites, asymmetric dimethylarginine (ADMA), symmetric dimethylarginine, methylarginine, dimethylamine, arginine, citrulline, and ornithine were analysed in serum samples. CoQ10 supplementation caused a 2.76-fold increase in the concentration of serum CoQ10. Conversely, the 25(OH)D3 concentration increased after exercise only in the placebo group. ADMA increased after exercise before supplementation, but a decrease was observed in the CoQ10 supplementation group 24 h after exercise. In conclusion, our data indicate that CoQ10 supplementation modifies the effects of exercise on vitamin D and methyl-arginine metabolism, suggesting its beneficial effects. These findings contribute to the understanding of how antioxidants like CoQ10 can modulate biochemical responses to exercise, potentially offering new insights for enhancing athletic performance and recovery.

1. Introduction

Coenzyme Q10 (CoQ10) is an important compound for cell energetic metabolism as part of the respiratory chain, and it has strong antioxidant properties [1]. CoQ10 is commonly used to prevent and treat diseases such as myocardial infarction, congestive heart failure, acute pancreatitis, and many other diseases [2,3]. Moreover, CoQ10 can prevent oxidative stress, including that induced by exhaustive exercise [3]. Conversely, vitamin D, although not considered an antioxidant, can promote the enzymatic antioxidant potential of cells [4].
It is well known that exercise increases free radical formation and markers of oxidative stress [5]. Increases in lipid and protein peroxidation products and other oxidative changes have been reported after exercise [6]. An increase in reactive oxygen species (ROS) formation can also affect some metabolic changes. For example, ROS can inactivate dimethylarginine dimethylaminohydrolase (DDAH)—an enzyme that is important for eliminating asymmetric dimethylarginine (ADMA) and methylarginine (MMA) [7], both of which compete with arginine for the active centre of nitric oxide synthase (NOS), thus blocking NO synthesis. Reduced NO formation can affect many processes, such as blood flow, glucose transport, and mitochondrial respiration, among others [8]. ROS can also influence vitamin D metabolism [9]. Low glucose-6-phosphate dehydrogenase activity leads to decreased formation of NADPH and a drop in intracellular glutathione (GSH), which negatively influences vitamin D activation and receptor-mediated action [10,11]. A single bout of exercise has been shown to increase serum level of 25(OH)D3. However, it is unknown if this is a result, e.g., augmented lipolysis, as part of vitamin D is stored in adipose tissue, or a stress response manifested by increased vitamin D hydroxylation. Both vitamin D hydroxylases and CoQ10 are located mainly in mitochondria; thus, it is possible that they can influence each other. While CoQ10 is recognised for its role in reducing oxidative damage and improving cellular energy production, the specific interactions with vitamin D and pathways through which it exerts its protective effects remain to be fully elucidated. As mentioned above, CoQ10 has been reported to reduce exercise-induced oxidative stress, but there are no reports demonstrating that it can inhibit exercise lipolysis.
Thus, in this study, we postulated that CoQ10 will abolish exercise-induced changes in 25(OH)D3. Moreover, we hypothesised that an exercise-induced increase in ADMA, as observed in previous studies [12], would be abrogated by CoQ10 supplementation. Therefore, the study aimed to evaluate the effects of CoQ10 supplementation on exercise-induced changes in serum 25(OH)D3 and methyl-arginine metabolites.

2. Materials and Methods

2.1. Ethics

The Bioethics Committee for Clinical Research at the Regional Medical Chamber in Gdansk approved this research (Consent No. KB-23/22), which was conducted according to the principles of the Declaration of Helsinki. Prior to the study, the participants gave written informed consent to participate, and they had the option of withdrawing at any time for any reason. The study was registered as a clinical trial NCT05412888.

2.2. Experimental Overview
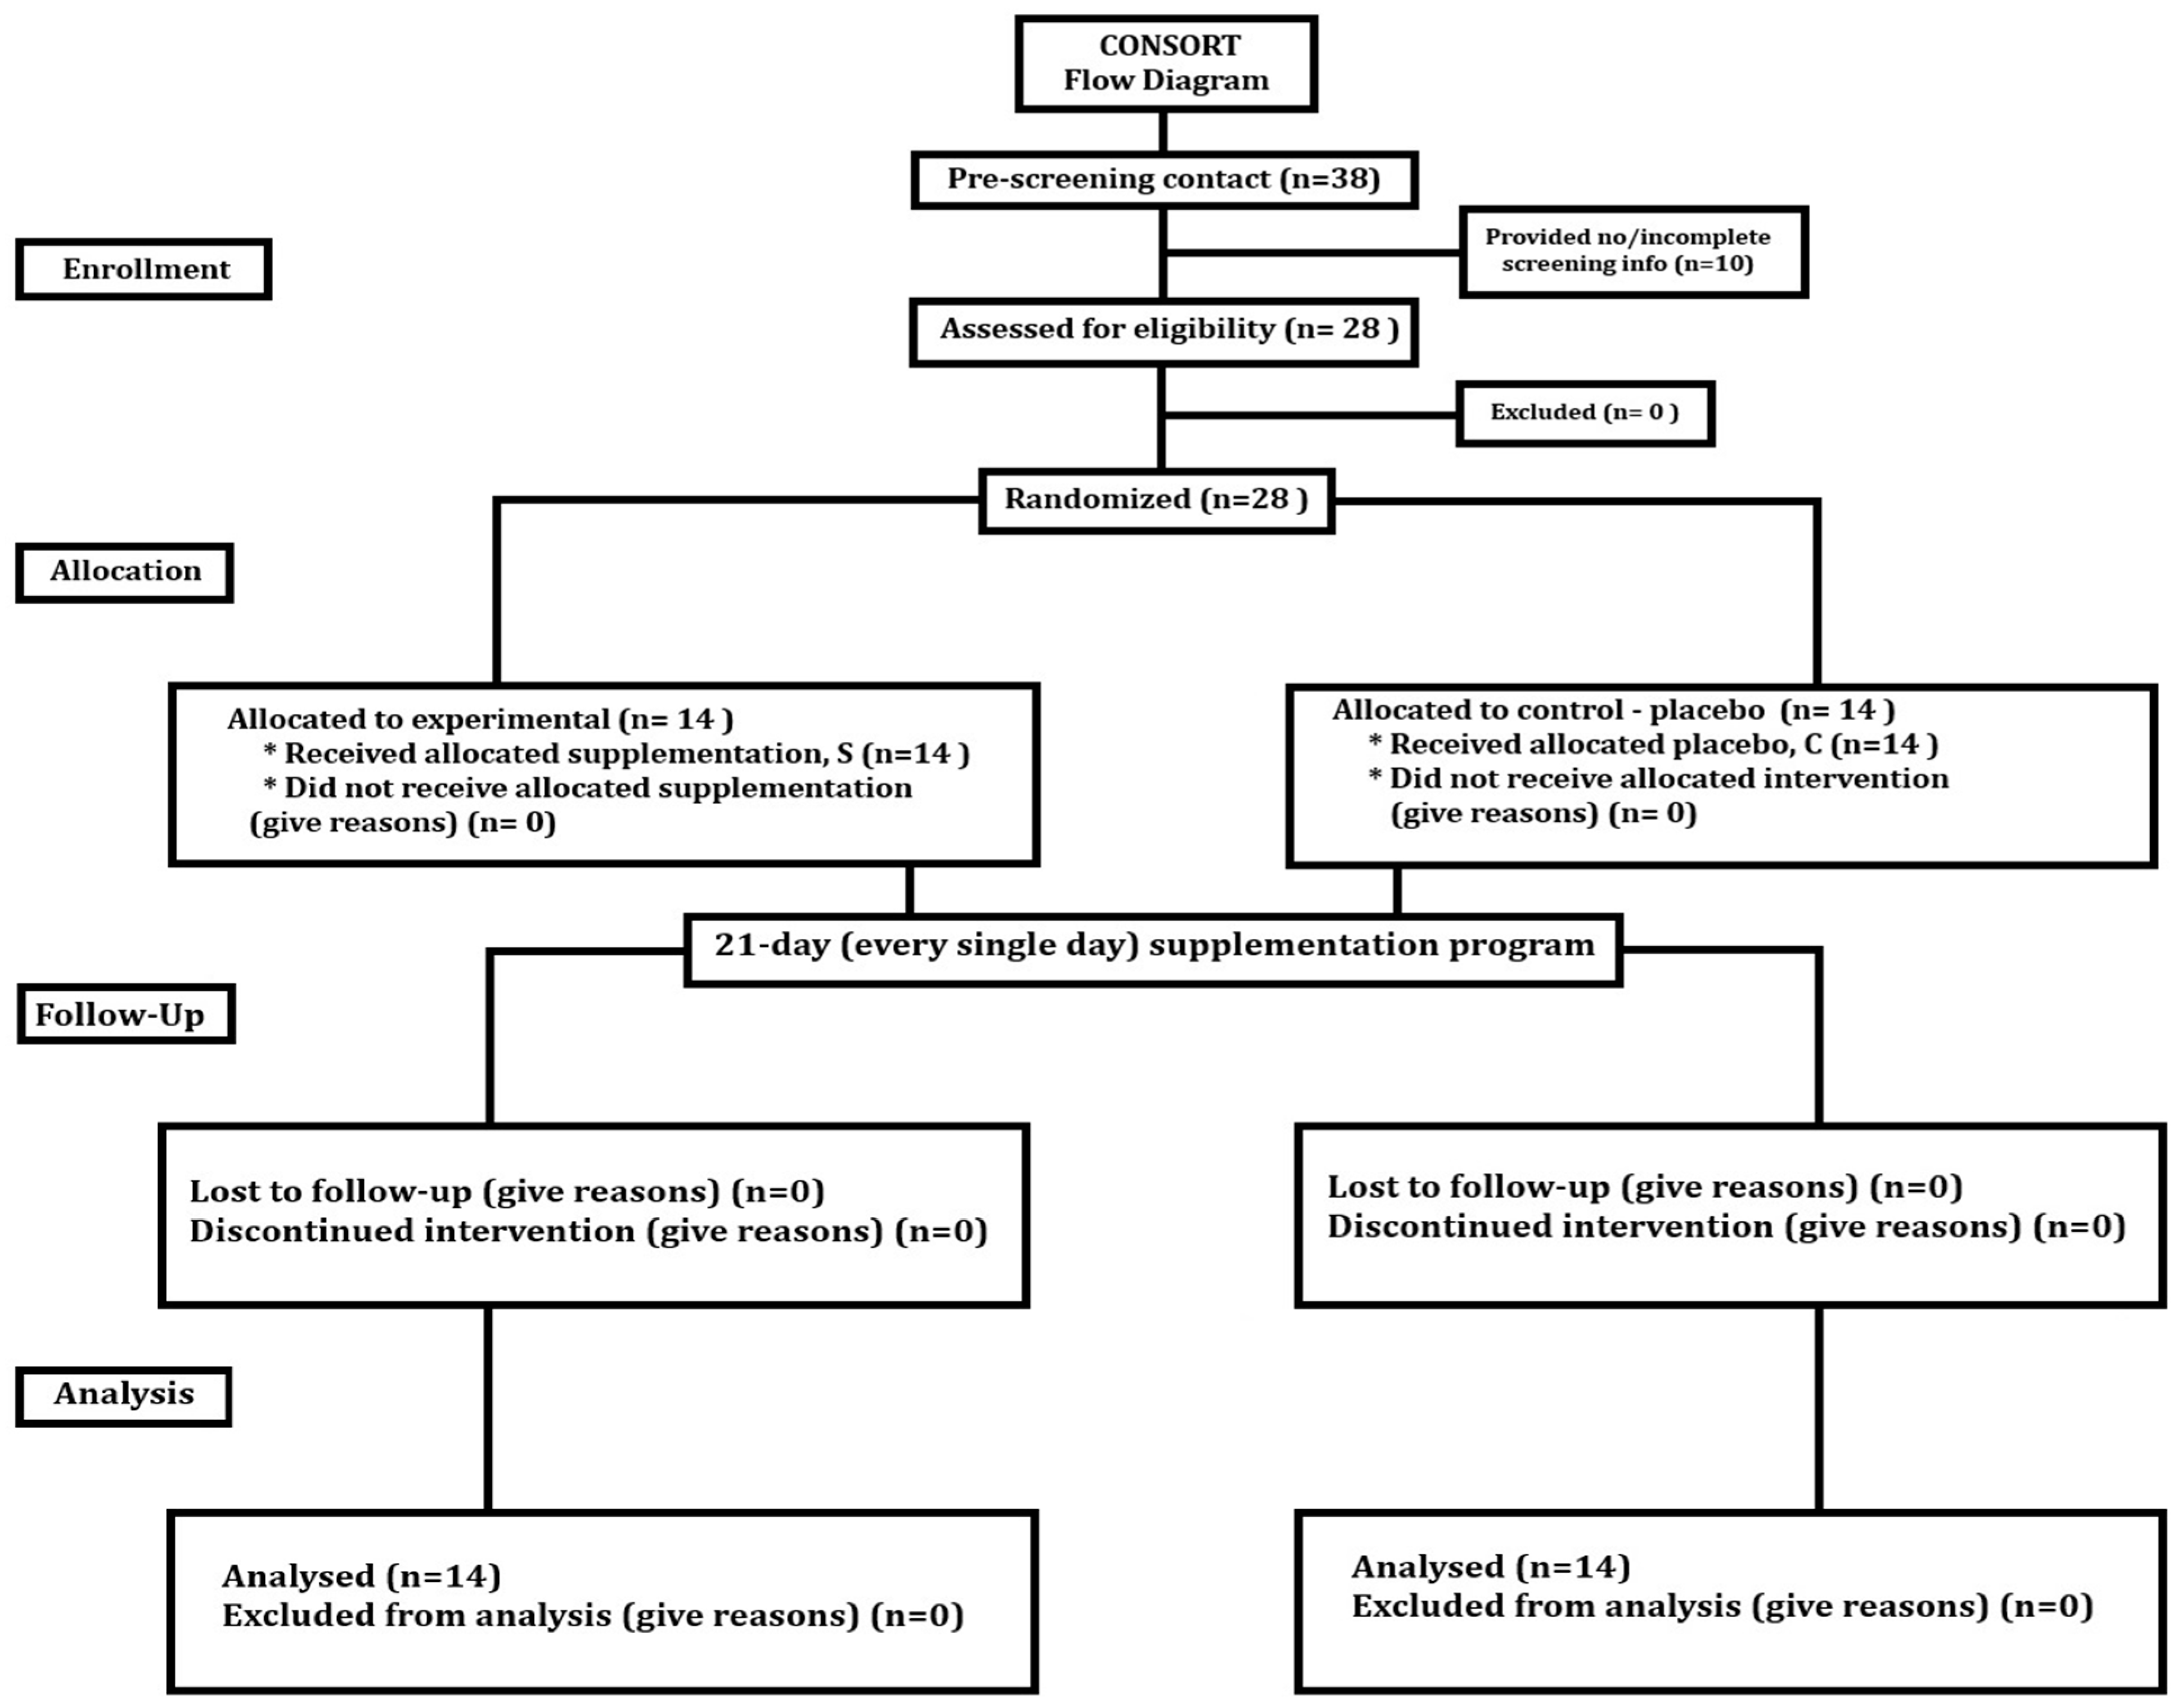
The study was designed as a double-blind, randomised, controlled trial with parallel groups (Figure 1). The supplementation protocol involved a 21-day (7 times per week) supplementation program with 300 mg of CoQ10.
During the initial study visits, the participants’ ages, body compositions, and heights were recorded. All participants were examined by a professional physician and found to be healthy. Before and after 21 days of supplementation, the participants completed the Bruce Treadmill Aerobic Test (BTT). Furthermore, to evaluate how CoQ10 supplementation modifies the effects of exercise on vitamin D and methyl-arginine metabolism, venous blood samples were collected at selected timepoints before and after the supplementation period for serum analysis. All laboratory analyses were performed at the Gdansk University of Physical Education (Gdansk, Poland).

2.3. Participants

Twenty-eight physically active, healthy men participated in the study. They all regularly participated in recreational sports, such as running, swimming, judo, and team sports (on average, 2–3 times per week for 45 min each time). The participants had normal health status during the preceding three months, defined as no bone or muscle tissue injuries, no history of abnormalities of the cardiovascular system or autonomic nervous system, and no history of mental disorders or other diseases that might directly affect the study results.
The participants took no drugs during the study or in the three months preceding it and were provided with a list of foods rich in CoQ10 that could not be eaten during the experiment. Prior to the start of the study, a medical practitioner examined all participants. They were informed about the study procedures before enrolment but were unaware of the study aims or the supplementation schedule. The runners were randomly assigned to two groups: an experimental (supplementation, S; n = 14, age 20.11 ± 1.12 years) and a control (placebo, C; n = 14, age 20.32 ± 1.57 years).

2.4. Measurement of Aerobic Components of Fitness: Bruce Treadmill Test

The Bruce protocol was performed on an electric treadmill (H/P/Cosmos, München, Germany). After standardising the warm-up (5 min with 60% HR max), each participant ran with increasing loads induced by velocity and treadmill inclination. During the testing, participants underwent specific test stages from 1 to 10 with increasing speed and velocity, from a 10% incline at 2.7 km/h (level 1) to a 28% incline at 12.07 km/h (level 10). Time was constant for each stage, with velocity and inclination alterations at every three minutes. The test was stopped when the subject could no longer continue owing to fatigue or other conditions. The interruption criterion was associated with fatigue, difficulties in breathing, muscular tiredness, chest pain or any factor limiting the effort. The whole treadmill speed and incline are presented in the Table 1. The test was stopped when the subject could no longer continue owing to fatigue or other conditions.

2.5. Supplementation

Both groups completed a 21-day (every single day) supplementation program. The experimental population received 300 mg of CoQ10.
The control group received the same number of identical-looking, rice-flavoured gelatine capsules. The CoQ10 and placebo supplements were both produced by the CoQ10-cyclodextrin complex as HydroQSorb® (Tishcon Corp, New York, NY, USA), and they were placed in identical plastic boxes marked by codes indicating the type of preparation and recommended dose. Participants did not know what kind of supplement they received.

2.6. Sample Collection and Measurements of CoQ10, Vitamin D, ADMA, Symmetric Dimethylarginine (SDMA), MMA, Dimethylamine (DMA), Arginine (Arg), Citrulline (Cit), and Ornithine (Orn)

Blood samples were collected (in a sitting position) before and after 21 days of CoQ10 supplementation. Whole blood samples were collected at four timepoints (immediately before, after, 3 h and 24 h after a BTT) in 5 mL BD Vacutainer Clot Activator Tubes (Becton Dickinson and Company, Franklin Lakes, NJ, USA). The serum was separated by centrifugation at 4000× g for 10 min and aliquoted into 500 μL portions. The samples were frozen and stored (for no longer than 6 months) at −80 °C until further analysis.
Sample preparation was based on serum protein precipitation and derivatisation: 4-(4′-Dimethylaminophenyl)-1,2,4-triazoline-3,5-dione, used as the derivatisation agent, was synthesised at the Masdiag Laboratory (Warsaw, Poland). Quantitative analysis of vitamin D metabolites was performed using liquid chromatography coupled with tandem mass spectrometry (LC-MS/MS) (QTRAP®4500 (Sciex, Framingham, MA, USA) coupled with an ExionLC HPLC system) according to Rola et al. [13], with minor changes. Methyl-arginine metabolites and CoQ10 were also analysed using LC-MS/MS.
Serum samples were analysed in positive ion mode using electrospray ionisation. The raw data were collected using LabSolutions LCGC, which was also used to process and quantify the collected data. Mobile phases were prepared with acetonitrile (Honeywell, Sigma-Aldrich, Gillingham, Dorset, UK), water (POCh S.A., Gliwice, Poland), and formic acid (Merck KGaA, Darmstadt, Germany). All solvents were LC-MS-grade.
The following vitamin D metabolites were analysed: 25(OH)D3, 25(OH)D2, 24,25(OH)2D3, 3-epi-25(OH)D3, 24,25(OH)2D3:25(OH)D3 ratio, and 3-epi-25(OH)D3:25(OH)D3 ratio. All the concentrations of vitamin D metabolites are expressed as ng/mL, which can be transformed to nmol/L by multiplying by 2.5, e.g., 30 ng/mL 25(OH)D3 equals 75 nmol/L. The following methyl-arginine metabolites were also analysed: ADMA, Arg, Cit, DMA, MMA, Orn, Arg:ADMA ratio and SDMA.
The concentration of CoQ10 was determined using reverse-phased high-performance liquid chromatography coupled with tandem mass spectrometry. Quantitative analysis involved calculating the ratio of the amount of an internal standard of known concentration to the amount of analyte read from the standard curve. A second MRM pass (qualitative analysis) confirmed the compound’s identity.

2.7. Statistical Analysis
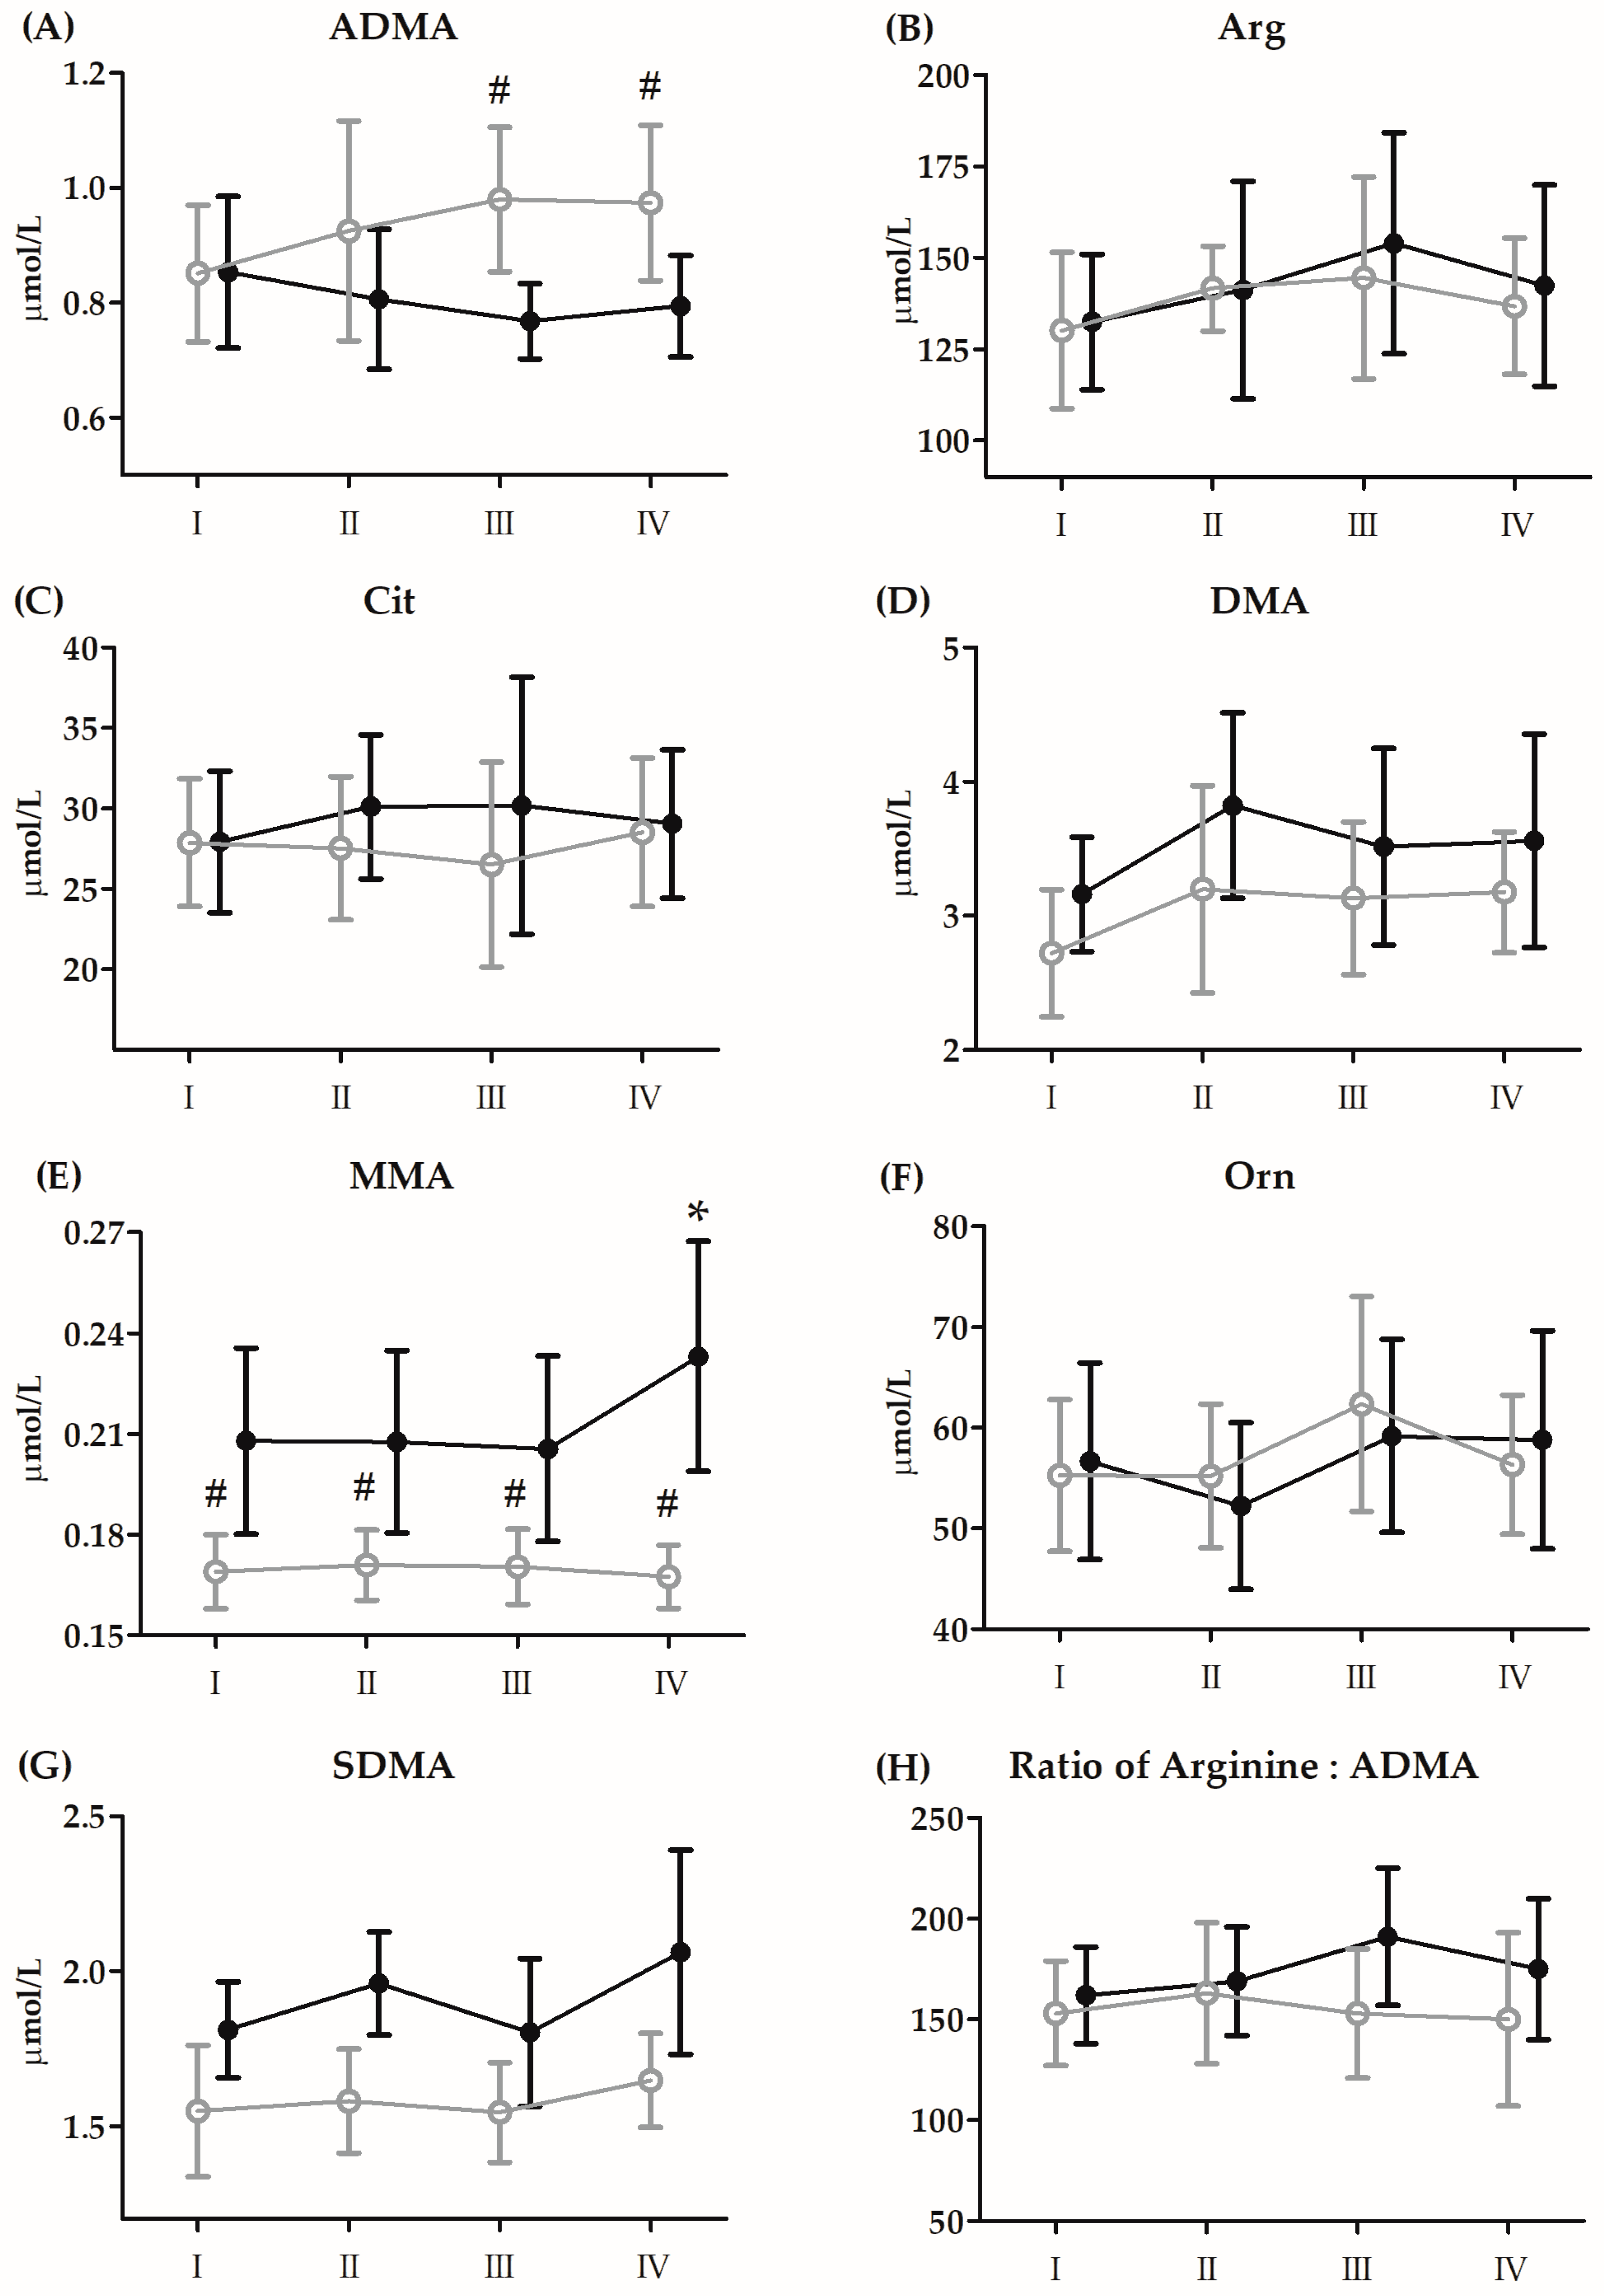
Descriptive statistics included the mean ± standard deviation (SD) for all measured variables. The data were analysed using a set of two two-factor mixed-design analyses of variance (ANOVA). In the first analysis, the within-subject factor (repeated measures) represented the supplementation effect on the performance variables. In the second analysis, the within-subject factor (repeated measures) represented the effort effect of BTT (at baseline, immediately after BTT, and 3 h and 24 h after BTT), and the between-subject factor represented the group effect (supplementation or control group). The significance threshold was set at p < 0.05. The required total sample sizes of 12 (ANOVA: 2 × 4) and 16 participants (ANOVA: 2 × 2) for the groups were estimated using G*Power v. 3.1.9.4. software (Franz Faul et al., Universität Kiel, Kiel, Germany) for a large effect size, and a power of 0.80. Statistical analysis was performed using Statistica 13 software (TIBCO Software Inc., Palo Alto, CA, USA).

3. Results

3.1. Anthropometric Characteristics and Performance

The performance and physiological characteristics of the groups before and after 21 days of supplementation with CoQ10 are shown in Table 2. The examined morphological and physiological parameters showed no significant changes after 21 days of CoQ10 supplementation.

3.2. Resting Values before and after the 21-Day Supplementation Period

Resting concentrations of CoQ10, vitamin D3 metabolites, and amino acid metabolites before and after 21 days of supplementation with CoQ10 are shown in Table 3.
A two-way ANOVA with repeated-measure analysis showed a significant increase over 2.7 times baseline CoQ10 after 21 days of CoQ10 supplementation. In the supplementation group, significant increases in the baseline concentrations of 25(OH)D3 (17.3%, p < 0.01) 3-epi-25(OH)D3 (53.9%, p < 0.01), 3-epi-25(OH)D3:25(OH)D3 ratio (32.0%, p < 0.01), Arg (12.0%, p < 0.05), MMA (24.7%, p < 0.01), and SDMA (16.0 %, p < 0.01) were also observed.
In addition, the resting concentrations of CoQ10, MMA, and SDMA after 21 days of CoQ10 supplementation were significantly higher than those in the placebo group.

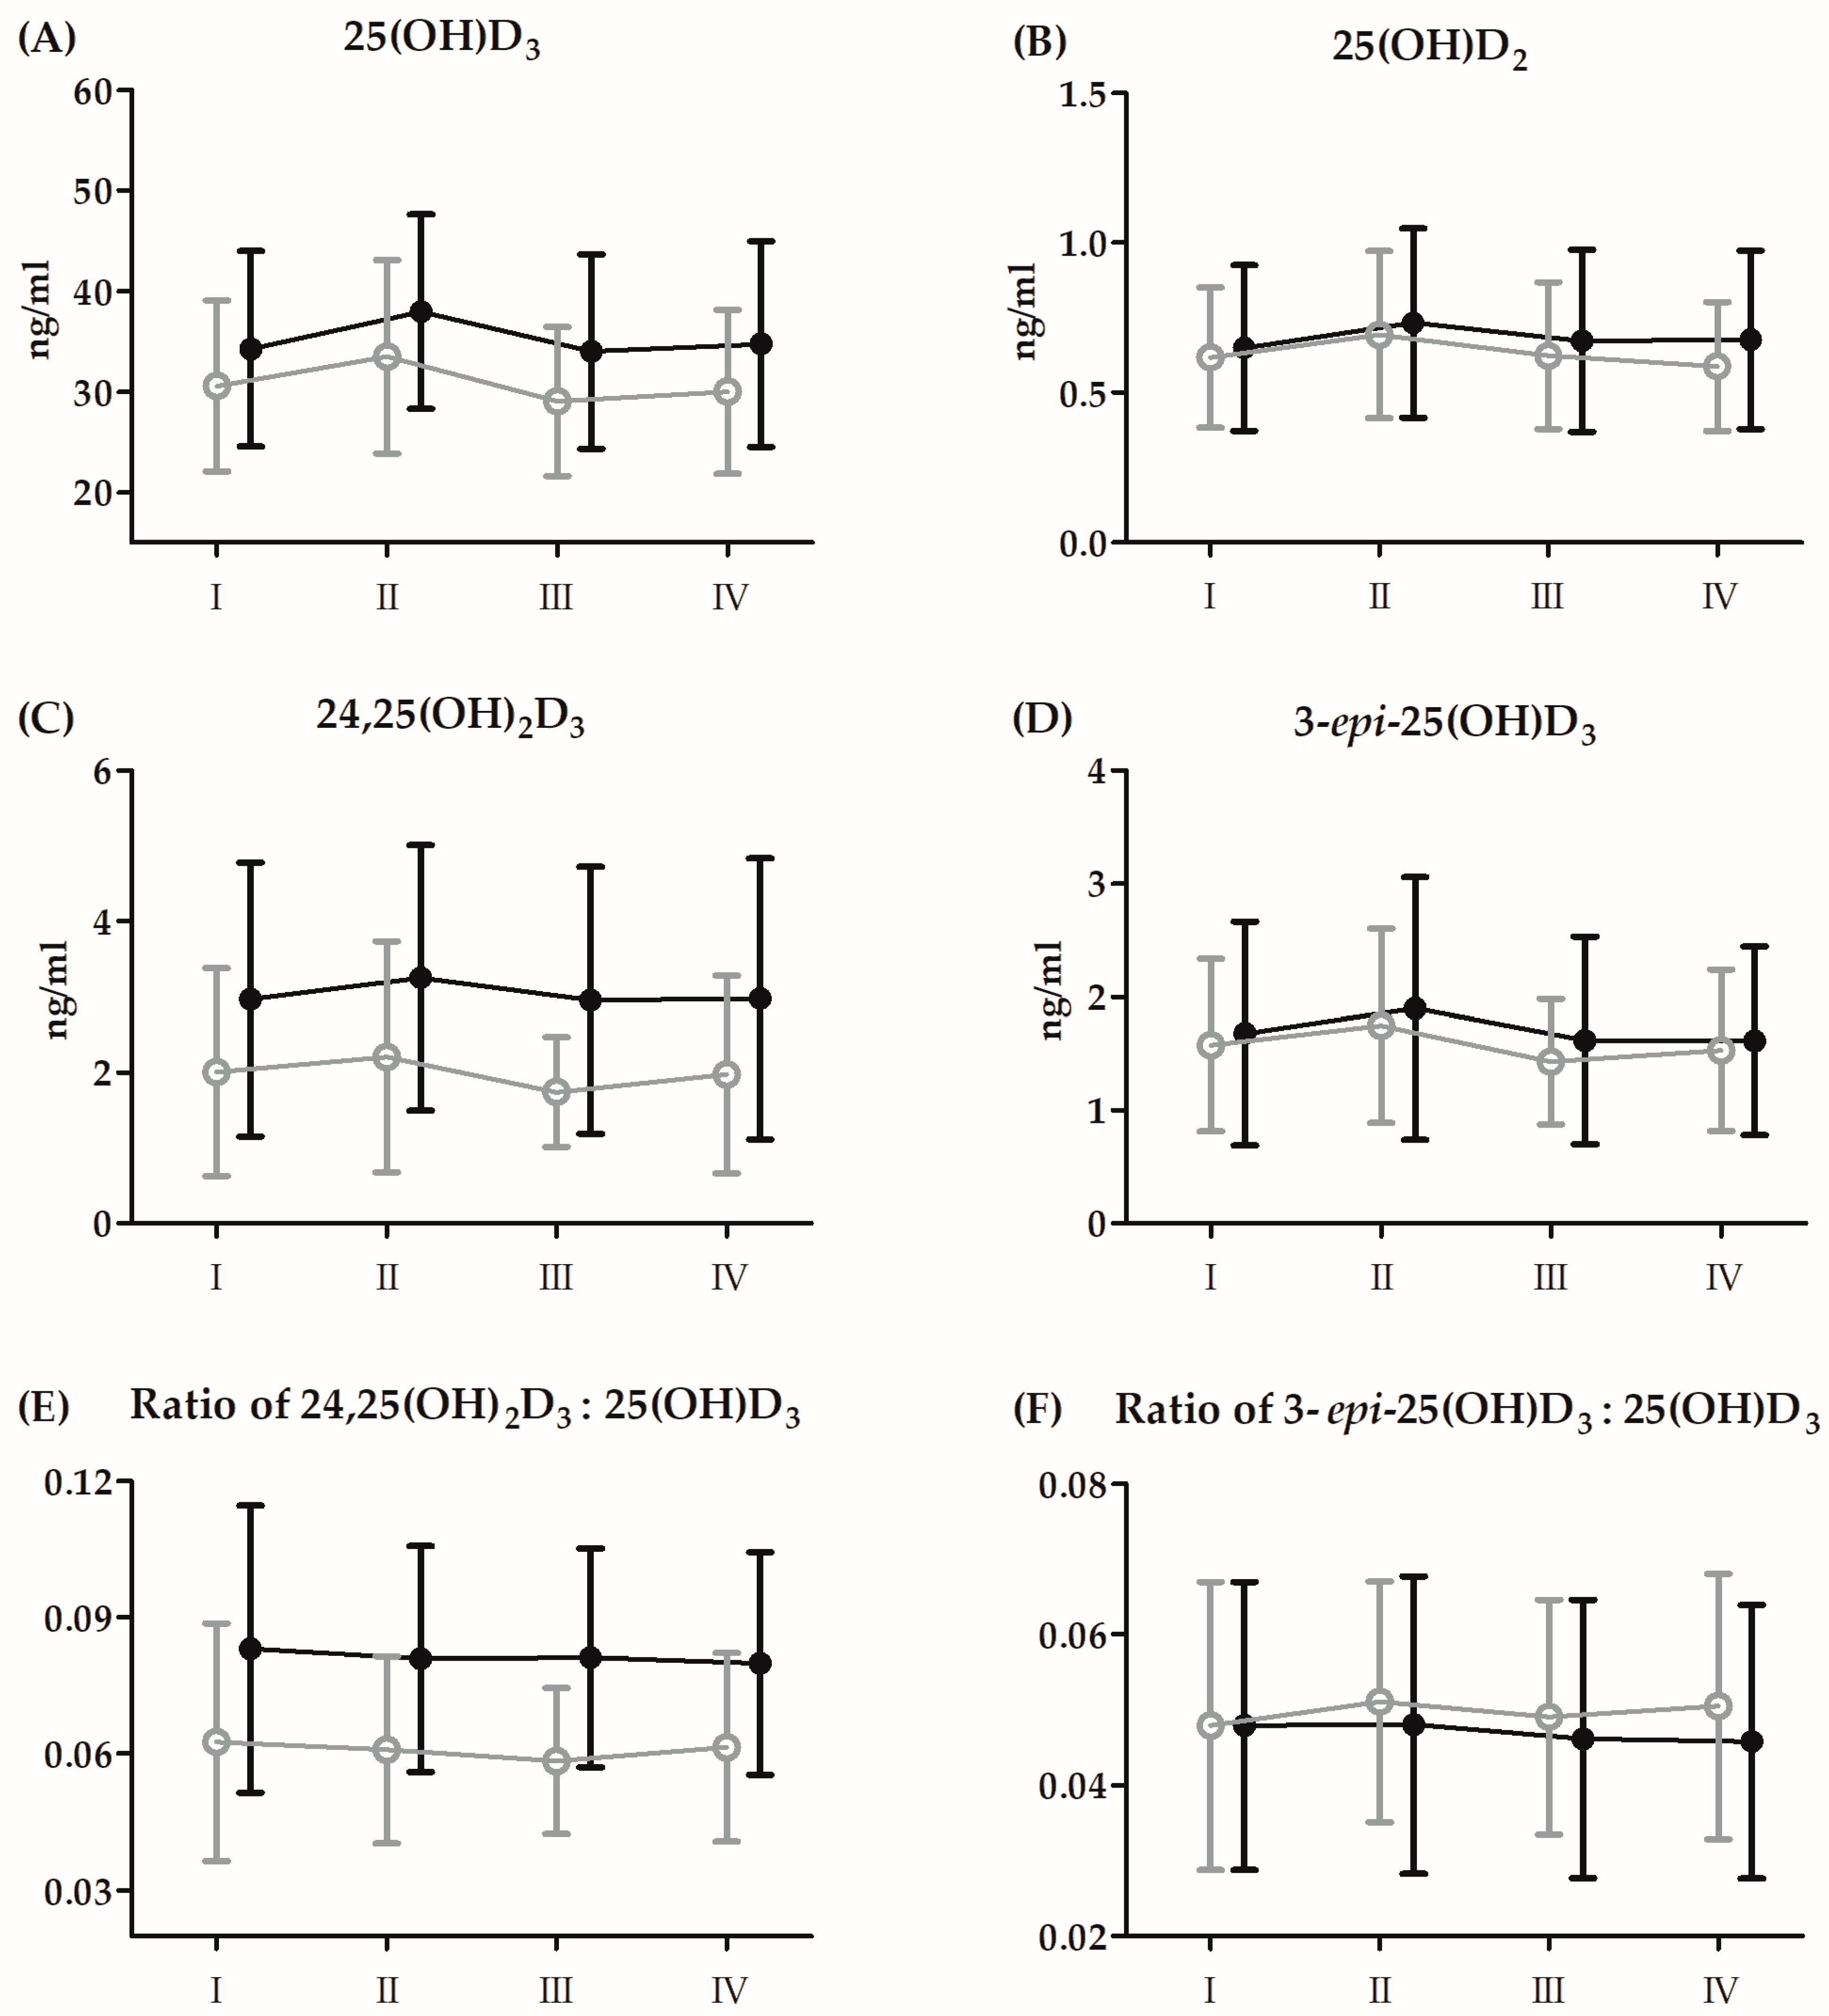
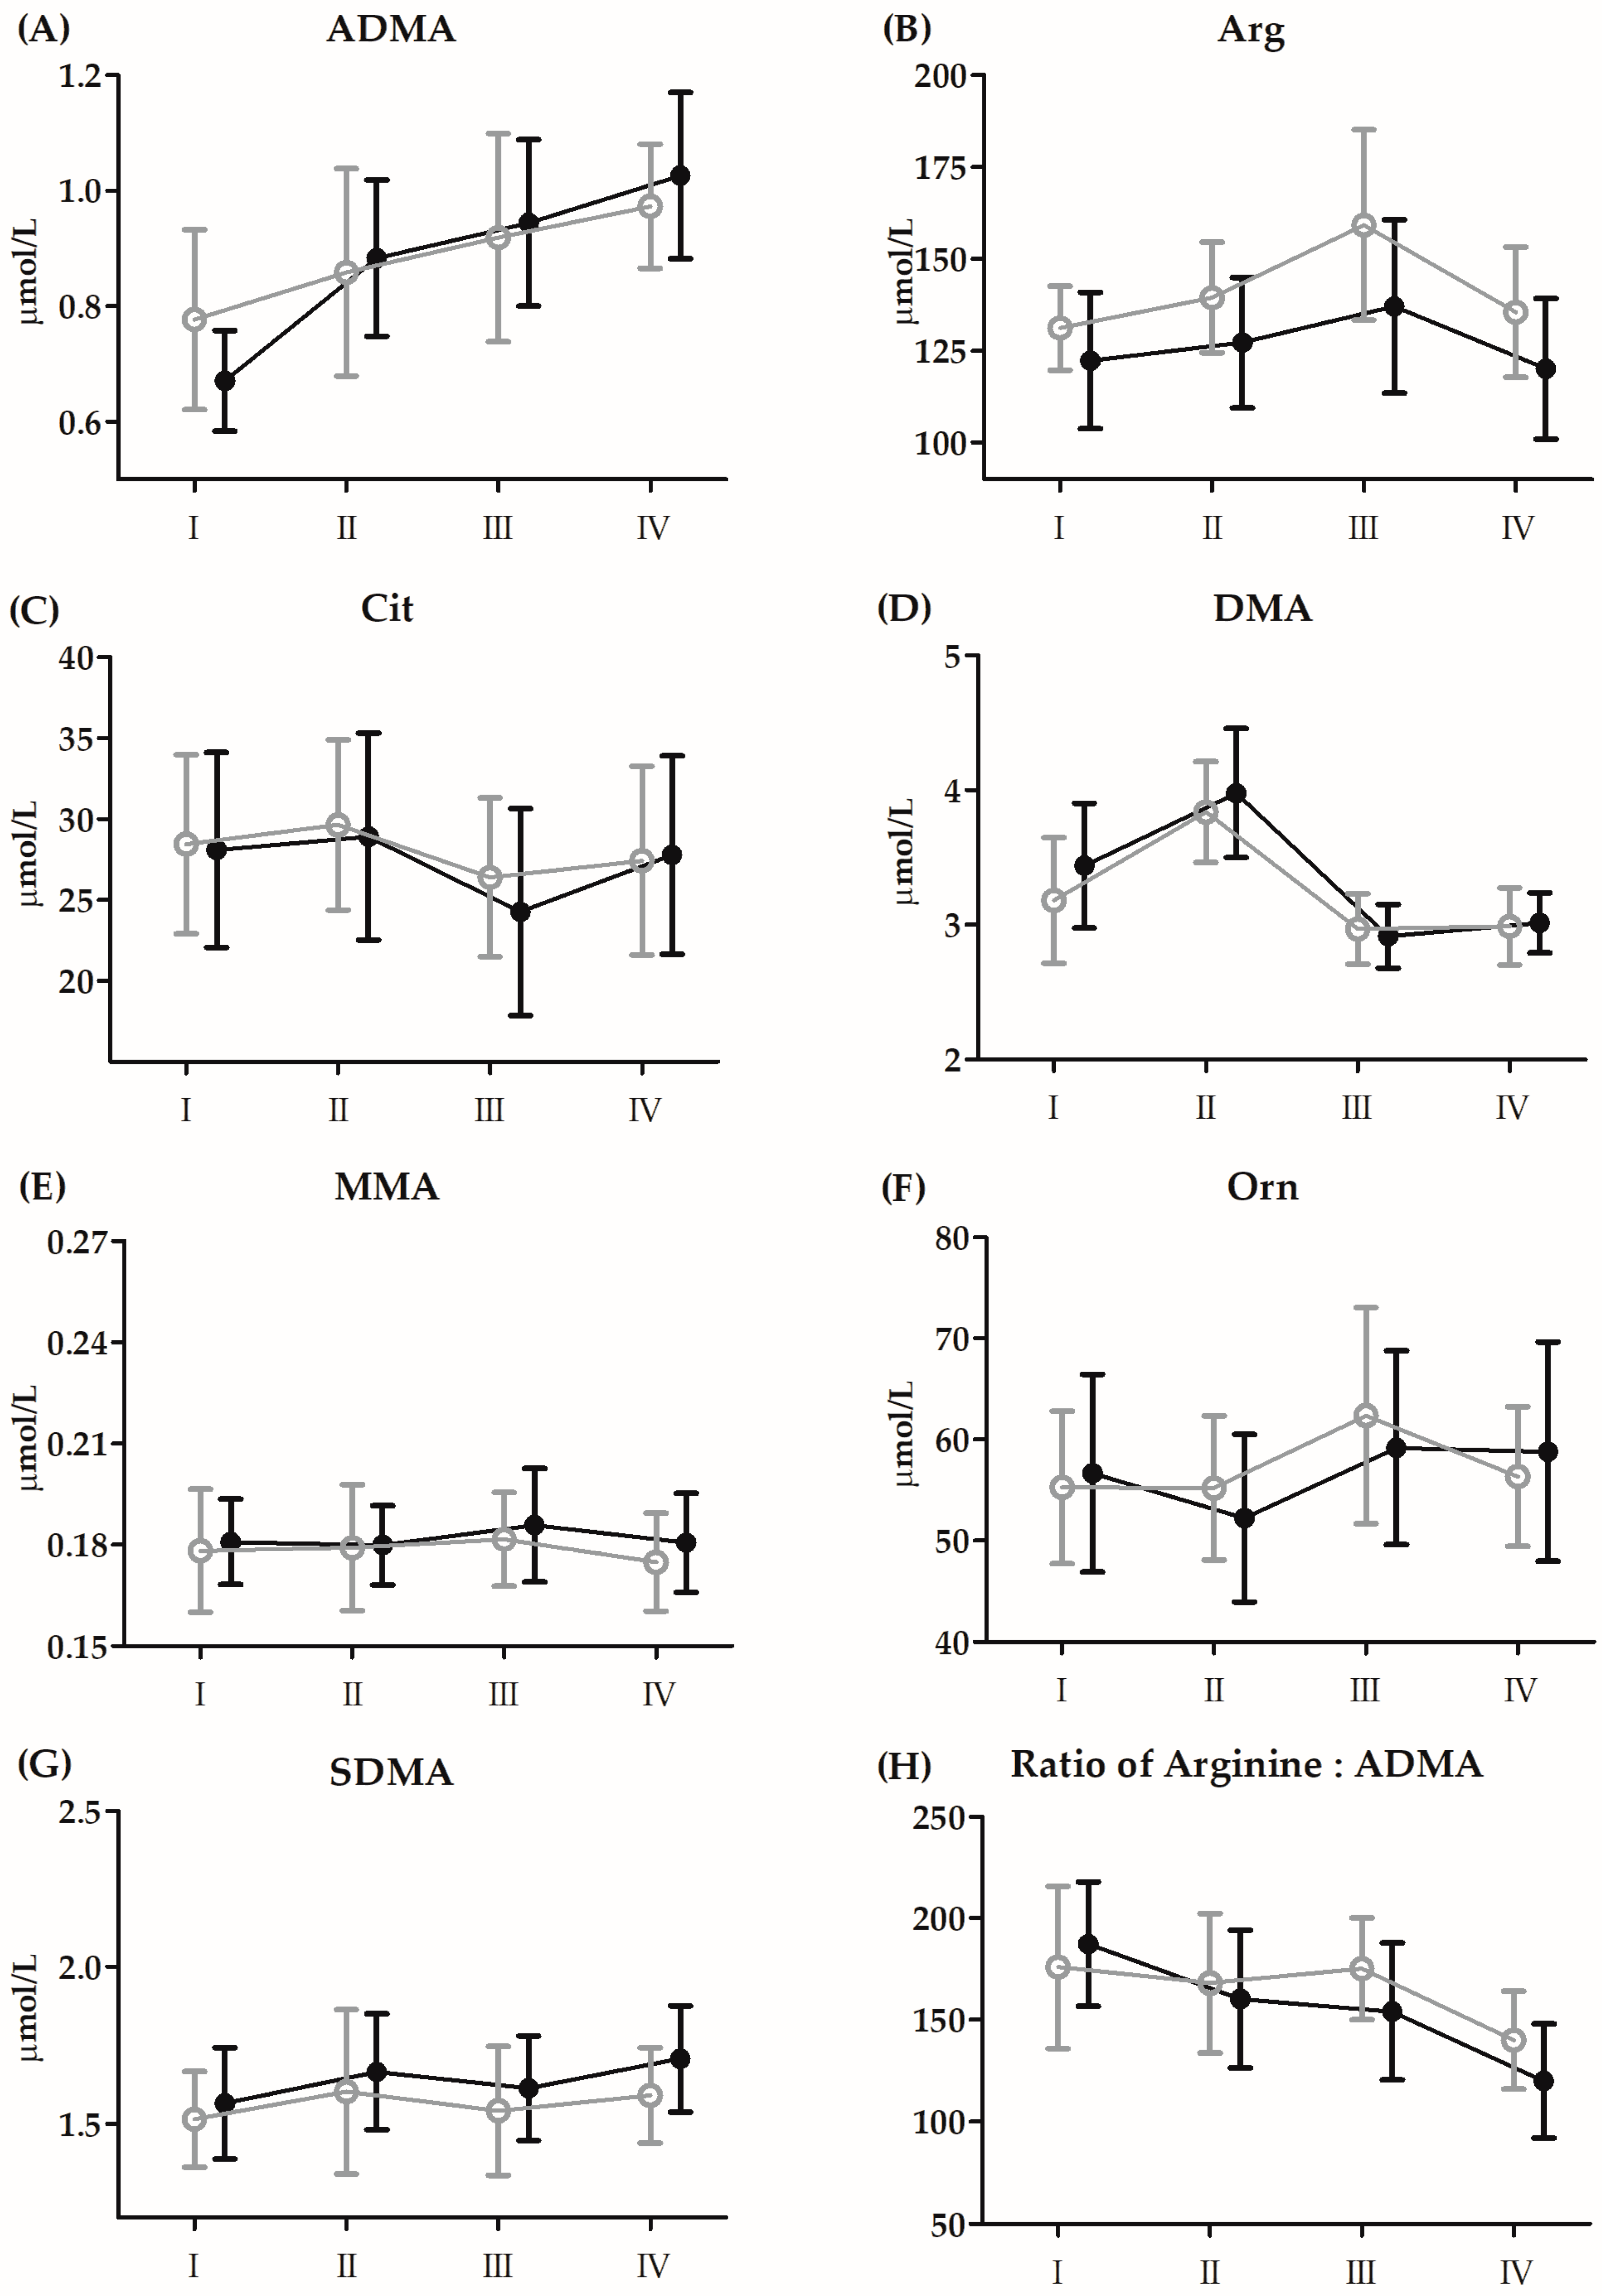
3.3. Changes in Vitamin D and Amino Acid Metabolites before the 21-Day Supplementation Period

The results and the ANOVA outcomes of changes in Vitamin D3 induced by BTT before 21 days of CoQ10 supplementation are presented in Figure 2 and Table 4, respectively.
Regardless of the group division, significant increases in concentrations of 25(OH)D3 (10.8%, p < 0.01), 25(OH)D2 (12.4%, p < 0.01), and 3-epi-25(OH)D3 (12.3%, p < 0.01) were noted immediately after BTT compared to the baseline. Regardless of the time point of serum measurement, in the supplemented group, the mean values of the ratio of 24,25(OH)2D3:25(OH)D3 concentration were significantly higher compared to the placebo group (25.9%, p < 0.05).
The results and ANOVA outcomes of changes in amino acid metabolites induced by BTT before 21 days of CoQ10 supplementation are presented in Figure 3 and Table 5, respectively.
Regardless of the group, although there were significant increases in Arg (17.5%, p < 0.01) and Orn (7.6%, p < 0.05) 3 h after BTT, Cit concentrations significantly decreased (−10.4%, p < 0.01) compared to baseline. The concentration of DMA (18.2%, p < 0.01) significantly increased immediately after BTT. In turn, the concentrations of ADMA (40.8%, p < 0.01) and SDMA (7.2%, p < 0.05) increased significantly only after 24 h of exercise.
Regardless of the group allocation, although there were significant increases in Arg (17.5%, p < 0.01) and Orn (7.6%, p < 0.05) 3 h after BTT, Cit concentrations significantly decreased (−10.4%, p < 0.01) compared to baseline. The concentration of DMA (18.2%, p < 0.01) significantly increased immediately after BTT. In turn, the concentrations of ADMA (40.8%, p < 0.01) and SDMA (7.2%, p < 0.05) increased significantly only 24 h after BTT.

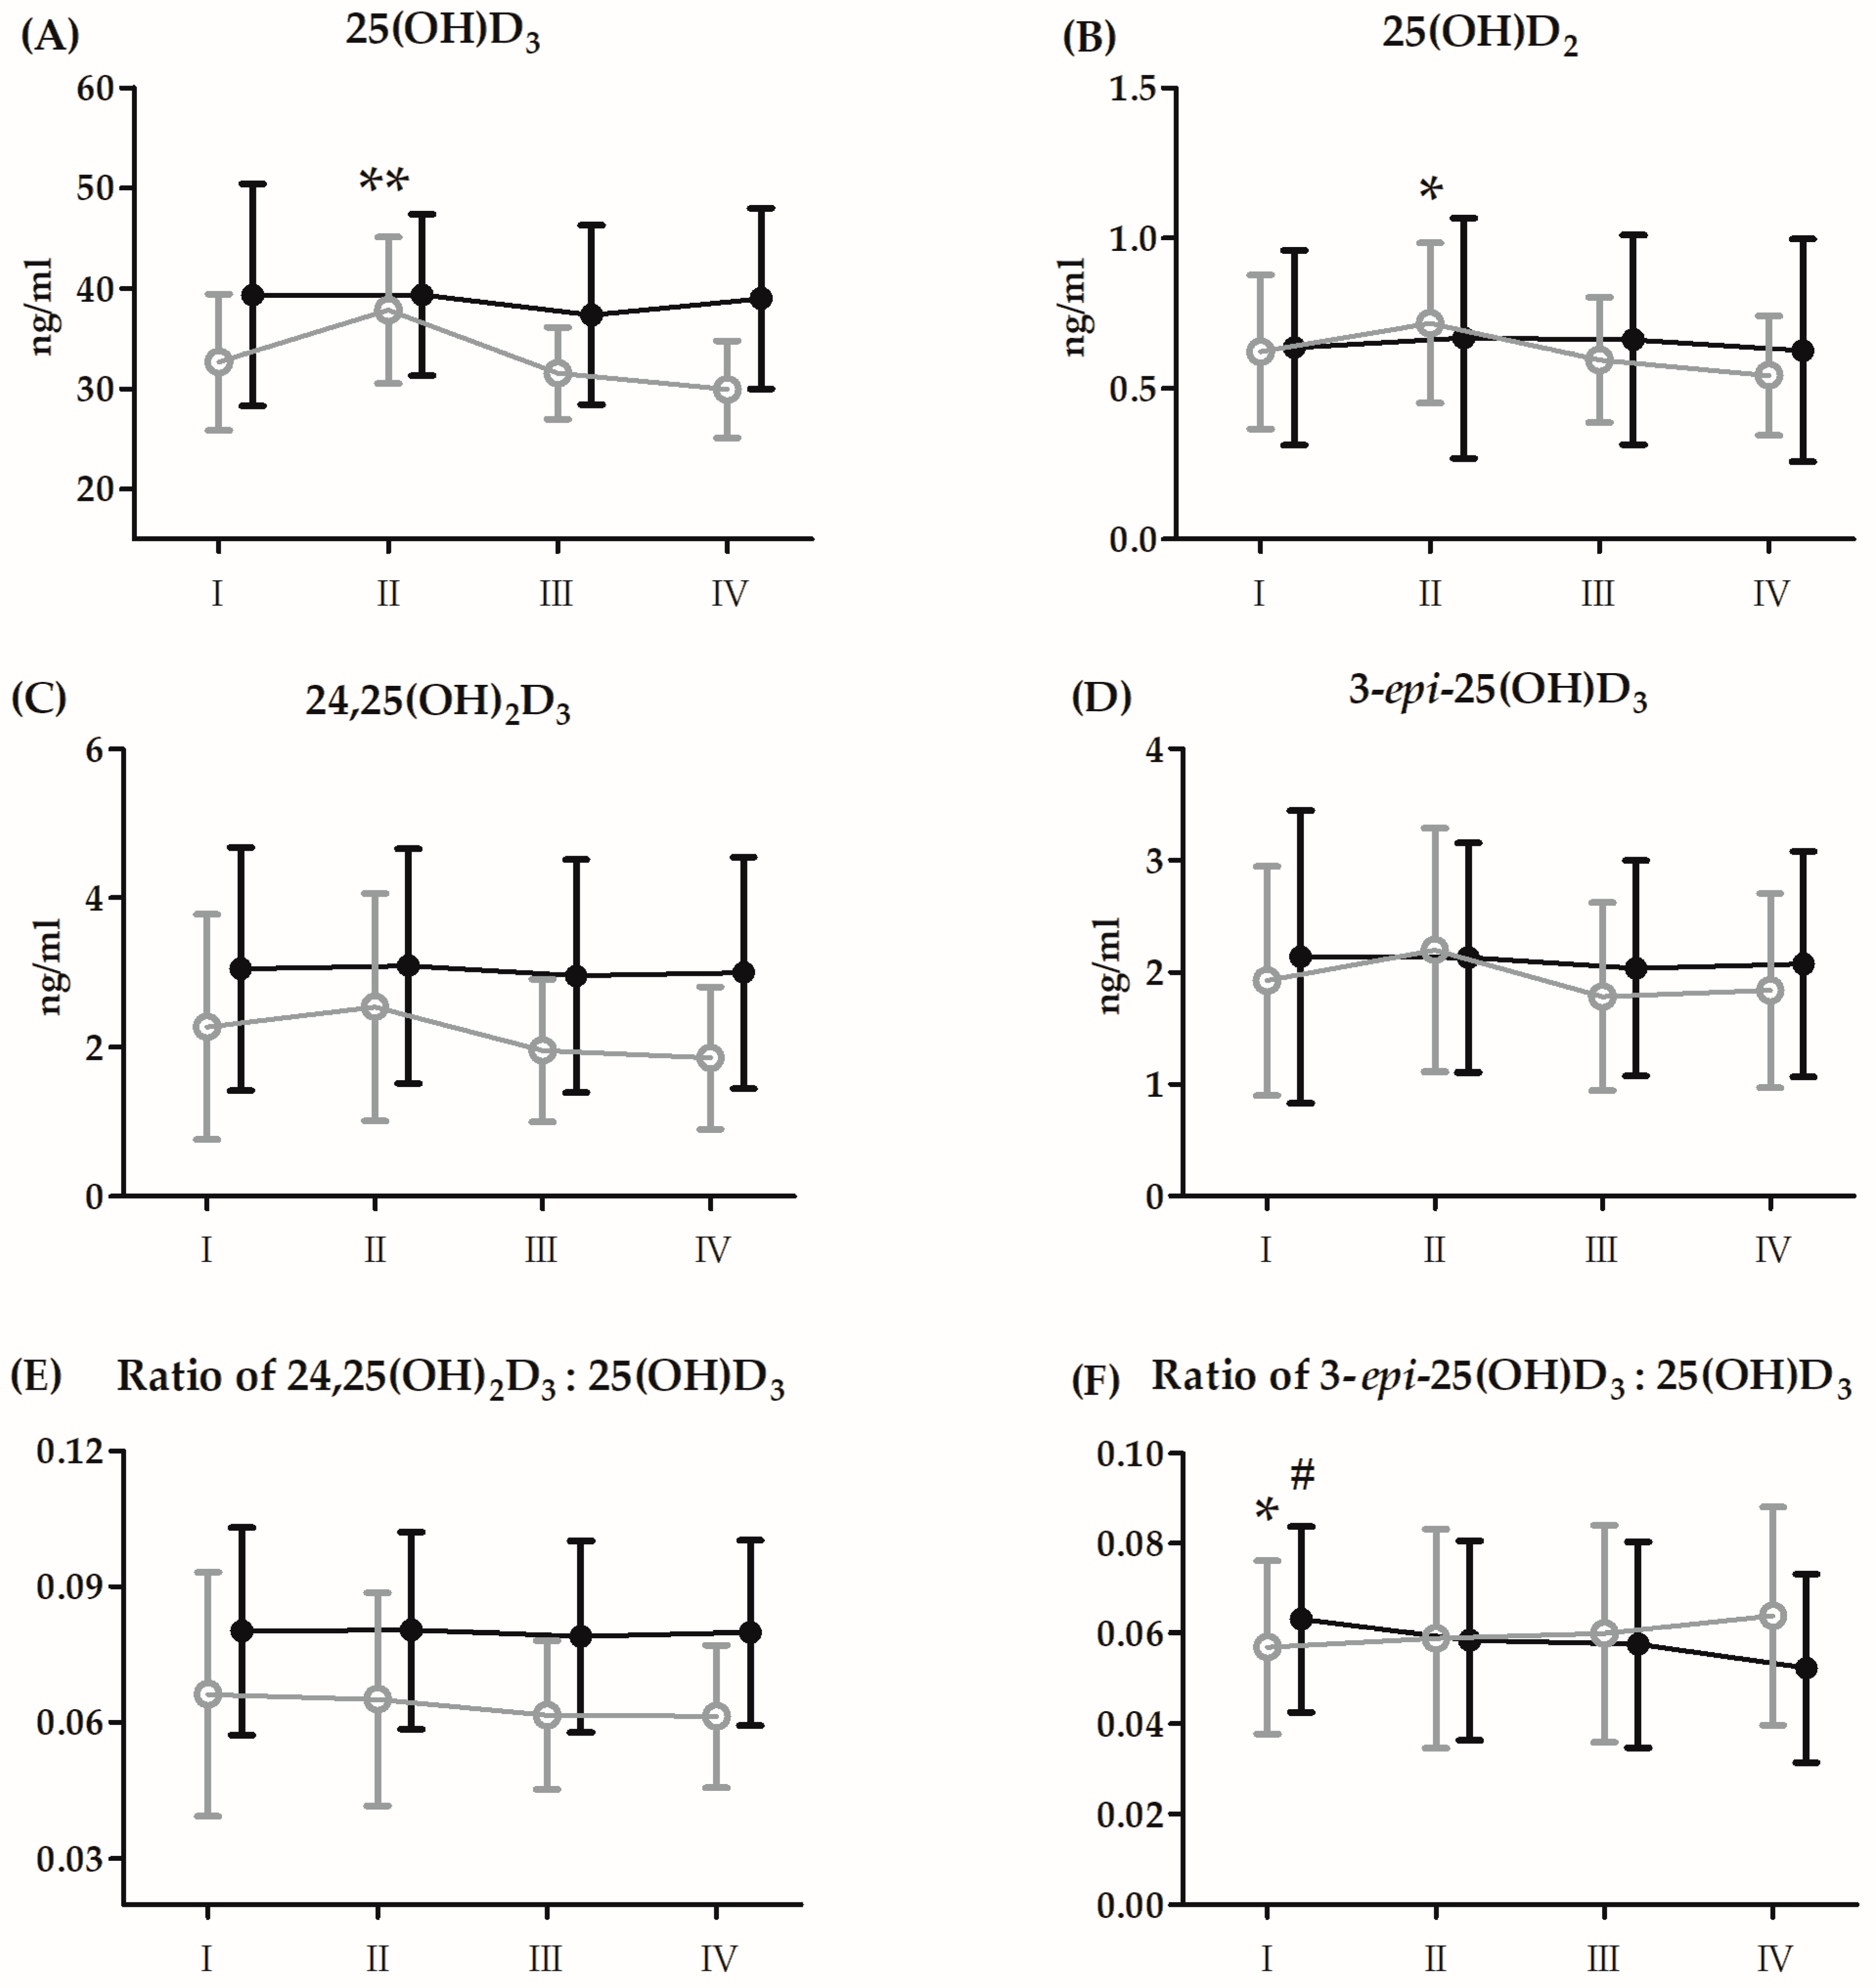
3.4. Changes in Vitamin D and Amino Acid Metabolites after the 21-Day Supplementation Period

The results and the ANOVA outcomes of changes in Vitamin D3 induced by BTT after 21 days of CoQ10 supplementation are presented in Figure 4 and Table 6, respectively.
Regardless of the group allocation, significant increases in concentrations of 25(OH)D3 (6.8%, p < 0.05), 25(OH)D2 (10.7%, p < 0.05), and 3-epi-25(OH)D3 (12.3%, p < 0.01) were noted immediately after BTT compared to the baseline. Regardless of the time point of serum measurement, in the supplemented group, the mean values of 25(OH)D3 (18.3%, p < 0.01), 24,25(OH)2D3 (50.7%, p < 0.01) and the ratio of 24,25(OH)2D3:25(OH)D3 (25.5%, p < 0.05) concentrations were significantly higher compared to the placebo group.
The significant interaction of group factor and repeated measurement was only observed in 25(OH)D3 and 25(OH)D2 and is depicted in Figure 4
The results and ANOVA outcomes of changes in amino acid metabolites induced by BTT after 21 days of CoQ10 supplementation are presented in Figure 5 and Table 7, respectively.
In the case of DMA (18.0%, p < 0.05), MMA (28.1%, p < 0.01), SDMA (21.1%, p < 0.01) and Arg:ADMA ratio (12.5%, p < 0.05), the concentration values recorded in the supplemented group, regardless of the time point of serum collected, turned out to be significantly higher compared to the placebo group. In turn, the ADMA (13.8%, p < 0.01) concentration values in the supplemented group were significantly lower compared to the placebo group.
A significant interaction of both factors was noted only in ADMA (p < 0.01, η2 = 0.15) and MMA and is depicted in Figure 5.

4. Discussion

The present study revealed that CoQ10 supplementation significantly influenced exercise-induced changes in vitamin D and methylated derivatives of arginine metabolism in young men. Interestingly, baseline serum concentrations of ADMA and SDMA, but not MMA, increased after exercise. ADMA and MMA were mainly eliminated by intracellular conversion to Cit and DMA in a reaction catalysed by DDAH since around 20% of ADMA is excreted by the kidneys [7].
Conversely, most SDMA is removed from the body by renal excretion. Thus, the serum concentration of MMA is a net result of its formation and elimination, and the formation of methylated arginine derivatives is related to protein proteolysis. Protein-containing arginine residues can undergo a methylation reaction catalysed by a family of enzymes known as protein arginine methyltransferases [14], which can be released during proteolysis. Some forms of exercise can increase skeletal muscle proteolysis; for example, the expression of two muscle-specific ubiquitin ligase genes—MuRF1 and atrogin-1—increases immediately after a run, suggesting increased postexercise proteasome-mediated proteolysis [15]. In this study, the ADMA concentration increased in 3 h and 24 h after exercise, perhaps due to this process. Conversely, likely, the elimination of ADMA and MMA by DDAH and SDMA in the kidneys can also be modulated by exercise. An increase in DMA immediately after exercise indicated that the reaction catalysed by DDAH was augmented. Conversely, the accumulation of SDMA indicated that renal excretion was insufficient to stabilise the serum concentration. As mentioned previously, DDAH enzymatic activity can be inhibited by the increased formation of ROS [7], which can occur during exercise [5], potentially influencing DDAH activity. A study on an animal model demonstrated that increasing the GSH concentration in diabetic rats restored the DDAH protein level [16]. Our results partially support this observation since, in the CoQ10 supplementation group, the ADMA level decreased, but it increased in the placebo group. Conversely, MMA increased 24 h after exercise in the CoQ10 group but not in the placebo group. Considering that resting serum concentrations of SDMA and MMA increased significantly after supplementation with CoQ10, it can be assumed that some changes in renal excretion were responsible for the observed differences. ADMA directly and SDMA as a competitive inhibitor of L-arginine transport [17] inhibit reactions catalysed by nitric oxide synthase (NOS). Since ADMA is a competitive inhibitor of NOS, the arginine/ADMA ratio is an essential determinant of NO formation. It is important to note that the Arg:ADMA ratio was higher 3 h after exercise in the CoQ10 group than in the placebo group. It may be that the antioxidant properties of CoQ10 were responsible for the observed effects. In summary, our results indicate that CoQ10 can modify the serum concentrations of MMAs. However, it should be noted that all concentrations of MMA were within the range of values observed in healthy individuals [18,19].
Studies have demonstrated interconnections between vitamin D and oxidative stress. Vitamin D can exert some antioxidative effects; for example, lower oxidative damage to proteins and lipids has been observed in the skeletal muscle of vitamin D-supplemented patients [20]. Vitamin D can reduce oxidative stress by influencing antioxidant enzyme activity or reducing inflammation. Conversely, oxidative stress can affect the vitamin D activation process and biological action. For example, a stress condition accompanied by a low GSH level impairs the activity of 25 hydroxylase [21]. Moreover, oxidative stress can lead to the downregulation of vitamin D receptor (VDR) and 1alpha hydroxylase but be reversed by cysteine, which is essential for GSH synthesis. In our study, we speculated that CoQ10 would influence the vitamin D metabolite changes induced by exercise. This demonstrated that CoQ10 supplementation abrogated increased serum 25(OH)D3, 24,25(OH)2D3, and 3-epi-25(OH)D3 concentrations after exercise, even if such an increase was observed at baseline and in the placebo group.

5. Conclusions

The present study revealed that CoQ10 supplementation significantly influenced exercise-induced changes in vitamin D and methylated derivatives of arginine metabolism in young men. Moreover, CoQ10 was shown to increase the resting level of serum arginine. Increased serum vitamin D after exercise has been reported in many studies [22,23]. However, this is the first report demonstrating that this process is inhibited by the antioxidant CoQ10. These data indicate that CoQ10 significantly modified the exercise-induced changes in vitamin D metabolism; however, the physiological meaning of this needs further studies. Moreover, CoQ10 supplementation increases the Arg to ADMA ratio, suggesting that in the supplemented athletes, the formation of nitric oxide will be facilitated, which can positively influence exercise performance.

6. Limitations

The current study has some potential limitations, the first of which is the relatively small sample size. Further studies should employ increased sample sizes and/or crossover study designs. Second, the study did not include any control of the dietary regime, and potential differences in the characteristics of meals rich in CoQ10 (e.g., fish such as sardines, mackerel, salmon, natural oils, spinach, whole grain products, and broccoli) might have interfered with the applied intervention. However, the observed change in the CoQ10 serum concentration (a 2.76 fold serum increase) was directly caused by the supplementation.
In addition, future researchers should use muscle biopsies to assess changes in CoQ10 concentrations in muscle tissue. This would allow for more detailed conclusions regarding the observed reactions.

Author Contributions

Conceptualization, J.M. and J.A.; data curation, J.M.; formal analysis, J.M., A.K., B.N., P.B., K.Ż., M.K. and J.R.; investigation, J.M., K.Ż., P.B., K.K. and B.S.; methodology, J.M., B.S., K.K. and B.N.; project administration, J.M., A.K. and J.A.; supervision, J.M. and A.K.; validation, J.M. and J.A.; writing (original draft), J.M., A.K., P.B. and J.A.; writing (review and editing), J.M., A.K., B.N., P.B., K.Ż., M.K., J.R. and J.A. All authors have read and agreed to the published version of the manuscript.

Funding

This research was funded by a Knowledge Grant from the National Science Centre, Poland (number 2020/37/B/NZ7/01794). The sponsor played no role in the study’s design, the collection, analysis, and interpretation of data, the writing of the manuscript, or the decision to submit the article for publication.

Institutional Review Board Statement

The study was conducted in accordance with the Declaration of Helsinki, and approved by the Bioethics Committee for Clinical Research at the Regional Medical Chamber in Gdansk (Consent No. KB-23/22).

Informed Consent Statement

Informed consent was obtained from all subjects in the study.

Data Availability Statement

All the experimental data are available from the corresponding authors.

Acknowledgments

We gratefully acknowledge all the study participants. We also thank Joanna Mackie for editing the English language.

Conflicts of Interest

The authors declare no conflicts of interest. The funders played no role in the design of the study, the collection, analysis, or interpretation of data, the writing of the manuscript, or the decision to publish the results.

References

  1. Agudelo, L.Z.; Femenia, T.; Orhan, F.; Porsmyr-Palmertz, M.; Goiny, M.; Martinez-Redondo, V.; Correia, J.C.; Izadi, M.; Bhat, M.; Schuppe-Koistinen, I.; et al. Skeletal muscle PGC-1alpha1 modulates kynurenine metabolism and mediates resilience to stress-induced depression. Cell 2014, 159, 33–45. [Google Scholar] [CrossRef] [PubMed]
  2. Belardinelli, R.; Mucaj, A.; Lacalaprice, F.; Solenghi, M.; Seddaiu, G.; Principi, F.; Tiano, L.; Littarru, G.P. Coenzyme Q10 and exercise training in chronic heart failure. Eur. Heart J. 2006, 27, 2675–2681. [Google Scholar] [CrossRef]
  3. Orlando, P.; Silvestri, S.; Galeazzi, R.; Antonicelli, R.; Marcheggiani, F.; Cirilli, I.; Bacchetti, T.; Tiano, L. Effect of ubiquinol supplementation on biochemical and oxidative stress indexes after intense exercise in young athletes. Redox Rep. 2018, 23, 136–145. [Google Scholar] [CrossRef] [PubMed]
  4. Zhong, W.; Gu, B.; Gu, Y.; Groome, L.J.; Sun, J.; Wang, Y. Activation of vitamin D receptor promotes VEGF and CuZn-SOD expression in endothelial cells. J. Steroid Biochem. Mol. Biol. 2014, 140, 56–62. [Google Scholar] [CrossRef] [PubMed]
  5. Packer, L.; Cadenas, E.; Davies, K.J. Free radicals and exercise: An introduction. Free Radic. Biol. Med. 2008, 44, 123–125. [Google Scholar] [CrossRef]
  6. Davies, K.J.A. Cardiovascular Adaptive Homeostasis in Exercise. Front. Physiol. 2018, 9, 369. [Google Scholar] [CrossRef] [PubMed]
  7. Palm, F.; Onozato, M.L.; Luo, Z.; Wilcox, C.S. Dimethylarginine dimethylaminohydrolase (DDAH): Expression, regulation, and function in the cardiovascular and renal systems. Am. J. Physiol. Heart Circ. Physiol. 2007, 293, H3227–H3245. [Google Scholar] [CrossRef] [PubMed]
  8. Poderoso, J.J.; Helfenberger, K.; Poderoso, C. The effect of nitric oxide on mitochondrial respiration. Nitric Oxide 2019, 88, 61–72. [Google Scholar] [CrossRef] [PubMed]
  9. Chun, R.F.; Liu, P.T.; Modlin, R.L.; Adams, J.S.; Hewison, M. Impact of vitamin D on immune function: Lessons learned from genome-wide analysis. Front. Physiol. 2014, 5, 151. [Google Scholar] [CrossRef] [PubMed]
  10. Jain, S.K.; Parsanathan, R.; Levine, S.N.; Bocchini, J.A.; Holick, M.F.; Vanchiere, J.A. The potential link between inherited G6PD deficiency, oxidative stress, and vitamin D deficiency and the racial inequities in mortality associated with COVID-19. Free Radic. Biol. Med. 2020, 161, 84–91. [Google Scholar] [CrossRef]
  11. Parsanathan, R.; Jain, S.K. Glutathione deficiency alters the vitamin D-metabolizing enzymes CYP27B1 and CYP24A1 in human renal proximal tubule epithelial cells and kidney of HFD-fed mice. Free Radic. Biol. Med. 2019, 131, 376–381. [Google Scholar] [CrossRef]
  12. Nyborg, C.; Bonnevie-Svendsen, M.; Melsom, H.S.; Melau, J.; Seljeflot, I.; Hisdal, J. Reduced L-Arginine and L-Arginine-ADMA-Ratio, and Increased SDMA after Norseman Xtreme Triathlon. Sports 2021, 9, 120. [Google Scholar] [CrossRef] [PubMed]
  13. Rola, R.; Kowalski, K.; Bienkowski, T.; Studzinska, S. Improved sample preparation method for fast LC-MS/MS analysis of vitamin D metabolites in serum. J. Pharm. Biomed. Anal. 2020, 190, 113529. [Google Scholar] [CrossRef] [PubMed]
  14. Zakrzewicz, D.; Eickelberg, O. From arginine methylation to ADMA: A novel mechanism with therapeutic potential in chronic lung diseases. BMC Pulm. Med. 2009, 9, 5. [Google Scholar] [CrossRef] [PubMed]
  15. Pasiakos, S.M.; McClung, H.L.; McClung, J.P.; Urso, M.L.; Pikosky, M.A.; Cloutier, G.J.; Fielding, R.A.; Young, A.J. Molecular responses to moderate endurance exercise in skeletal muscle. Int. J. Sport Nutr. Exerc. Metab. 2010, 20, 282–290. [Google Scholar] [CrossRef] [PubMed]
  16. Li, K.; Zhu, A.; Gutman, J.; Fu, Q.; Liu, S. Cysteine-Rich Whey Protein Isolate (CR-WPI) Ameliorates Erectile Dysfunction by Diminishing Oxidative Stress via DDAH/ADMA/NOS Pathway. Oxid. Med. Cell. Longev. 2022, 2022, 8151917. [Google Scholar] [CrossRef] [PubMed]
  17. Tain, Y.L.; Hsu, C.N. Toxic Dimethylarginines: Asymmetric Dimethylarginine (ADMA) and Symmetric Dimethylarginine (SDMA). Toxins 2017, 9, 92. [Google Scholar] [CrossRef] [PubMed]
  18. MacAllister, R.J.; Rambausek, M.H.; Vallance, P.; Williams, D.; Hoffmann, K.H.; Ritz, E. Concentration of dimethyl-L-arginine in the plasma of patients with end-stage renal failure. Nephrol. Dial. Transpl. 1996, 11, 2449–2452. [Google Scholar] [CrossRef] [PubMed]
  19. Surdacki, A.; Nowicki, M.; Sandmann, J.; Tsikas, D.; Boeger, R.H.; Bode-Boeger, S.M.; Kruszelnicka-Kwiatkowska, O.; Kokot, F.; Dubiel, J.S.; Froelich, J.C. Reduced urinary excretion of nitric oxide metabolites and increased plasma levels of asymmetric dimethylarginine in men with essential hypertension. J. Cardiovasc. Pharmacol. 1999, 33, 652–658. [Google Scholar] [CrossRef]
  20. Dzik, K.; Skrobot, W.; Flis, D.J.; Karnia, M.; Libionka, W.; Kloc, W.; Kaczor, J.J. Vitamin D supplementation attenuates oxidative stress in paraspinal skeletal muscles in patients with low back pain. Eur. J. Appl. Physiol. 2018, 118, 143–151. [Google Scholar] [CrossRef]
  21. Wimalawansa, S.J. Vitamin D Deficiency: Effects on Oxidative Stress, Epigenetics, Gene Regulation, and Aging. Biology 2019, 8, 30. [Google Scholar] [CrossRef] [PubMed]
  22. Mieszkowski, J.; Stankiewicz, B.; Kochanowicz, A.; Niespodzinski, B.; Kowalik, T.; Zmijewski, M.; Kowalski, K.; Rola, R.; Bienkowski, T.; Antosiewicz, J. Ultra-Marathon-Induced Increase in Serum Levels of Vitamin D Metabolites: A Double-Blind Randomized Controlled Trial. Nutrients 2020, 12, 3629. [Google Scholar] [CrossRef] [PubMed]
  23. Sun, X.; Cao, Z.B.; Taniguchi, H.; Tanisawa, K.; Higuchi, M. Effect of an Acute Bout of Endurance Exercise on Serum 25(OH)D Concentrations in Young Adults. J. Clin. Endocrinol. Metab. 2017, 102, 3937–3944. [Google Scholar] [CrossRef] [PubMed]
Figure 1. Participants flow diagram.
Antioxidants 13 00760 g001
Figure 2. Changes in serum levels of vitamin D metabolites induced by Bruce protocol treadmill test (BTT) before 21 days of supplementation with CoQ10 (mean ± SD). (A) 25(OH)D3, 25-hydroxyvitamin D3; (B) 25(OH)D2, 25-hydroxyvitamin D2; (C) 24,25(OH)2D3, 24,25-dihydroxyvitamin D3; (D) 3-epi-25(OH)D3, 3-epi-25-hydroxyvitamin D3; (E) Ratio 24,25(OH)2D3:25(OH)D3, 24,25-dihydroxyvitamin D3:25-hydroxyvitamin D3; (F) Ratio 3-epi-25(OH)D3:25(OH)D3, 3-epi-25-hydroxyvitamin:25-hydroxyvitamin D3. Black circles, supplementation group (n = 14); grey circles, placebo group (n = 14): I, baseline; II, immediately after BTT; III, 3 h after BTT; IV, 24 h after BTT.
Antioxidants 13 00760 g002
Figure 3. Changes in serum levels of amino acid metabolites induced by Bruce protocol treadmill test (BTT) before 21 days of supplementation with CoQ10 (means ± SD). (A) asymmetric dimethylarginine (ADMA); (B) arginine (Arg); (C) citrulline (Cit); (D) dimethylamine (DMA); (E) methylarginine (MMA); (F) ornithine (Orn); (G) symmetric dimethylarginine (SDMA); (H) ratio of arginine:ADMA. Black circles, supplementation group (n = 14); grey circles, placebo group (n = 14): I, baseline; II, immediately after BTT; III, 3 h after BTT; IV, 24 h after BTT.
Antioxidants 13 00760 g003
Figure 4. Changes in serum levels of vitamin D metabolites induced by Bruce protocol treadmill test (BTT) after 21 days of supplementation with coenzyme Q10 (means and standard deviations). (A) 25(OH)D3, 25-hydroxyvitamin D3; (B) 25(OH)D2, 25-hydroxyvitamin D2; (C) 24,25(OH)2D3, 24,25-dihydroxyvitamin D3; (D) 3-epi-25(OH)D3, 3-epi-25-hydroxyvitamin D3 (E) Ratio 24,25(OH)2 D3:25(OH)D3, 24,25-dihydroxyvitamin D3:25-hydroxyvitamin D3; (F) Ratio 3-epi-25(OH)D3:25(OH)D3, 3-epi-25-hydroxyvitamin D3:25-hydroxyvitamin D3. Black circles, supplemented group (n = 14); grey circles, placebo (n = 14). I, resting; II, immediately after BTT; III, 3 h post BTT; IV, 24 h post BTT; * significant difference vs. placebo group in IV time point at p < 0.05; ** significant difference vs. placebo group in I, III and IV time point at p < 0.01; # significant difference vs. CoQ10 group in IV time point at p < 0.05.
Antioxidants 13 00760 g004
Figure 5. Changes in serum levels of amino acid metabolites induced by Bruce protocol treadmill test (BTT) after 21 days of supplementation with coenzyme Q10 (means and standard deviations). (A) asymmetric dimethylarginine (ADMA); (B) arginine (Arg); (C) citrulline (Cit); (D) dimethylamine (DMA); (E) methylarginine (MMA); (F) ornithine (Orn); (G) symmetric dimethylarginine (SDMA); (H) ratio of arginine:ADMA. Black circles, supplemented group (n = 14); grey circles, placebo (n = 14). I, resting; II, immediately after BTT; III, 3 h post BTT; IV, 24 h post BTT; * significant difference vs. supplemented group in all timepoints at p < 0.01; # significant difference vs. supplemented group at p < 0.01.
Antioxidants 13 00760 g005
Table 1. Bruce Treadmill Test Stages, Speeds, and Inclines.
StageTreadmill SpeedTreadmill Incline
12.74 km/h (1.7 mph)10% grade
24.03 km/h (2.5 mph)12% grade
35.47 km/h (3.4 mph)14% grade
46.76 km/h (4.2 mph)16% grade
58.05 km/h (5.0 mph)18% grade
68.86 km/h (5.5 mph)20% grade
79.66 km/h (6.0 mph)22% grade
810.46 km/h (6.5 mph)24% grade
911.26 km/h (7.0 mph)26% grade
1012.07 km/h (7.5 mph)28% grade
Note: Mph, miles per hour.
Table 2. Physical and physiological characteristics of the participants before and after 21 days of supplementation with CoQ10.
Variable UnitSupplementation Group
(n = 14)
Placebo Group
(n = 14)
BeforeAfterBeforeAfter
Mean ± SDMean ± SDMean ± SDMean ± SD
Height cm179.1 ± 7.3-181.2 ± 8.1-
Body masskg77.7 ± 7.176.0 ± 6.879.9 ± 7.879.4 ± 7.3
Body fat percentage%12.0 ± 4.611.5 ± 4.312.8 ± 5.112.4 ± 5.0
Body mass indexkg/m223.5 ± 3.223.1 ± 3.024.0 ± 3.623.7 ± 3.6
Maximal oxygen uptakemL/min/kg57.2 ± 8.055.9 ± 7.951.3 ± 9.452.8 ± 7.5
Respiratory exchange ratio 1.26 ± 0.051.28 ± 0.071.29 ± 0.071.28 ± 0.06
Maximal heart ratebeats/min197.4 ± 7.5197.7 ± 6.3193.9 ± 5.2192 ± 6.7
Table 3. Baseline concentrations of CoQ10, vitamin D3 metabolites, and amino acid metabolites before and after 21-day supplementation with CoQ10.
Variable UnitSupplementation Group (n = 14)Placebo Group (n = 14)
BeforeAfterBeforeAfter
Mean ± SDMean ± SDMean ± SDMean ± SD
CoQ10 ng/mL900 ± 3212486 ± 1180 *†849 ± 187827 ± 166
25(OH)D3ng/mL34.0 ± 9.039.5 ± 10.8 *30.5 ± 8.032.3 ± 7.0
25(OH)D2ng/mL0.6 ± 0.30.7 ± 0.30.6 ± 0.20.6 ± 0.3
24,25(OH)2D3ng/mL3.0 ± 1.83.3 ± 2.32.1 ± 1.42.3 ± 1.5
3-epi-25(OH)D3ng/mL1.7 ± 1.02.6 ± 1.4 *1.6 ± 0.81.9 ± 0.8
Ratio 24,25(OH)2D3:
25(OH)D3
0.08 ± 0.030.08 ± 0.020.06 ± 0.020.06 ± 0.03
Ratio 3-epi-25(OH)D3:
25(OH)D3
0.04 ± 0.020.06 ± 0.02 *0.05 ± 0.020.06 ± 0.02
ADMAµmol/L0.65 ± 0.080.85 ± 0.130.77 ± 0.150.85 ± 0.11
Argµmol/L122.3 ± 18.5136.9 ± 19.8 *131.2 ± 11.5129.2 ± 20.9
Citµmol/L28.4 ± 5.529.9 ± 4.228.4 ± 5.527.6 ± 3.9
DMAµmol/L3.4 ± 0.53.2 ± 0.43.2 ± 0.52.7 ± 0.5
MMAµmol/L0.17 ± 0.010.21 ± 0.03 *†0.17 ± 0.020.17 ± 0.02
Ornµmol/L60.0 ± 11.063.6 ± 11.155.3 ± 4.656.7 ± 8.5
SDMAµmol/L1.6 ± 0.21.8 ± 0.2 *†1.5 ± 0.21.5 ± 0.3
Ratio Arg:ADMA 183 ± 30.7 162.6 ± 24.8175.9 ± 40.0156.3 ± 26.8
Note: markers—CoQ10, Coenzyme Q10; 25(OH)D3, 25-hydroxyvitamin D3; 25(OH)D2, 25-hydroxyvitamin D2; 24,25(OH)2D3, 24,25-dihydroxyvitamin D3; 3-epi-25(OH)D3, 3-epi-25-hydroxyvitamin D3; ADMA, asymmetric dimethylarginine; Arg, arginine; Cit, citrulline; DMA, dimethylamine; MMA, methylarginine; Orn, ornithine; SDMA, symmetric dimethylarginine. * significant difference versus the supplementation group before 21-day supplementation with CoQ10; † significant difference versus the placebo group after 21-day supplementation with CoQ10.
Table 4. Two-way ANOVA (2 groups × 4 repeated measures) of changes in serum levels of vitamin D metabolites induced by Bruce protocol treadmill test (BTT) before 21 days of supplementation with CoQ10.
VariableEffectFDfPEffect Size (η2)Post-Hoc Outcome
25(OH)D3GR1.871, 260.180.06II > I, III, IV
RM11.783, 78<0.01 **0.31
GR × RM0.273, 780.840.01
25(OH)D2GR0.261, 260.610.01II > I, III, IV
RM14.573, 78<0.01 **0.35
GR × RM1.633, 780.180.05
24,25(OH)2D3GR3.321, 260.080.11II > III
RM3.493, 780.02 *0.12
GR × RM0.433, 780.730.01
3-epi-25(OH)D3GR0.161, 260.680.01II > I, III, IV
RM9.273, 78<0.01 **0.26
GR × RM0.293, 780.830.01
24,25(OH)2D3:25(OH)D3GR5.561, 260.03 *0.17S > C
RM0.863, 780.460.03
GR × RM0.413, 780.740.02
3-epi-25(OH)D3:25(OH)D3GR0.291, 260.590.01I, II, IV > III
RM4.313, 78<0.01 **0.14
GR × RM0.623, 780.600.02
Note: Study design: 25(OH)D3, 25-hydroxyvitamin D3; 25(OH)D3, 25-hydroxyvitamin D2; 24,25(OH)2D3, 24,25-dihydroxyvitamin D3; 3-epi-25(OH)D3, 3-epi-25-hydroxyvitamin D3; GR, group; RM, repeated measures; Effect Size (η2), Partial Eta Squared; Df, degrees of freedom; F-value is the ratio of two variances. I, before BTT; II, immediately after the BTT; III, 3 h after the BTT; and IV, 24 h after BTT. Significant difference detected at * p ≤ 0.05 or ** p ≤ 0.01.
Table 5. Two-way ANOVA (2 groups × 4 repeated measures) of changes in serum levels of amino acid metabolites induced by Bruce protocol treadmill test (BTT) before 21 days of supplementation with CoQ10.
VariableEffectFDfPEffect Size (η2)Post-Hoc Outcome
ADMAGR0.011, 260.98<0.01I < II, III, IV
RM25.883, 78<0.01 **0.43
GR × RM0.243, 780.070.06
ArgGR3.491, 260.070.11III > I, II, IV
RM15.603, 78<0.01 **0.37
GR × RM0.633, 780.590.02
CitGR0.121, 260.72<0.01III > I, II, IV
RM10.813, 78<0.01 **0.29
GR × RM1.053, 780.370.04
DMAGR0.241, 260.420.02II > I > II, IV
RM99.033, 78<0.01 **0.79
GR × RM2.363, 780.070.08
MMAGR0.491, 260.480.01
RM1.713, 780.170.06
GR × RM0.303, 780.820.01
OrnGR0.061, 260.80<0.01III > I, II
RM6.143, 78<0.01 **0.15
GR × RM1.503, 780.210.04
SDMAGR2.611, 260.110.09I < IV
RM2.693, 780.05 *0.09
GR × RM0.213, 780.880.01
Arg:ADMAGR1.231, 260.270.05I, II, III > IV
RM19.643, 78<0.01 **0.43
GR × RM2.533, 780.070.08
Note: Study design: GR, group; RM, repeated measures; Effect Size (η2); Partial Eta Squared; Df, degrees of freedom; F-value is the ratio of two variances; ADMA, asymmetric dimethylarginine; Arg, arginine; Cit, citrulline; DMA, dimethylamine; MMA, methylarginine; Orn, ornithine; SDMA, symmetric dimethylarginine; I, before the BTT; II, immediately after the BTT; III, 3 h after the BTT and IV, 24 h after BTT. Significant difference detected at * p ≤ 0.05 or ** p ≤ 0.01.
Table 6. Two-way ANOVA (2 groups × 4 repeated measures) of changes in serum levels of vitamin D metabolites induced by Bruce protocol treadmill test (BTT) after 21 days of supplementation with CoQ10.
VariableEffectFDfPEffect Size (η2)Post-Hoc Outcome
25(OH)D3GR4.561, 260.04 *0.14S > P
RM8.673, 78<0.01 **0.25II > I, III
GR × RM5.253, 78<0.01 **0.16PII > PI, PIII, PIV
25(OH)D2GR0.751, 260.390.03
RM5.033, 78<0.01 **0.16II > I, III, IV
GR × RM3.003, 780.03 *0.11PII > PIV
24,25(OH)2D3GR4.961, 260.03 *0.16S > P
RM2.973, 780.04 *0.11II > III
GR × RM1.283, 780.280.04
3-epi-25(OH)D3GR0.691, 260.410.02
RM4.133, 78<0.01 **0.13II > III, IV
GR × RM1.823, 780.150.06
24,25(OH)2D3:25(OH)D3GR5.051, 260.03 *0.16S > P
RM0.723, 780.530.02
GR × RM0.343, 780.790.01
3-epi-25(OH)D3:25(OH)D3GR0.011, 260.97<0.01
RM0.463, 780.700.02
GR × RM3.903, 780.01 *0.12SI > SIV; PI < PIV
Note: Study design: 25(OH)D3, 25-hydroxyvitamin D3; 25(OH)D2, 25-hydroxyvitamin D2; 24,25(OH)2D3, 24,25-dihydroxyvitamin D3; 3-epi-25(OH)D3, 3-epi-25-hydroxyvitamin D3; GR, group; RM, repeated measures; Effect Size (η2); Partial Eta Squared; Df, degrees of freedom; F-value is the ratio of two variances; S, supplementation group (n = 14); P, placebo group (n = 14); I, before BTT; II, immediately after the BTT; III, 3 h after the BTT and IV, 24 h after BTT. Significant difference detected at * p ≤ 0.05 or ** p ≤ 0.01.
Table 7. Two-way ANOVA (2 groups × 4 repeated measures) of changes in serum levels of amino acid metabolites induced by Bruce protocol treadmill test (BTT) after the 21 days of supplementation with CoQ10.
VariableEffectFDfPEffect Size (η2)Post-Hoc Outcome
ADMAGR17.591, 26<0.01 **0.4S < P
RM0.393, 78750.01
GR × RM4.823, 78<0.01 **0.15SIII, SIV < PIII, PIV
ArgGR0.311, 260.580.01I < III
RM3.513, 780.02 *0.11
GR × RM1.633, 780.180.05
CitGR2.791, 260.100.09
RM2.083, 780.100.07
GR × RM0.113, 780.95<0.01
DMAGR4.781, 260.420.15S > P
RM8.663, 78<0.01 **0.24I < II, III, IV
GR × RM0.463, 780.070.01
MMAGR24.181, 26<0.01 **0.48S > P
RM15.393, 78<0.01 **0.37I, II, III < IV
GR × RM24.513, 78<0.01 **0.48SI–SIV > PI–PIV
OrnGR0.821, 260.370.03II < III
RM3.843, 78<0.01 **0.13
GR × RM0.833, 780.470.03
SDMAGR29.541, 26<0.01 **0.53S > P
RM6.583, 78<0.01 **0.2I < IV
GR × RM1.453, 780.230.05
Arg/ADMAGR5.631, 260.03 *0.18S > P
RM1.093, 780.350.04
GR × RM1.543, 780.200.06
Note: Study design: GR, group; RM, Repeated measure; Effect Size (η2); Partial Eta Squared; Df degrees of freedom; F-value is the ratio of two variances; S, supplementation group (n = 14); P, placebo group (n = 14); ADMA, asymmetric dimethylarginine; Arg, arginine; Cit, citrulline; DMA, dimethylamine; MMA, methylarginine; Orn, ornithine; SDMA, symmetric dimethylarginine; I, before BTT; II, immediately after the BTT; III, 3 h after the BTT and IV, 24 h after BTT. Significant difference detected at * p ≤ 0.05 or ** p ≤ 0.01.
Disclaimer/Publisher’s Note: The statements, opinions and data contained in all publications are solely those of the individual author(s) and contributor(s) and not of MDPI and/or the editor(s). MDPI and/or the editor(s) disclaim responsibility for any injury to people or property resulting from any ideas, methods, instructions or products referred to in the content.

