
Oxidative Score and Microvesicle Profile Suggest Cardiovascular Risk in Chronic Kidney Disease

 , , , , ,
  , , and
Abstract
1. Introduction
2. Materials and Methods
2.1. Healthy and Chronic Kidney Disease Sample Donors
2.2. Blood Collection and Preparation
2.3. Leukocytes Density Gradient Separation
2.4. Oxidative Stress Parameters
2.4.1. Xanthine Oxidoreductase Activity
2.4.2. Glutathione Peroxidase Activity
2.4.3. Lipid Peroxidation Assay
2.4.4. Glutathione Content Assay
2.4.5. Catalase Activity
2.4.6. Superoxide Dismutase Activity
2.4.7. Protein Content Assay
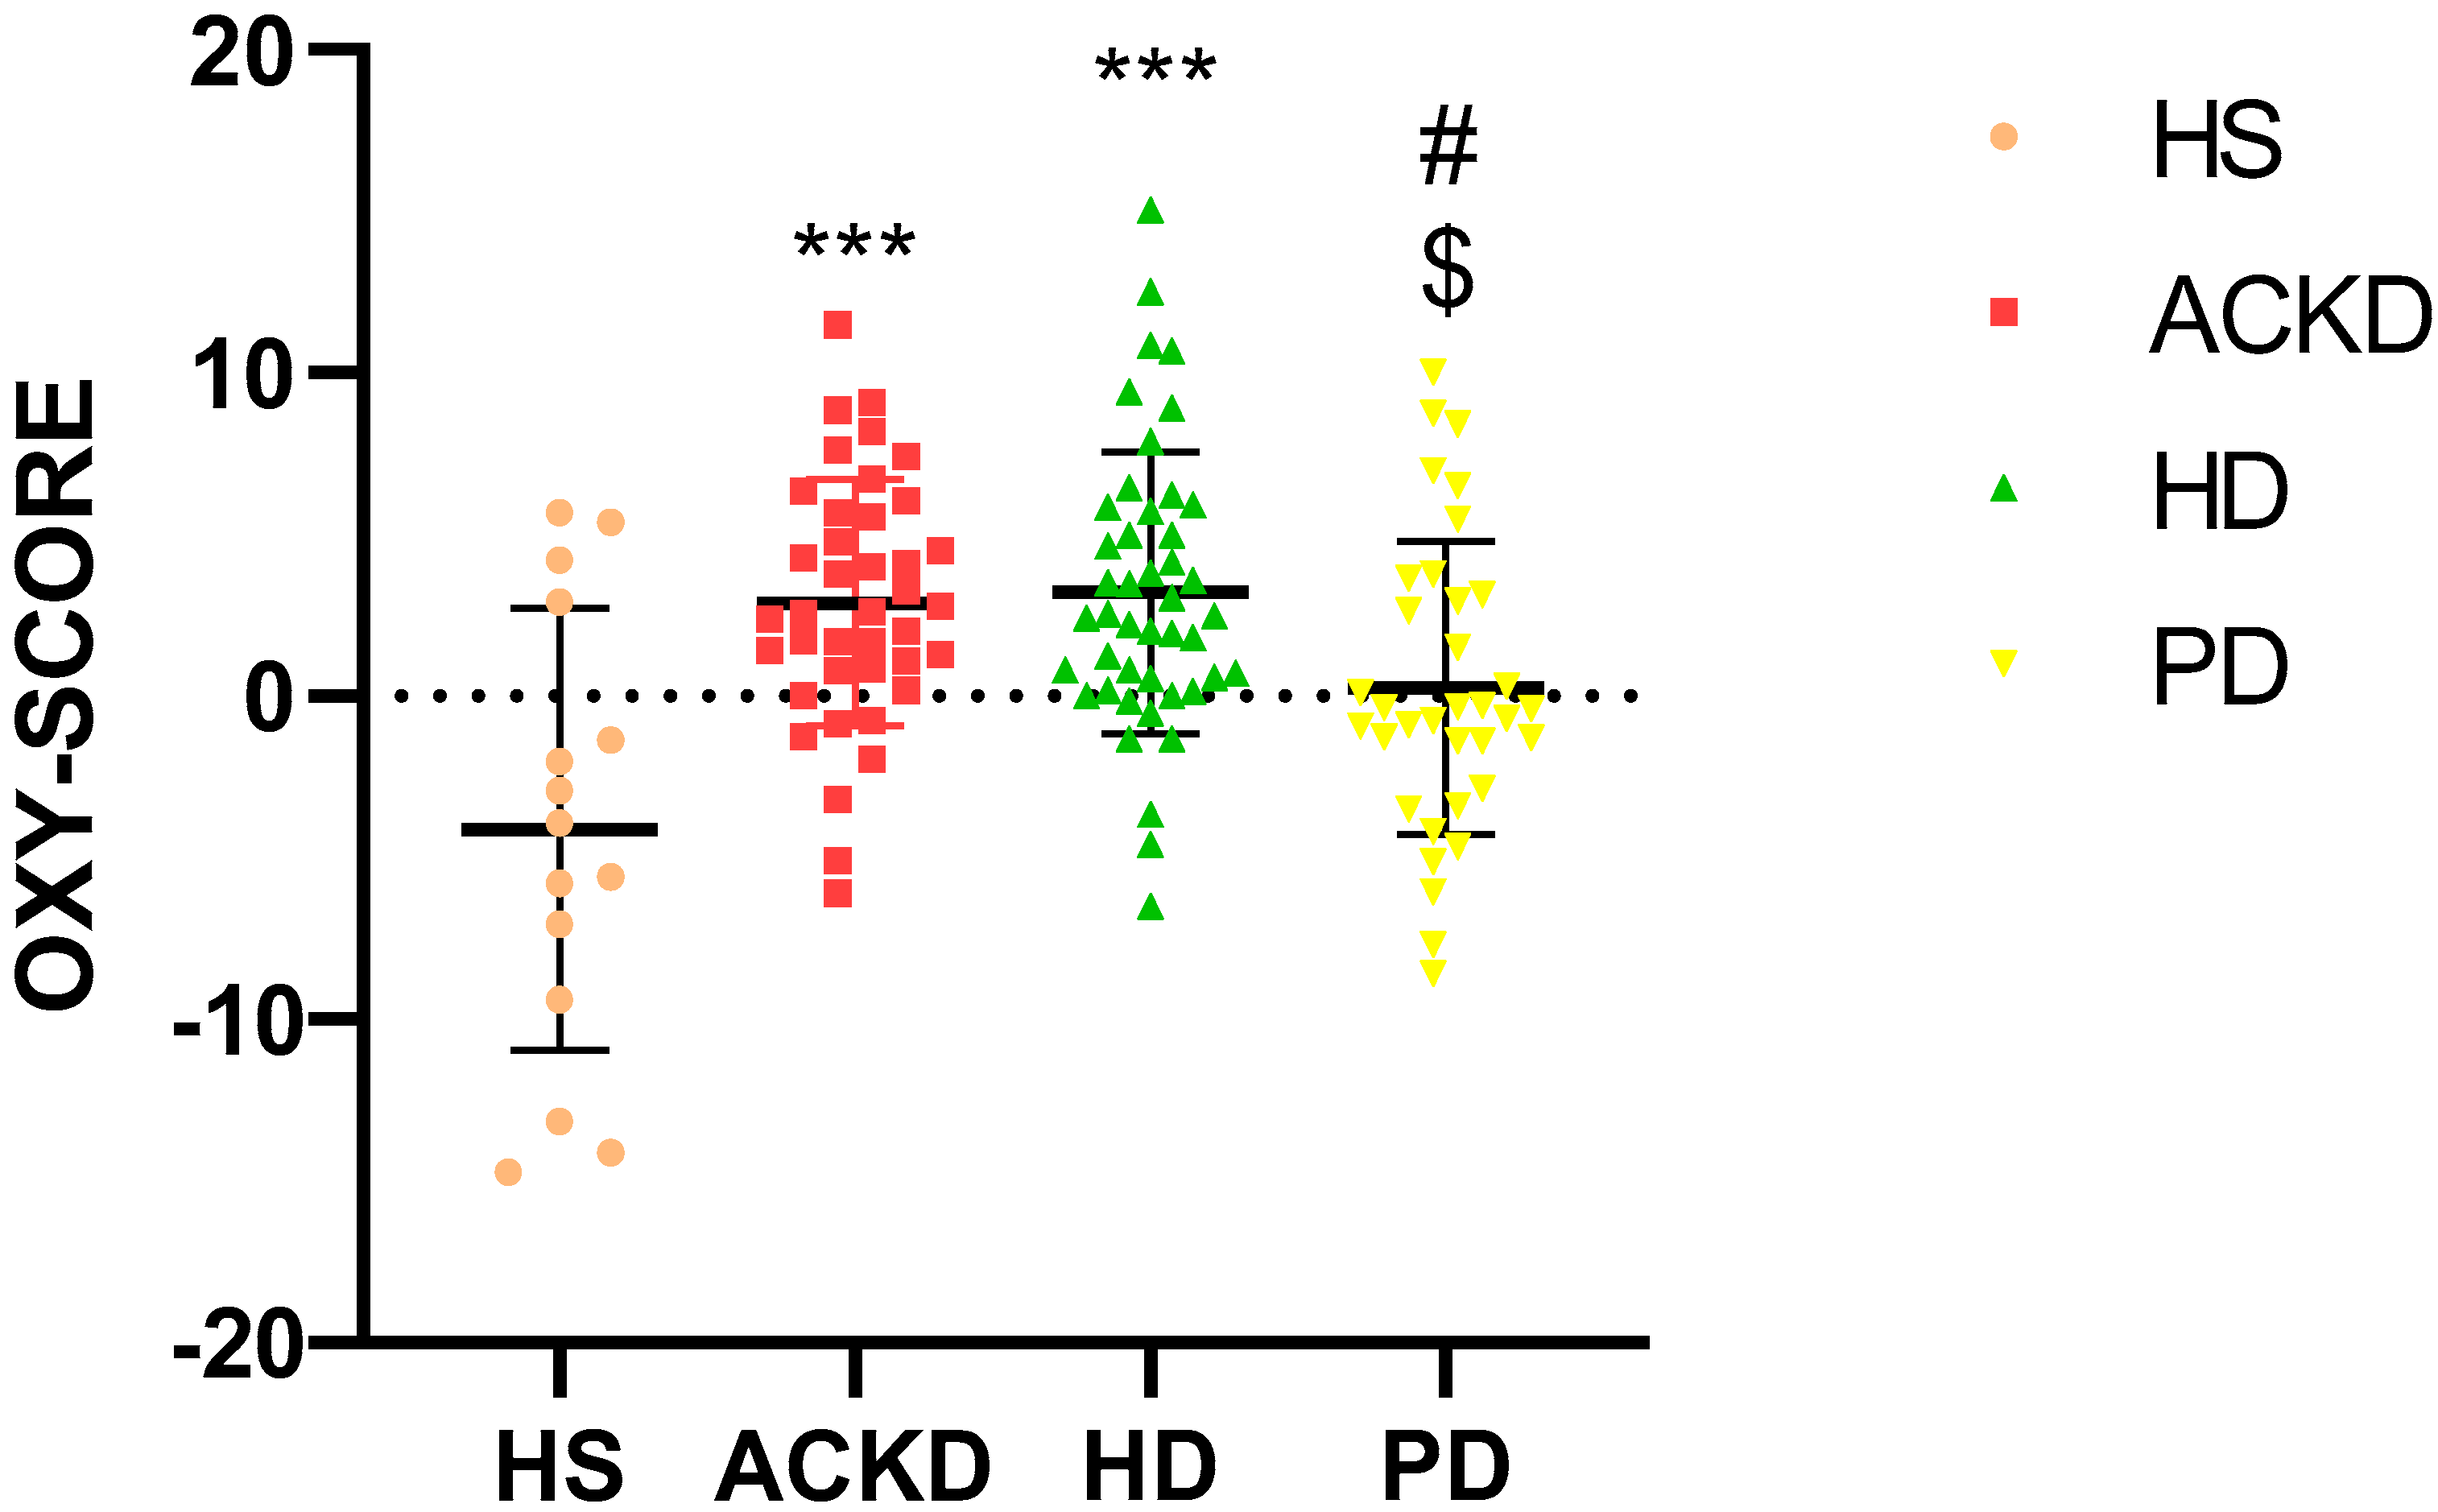
2.5. OXY-SCORE Index Determination
2.6. Circulating Microvesicles Isolation
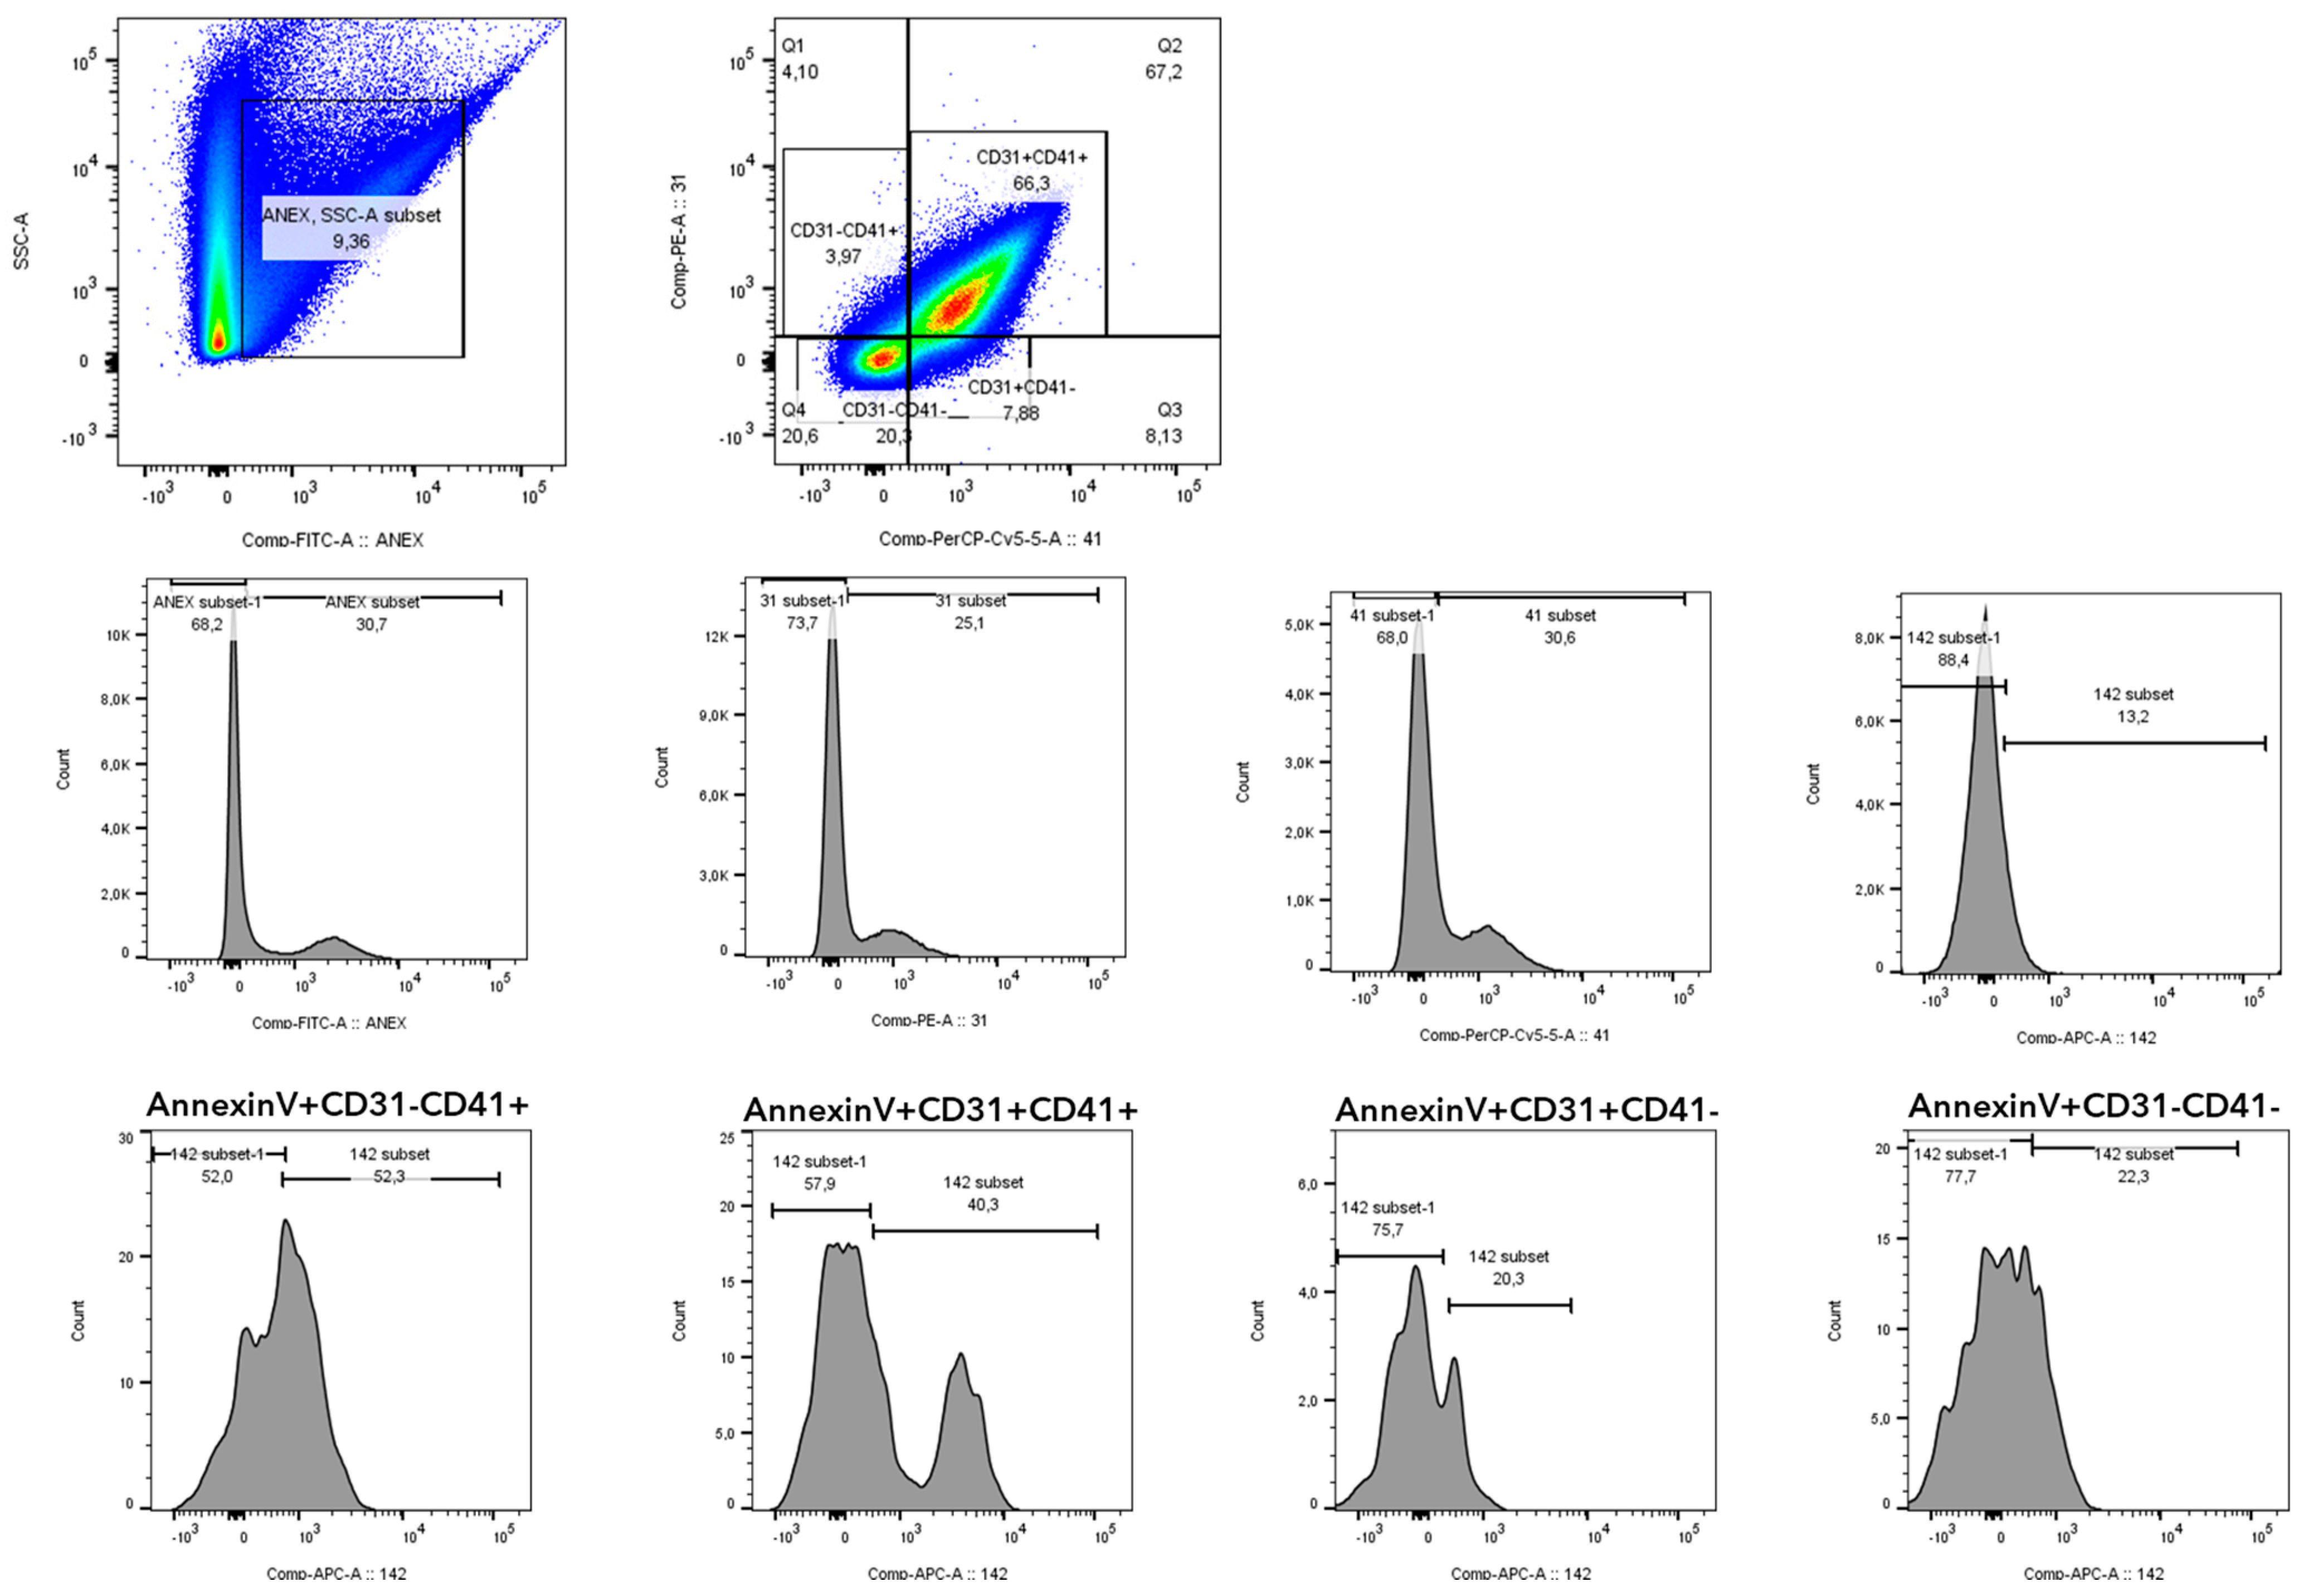
2.7. Phenotyping of Microvesicles by Flow Cytometry
2.8. Statistical Analysis
3. Results
4. Discussion
5. Conclusions
Author Contributions
Funding
Institutional Review Board Statement
Informed Consent Statement
Data Availability Statement
Acknowledgments
Conflicts of Interest
Appendix A

| Plasma | |||||||
|---|---|---|---|---|---|---|---|
| HS | ACKD (Non APA) | ACKD (APA) | HD (Non APA) | HD (APA) | PD (Non APA) | PD (APA) | |
| XO activity in plasma (mU/mL) | 0.04 ± 0.01 | 0.05 ± 0.3 | 0.036 ± 0.005 | 0.05 ± 0.039 | 0.057 ± 0.03 | 0.06 ± 0.02 | 0.09 ± 0.07 a |
| TBARS (nmol/mL) | 5.6 ± 2.8 | 11.4 ± 7.7 | 11.2 ± 6.18 | 12.25 ± 6.39 ** | 8.8 ± 3.7 ## | 14.4 ± 8.9 ** | 16.1 ± 9.8 **## |
| GPx activity (U/mL) | 60.2 ± 15.6 | 32.9 ± 9.7 | 29.9 ± 12.7 | 35.2 ± 18.3 | 32.3 ± 13.1 | 44.6 ± 6.5 | 33.3 ± 8.3 *## |
| GSH (umol/mL) | 1.8 ± 0.53 | 1.26 ± 0.62 | 1.17 ± 0.53 | 0.9 ± 0.34 ** | 1 ± 0.3 | 0.96 ± 0.34 ** | 1 ± 0.56 * |
| CAT activity in plasma (U/mL) | 11.4 ± 4.9 | 10.2 ± 2.6 | 6.47 ± 2.85 a | 9.6 ± 3.12 | 9.2 ± 2.8 | 7.3 ± 2.4 | 6 ± 2.5 |
| SOD (U/mL) | 0.65 ± 1.47 | 1.3 ± 1.5 | 0.38 ± 0.27 | 0.82 ± 0.59 | 0.69 ± 0.61 | 1.4 ± 1.5 $ | 0.79 ± 0.98 |
| Mononuclear Leucocytes | Polimorphonuclear Leucocytes | |||||||||||||
|---|---|---|---|---|---|---|---|---|---|---|---|---|---|---|
| HS | ACKD (Non APA) | ACKD (APA) | HD (Non APA) | HD (APA) | PD (Non APA) | PD (APA) | HS | ACKD (Non APA) | ACKD (APA) | HD (Non APA) | HD (APA) | PD (Non APA) | PD (APA) | |
| XO activity (mU/mg proteins) | 2.7 ± 1.08 | 3.7 ± 1 | 3.12 ± 0.88 | 1.55 ± 0.89 *### | 1.7 ± 1.3 *### | 3.7 ± 1.2 | 5.1 ± 2.9 *$$$ | 2.4 ± 1.8 | 3.8 ± 2.25 * | 4.59 ± 2.5 ** | 1.1 ± 1.1 *### | 1 ± 0.76 *### | 2.7 ± 1.2 $$$ | 2.3 ± 0.46 $$ |
| MDA (nmol/mg proteins) | 2.2 ± 0.9 | 3.11 ± 2.82 | 4.1 ± 2.3 | 3.59 ± 1.65 | 2.6 ± 1.1 | 2.8 ± 1.7 | 2.7 ± 1.6 | 3.3 ± 2 | 3.41 ± 2.12 | 2.2 ± 1.1 | 2.82 ± 1.57 | 2.6 ± 1.3 | 2.4 ± 1.5 | 2.3 ± 0.85 |
| GPx activity (U/mg proteins) | 0.37 ± 0.08 | 0.38 ± 0.19 | 0.44 ± 0.15 | 0.42 ± 0.13 | 0.56 ± 1.14 | 0.36 ± 0.09 | 0.35 ± 0.1 | 0.33 ± 0.11 | 0.45 ± 0.18 | 0.42 ± 0.11 | 0.32 ± 0.1 | 0.36 ± 0.077 | 0.13 ± 0.14 | 0.64 ± 0.12 * |
| CAT activity (U/mg proteins) | 9.4 ± 2.5 | 7.9 ± 2 | - | 5.84 ± 1.44 ** | 5.9 ± 1.3 ** | 5.9 ± 1.25 ** | 7 ± 1.7 | 7.8 ± 1.7 | 5 ± 1.6 *** | 5.17 ± 2.61 *** | 3.96 ± 0.84 *** | 4.6 ± 1.6 *** | 6.3 ± 1 | 5.9 ± 0.09 ** |
| SOD (U/mg proteins) | 0.55 ± 0.3 | 0.11 ± 0.06 *** | 0.09 ± 0.06 *** | 0.37 ± 0.26 # | 0.3 ± 0.2 # | 0.15 ± 0.18 ***$$ | 0.08 ± 0.04 ***$$ | 0.23 ± 0.2 | 0.35 ± 0.54 | 0.35 ± 0.34 | 0.49 ± 0.37 | 0.4 ± 0.5 | 0.15 ± 0.15 | 0.3 ± 0.3 |
| GSSG (nmol/mg proteins) | 3.2 ± 2.2 | 2.66 ± 2.47 | 3.4 ± 2a | 4 ± 2 # | 4.1 ± 2.6 # | 5.9 ± 2.4 ## | 3.7 ± 1.2 | 0.2 ± 0.07 | 1.62 ± 1.11 *** | 3.3 ± 0.9 ***a | 1.22 ± 0.51 *** | 1.8 ± 2.4 *** | 0.86 ± 0.34 ** | 0.94 ± 0.54 ** |
| GSH (umol/mg proteins) | 5.9 ± 5.2 | 2.62 ± 2.47 *** | 2.1 ± 1.4 *** | 4 ± 3 | 3.5 ± 3 # | 3 ± 3.3 | 2.9 ± 1.66 | 1.3 ± 2.4 | 1.05 ± 0.95 | 1.31 ± 0.46 | 3.8 ± 2.3 ***### | 3.8 ± 2.5 ***### | 2.7 ± 2.18 **## | 3.3 ± 1.09 **## |
| GSSG/GSH | 0.9 ± 0.98 | 1.17 ± 0.88 | 1.7 ± 1 | 1.69 ± 1.55 | 2.7 ± 3 * | 3.4 ± 2.11 ** | 3.2 ± 6.4 ** | 0.36 ± 0.26 | 4.32 ± 5.75 *** | 2.7 ± 1.2 | 0.56 ± 0.58 ### | 0.83 ± 1.29 ### | 0.8 ± 0.99 ### | 1.1 ± 2 ##a |
| HS | ACKD (NON APA) | ACKD (APA) | HD (NON APA) | HD (APA) | PD (NON APA) | PD (APA) | |
|---|---|---|---|---|---|---|---|
| N° PMVs (events/mL) | 4468 ± 2485 | 2878 ± 1664 | 3995 ± 4229 | 3052 ± 2034 | 4112 ± 4124 | 5447 ± 4684 | 8970 ± 5653 ##$$ |
| CD31 in PMVs (MFI) | 1910 ± 679 | 3070 ± 1966 | 3504 ±2165 | 2168 ± 1476 | 2632 ± 1425 | 1498 ±581 | 2156 ± 2538 |
| CD41 in PMVs (MFI) | 987 ± 386 | 2436 ± 1335 *** | 2754 ± 2048 | 997 ± 612 ### | 1640 ± 1366 | 785 ± 514 ### | 551 ± 278 # |
| N° EMVs (events/mL) | 1371 ± 675 | 796 ± 471 | 597 ±412 | 2272 ± 1242 # | 1918 ± 1438 ## | 1739 ± 1185 $ | 1487 ± 1200 |
| CD31 in EMVs (MFI) | 951 ± 327 | 718 ± 240 | 721 ± 241 | 842 ± 182 | 1136 ± 501 | 525 ±298 ***$ | 564 ± 344 $$ |
| N° PMVs CD142 + (events/mL) | 878 ± 409 | 1948 ± 1340 | 2915 ± 701 | 376 ± 215 ### | 909 ± 866 ## | 1216 ± 850 $$ | 798 ± 576 ##a |
| CD142 in PMV CD142 + (MFI) | 1878 ± 814 | 3990 ± 3121 * | 2335 ± 1991 | 1379 ± 523 ## | 1738 ± 1932 | 1643 ± 970 | 1269 ± 677 |
| N° EMVs CD142 + (events/mL) | 210 ±157 | 652 ± 457 * | 713 ± 309 | 279 ± 266 # | 370 ± 262 | 329 ± 203 | 165 ± 55 |
| CD142 in EMV CD142 + (MFI) | 744 ± 223 | 1185 ± 594 ** | 1000 ± 207 | 1167 ± 87 ** | 1001 ± 166 | 935 ± 492 | 848 ± 296 |
| XO Activity in Plasma (mU/mL) | TBARS (nmol/mL) | GPx Activity (U/mL) | GSH (umol/mL) | CAT Activity in Plasma (U/mL) | SOD (U/mL) | |
|---|---|---|---|---|---|---|
| N° PMV | 0.115 (p = 0.309) | 0.09 (p = 0.41) | −0.191 (p = 0.131) | −0.039 (p = 0.735) | 0.14 (p = 0.298) | 0.149 (p = 0.208) |
| CD31 IN PMV | −0.197 (p = 0.102) | 0.059 (p = 0.614) | −0.021 (p = 0.882) | 0.207 (p = 0.095) | 0.084 (p = 0.569) | 0.097 (p = 0.451) |
| CD41 IN PMV | −0.058 (p = 0.621) | 0.114 (p = 0.31) | −0.253 (p = 0.051) | 0.357 ** (p = 0.002) | 0.072 (p = 0.603) | 0.055 (p = 0.653) |
| N° EMV | 0.045 (p = 0.704) | 0.068 (p = 0.55) | −0.162 (p = 0.226) | −0.119 (p = 0.319) | 0.293 * (p = 0.037) | 0.153 (p = 0.215) |
| CD31 IN EMV | −0.186 (p = 0.106) | −0.03 (p = 0.786) | −0.091 (p = 0.487) | 0.077 (p = 0.521) | 0.07 (p = 0.617) | −0.161 (p = 0.186) |
| N° PMV CD142+ | 0.087 (p = 0.432) | −0.103 (p = 0.335) | −0.044 (p = 0.723) | 0.120 (p = 0.283) | −0.087 (p = 0.503) | 0.004 (p = 0.97) |
| CD142 IN PMV | 0.027 (p = 0.829) | −0.017 (p = 0.887) | 0.009 (p = 0.949) | 0.314 * (p = 0.01) | −0.089 (p = 0.558) | 0.054 (p = 0.677) |
| EMV CD142+ | 0.168 (p = 0.144) | −0.146 (p 0.19) | −0.03 (p = 0.822) | 0.201 (p = 0.091) | 0.022 (p = 0.872) | 0.087 (p = 0.476) |
| CD142 IN EMV | −0.024 (p = 0.868) | 0.016 (p = 0.907) | −0.094 (p = 0.584) | 0.228 (p = 0.107 | 0.175 (p = 0.322) | 0205 (p = 0.172) |
| XO IN MN (mU/mg Proteins) | XO IN PMN (mU/mg Proteins) | CAT IN MN (U/mg Proteins) | CAT IN PMN (U/mg Proteins) | SOD IN MN (U/mg Proteins) | SOD IN PMN (U/mg Proteins) | GPx IN MN (U/mg Proteins) | GPx IN PMN (U/mg Proteins) | MDA IN MN (nmol/mg Proteins) | MDA IN PMN (nmol/mg Proteins) | GSSG IN MN (nmol/mg Proteins) | GSSG IN PMN (nmol/mg Proteins) | GSH IN MN (umol/mg Proteins) | GSH IN PMN (umol/mg Proteins) | GSSG/GSH IN MN | GSSG/GSH IN PMN | OXY-SCORE | |
|---|---|---|---|---|---|---|---|---|---|---|---|---|---|---|---|---|---|
| N° PMV | −0.187 (p = 0.152) | −0.025 (p = 0.859) | −0.214 (p = 0.202) | −0.285 (p = 0.177) | −0.304 (p = 0.076) | 0.267 (p = 0.139) | −0.13 (p = 0.329) | 0.112 (p = 0.57) | −0.062 (p = 0.638) | −0.015 (p = 0.905) | −0.104 (p = 0.374) | −0.091 (p = 0.503) | −0.166 (p = 0.143) | 0.012 (p = 0.94) | 0.127 (p = 0.276) | −0.096 (p = 0.508) | −0.107 (p = 0.288) |
| CD31 IN PMV | 0.081 (p = 0.548) | 0.194 (p = 0.186) | 0.136 (p = 0.41) | −0.304 (p = 0.149) | −0.36 * (p = 0.047) | −0.135 (p = 0.511) | −0.35 * (p = 0.01) | −0.159 (p = 0.403) | −0.28 * (p = 0.046) | −0.019 (p = 0.878) | −0.109 (p = 0.382) | −0.19 (p = 0.172) | −0.054 (p = 0.657) | 0.046 (p = 0.76) | −0.053 (p = 0.669) | −0.32 (p = 0.831) | 0.000 (p = 0.997) |
| CD41 IN PMV | 0.25 (p = 0.056) | 0.216 (p = 0.12) | 0.32 * (p = 0.034) | −0.321 (p = 0.102) | −0.191 (p = 0.28) | −0.064 (p = 0.743) | −0.193 (p = 0.156) | 0.163 (p = 0.388) | −0.141 (p = 0.315) | 0.032 (p = 0.797) | −0.33 * (p = 0.005) | 0.036 (p = 0.791) | −0.094 (p = 0.42) | −0.201 (p = 0.16) | −0.24 * (p = 0.04) | 0.266 (p = 0.059) | 0.098 (p = 0.351) |
| N° EMV | −0.5 ** (p = 0.000) | −0.31 * (p = 0.031) | −0.272 (p = 0.114) | −0.123 (p = 0.596) | 0.22 (p = 0.21) | −0.204 (p = 0.281) | −0.164 (p = 0.219) | −0.188 (p = 0.319) | −0.103 (p = 0.454) | 0.132 (p = 0.293) | 0.063 (p = 0.608) | −0.24 (p = 0.084) | −0.044 (p = 0.713) | 0.196 (p = 0.19) | 0.049 (p = 0.689) | −0.32 * (p = 0.025) | −0.03 (p = 0.772) |
| CD31 IN EMV | −0.168 (p = 0.198) | −0.095 (p = 0.493) | 0.042 (p = 0.79) | −0.41 * (p = 0.027) | 0.062 (p = 0.729) | −0.158 (p = 0.413) | 0.067 (p = 0.623) | −0.31 (p = 0.096) | −0.212 (p = 0.123) | −0.183 (p = 0.133) | −0.045 (p = 0.706) | −0.098 (p = 0.462) | 0.128 (p = 0.266) | 0.246 (p = 0.08) | −0.139 (p = 0.237) | −0.16 (p = 0.257) | 0.15 (p = 0.153) |
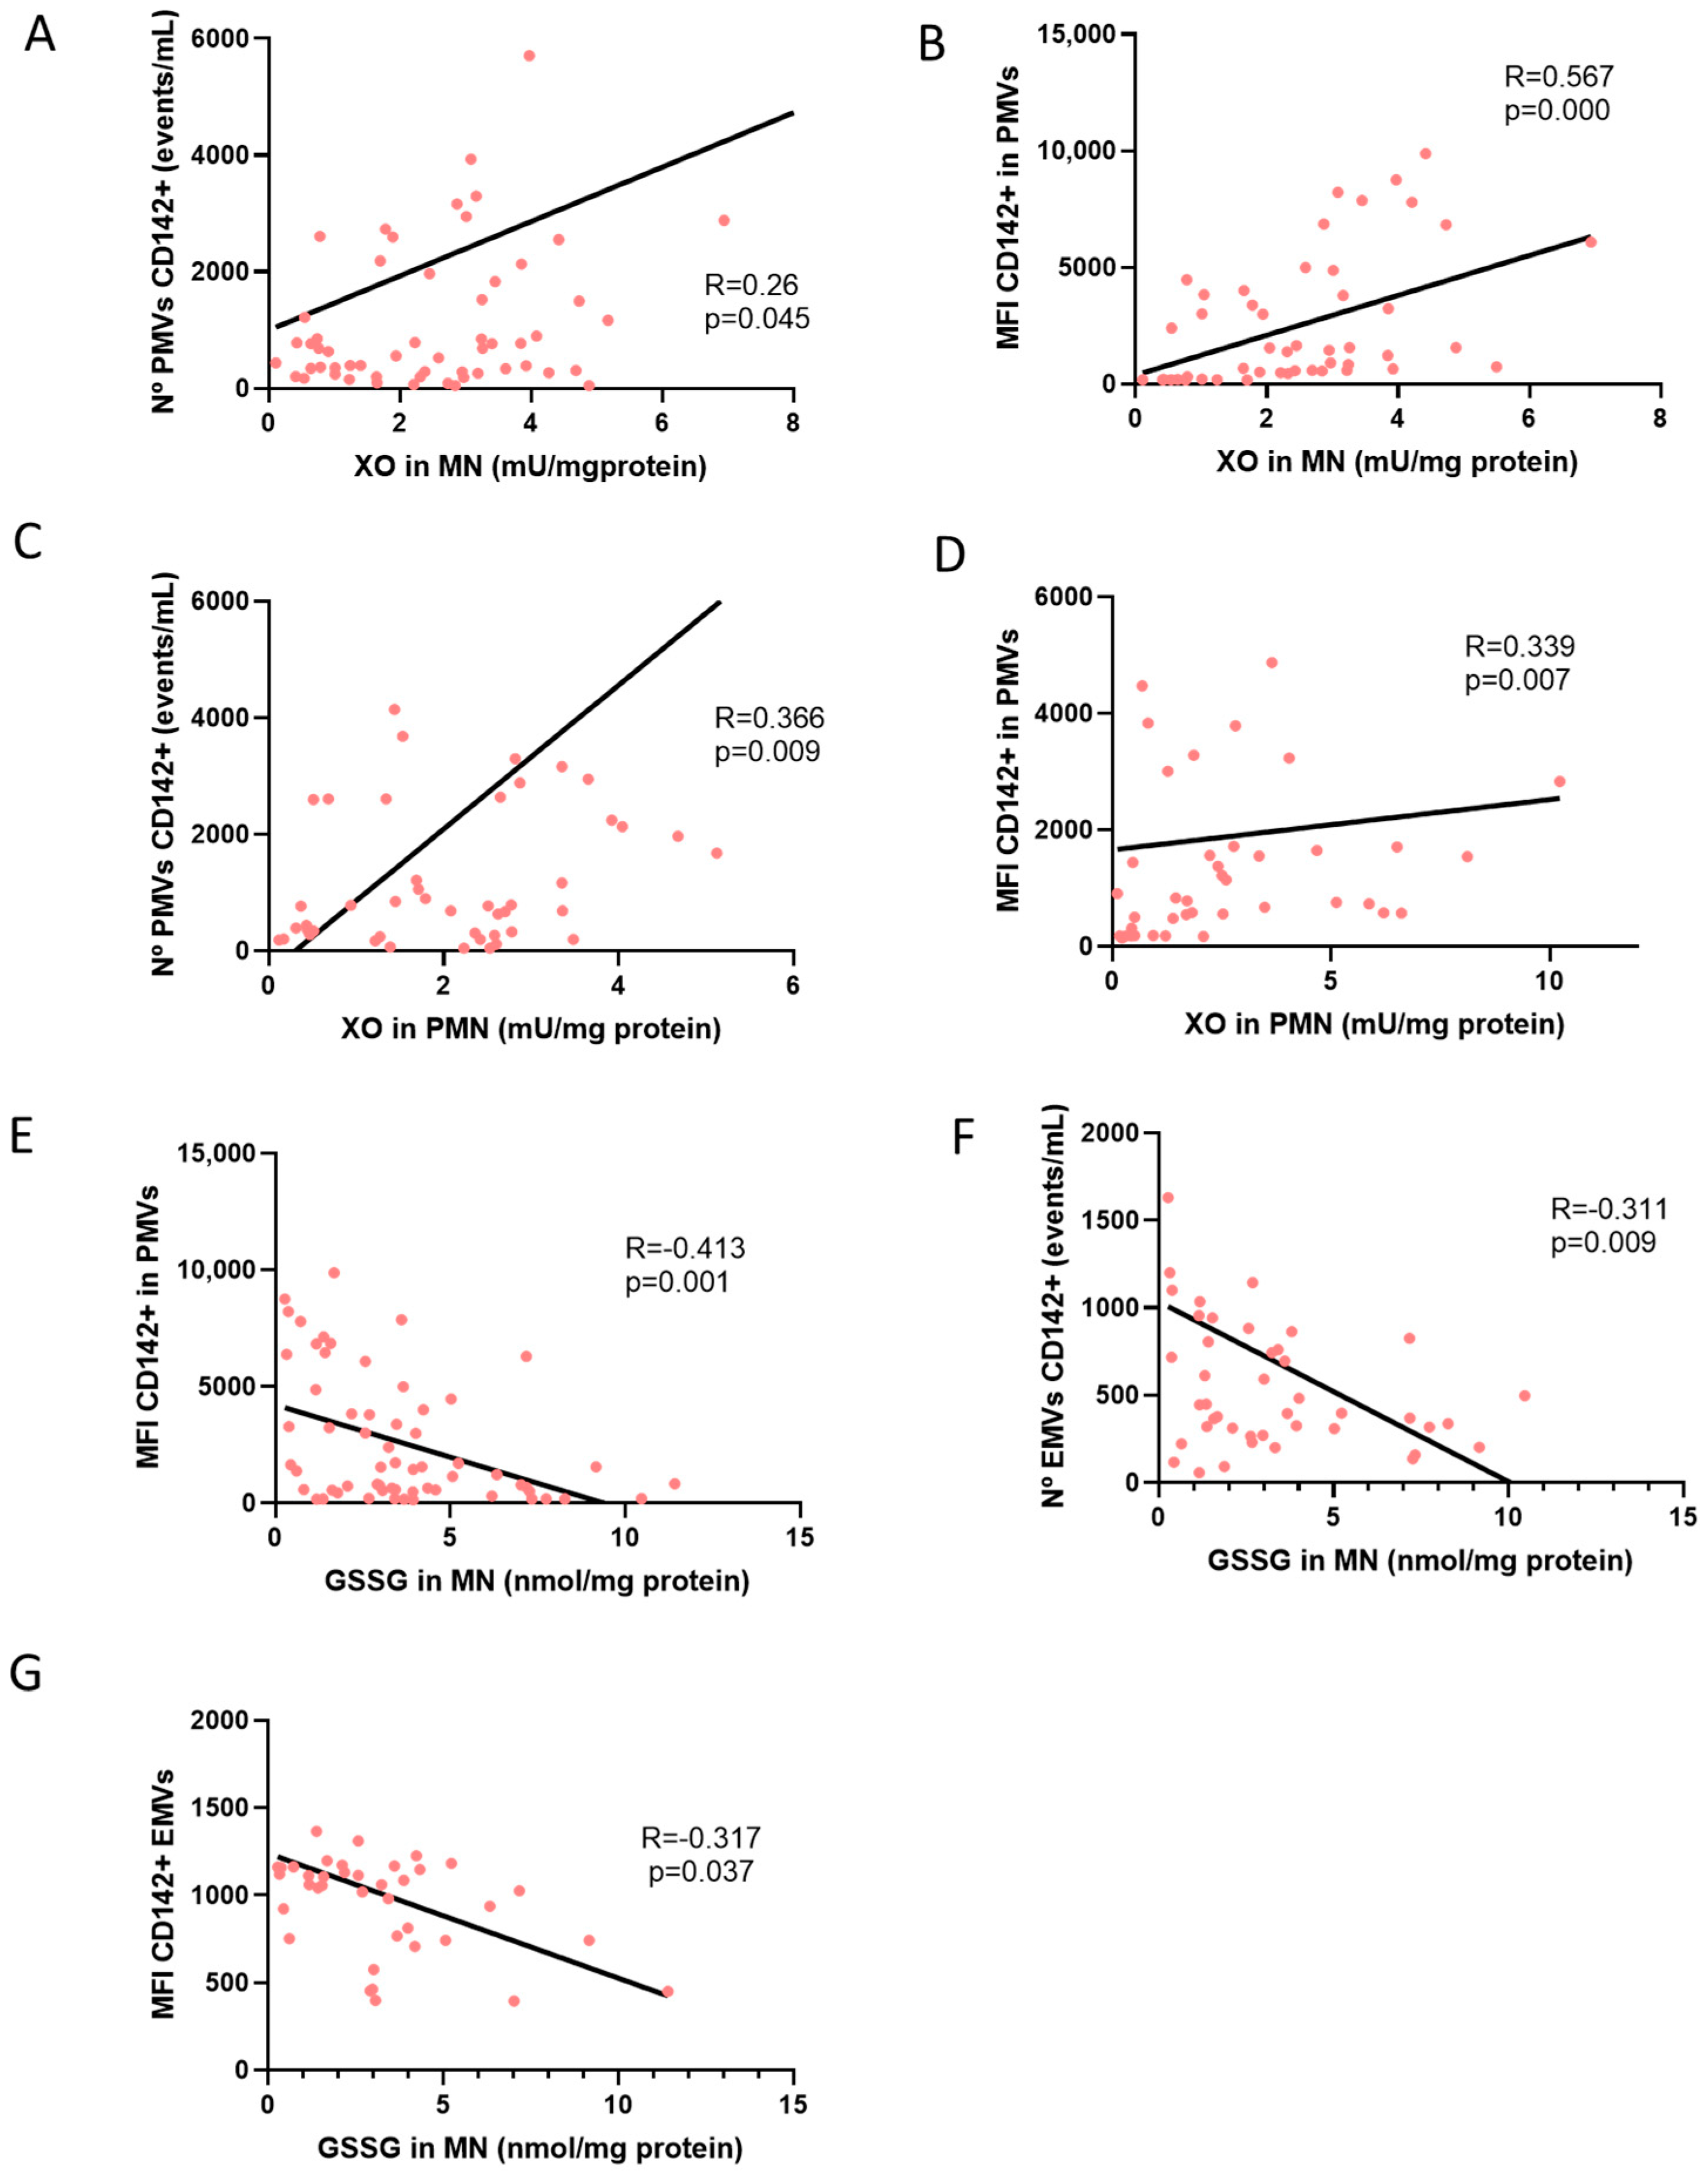
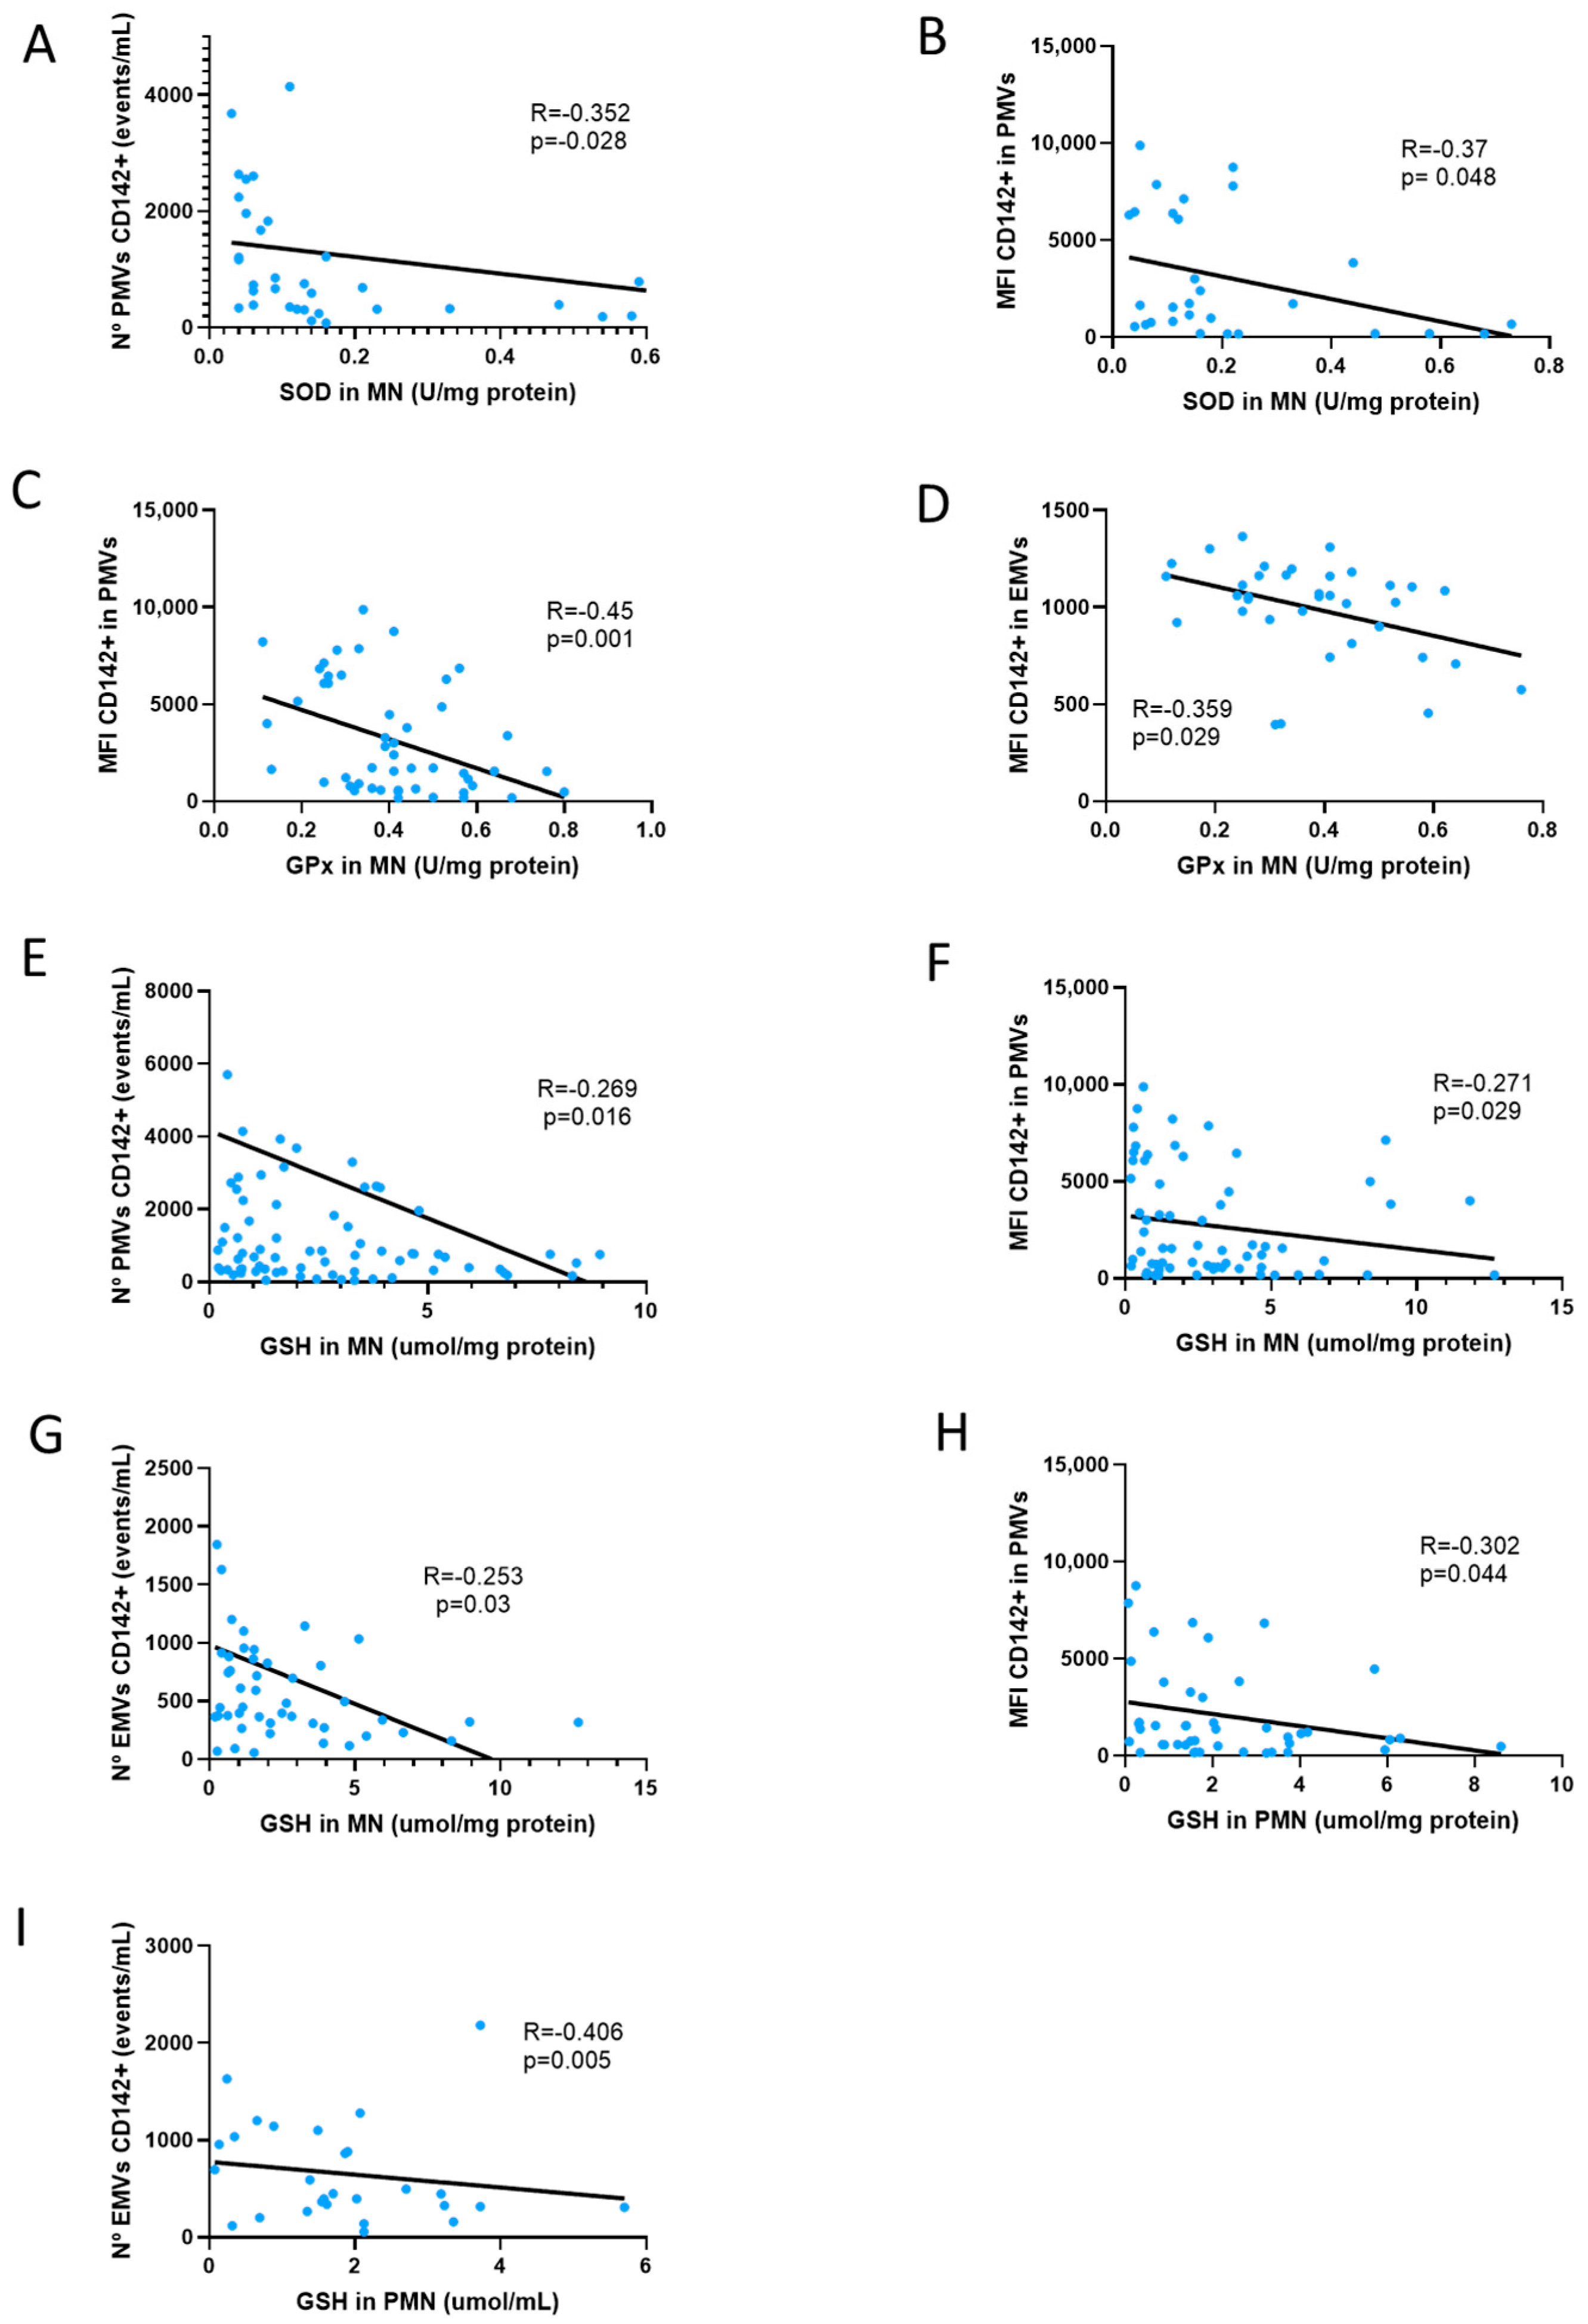
| N° PMV CD142+ | 0.26 * (p = 0.045) | 0.366 ** (p = 0.009) | 0.11 (p = 0.531) | 0.385 (p = 0.07) | −0.35 * (p = 0.028) | 0.093 (p = 0.613) | −0.156 (p = 0.225) | −0.061 (p = 0.73) | −0.002 (p = 0.991) | 0.01 (p = 0.933) | −0.213 (p = 0.068) | 0.019 (p = 0.889) | −0.27* (p = 0.016) | −0.263 (p = 0.07) | 0.093 (p = 0.425) | 0.25 (p = 0.087) | 0.001 (p = 0.994) |
| CD142 IN PMV | 0.567 ** (p = 0.000) | 0.399 ** (p = 0.007) | 0.024 (p = 0.891) | 0.085 (p = 0.706) | −0.370 * (p = 0.048) | −0.059 (p = 0.77) | −0.50 ** (p = 0.001) | −0.027 (p = 0.89) | 0.075 (p = 0.627) | −0.077 (p = 0.55) | −0.410 ** (p = 0.001) | −0.152 (p = 0.292) | −0.271 * (p = 0.029) | −0.302 * (p = 0.04) | −0.126 (p = 0.332) | 0.272 (p = 0.071) | 0.036 (p = 0.75) |
| EMV CD142+ | 0.011 (p = 0.933) | 0.176 (p = 0.231) | 0.075 (p = 0.663) | 0.03 (p = 0.889) | −0.153 (p = 0.389) | −0.003 (p = 0.987) | −0.236 (p = 0.083) | 0.067 (p = 0.731) | 0.159 (p = 0.26) | 0.019 (p = 0.885) | −0.311 ** (p = 0.009) | −0.140 (p = 0.316) | −0.253 * (p = 0.03) | −0.406 ** (p = 0.01) | −0.032 (p = 0.793) | 0.350 * (p = 0.016) | −0.028 (p = 0.792) |
| CD142 IN EMV | −0.014 (p = 0.945) | 0.151 (p = 0.434) | −0.204 (p = 0.338) | −0.398 (p = 0.158) | 0.223 (p = 0.296) | −0.289 (p = 0.192) | −0.359 * (p = 0.029) | −0.317 (p = 0.162) | −0.11 (p = 0.557 | 0.195 (p = 0.199) | −0.317 * (p = 0.046) | −0.309 ** (p = 0.08) | −0.076 (p = 0.621 | −0.208 (p = 0.29) | −0.247 (p = 0.12) | 0.044 (p = 0.823) | 0.041 (p = 0.758) |
References
- Bikbov, B.; Purcell, C.; Levey, A.S.; Smith, M.; Abdoli, A.; Abebe, M.; Adebayo, O.M.; Afarideh, M.; Agarwal, S.K.; Agudelo-Botero, M.; et al. Global, regional, and national burden of chronic kidney disease, 1990–2017: A systematic analysis for the Global Burden of Disease Study 2017. Lancet 2020, 395, 709–733. [Google Scholar] [CrossRef] [PubMed]
- Carracedo, J.; Alique, M.; Vida, C.; Bodega, G.; Ceprián, N.; Morales, E.; Praga, M.; de Sequera, P.; Ramírez, R. Mechanisms of Cardiovascular Disorders in Patients With Chronic Kidney Disease: A Process Related to Accelerated Senescence. Front. Cell Dev. Biol. 2020, 8, 185. [Google Scholar] [CrossRef] [PubMed]
- Levin, A.; Ahmed, S.B.; Carrero, J.J.; Foster, B.; Francis, A.; Hall, R.K.; Herrington, W.G.; Hill, G.; Inker, L.A.; Kazancıoğlu, R.; et al. Executive summary of the KDIGO 2024 Clinical Practice Guideline for the Evaluation and Management of Chronic Kidney Disease: Known knowns and known unknowns. Kidney Int. 2024, 105, 684–701. [Google Scholar] [CrossRef] [PubMed]
- Carmona, A.; Agüera, M.L.; Luna-Ruiz, C.; Buendía, P.; Calleros, L.; García-Jerez, A.; Rodríguez-Puyol, M.; Arias, M.; Arias-Guillen, M.; de Arriba, G.; et al. Markers of endothelial damage in patients with chronic kidney disease on hemodialysis. Am. J. Physiol. Physiol. 2017, 312, F673–F681. [Google Scholar] [CrossRef]
- House, A.A.; Wanner, C.; Sarnak, M.J.; Piña, I.L.; McIntyre, C.W.; Komenda, P.; Kasiske, B.L.; Deswal, A.; Defilippi, C.R.; Cleland, J.G.F.; et al. Heart failure in chronic kidney disease: Conclusions from a Kidney Disease: Improving Global Outcomes (KDIGO) Controversies Conference. Kidney Int. 2019, 95, 1304–1317. [Google Scholar] [CrossRef]
- Bai, F.; Wang, C.; Fan, X.; Fang, L.; Li, L.; Zhang, X.; Yu, K.; Liu, L.; Guo, L.; Yang, X. Novel biomarkers related to oxidative stress and immunity in chronic kidney disease. Heliyon 2024, 10, e27754. [Google Scholar] [CrossRef]
- Alameer, N.K.A.; Alammar, H.A.J. Some Trace Elements and Oxidative Stress Status in Patients with Chronic Rheumatoid Arthritis. J. Biomed. Biochem. 2023, 2, 21–27. [Google Scholar] [CrossRef]
- Naaz, S.; Zaidi, A.S.; Alam, A.; Habib, A.; Khan, G.A.; Alam, I. Effect of single hemodialysis session on inflammatory and oxidative stress markers of chronic kidney disease patients. Indian J. Physiol. Allied Sci. 2023, 75, 13–18. [Google Scholar] [CrossRef]
- Liakopoulos, V.; Roumeliotis, S.; Gorny, X.; Eleftheriadis, T.; Mertens, P.R. Oxidative stress in patients undergoing peritoneal dialysis: A current review of the literature. Oxidative Med. Cell. Longev. 2017, 2017, 3494867. [Google Scholar] [CrossRef]
- Schunk, S.J.; Triem, S.; Schmit, D.; Zewinger, S.; Sarakpi, T.; Becker, E.; Hütter, G.; Wrublewsky, S.; Küting, F.; Hohl, M.; et al. Interleukin-1α Is a Central Regulator of Leukocyte-Endothelial Adhesion in Myocardial Infarction and in Chronic Kidney Disease. Circulation 2021, 144, 893–908. [Google Scholar] [CrossRef]
- Abdelmaguid, A.; Roberts, L.N.; Tugores, L.; Joslin, J.R.; Hunt, B.J.; Parmar, K.; Nebres, D.; Naga, S.S.; Khalil, E.S.; Bramham, K. Evaluation of novel coagulation and platelet function assays in patients with chronic kidney disease. J. Thromb. Haemost. 2022, 20, 845–856. [Google Scholar] [CrossRef] [PubMed]
- Lopez, K.; Lai, S.W.T.; Gonzalez, E.D.J.L.; Dávila, R.G.; Shuck, S.C. Extracellular vesicles: A dive into their role in the tumor microenvironment and cancer progression. Front. Cell Dev. Biol. 2023, 11, 1154576. [Google Scholar] [CrossRef] [PubMed]
- Mause, S.F.; Berger, M.; Lim, H.Y.; Vogt, F.; Brandenburg, V.; Stöhr, R. Intravenous iron supplementation in heart failure patients induces temporary endothelial dysfunction with release of endothelial microvesicles. Front. Immunol. 2023, 13, 1092704. [Google Scholar] [CrossRef] [PubMed]
- Gong, S.; Wang, C.; Xiong, J.; Zhao, J.; Yang, K. Activated Platelets, the Booster of Chronic Kidney Disease and Cardiovascular Complications. Kidney Dis. 2022, 8, 297–307. [Google Scholar] [CrossRef]
- Tutuianu, A.; Anene, C.A.; Shelton, M.; Speirs, V.; Whitelaw, D.C.; Thorpe, J.; Roberts, W.; Boyne, J.R. Platelet-derived microvesicles isolated from type-2 diabetes mellitus patients harbour an altered miRNA signature and drive MDA-MB-231 triple-negative breast cancer cell invasion. PLoS ONE 2024, 19, e0304870. [Google Scholar] [CrossRef]
- Vida, C.; Oliva, C.; Yuste, C.; Ceprián, N.; Caro, P.J.; Valera, G.; de Pablos, I.G.; Morales, E.; Carracedo, J. Oxidative stress in patients with advanced ckd and renal replacement therapy: The key role of peripheral blood leukocytes. Antioxidants 2021, 10, 1155. [Google Scholar] [CrossRef]
- Veglia, F.; Cavalca, V.; Tremoli, E. OXY-SCORE: A global index to improve evaluation of oxidative stress by oxy-score: A global index to improve evaluation of oxidative stress by combining pro- and antioxidant. In Advanced Protocols in Oxidative Stress II; Springer Nature: Dordrecht, The Netherlands, 2010. [Google Scholar] [CrossRef]
- Welsh, J.A.; Goberdhan, D.C.I.; O’Driscoll, L.; Buzas, E.I.; Blenkiron, C.; Bussolati, B.; Cai, H.; Di Vizio, D.; Driedonks, T.A.P.; Erdbrügger, U.; et al. Minimal information for studies of extracellular vesicles (MISEV2023): From basic to advanced approaches. J. Extracell. Vesicles 2023, 13, e12404. [Google Scholar] [CrossRef]
- Ceprian, N.; Valera, G.; Caro, J.; Yuste, C.; Serroukh, N.; de Pablos, I.G.; Oliva, C.; Figuer, A.; Praga, M.; Alique, M.; et al. Effect of Kidney Transplantation on Accelerated Immunosenescence and Vascular Changes Induced by Chronic Kidney Disease. Front. Med. 2021, 8, 705159. [Google Scholar] [CrossRef]
- Cerqueira, A.; Quelhas-Santos, J.; Sampaio, S.; Ferreira, I.; Relvas, M.; Marques, N.; Dias, C.C.; Pestana, M. Endothelial dysfunction is associated with cerebrovascular events in pre-dialysis CKD patients: A prospective study. Life 2021, 11, 128. [Google Scholar] [CrossRef]
- Maraj, M.; Kuśnierz-Cabala, B.; Dumnicka, P.; Gawlik, K.; Pawlica-Gosiewska, D.; Gala-Błądzińska, A.; Ząbek-Adamska, A.; Ceranowicz, P.; Kuźniewski, M. Redox Balance Correlates with Nutritional Status among Patients with End-Stage Renal Disease Treated with Maintenance Hemodialysis. Oxidative Med. Cell. Longev. 2019, 2019, 1–10. [Google Scholar] [CrossRef]
- Vida, C.; Rodríguez-Terés, S.; Heras, V.; Corpas, I.; De la Fuente, M.; González, E. The aged-related increase in xanthine oxidase expression and activity in several tissues from mice is not shown in long-lived animals. Biogerontology 2011, 12, 551–564. [Google Scholar] [CrossRef] [PubMed]
- Yokota, T.; Kinugawa, S.; Hirabayashi, K.; Yamato, M.; Takada, S.; Suga, T.; Nakano, I.; Fukushima, A.; Matsushima, S.; Okita, K.; et al. Systemic oxidative stress is associated with lower aerobic capacity and impaired skeletal muscle energy metabolism in heart failure patients. Sci. Rep. 2021, 11, 1–8. [Google Scholar] [CrossRef] [PubMed]
- Tomás-Simó, P.; D’marco, L.; Romero-Parra, M.; Tormos-Muñoz, M.C.; Sáez, G.; Torregrosa, I.; Estañ-Capell, N.; Miguel, A.; Gorriz, J.L.; Puchades, M.J. Oxidative stress in non-dialysis-dependent chronic kidney disease patients. Int. J. Environ. Res. Public Health 2021, 18, 7806. [Google Scholar] [CrossRef] [PubMed]
- González-Rico, M.; Puchades-Montesa, J.; García-Ramón, R.; Sáez, G.; Tormos, M.C.; Miguel, A. Effect of hemodialysis therapy on oxidative stress in patients with chronic renal failure. Nefrología 2006, 26, 218–225. [Google Scholar] [PubMed]
- de Toda, I.M.; Miguélez, L.; Vida, C.; Carro, E.; De la Fuente, M. Altered Redox State in Whole Blood Cells from Patients with Mild Cognitive Impairment and Alzheimer’s Disease. J. Alzheimer’s Dis. 2019, 71, 153–163. [Google Scholar] [CrossRef]
- Pérez-García, R.; Ramírez, R.; de Sequera, P.; Albalate, M.; Puerta, M.; Ortega, M.; Ruiz, M.C.; Alcazar-Arroyo, R. Citrate dialysate does not induce oxidative stress or inflammation in vitro as compared to acetate dialysate. Nefrología 2017, 37, 630–637. [Google Scholar] [CrossRef]
- Roumeliotis, S.; Eleftheriadis, T.; Liakopoulos, V. Is oxidative stress an issue in peritoneal dialysis? Semin. Dial. 2019, 32, 463–466. [Google Scholar] [CrossRef]
- Vida, C.; de Toda, I.M.; Cruces, J.; Garrido, A.; Gonzalez-Sanchez, M.; De la Fuente, M. Role of macrophages in age-related oxidative stress and lipofuscin accumulation in mice. Redox Biol. 2017, 12, 423–437. [Google Scholar] [CrossRef]
- Chen, J.; Hamm, L.L.; Mohler, E.R.; Hudaihed, A.; Arora, R.; Chen, C.-S.; Liu, Y.; Browne, G.; Mills, K.T.; Kleinpeter, M.A.; et al. Interrelationship of multiple endothelial dysfunction biomarkers with chronic kidney disease. PLoS ONE 2015, 10, e0132047. [Google Scholar] [CrossRef]
- Yang, K.; Du, C.; Wang, X.; Li, F.; Xu, Y.; Wang, S.; Chen, S.; Chen, F.; Shen, M.; Chen, M.; et al. Indoxyl sulfate induces platelet hyperactivity and contributes to chronic kidney disease–associated thrombosis in mice. Blood 2017, 129, 2667–2679. [Google Scholar] [CrossRef]
- Ando, M.; Iwata, A.; Ozeki, Y.; Tsuchiya, K.; Akiba, T.; Nihei, H. Circulating platelet-derived microparticles with procoagulant activity may be a potential cause of thrombosis in uremic patients. Kidney Int. 2002, 62, 1757–1763. [Google Scholar] [CrossRef] [PubMed]
- Addi, T.; Poitevin, S.; McKay, N.; El Mecherfi, K.E.; Kheroua, O.; Jourde-Chiche, N.; De Macedo, A.; Gondouin, B.; Cerini, C.; Brunet, P.; et al. Mechanisms of tissue factor induction by the uremic toxin indole-3 acetic acid through aryl hydrocarbon receptor/nuclear factor-kappa B signaling pathway in human endothelial cells. Arch. Toxicol. 2019, 93, 121–136. [Google Scholar] [CrossRef] [PubMed]
- Snir, O.; Wilsgård, L.; Latysheva, N.; Wahlund, C.J.E.; Brækkan, S.K.; Hindberg, K.; Hansen, J. Plasma levels of platelet-derived microvesicles are associated with risk of future venous thromboembolism. J. Thromb. Haemost. 2022, 20, 899–908. [Google Scholar] [CrossRef] [PubMed]
- Hottz, E.D.; Azevedo-Quintanilha, I.G.; Palhinha, L.; Teixeira, L.; Barreto, E.A.; Pão, C.R.R.; Righy, C.; Franco, S.; Souza, T.M.L.; Kurtz, P.; et al. Platelet activation and platelet-monocyte aggregate formation trigger tissue factor expression in patients with severe COVID-19. Blood 2020, 136, 1330–1341. [Google Scholar] [CrossRef] [PubMed]
- Menéndez, E.G.; Vidas, M.M.; Alique, M.; Carracedo, J.; de Sequera, P.; Corchete, E.; García, R.P.; Chamond, R.R.; Portolés, J.M. Statins and antiplatelet agents are associated with changes in the circulatory markers of endothelial dysfunction in chronic kidney disease. Nefrol. 2019, 39, 287–293. [Google Scholar] [CrossRef]
- de Laval, P.; Mobarrez, F.; Almquist, T.; Vassil, L.; Fellström, B.; Soveri, I. Acute effects of haemodialysis on circulating microparticles. Clin. Kidney J. 2019, 12, 456–462. [Google Scholar] [CrossRef]
- Ruzicka, M.; Xiao, F.; Abujrad, H.; Al-Rewashdy, Y.; Tang, V.A.; Langlois, M.-A.; Sorisky, A.; Ooi, T.C.; Burger, D. Effect of hemodialysis on extracellular vesicles and circulating submicron particles. BMC Nephrol. 2019, 20, 1–8. [Google Scholar] [CrossRef]
- Shahin, H.I.; Radnaa, E.; Tantengco, O.A.G.; Kechichian, T.; Kammala, A.K.; Sheller-Miller, S.; Taylor, B.D.; Menon, R. Microvesicles and exosomes released by amnion epithelial cells under oxidative stress cause inflammatory changes in uterine cells. Biol. Reprod. 2021, 105, 464–480. [Google Scholar] [CrossRef]
- Sudnitsyna, J.; Skverchinskaya, E.; Dobrylko, I.; Nikitina, E.; Gambaryan, S.; Mindukshev, I. Microvesicle formation induced by oxidative stress in human erythrocytes. Antioxidants 2020, 9, 929. [Google Scholar] [CrossRef]
- Sangokoya, C.; Telen, M.J.; Chi, J.-T. microRNA miR-144 modulates oxidative stress tolerance and associates with anemia severity in sickle cell disease. Blood 2010, 116, 4338–4348. [Google Scholar] [CrossRef]
- Wang, W.; Zheng, Y.; Wang, M.; Yan, M.; Jiang, J.; Li, Z. Exosomes derived miR-126 attenuates oxidative stress and apoptosis from ischemia and reperfusion injury by targeting ERRFI1. Gene 2019, 690, 75–80. [Google Scholar] [CrossRef] [PubMed]
- Yuan, M.; Yang, X.; Duscher, D.; Xiong, H.; Ren, S.; Xu, X.; Wang, C.; Chen, J.; Liu, Y.; Machens, H.-G.; et al. Overexpression of microRNA-21-5p prevents the oxidative stress-induced apoptosis of RSC96 cells by suppressing autophagy. Life Sci. 2020, 256, 118022. [Google Scholar] [CrossRef] [PubMed]
- Bodega, G.; Alique, M.; Puebla, L.; Carracedo, J.; Ramírez, R.M. Microvesicles: ROS scavengers and ROS producers. J. Extracell. Vesicles 2019, 8, 1626654. [Google Scholar] [CrossRef] [PubMed]
- Panday, S.; Talreja, R.; Kavdia, M. The role of glutathione and glutathione peroxidase in regulating cellular level of reactive oxygen and nitrogen species. Microvasc. Res. 2020, 131, 104010. [Google Scholar] [CrossRef]
- Wang, H.; Wang, Z.-H.; Kong, J.; Yang, M.-Y.; Jiang, G.-H.; Wang, X.-P.; Zhong, M.; Zhang, Y.; Deng, J.-T.; Zhang, W. Oxidized low-density lipoprotein-dependent platelet-derived microvesicles trigger procoagulant effects and amplify oxidative stress. Mol. Med. 2012, 18, 159–166. [Google Scholar] [CrossRef]
- Chiva-Blanch, G.; Suades, R.; Padró, T.; Vilahur, G.; Peña, E.; Ybarra, J.; Pou, J.; Badimon, L. Oxidative Stress in Patients with Advanced CKD and Renal Replacement Therapy: The Key Role of Peripheral Leukocytes. Rev. Esp. Cardiol. 2016, 69, 672–680. [Google Scholar] [CrossRef]
- Vassalle, C.; Petrozzi, L.; Botto, N.; Andreassi, M.G.; Zucchelli, G.C. Oxidative stress and its association with coronary artery disease and different atherogenic risk factors. J. Intern. Med. 2004, 256, 308–315. [Google Scholar] [CrossRef]


| Characteristics | HS (n = 15) | ACKD (n = 40) | HD (n = 40) | PD (n = 36) |
|---|---|---|---|---|
| Demographic data | ||||
| Age (years; mean ± SE) | 51 ± 15.5 | 60.7 ± 17.2 | 57.4 ± 14.6 | 56.2 ± 13.4 |
| Nº women, n (%) | 8 (47) | 14 (35) | 13 (32.5) | 17 (47.2) |
| Smoking, n (%) | 3 (18) | 11 (27.5) | 16 (40) | 9 (25) |
| eGFR (mL/min/1.73 m2) | 69 ± 10.53 | 14.04 ± 4.9 * | 7.36 ± 4.08 ***### | 7.14 ± 2.63 ***### |
| KT/V | - | - | 1.67 ± 0.25 | 2.34 ± 0.5 |
| Comorbidity | ||||
| Diabetes mellitus, n (%) | 0 (0) | 18 (45) ** | 7 (15.5) | 11 (30.6) * |
| Dyslipidemia, n (%) | 0 (0) | 31 (77.5) *** | 23 (57.5) *** | 22 (61.1) *** |
| Hyperuricemia, n (%) | 0 (0) | 28 (70) *** | 11 (27.5) ** | 19 (52.8) *** |
| Hypertension, n (%) | 1 (6) | 36 (90) *** | 33 (82.5) *** | 33 (91.7) *** |
| Cardiovascular events, n (%) | 0 (0) | 22 (55) ** | 22 (55) ** | 20 (55.6) ** |
| Ischemic cardiopathy (n (%)) | 0 (0) | 17 (42.5) ** | 21 (52.5) *** | 16 (44.4) *** |
| Acute cardiovascular accident (n (%)) | 0 (0) | 6 (15) * | 2 (5) | 8 (22.2) * |
| Vasculopathy (n (%)) | 0 (0) | 4 (10) | 15 (37.5) ** | 5 (13.8) * |
| Chronic cardiac insufficiency (n (%)) | 0 (0) | 3 (7.5) | 7 (17.5) * | 4 (11.1) |
| Treatment | ||||
| Erythropoietin, n (%) | 0 (0) | 19 (47.5) *** | 40 (100) *** | 20 (55.6) *** |
| Statin, n (%) | 0 (0) | 30 (75) *** | 16 (40) ** | 19 (52.8) *** |
| Alopurinol, n (%) | 0 (0) | 24 (60) *** | 8 (20) ** | 17 (47.2) *** |
| Antiplatelets agents, n (%) | 0 (0) | 7 (17.5) * | 10 (25) * | 7 (19.4) * |
| Anticoagulants, n (%) | 0 (0) | 8 (20) * | 5 (12.5) | 1 (2) |
Disclaimer/Publisher’s Note: The statements, opinions and data contained in all publications are solely those of the individual author(s) and contributor(s) and not of MDPI and/or the editor(s). MDPI and/or the editor(s) disclaim responsibility for any injury to people or property resulting from any ideas, methods, instructions or products referred to in the content. |
© 2025 by the authors. Licensee MDPI, Basel, Switzerland. This article is an open access article distributed under the terms and conditions of the Creative Commons Attribution (CC BY) license (https://creativecommons.org/licenses/by/4.0/).
Share and Cite
Valera-Arévalo, G.; Rodríguez-San Pedro, M.d.M.; Caro, P.J.; Cabanillas, V.; Ortiz-Diaz, M.G.; Figuer, A.; Yuste, C.; Ramírez, R.; Alique, M.; Morales, E.; et al. Oxidative Score and Microvesicle Profile Suggest Cardiovascular Risk in Chronic Kidney Disease. Antioxidants 2025, 14, 178. https://doi.org/10.3390/antiox14020178
Valera-Arévalo G, Rodríguez-San Pedro MdM, Caro PJ, Cabanillas V, Ortiz-Diaz MG, Figuer A, Yuste C, Ramírez R, Alique M, Morales E, et al. Oxidative Score and Microvesicle Profile Suggest Cardiovascular Risk in Chronic Kidney Disease. Antioxidants. 2025; 14(2):178. https://doi.org/10.3390/antiox14020178
Chicago/Turabian StyleValera-Arévalo, Gemma, María del Mar Rodríguez-San Pedro, Paula Jara Caro, Víctor Cabanillas, María Gabriela Ortiz-Diaz, Andrea Figuer, Claudia Yuste, Rafael Ramírez, Matilde Alique, Enrique Morales, and et al. 2025. "Oxidative Score and Microvesicle Profile Suggest Cardiovascular Risk in Chronic Kidney Disease" Antioxidants 14, no. 2: 178. https://doi.org/10.3390/antiox14020178
APA StyleValera-Arévalo, G., Rodríguez-San Pedro, M. d. M., Caro, P. J., Cabanillas, V., Ortiz-Diaz, M. G., Figuer, A., Yuste, C., Ramírez, R., Alique, M., Morales, E., Guerra-Pérez, N., & Carracedo, J. (2025). Oxidative Score and Microvesicle Profile Suggest Cardiovascular Risk in Chronic Kidney Disease. Antioxidants, 14(2), 178. https://doi.org/10.3390/antiox14020178