2.1. Chemicals and Materials
Polyethylenimine (branched average Mw ~800 by LS, average Mn ~600 by GPC, Sigma-Aldrich CHEMIE GmbH, Steinheim, Germany), Bisphenol A diglycidyl ether (Sigma-Aldrich CHEMIE GmbH, Steinheim, Germany), Poly(propylene glycol) diglycidyl ether (average Mn 380, Sigma-Aldrich CHEMIE GmbH, Steinheim, Germany), 1-Methyl-2-pyrrolidinone (EMPLURA®, Sigma-Aldrich Sigma-Aldrich CHEMIE GmbH, Steinheim, Germany), Methyl iodide (stabilized with copper wire, for synthesis, SDFCL, Mumbai-30, India), Acrylonitrile (LiChrosolv®, Sigma-Aldrich CHEMIE GmbH, Steinheim, Germany), acetone (EMSURE®, Sigma-Aldrich CHEMIE GmbH, Steinheim, Germany), chloroform (EMSURE®, Sigma-Aldrich CHEMIE GmbH, Steinheim, Germany), sodium chloride (≥99.5%, Analytical reagent grade, Fisher Chemical, Geel, Belgium), sodium sulfate (ACS Reagent, ≥99.0%, anhydrous, Sigma Aldrich CHEMIE GmbH, Steinheim, Germany), Sodium Nitrate (ACS Reagent, ≥99.0%, anhydrous, Sigma Aldrich CHEMIE GmbH, Steinheim, Germany), silver nitrate (≥99.9%, Analytical reagent grade, Fisher Chemical, Geel, Belgium), phenolphthalein (General purpose grade, Fisher Chemical, Geel, Belgium), potassium chromate (Sigma Aldrich CHEMIE GmbH, Steinheim, Germany), potassium hydrogen phthalate (SDFCL, Mumbai-30, India), zinc nitrate hexahydrate (reagent grade, 98%, Sigma Aldrich CHEMIE GmbH, Steinheim, Germany), cobalt nitrate hexahydrate (purified, SDFCL, Mumbai-30, India), potassium carbonate (for analysis, EMSURE®, Sigma Aldrich CHEMIE GmbH, Steinheim, Germany), Type 1 and Type 2 water was obtained with Milli-Q IQ 7015 Milli-Q (Merck Millipore, Burlington, MA, USA).
Five different materials were tested for reinforcement: three types of meshes from polyamide (PA), polyethylene terephthalate (mPET) and polypropylene (mPP), two types of non-woven fabrics from polypropylene (nwPP) and polyethylene terephthalate (nwPET). All materials were ordered from local suppliers, and the conformity of the polymers to the declared ones was verified by FTIR spectroscopy. Several commercial anion exchange membranes were also tested for comparison of properties: RALEX© AM-PP (MEGA a.s., Stráž pod Ralskem, Czech Republic), Neosepta© AMX (ASTOM Co., Tokyo, Japan), FujiFilm© T1 (FUJIFILM, Minato, Japan) and Fumasep© FAD-PET-75 (FuMA-Tech, Bietigheim-Bissingen, Germany).
2.2. Membrane Fabrication
Membranes were prepared according to the scheme shown in
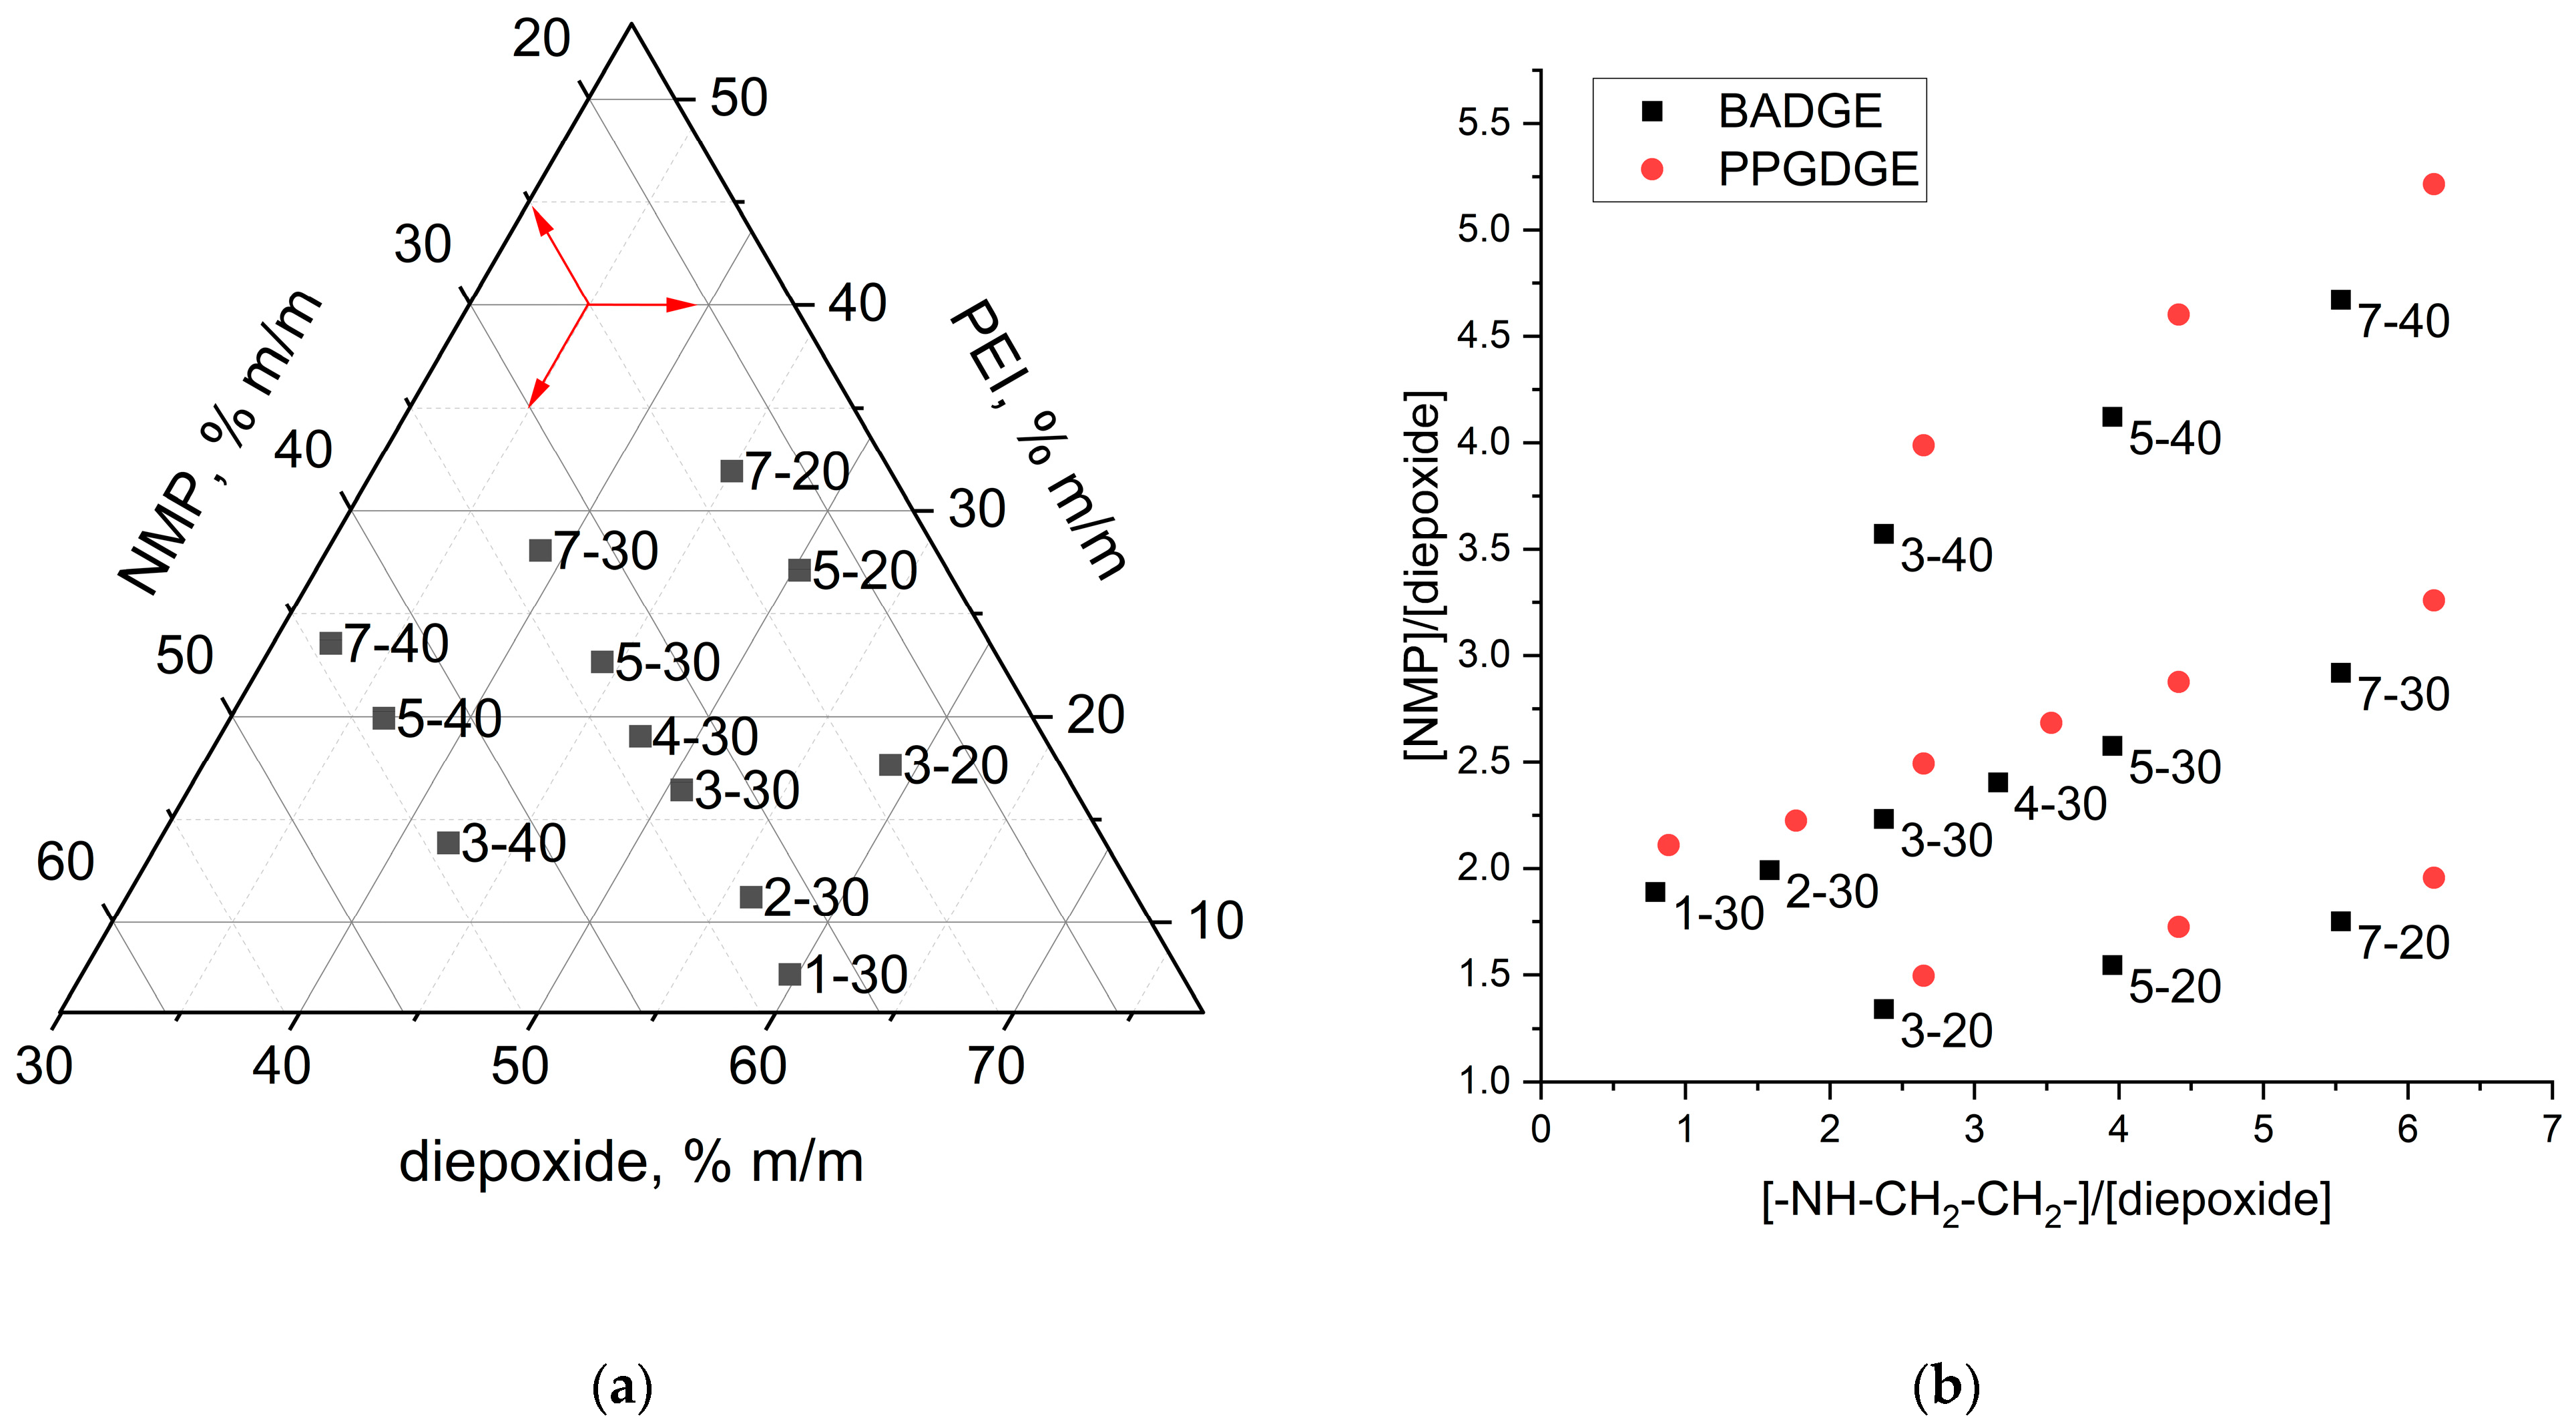
Figure 1. About 2 mL of a mixture of Bisphenol A diglycidyl ether (BADGE) or Poly(propylene glycol) diglycidyl ether (PPGDGE), polyethyleneimine (PEI), 1-Methyl-2-pyrrolidinone (NMP) was prepared in an Eppendorf, all reagents were weighed on an analytical balance. The mass and molar composition of the ternary mixtures with labels under study are presented in
Figure 2. After mechanical stirring, the mixture was kept in a 0.2 bar vacuum in a vacuum oven (VT 6060 P-BL, Thermo Scientific, Waltham, MA, USA) for 5–10 min to remove air bubbles. The reaction mixture was then poured into a zip-lock bag (11 cm × 8 cm), where a reinforcing mesh/fabric was placed beforehand. After removing the excess mixture and squeezing out visible air bubbles, the zip-lock bag was closed and clamped between two sheets of tempered glass (102 mm × 102 mm × 5 mm) using clamps. Thermal curing was carried out in an oven (DRY-Line 56 Prime, VWR Inc., West Chester, PA, USA) at a constant temperature of 80 °C for a certain time, which was determined upon termination of the reaction in a separate experiment using differential scanning calorimetry (DSC 214 Polyma, Netzsch, Selb, Germany). The influence of curing temperature on membrane properties was also investigated by varying curing temperature at 50, 60, 70 or 80 °C. After the curing step the PEI quaternization reaction to create positively charged functional groups was performed using 50 mL of a 5%
v/v. solution of methyl iodide in one of the following solvents: acetone (ACE), acrylonitrile (AN),
N-methylpyrolidone (NMP), and chloroform (TCM). Also, approximately 1 g of potassium carbonate was added to the alkylation mixture to neutralize the acid released during the Menshutkin reaction.
The alkylation was carried out for 12 h in a sealed container under stirring on an orbital shaker (LAB FISH®), and all work with methyl iodide was carried out in a fumehood due to its toxicity. After alkylation, the membranes were placed for 5–10 h in a solution of 5–6 M NaCl with the addition of potassium carbonate (about 1% m/m) to hydrate the membranes and decompose methyl iodide residues. The membranes were washed in 1–2 M sodium chloride solution for a day with periodic solution changes (3–4 times) and then in Type 1 deionized water with periodic changes (3–4 times) for the next day. In the long term, the membranes were stored in 2–3 M NaCl and equilibrated with the required solutions before experiments.
Different ratios of reactants were investigated in this study to determine the influence of the composition of the initial ternary mixture on the membrane properties.
Figure 2 shows the labeling and mass/molar composition of the ternary mixtures. Typical component masses can be found in
Table S1. The labels of the ternary reaction mixtures consist of two symbols X-Y, where X is a number depending on the mass ratio of epoxide to amine (“1”—1:0.1, “2”—1:0.2, “3”—1:0.3, and so on), and Y is a number depending on the mass fraction of NMP diluent in the mixture (“20”—23%, “30”—33%, “40”—44%). The higher X is, the more amine is in the mixture. If it is not apparent from the context, the name of the diepoxide used (BA—Bisphenol A diglycidyl ether, PPG—Poly(propylene glycol) diglycidyl ether) was added before the designation of the composition, and after that, the designation of the reinforcing matrix used (mPP—polypropylene mesh, nwPP—non-woven polypropylene, and so on), or the type of solvent in which the membrane was alkylated (AN—acrylonitrile, NMP—
N-methylpyrollidone, ACE—acetone, TCM—trichloromethane) was added. For example, the designation BA_30-2_PA_AN denotes a membrane derived from bisphenol A diglycidyl ether, with the composition of reactants 30-2, polyamide mesh was used as reinforcing material, and alkylation was carried out in a solution of methyl iodide in acetonitrile. However, we tried to use such complete designations due to their complexity rarely.
2.4. Membrane Water Uptake and Ion Exchange Capacity
Water uptake and ion exchange capacity constitute key properties of ion exchange membranes; these parameters are determined by the physicochemical structure of the membrane and largely determine its transport characteristics. To measure water uptake (WU), the sample of membrane equilibrated with Type II was weighed using an analytical balance (Cubis
® MCA3203S-2S00-E, Sartorius AG, Gottingen, Germany) before and after dehydratation at 70 °C during 4–6 h in the laboratory oven (AX Oven, CARBOLITE GERO, Sheffield, UK). The value of WU was calculated using the following equation:
where m
w and m
d are the hydrated and dry membrane masses, respectively.
To measure the strong base ion exchange capacity (s-IEC), the dry preweighed membrane sample was equilibrated with an excess of 1 M of sodium nitrate solution. Then, the concentration of the exchanged chloride ions was determined by argentometric titration with potassium chromate as an indicator. The s-IEC was calculated using the following equation:
where V(NaNO
3) is the volume of sodium nitrate solution, C(Cl
−) is the concentration of chloride ions determined by argentometric titration, and m
d is the mass of the dry membrane.
The acid–base back titration method was used to measure weak base ion exchange capacity (w-IEC). This method is based on the neutralization of weakly basic amino groups in the membrane with hydrochloric acid. To do this, a weighed dry sample of the membrane was placed in approximately two-fold excess of 0.01 M hydrochloric acid and equilibrated for 12–14 h with stirring. Then, the concentration of unreacted acid was determined by titration with a 0.01 M alkali solution with a phenolphthalein indicator. The alkali solution was standardized by titration of a standard solution of potassium hydrogen phthalate. The w-IEC was calculated using the following equation:
where V(
) is the volume of 0.01 M hydrochloric acid added to the membrane sample, and C(HCl)
0 and C(HCl)
1 are the concentration of acid before and after equilibration with the membrane.
All used capacity and water uptake values were corrected for the reinforcement content. This is important because the content of the reinforcing mesh is not constant for different materials. To calculate the polymer content (PC), a rectangular sample of membrane and mesh with dry area S was weighed, and the copolymer content (PC) was calculated using the following formula:
where m
r and m
m are masses of reinforcing material and membrane, S
r and S
m are areas of reinforcing material and membrane. The capacity and water uptake were corrected by dividing by the PC copolymer fraction. The polymer fraction for all membranes was in the range of 0.70–0.80.
2.7. Membrane Ionic Conductivity, Permselectivity and Salt Diffusion Permeability
Key transport characteristics of membranes are ionic conductivity and permselectivity. The ionic conductivity of the membranes (σ, mS/cm) in chloride form was measured by sandwiching each membrane (active area: 0.785 cm
2) between two soft graphite foil and two stainless steel electrodes by impedance spectroscopy using a Autolab PGSTAT302N potentiostat/galvanostat (Metrohm, Herisau, Switzerland) over a frequency range of 1 MHz to 100 Hz. The system was immersed in type I water at room temperature (20–22 °C). To exclude the cell contribution, the impedance of the short-circuited cell was measured and subtracted from the impedance of the cell with the membrane following the approach described previously [
30]. Ionic resistance was defined as the intercept of the active impedance axis on the Nyquist plots. The following equation was used to calculate the membrane conductance:
where T is the membrane thickness, R is the membrane ionic resistance, and S is the active area of the cell.
Two parameters were used to characterize permselectivity. First, the potentiometric transport numbers (t
pot, %) were calculated from membrane potential (E
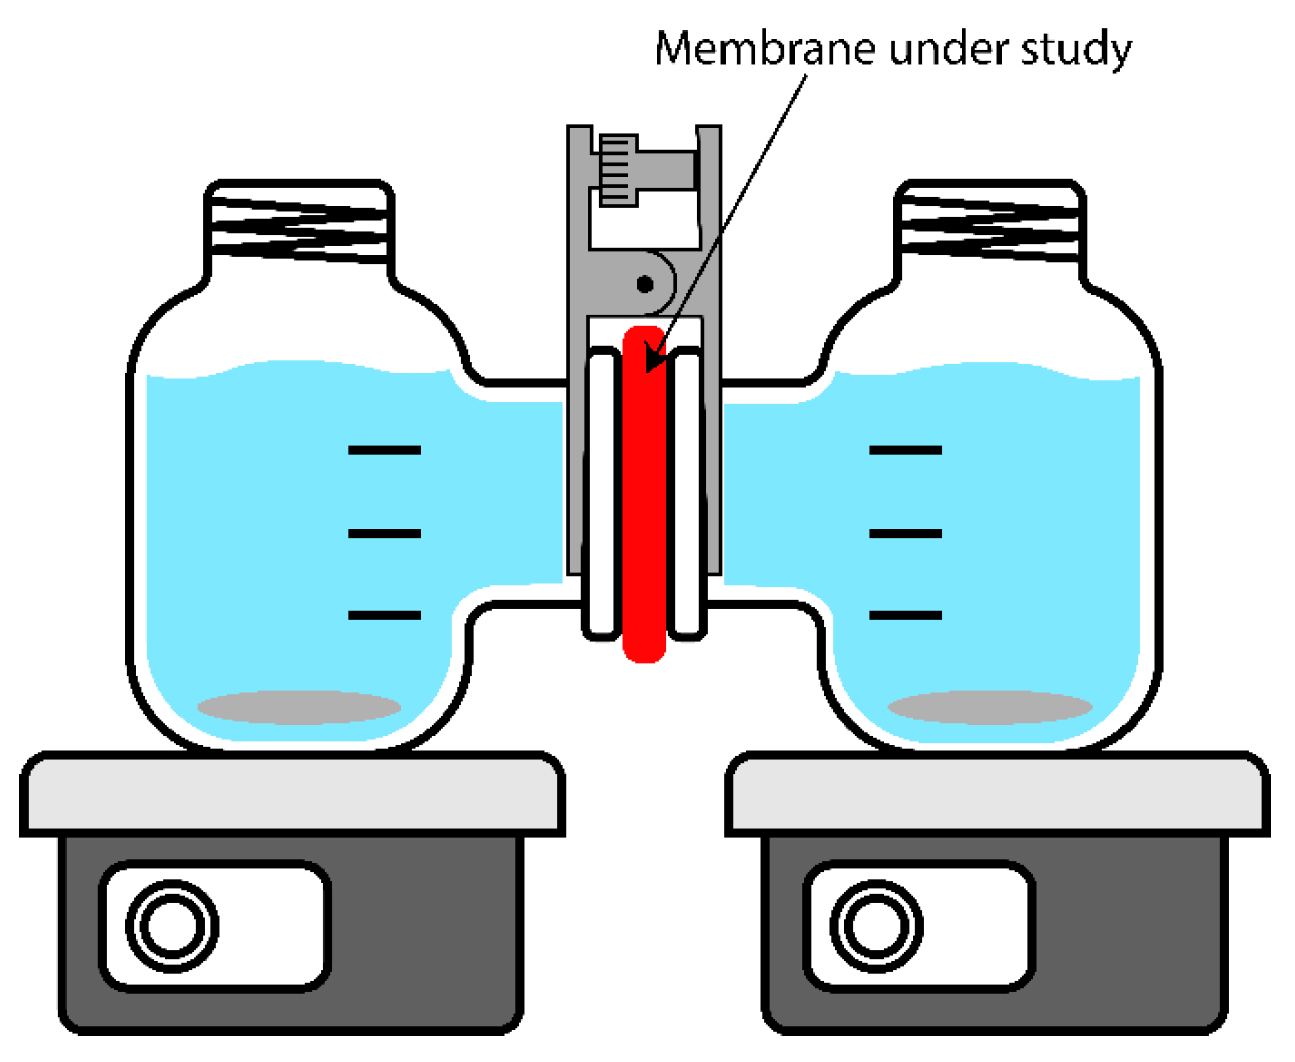
m)–potential difference measured with the help of two Ag/AgCl reference electrodes between two compartments of H-cell (MFC Reactor Device for 100 mL Microbial Fuel Cell) filled with 0.5 and 0.1 M NaCl solutions and separated by a membrane under study. The setup scheme is shown in
Figure 3. The solutions were actively stirred using magnetic stirrers; the experiment was carried out at room temperature. Correction on junction potential difference was made according to [
31]. Detailed calculation and methodology of determination of potentiometric transport are described in [
32].
The second parameter characterizing membrane permselectivity was sodium chloride diffusion permeability, which was measured by the rate of sodium chloride diffusion from the chamber with higher concentration into the chamber with pure water in the H-cell described above. Type II water and a conductometric sensor were placed in one chamber at the beginning of the experiment, and 0.1 M sodium chloride solution was placed in the second chamber. To find the sodium chloride flux, the time dependence of the conductivity of the solution was determined using a Jenway conductometer (3540, Cole-Parmer Ltd., Vernon Hills, IL, USA). The conductivity values were converted to concentration values using the calibration. The diffusion permeability coefficient was calculated using the following formula:
where dC/dt is the rate of increase of sodium chloride concentration in the chamber with pure water, V is the volume of solution in this chamber (140 mL), S is the active area of the membrane (6.97 cm
2), and C
0 is the sodium chloride concentration in the chamber with sodium chloride solution, the change of which did not exceed 1% during the experiment, therefore it was taken as a constant value of 0.1 M.
2.8. Membrane Voltammetric Characterization
To characterize membranes during the desalting process of sodium chloride solution, the current-voltage characteristics (CVC) of a laboratory electrodialysis cell built based on [
33,
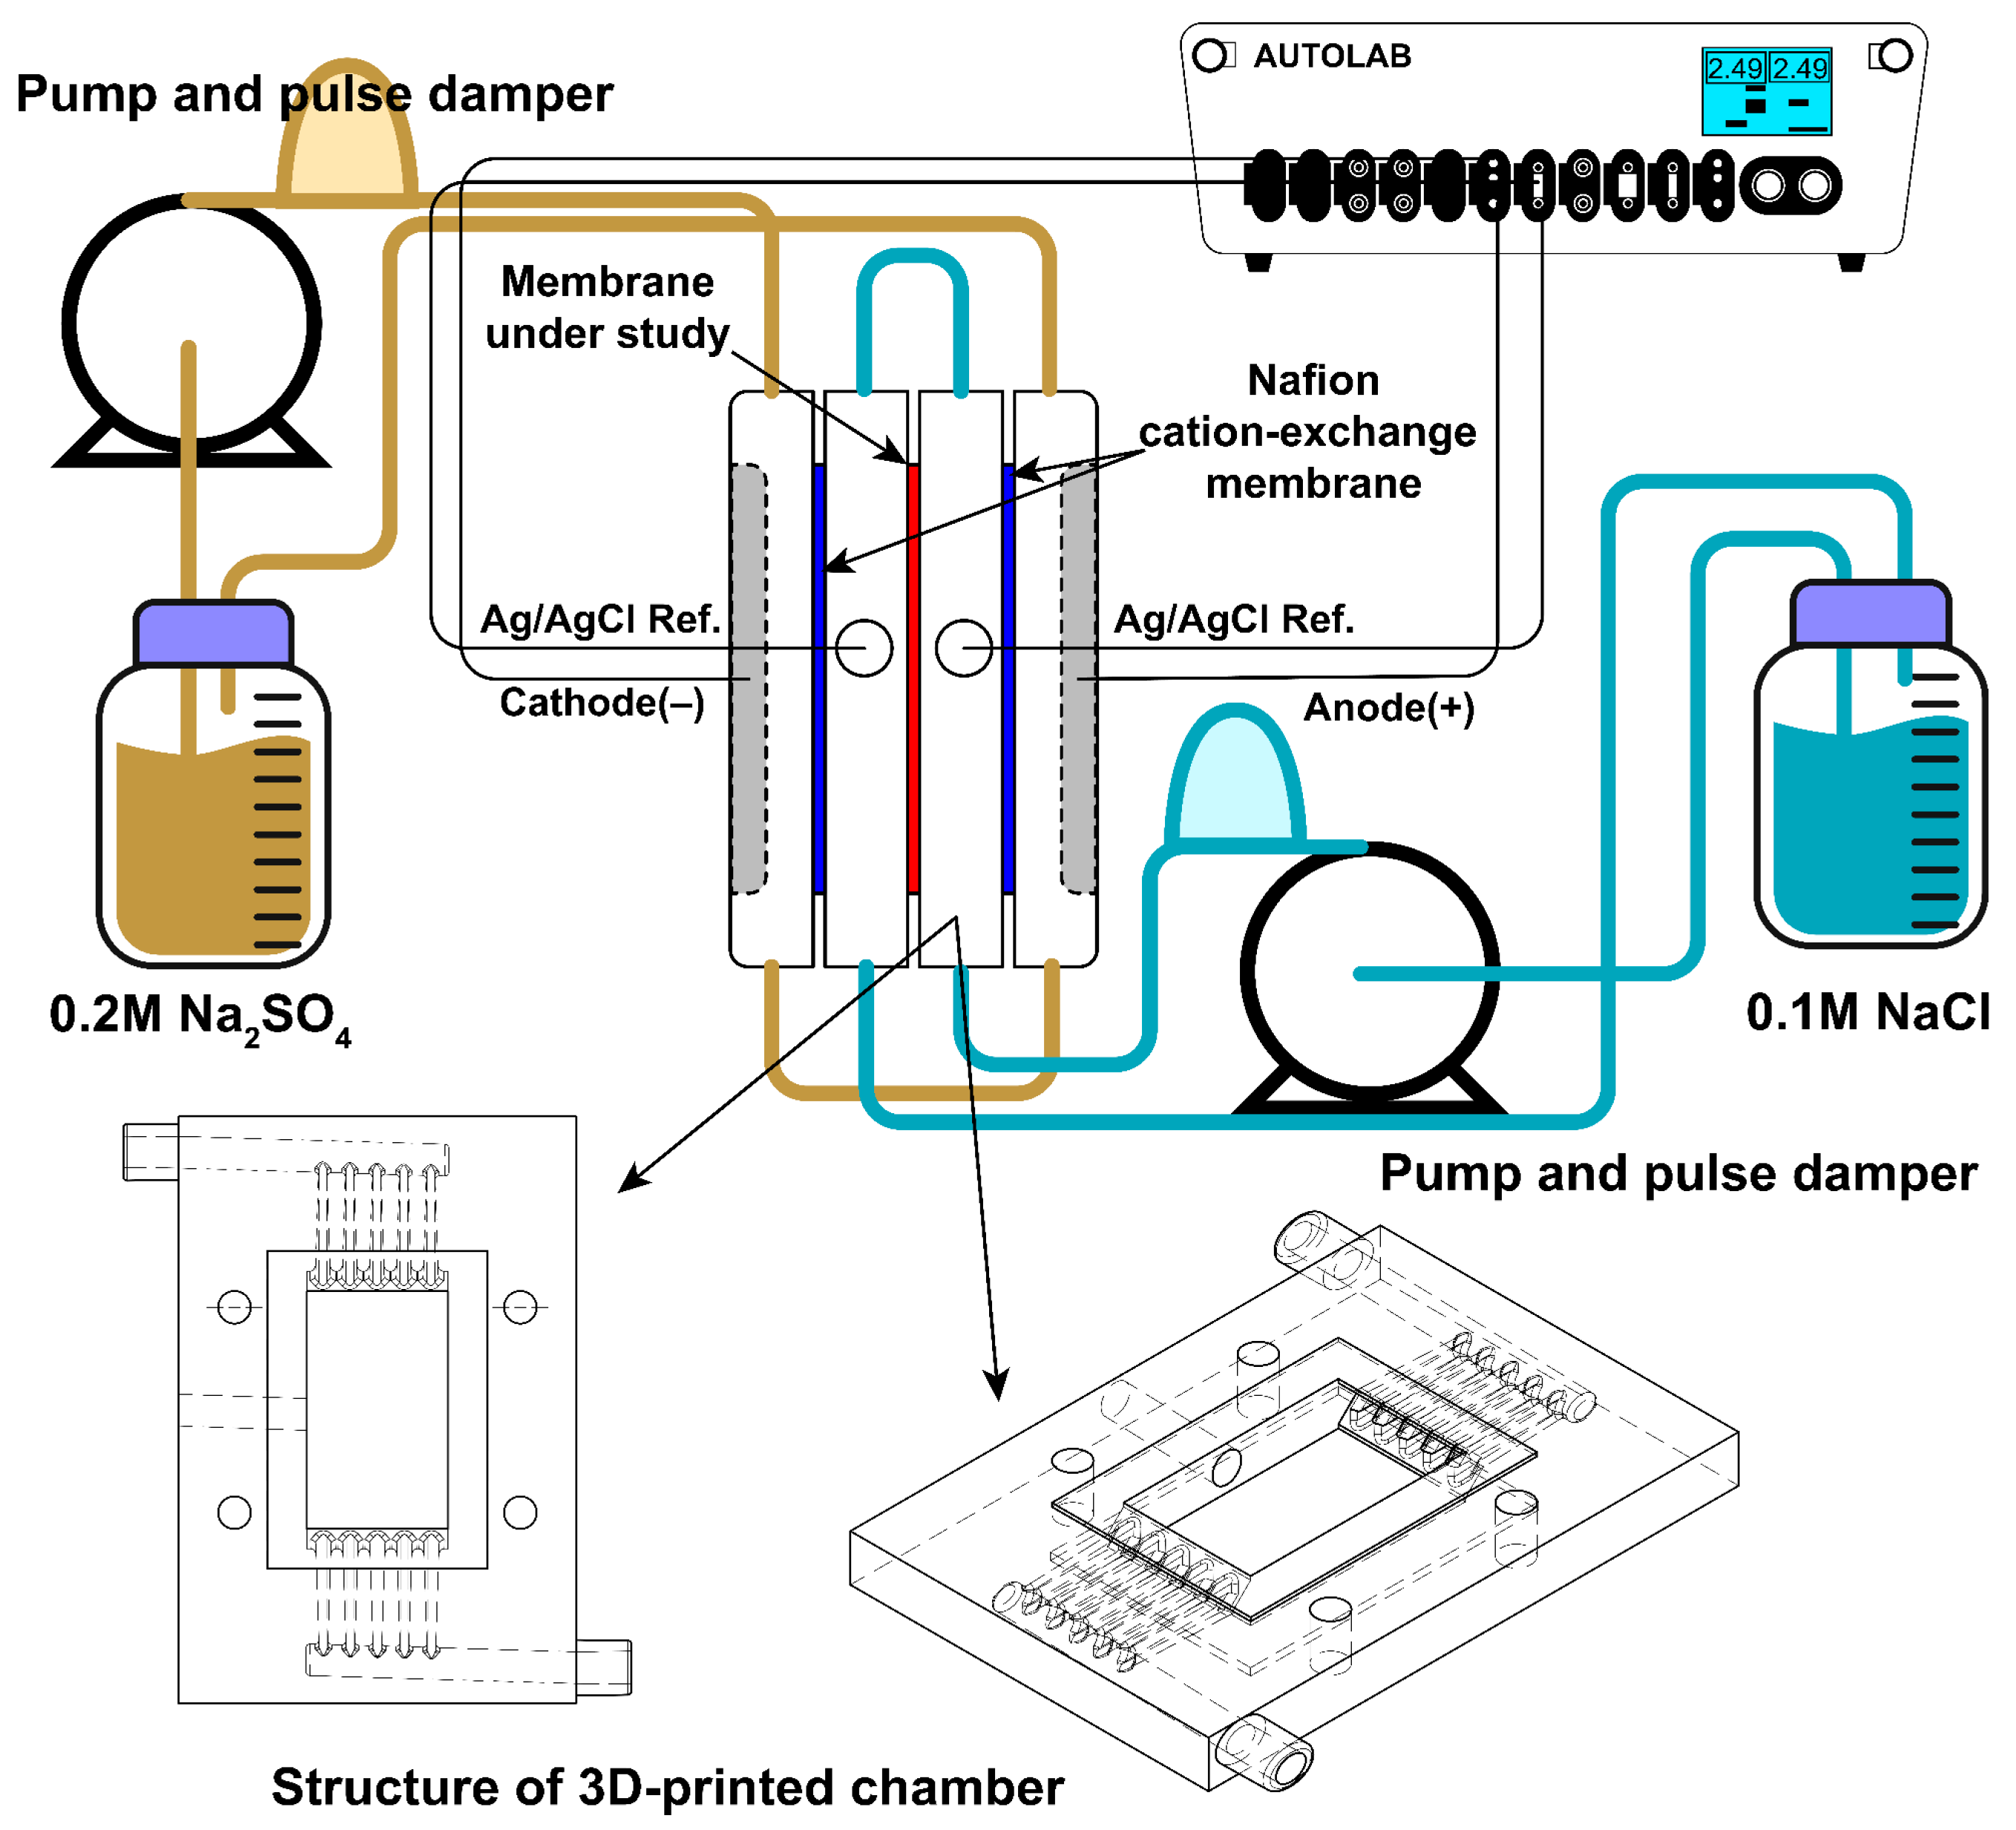
34] were studied. The setup scheme is represented in
Figure 4. The compartments are divided by membranes, consisting of a 3D-printed plastic compartment, and two cut silicone gaskets with an effective membrane area of 1.75 cm × 3.00 cm. 3D-printed plastic compartments were designed to provide uniform flow distribution and printed using a 3D printer (J750, Stratasys, Eden Prairie, MN, USA). 3D models used to print the cell compartment have been added to
supplementary data. The thickness of the compartment is 6 mm. The total thicknesses of silicone gaskets are 0.6 mm. Hence, the distance between the membranes (h) is about 6.6 mm. The compartments adjoining the membrane under study are separated from the electrode compartments by a Nafion© (Chemours company, Wilmington, DE, USA) cation-exchange membrane. Two platinum mesh electrodes were fixed in electrode compartments and used as cathode and anode for current polarization. Two silver/silver chloride electrodes (R0302, YPLZYANJIAO, China) with a diameter of 3.8 mm were inserted into compartments adjoining the membrane under study and were used to measure potential drop on the membrane. All compartments were pumped by peristaltic pumps (BT600FC, China), electrode and membrane compartments with 0.2 M sodium sulfate and 0.1 M sodium chloride with a flow rate of 300 mL/min and 50 mL/min, respectively. To provide laminar uniform solution flow, the Masterflex
® Pulse Dampeners for L/S
® and I/P
® Tubing, Avantor
® (VWR Inc., West Chester, PA, USA) were connected between the outlet of the pump and the inlet of the cell for both sodium chloride and sodium sulfate solutions. The latter is important to simplify the mathematical description of ion transport in the cell. A Potentiostat/Galvanostat Metrohm Autolab PGSTAT302N was used to measure CVC with a constant scan rate 5 × 10
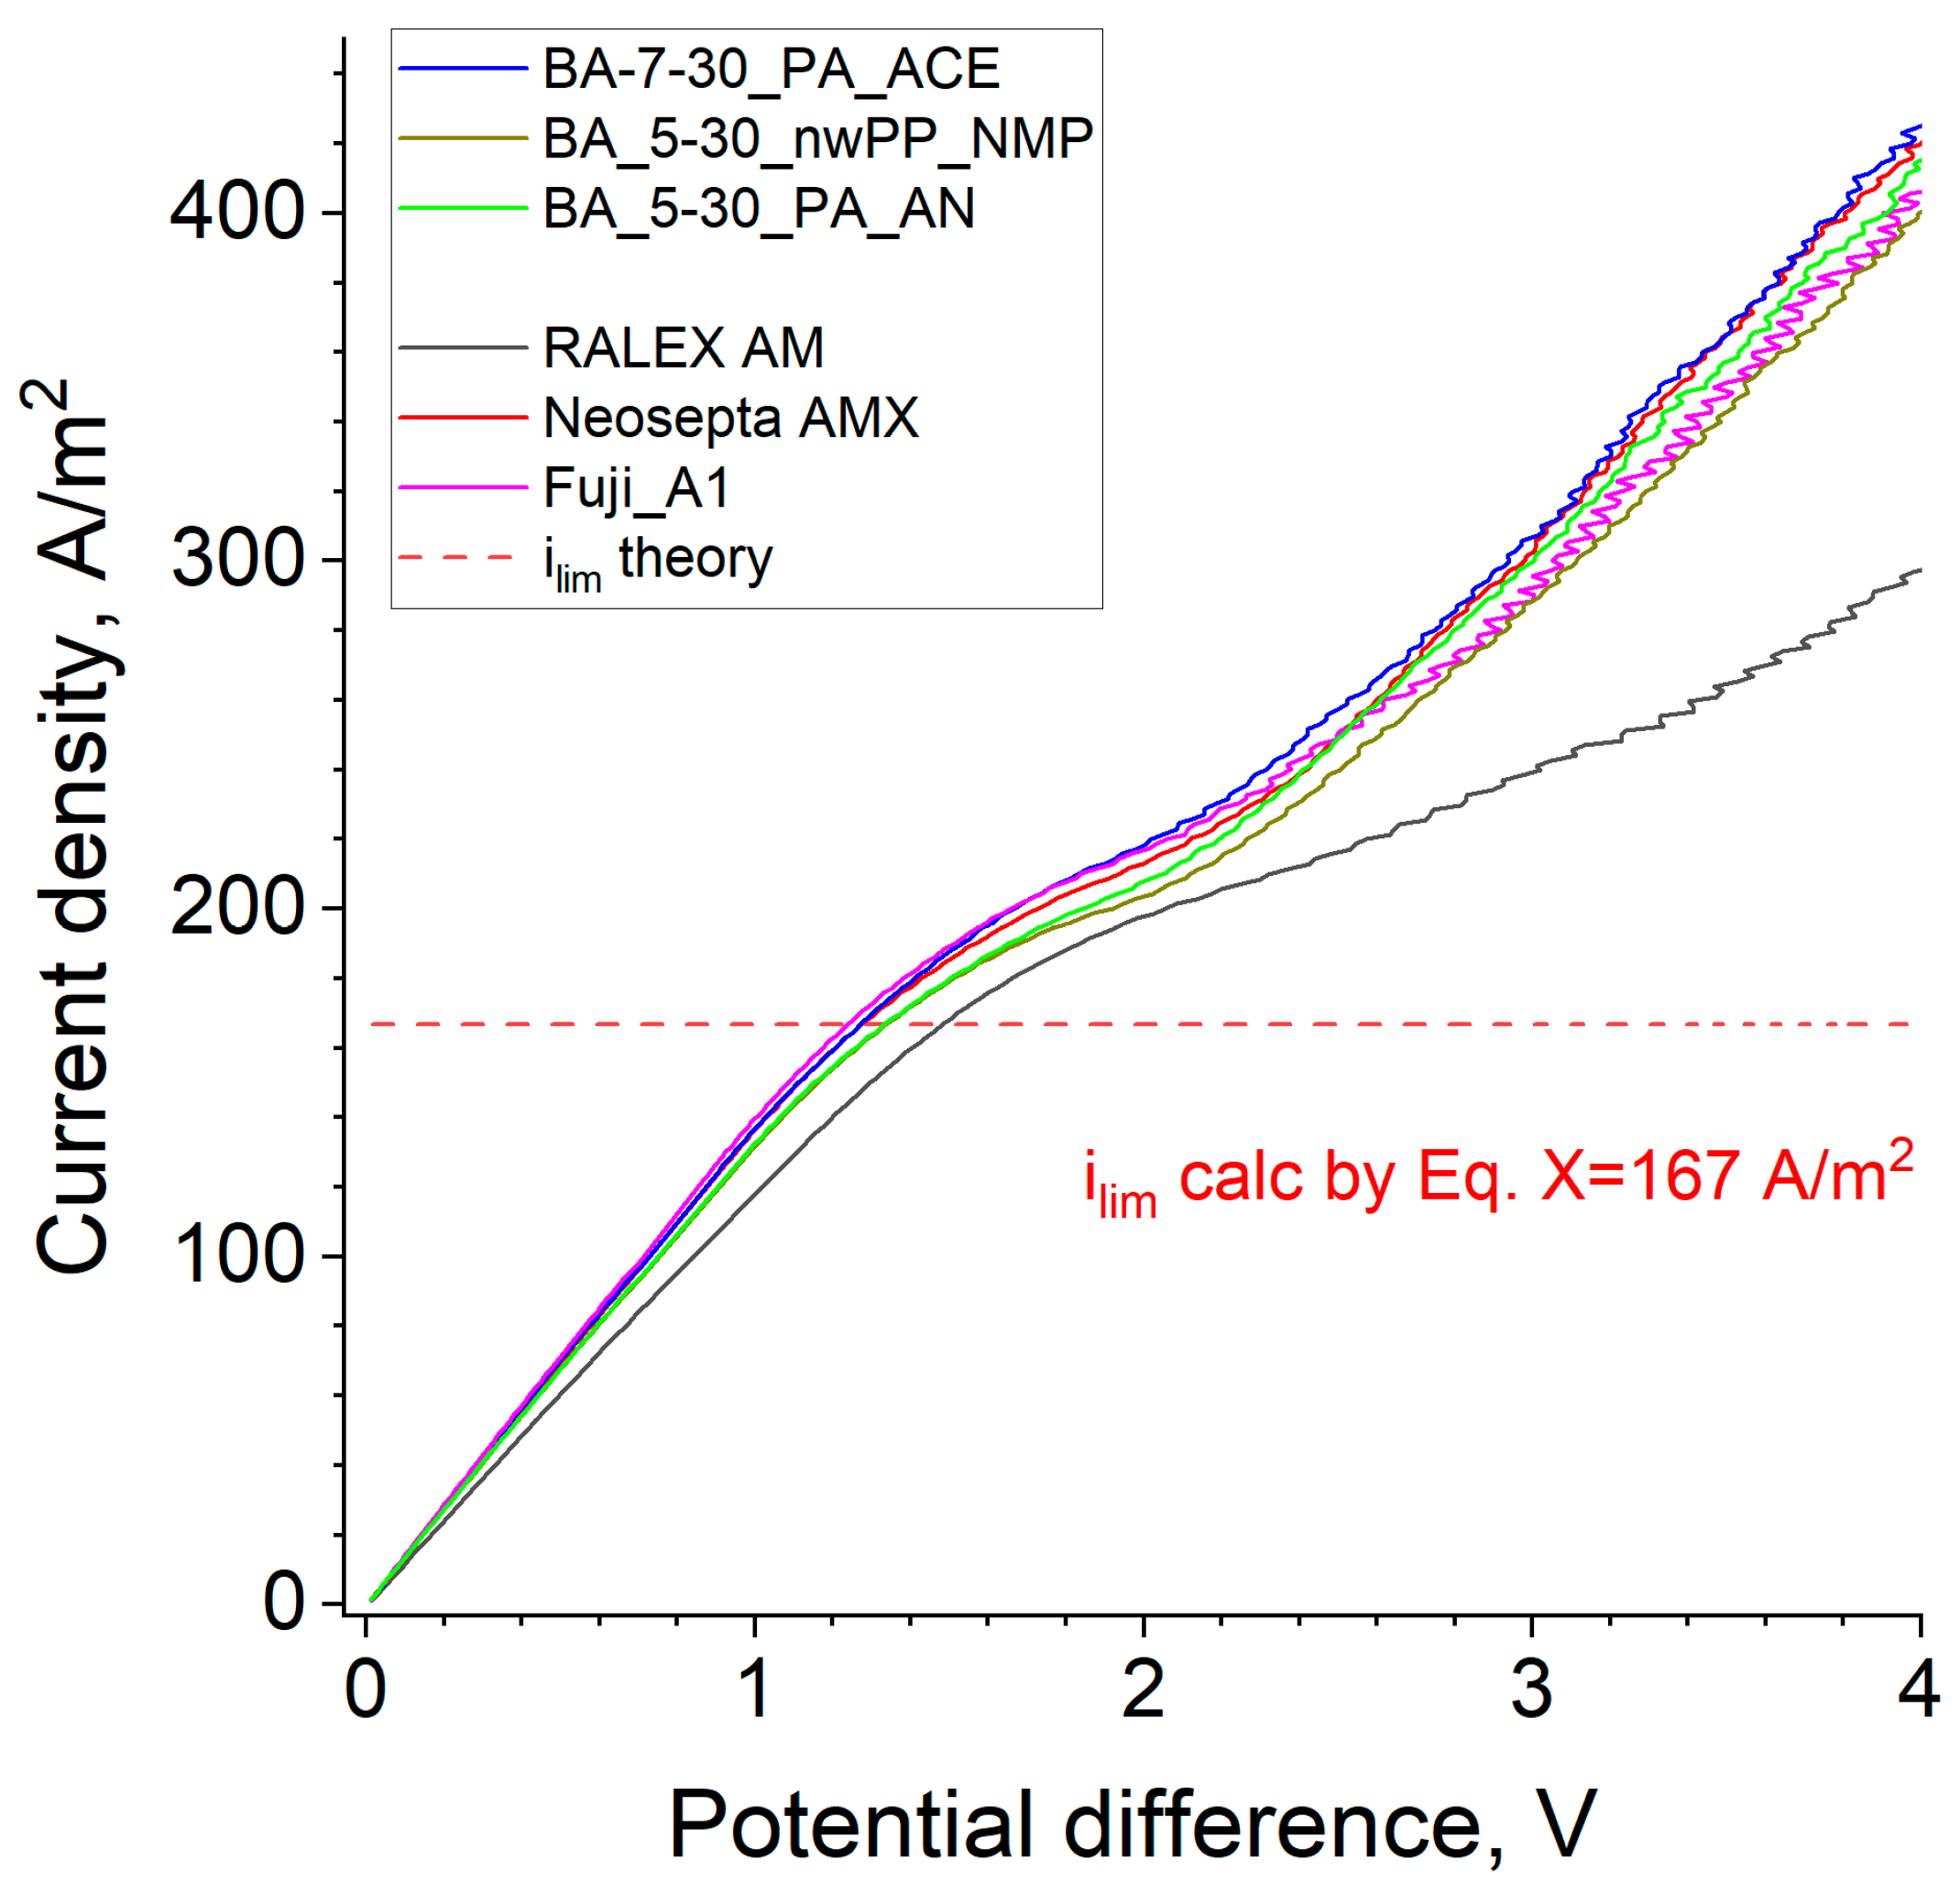
−4 A/s in the 0–4.0 V range.
To estimate the theoretical limiting current density, the following formula was used [
34]:
where D is the salt diffusion coefficient (1.65 × 10
−5 cm
2/s), c
0 the inlet concentration (0.1 M), h the distance between the membranes (0.66 cm), V the average linear solution velocity (0.72 cm/s), L the length of the membrane active area (3 cm), T
1 and t
1 the salt counter-ion effective transport number in the membrane (T
1 = 1.0) and the transport number in the solution (t
1 = 0.604), respectively, and F the Faraday constant (96,485 C/mole).
2.9. Diffusion Dialysis Acid Recovery
The diffusion dialysis experiment was also performed in the H-cell (
Figure 3). A solution containing 5% m/m HNO
3, 500 ppm Co (Co(NO
3)
2) and 500 ppm Zn (Zn(NO
3)
2) was poured into one of the chambers, and water was poured into the second chamber. In the chamber with pure water, conductivity was measured periodically using a conductometer. Conductivity values were converted to nitric acid concentration using the calibration dependence of the conductivity of nitric acid solutions on concentration. The contribution to the conductivity of cobalt and zinc salts was neglected because, firstly, their flux is at least ten times less than that of nitric acid. Secondly, the specific conductivity of nitric acid is an order of magnitude higher than the specific conductivity of Co(NO
3)
2 or Zn(NO
3)
2. The experiment was carried out for at least 30 min in the case of highly permeable membranes or until the conductivity increased to 2–3 mS/cm in the case of low permeability membranes. Typical time dependences of acid concentration are given in
Figure S1. Permeate was analyzed for cobalt and zinc content by ICP-MS spectrometry (Agilent 7800 ICP-MS connected with SPS 4 autosampler, Agilent Technologies, Santa Clara, CA, USA). Since the degree of dialysis was less than 5% of the initial value for all membranes, its change in the calculation of the permeability coefficient can be neglected, as well as the change in solution volumes. The acid permeability was calculated using a formula very similar to that for calculating the permeability of sodium chloride (7):
where dC
H/dt is the rate of acid concentration growth in the chamber with pure water, V is the volume of water in this chamber (140 mL), S is the active area of the membrane (6.97 cm
2), C
0 is the concentration of nitric acid in the feed solution, (0.794 M).
Metal permeability coefficients were estimated by the following formula, which differs from that in Equation (9) in that the rate of increase of metal concentration in this equation is calculated as the final concentration (C
M) divided by the time of experiment (t):
SH/Me selectivity coefficients were calculated as the ratio of PH/PMe permeability coefficients.


