
The Enrichment of Acetic Acid Using an Integrated Reverse Osmosis–Electrodialysis Process


Abstract
:1. Introduction
2. Experiment
2.1. Materials
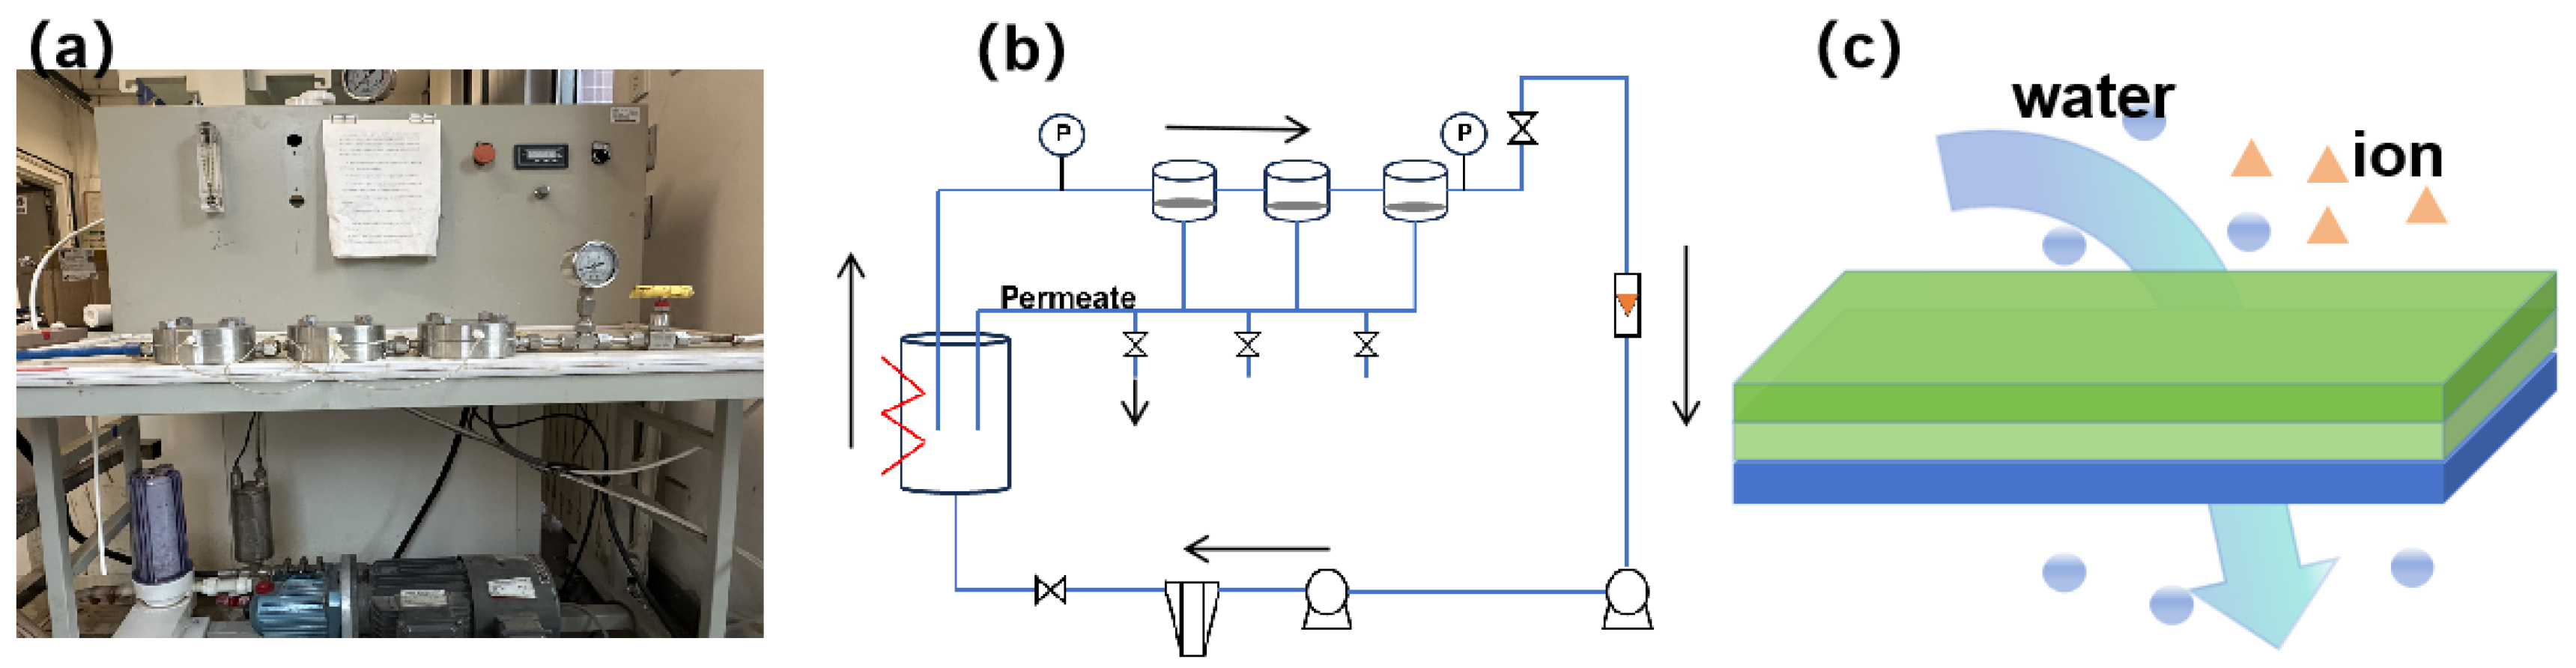
2.2. RO Experiment
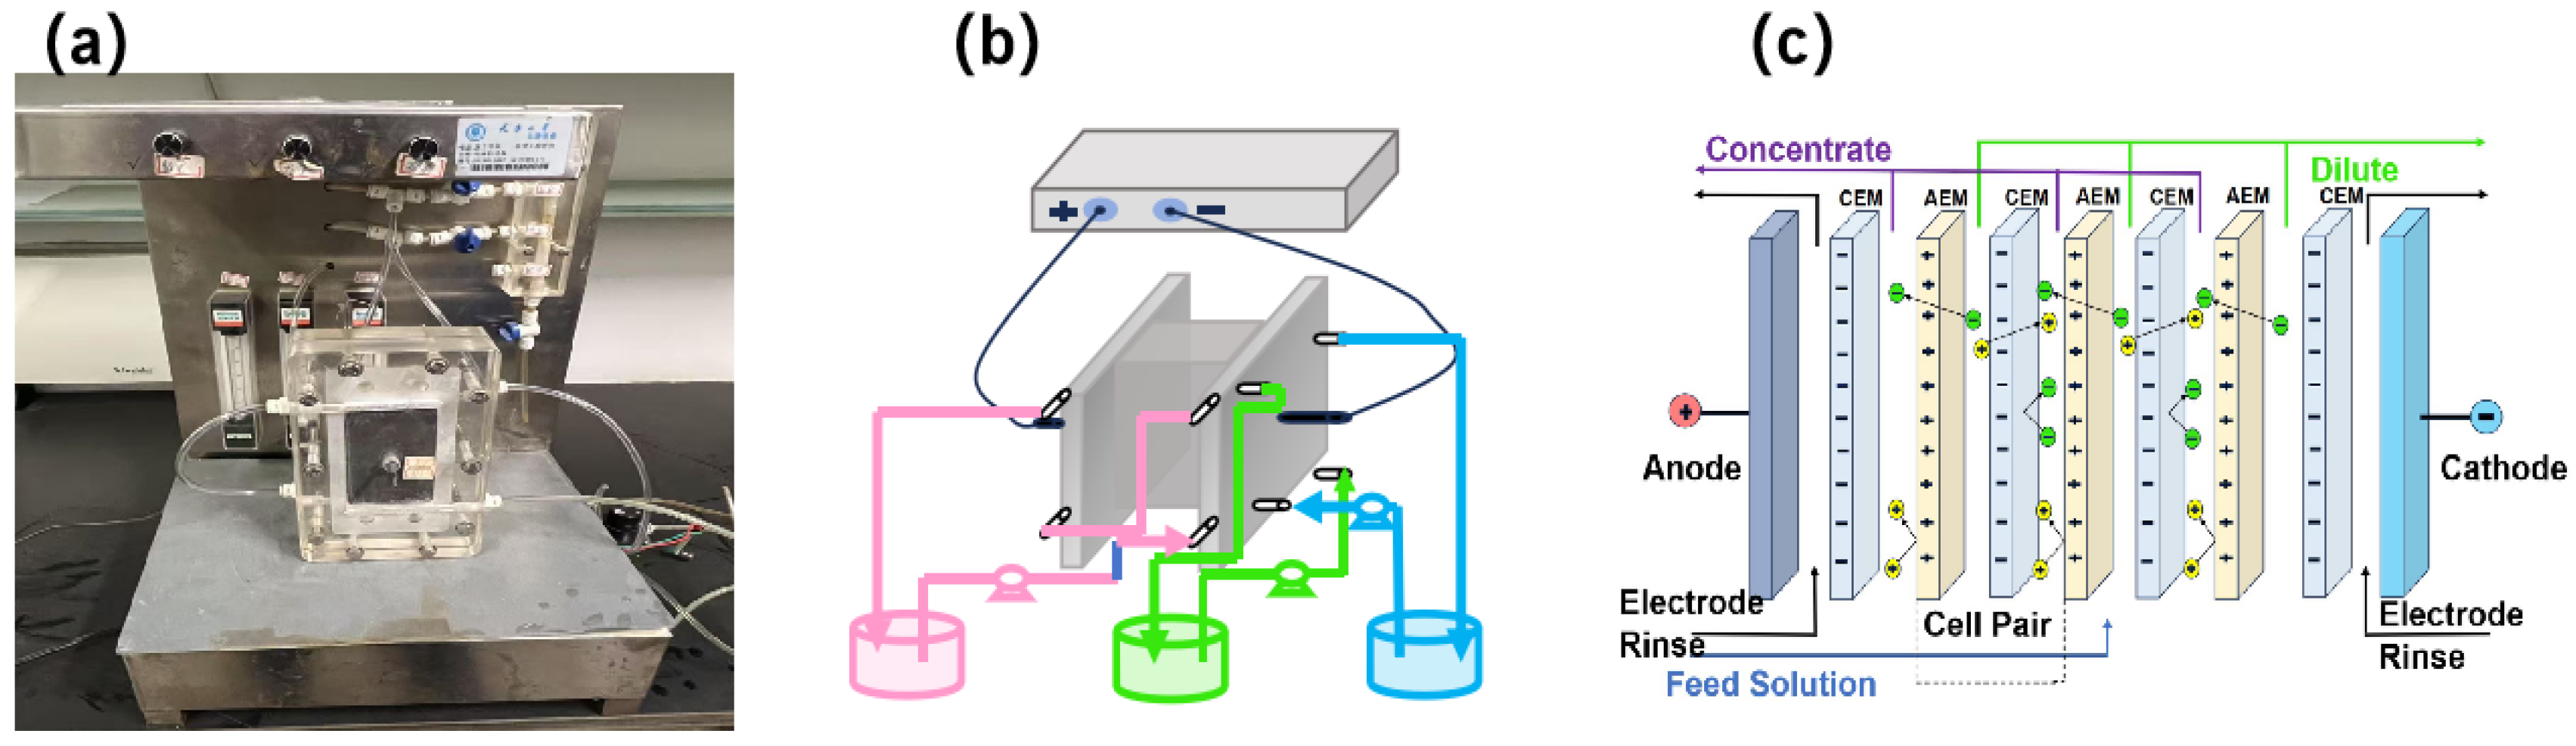
2.3. ED Experiment
2.4. Analytical Methods
2.4.1. Acid Concentration Analyses by Gas Chromatography
2.4.2. Membrane Characterization
3. Results and Discussion
3.1. Comparison of RO and ED Processes for HAc Enrichment
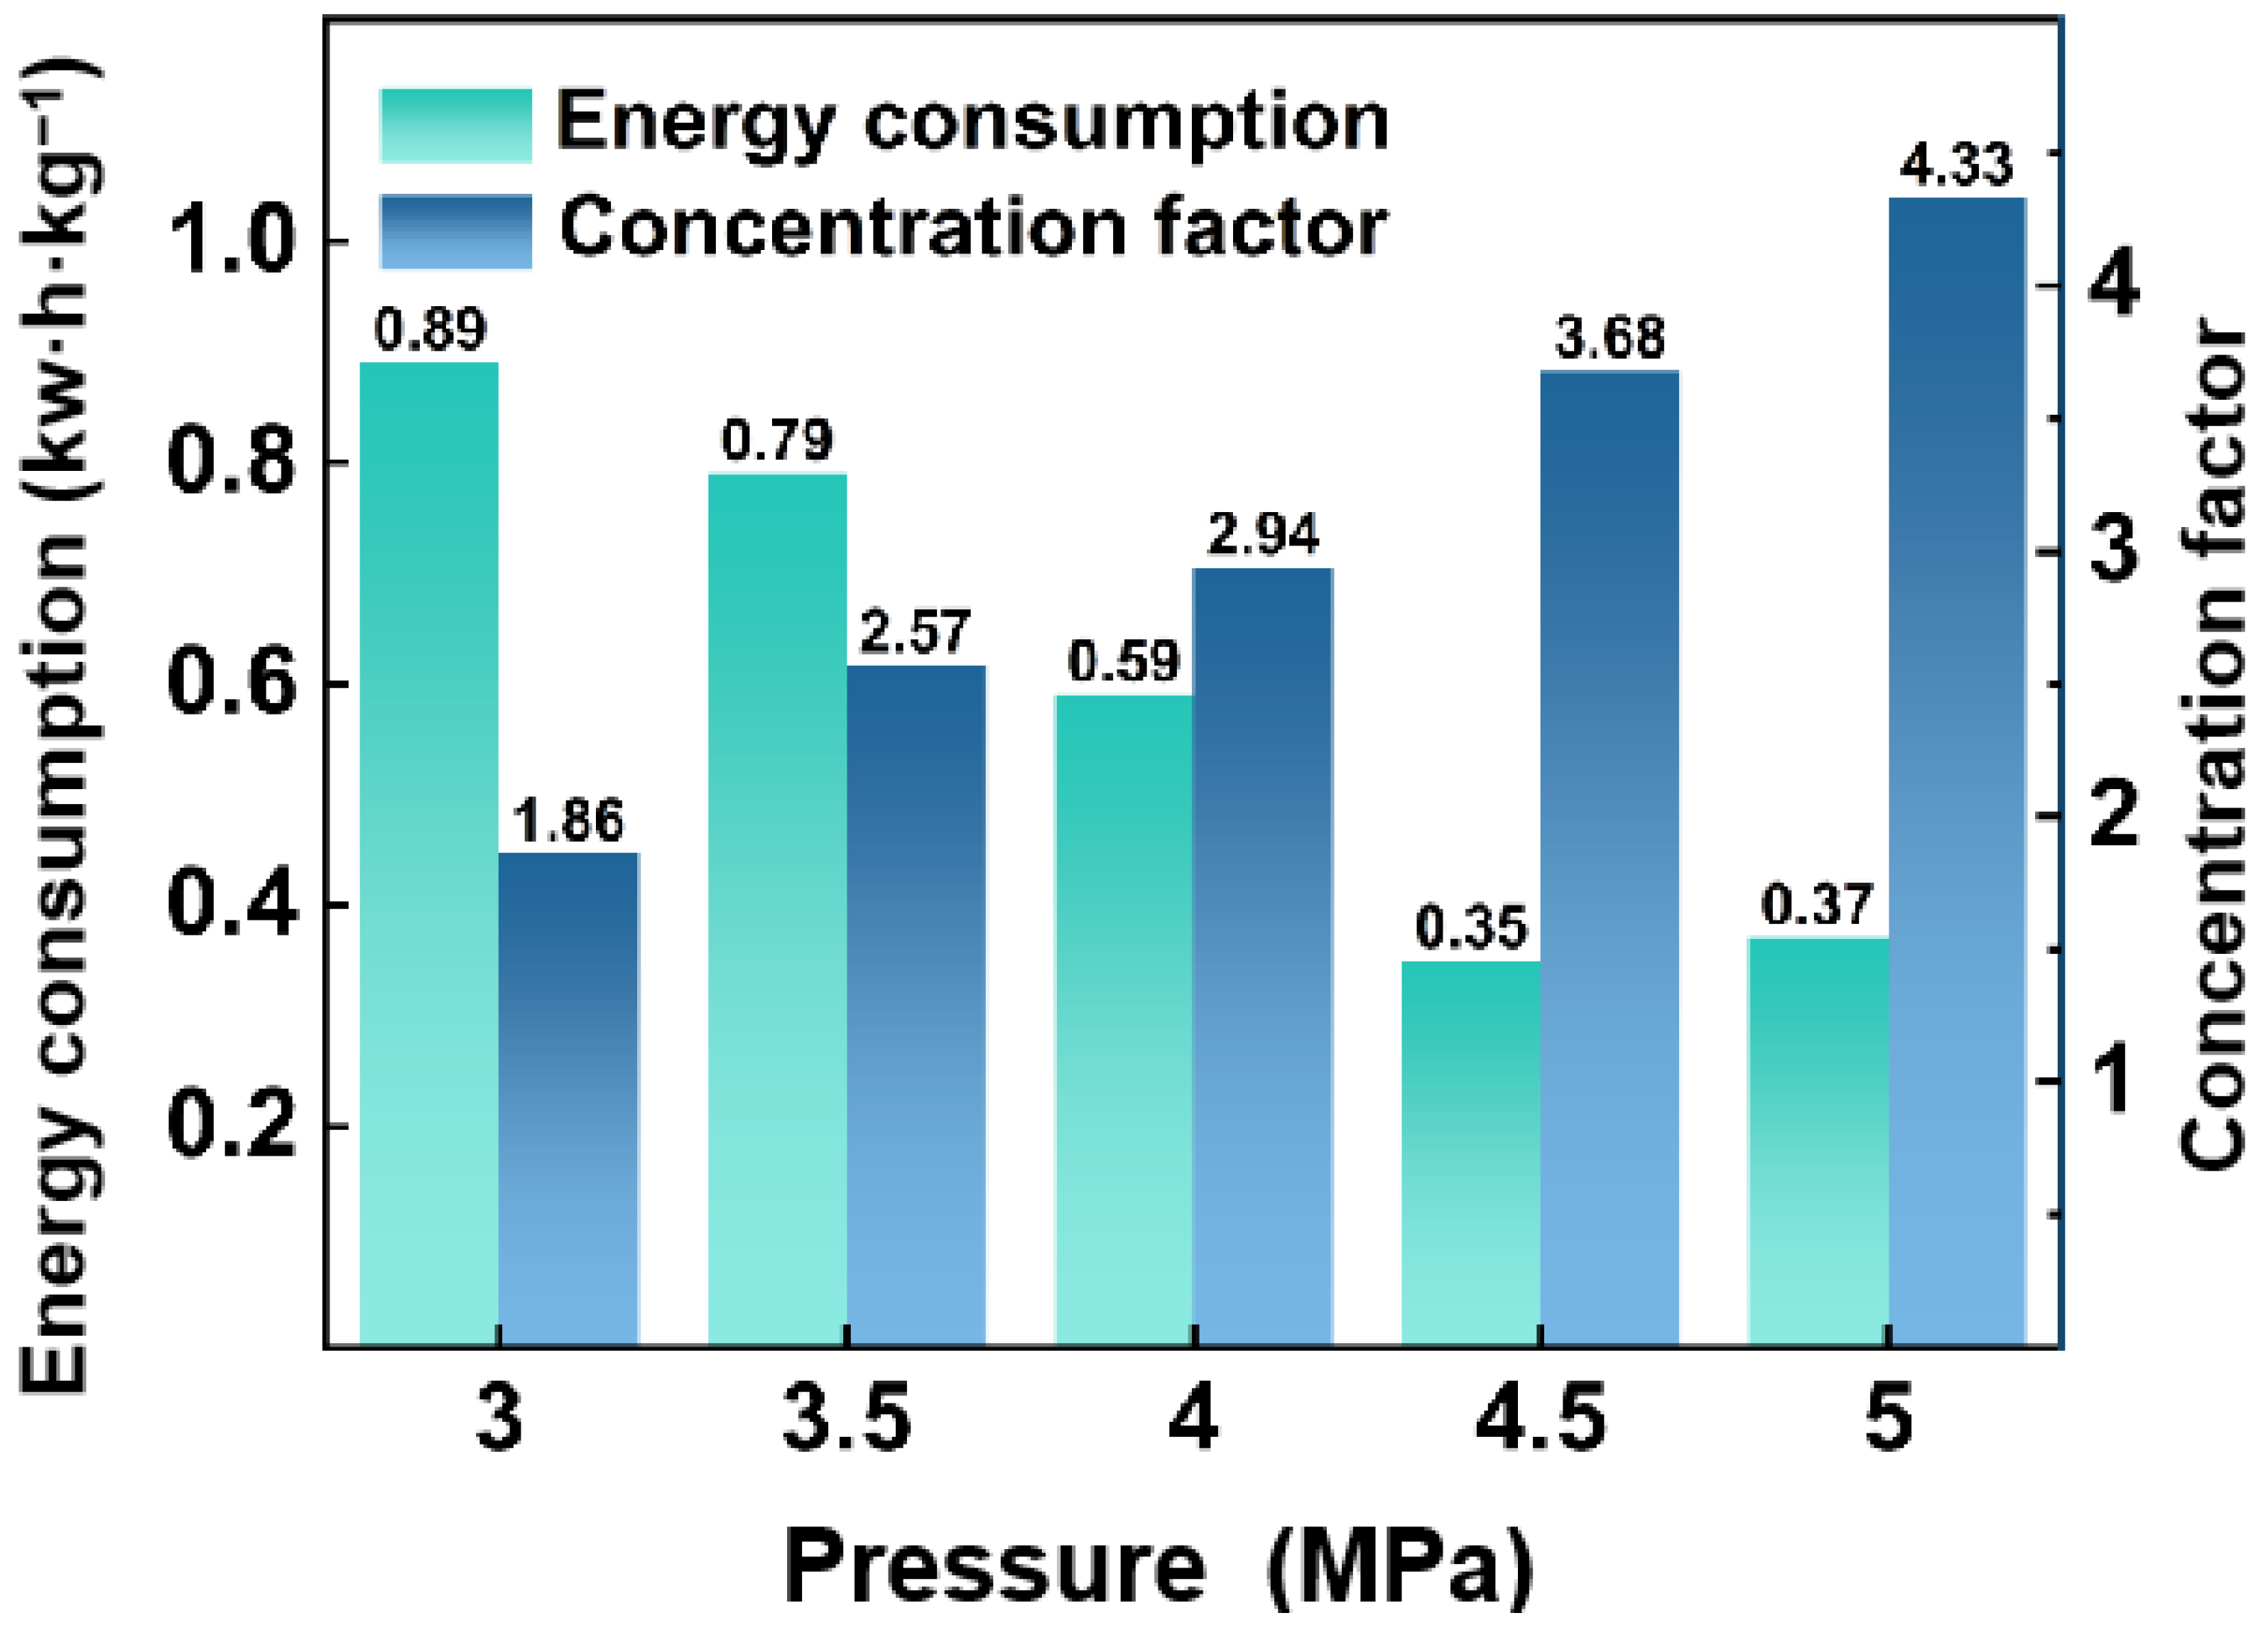
3.1.1. Effect of Operating Pressure on RO
3.1.2. The Effect of Voltage on ED
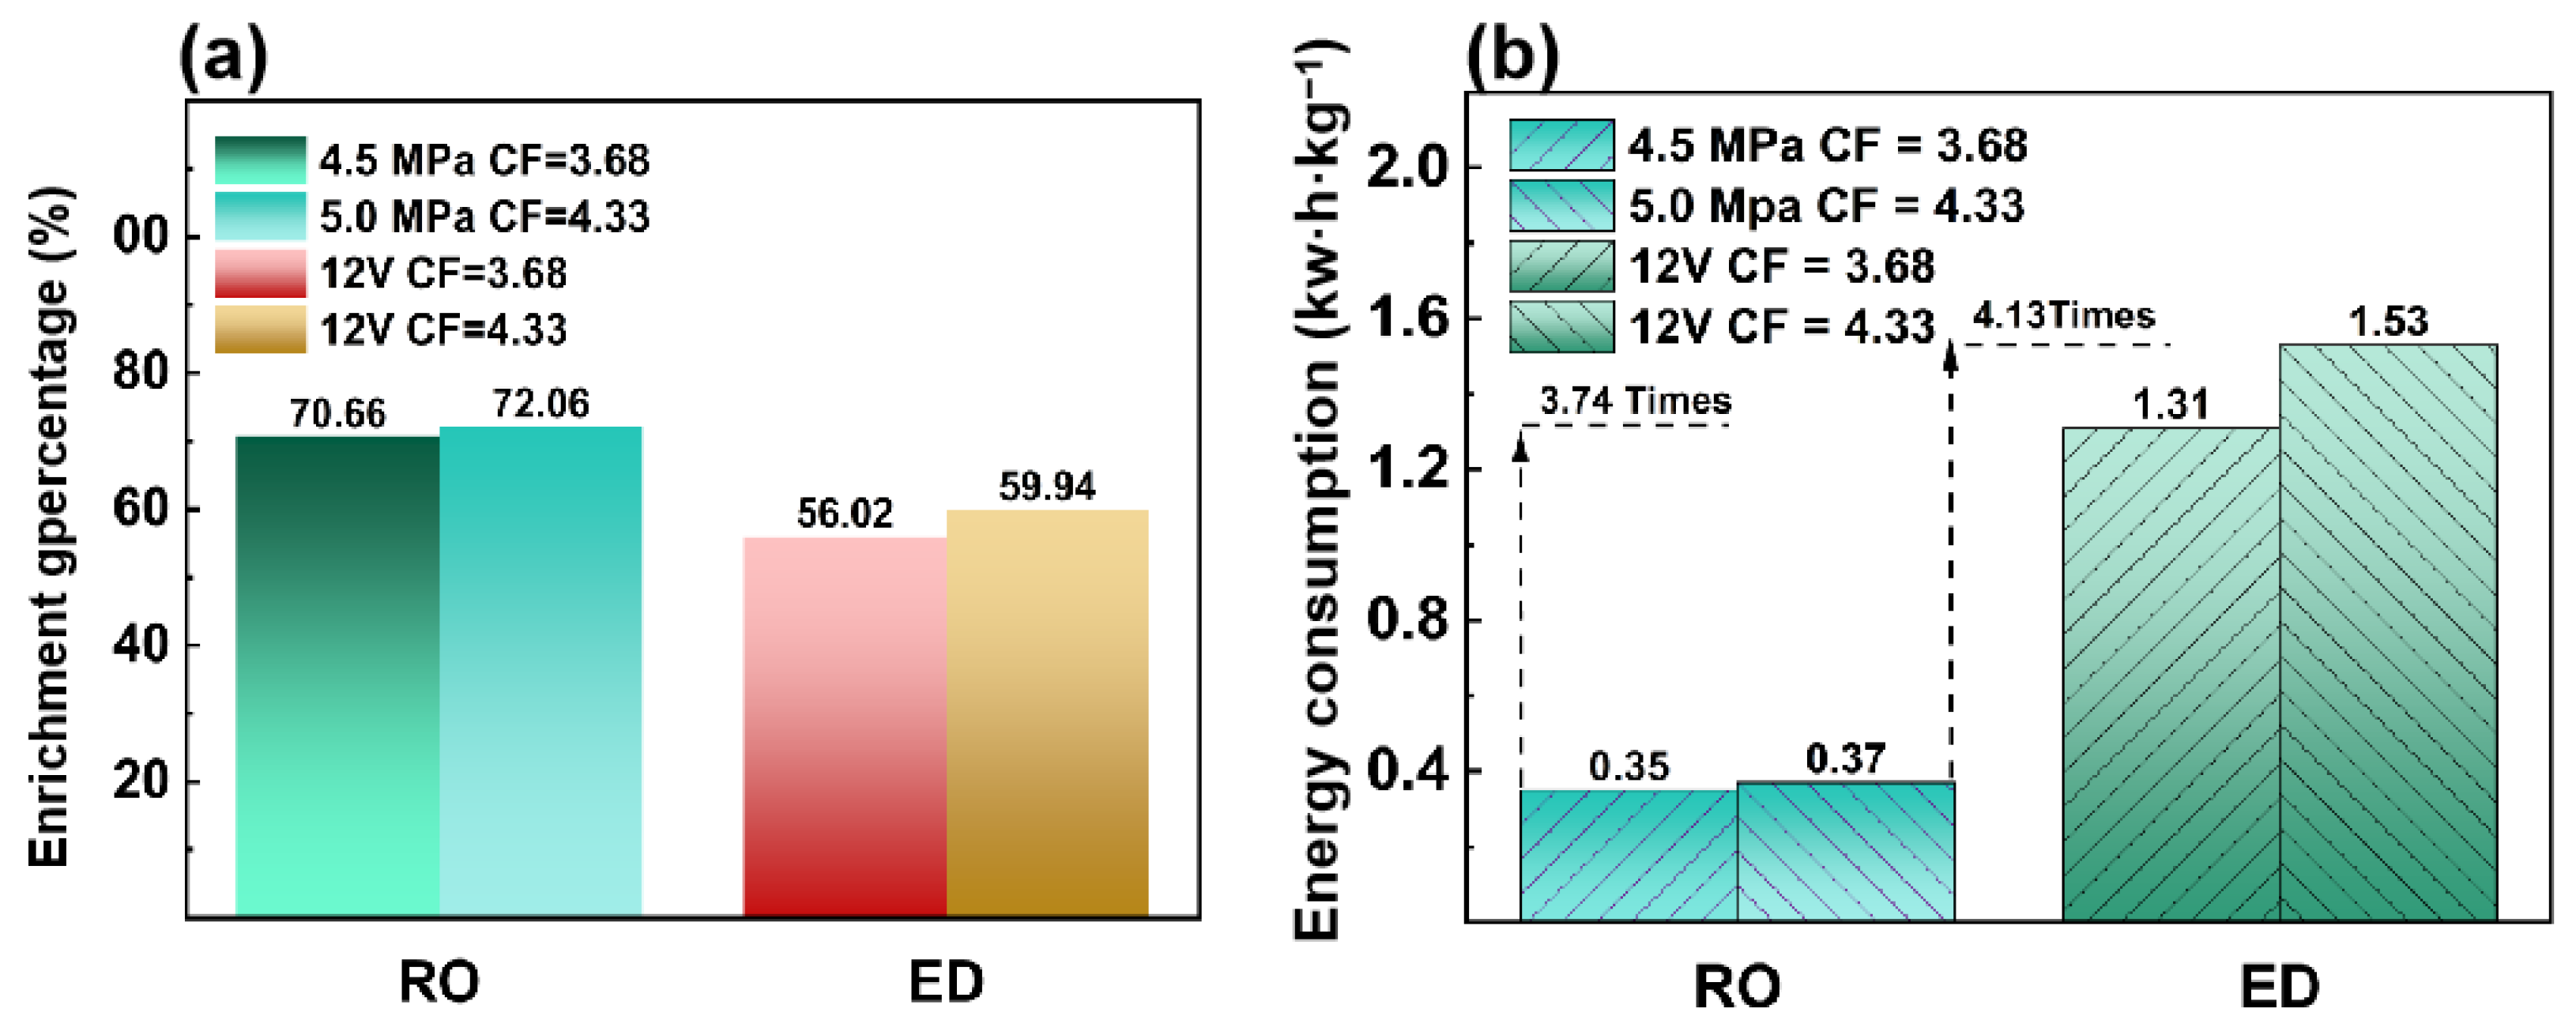
3.1.3. Comparison of Energy and Cost for HAc Enrichment
3.2. Operation Mode in the ED Process
3.2.1. Effect of Volume Ratio in the First ED Process
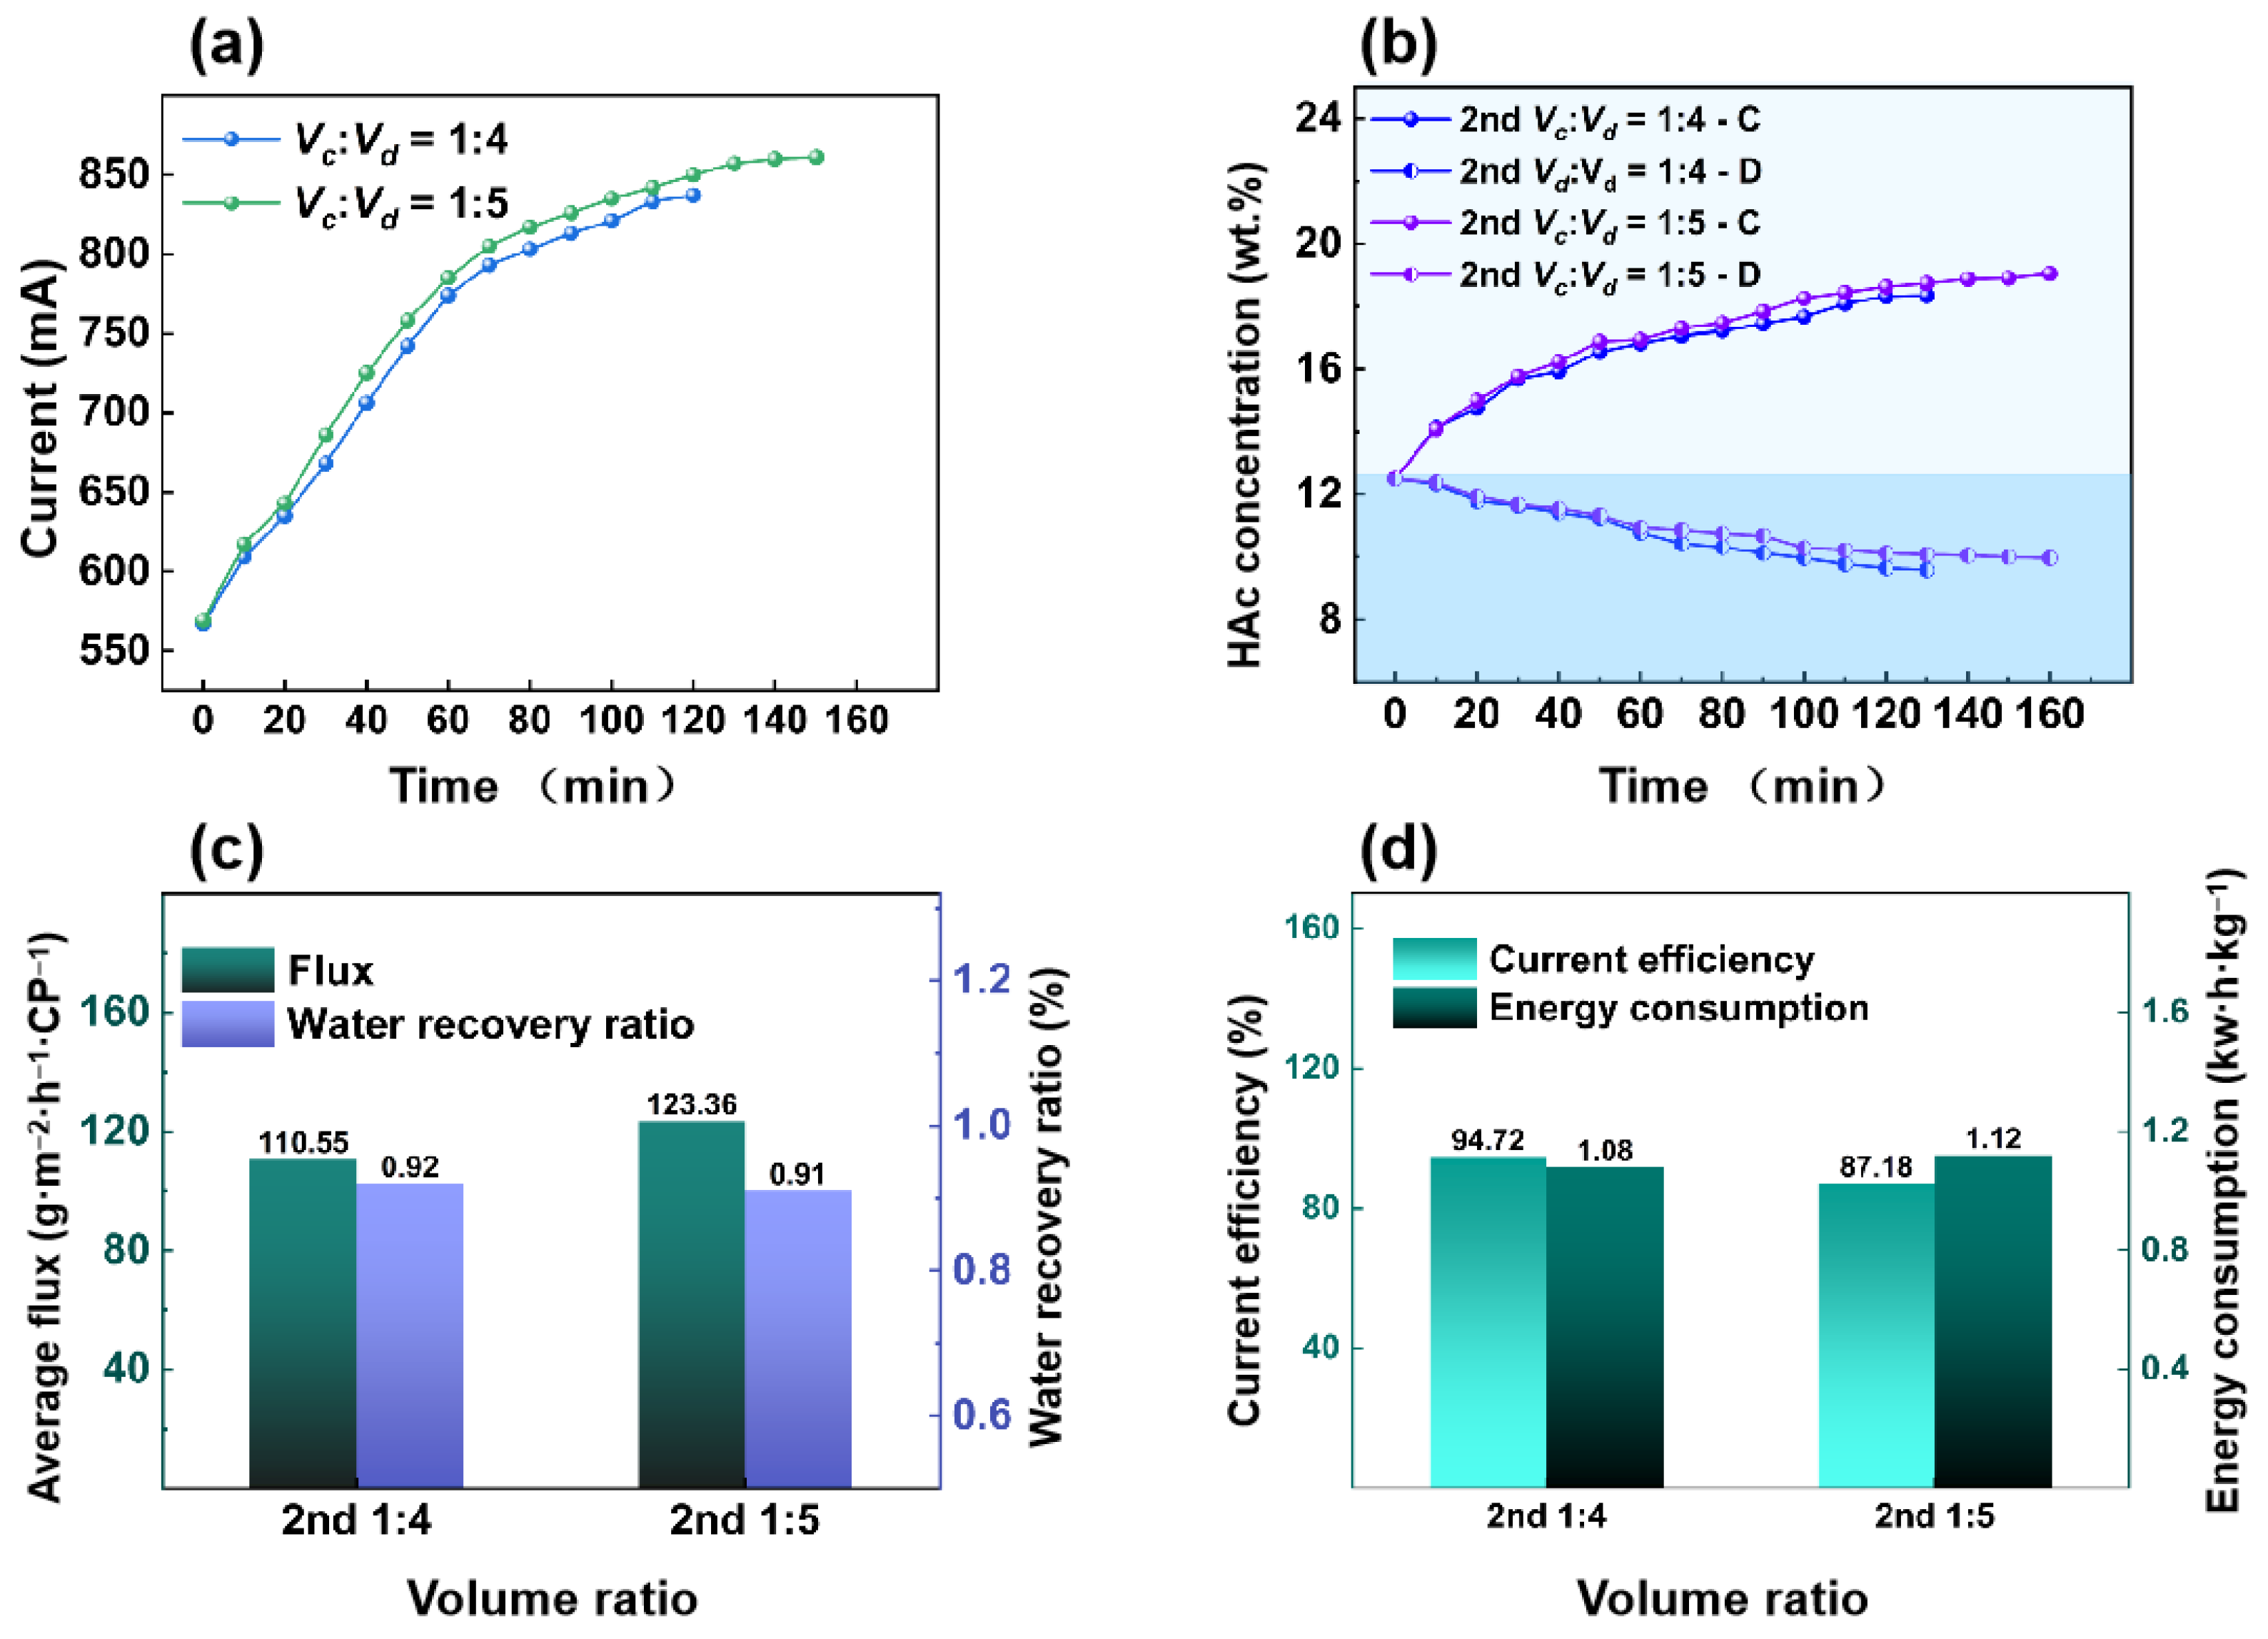
3.2.2. Effect of Volume Ratio in the Second ED Process
3.2.3. The Stability of Membrane
4. Conclusions
Supplementary Materials
Author Contributions
Funding
Institutional Review Board Statement
Data Availability Statement
Conflicts of Interest
References
- Knoche, S.; Heid, M.; Gora, N.; Ohlig, D.; Drochner, A.; Etzold, B.; Vogel, H. Mechanistic Study on the Selective Oxidation of Acrolein to Acrylic Acid concerning the Role of Water. ChemCatChem 2020, 12, 3560–3575. [Google Scholar] [CrossRef]
- González, C.; Pariente, M.I.; Molina, R.; Masa, M.O.; Espina, L.G.; Melero, J.A.; Martínez, F. Study of highly furfural-containing refinery wastewater streams using a conventional homogeneous Fenton process. J. Environ. Chem. Eng. 2021, 9, 104894. [Google Scholar] [CrossRef]
- Wang, Z.; Liu, Z.; Noor, R.S.; Cheng, Q.; Chu, X.; Qu, B.; Zhen, F.; Sun, Y. Furfural wastewater pretreatment of corn stalk for whole slurry anaerobic co-digestion to improve methane production. Sci. Total Environ. 2019, 674, 49–57. [Google Scholar] [CrossRef] [PubMed]
- Song, L.; Hu, J.Y.; Ong, S.L.; Ng, W.J.; Elimelech, M.; Wilf, M. Performance limitation of the full-scale reverse osmosis process. J. Membr. Sci. 2003, 214, 239–244. [Google Scholar] [CrossRef]
- Singh, A.; Tiwari, A.; Mahajani, S.M.; Gudi, R.D. Recovery of acetic acid from aqueous solutions by reactive distillation. Ind. Eng. Chem. Res. 2006, 45, 2017–2025. [Google Scholar] [CrossRef]
- Gangadwala, J.; Radulescu, G.; Kienle, A.; Steyer, F.; Sundmacher, K. New processes for recovery of acetic acid from waste water. Clean Technol. Environ. Policy 2008, 10, 245–254. [Google Scholar] [CrossRef]
- Pal, P.; Nayak, J. Acetic Acid Production and Purification: Critical Review Towards Process Intensification. Sep. Purif. Rev. 2017, 46, 44–61. [Google Scholar] [CrossRef]
- Tao, D.; Xianjie, Z.; Chengyi, Z.; Yuxin, W.; Wen, Z. Constructing proton selective pathways using MOFs to enhance acid recovery efficiency of anion exchange membranes. Chem. Eng. J. 2022, 445, 136752. [Google Scholar]
- Li, X.; Huimin, W.; Luofu, M.; Wei, X.; Wen, Z. Poly (aryl piperidinium) anion exchange membranes for acid recovery: The effect of backbone structure. Sep. Purif. Technol. 2023, 312, 123396. [Google Scholar]
- Arif, H.; Haiyang, Y.; Noor, U.A.; Huangying, W.; Junying, Y.; Chenxiao, J.; Yaoming, W.; Tongwen, X. Acid recovery from molybdenum metallurgical wastewater via selective electrodialysis and nanofiltration. Sep. Purif. Technol. 2022, 295, 121318. [Google Scholar]
- Zhou, F.; Wang, C.; Wei, J. Separation of acetic acid from monosaccharides by NF and RO membranes: Performance comparison. J. Membr. Sci. 2013, 429, 243–251. [Google Scholar] [CrossRef]
- Haoran, W.; Lauren, V.; Sean, R.; Mark, H.; Meltem, U.D. Performance Characterization of Nanofiltration, Reverse Osmosis, and Ion Exchange Technologies for Acetic Acid Separation. Sep. Purif. Technol. 2020, 265, 118108. [Google Scholar]
- Teella, A.; Huber, G.W.; Ford, D.M. Separation of acetic acid from the aqueous fraction of fast pyrolysis bio-oils using nanofiltration and reverse osmosis membranes. J. Membr. Sci. 2011, 378, 495–502. [Google Scholar] [CrossRef]
- Liu, Q.; Xie, L.; Du, H.; Xu, S.; Du, Y. Study on the Concentration of Acrylic Acid and Acetic Acid by Reverse Osmosis. Membranes 2020, 10, 142. [Google Scholar] [CrossRef]
- Qiao, Y.; Xu, S.; Wu, Y.; Zhang, L.; Xie, L. Dehydration of Organic Solvents from Ternary Mixtures Containing Toluene/Methanol/Water by Pervaporation. Membranes 2024, 14, 139. [Google Scholar] [CrossRef]
- Al-ghezawi, N.; Sanlı, O.; Isıklan, N. Permeation and Separation Characteristics of Acetic Acid-Water Mixtures by Pervaporation through Acrylonitrile and Hydroxy Ethyl Methacrylate Grafted Poly(vinyl alcohol) Membrane. Sep. Sci. Technol. 2006, 41, 2913–2931. [Google Scholar] [CrossRef]
- Zhang, X.; Li, C.; Wang, Y.; Luo, J.; Xu, T. Recovery of acetic acid from simulated acetaldehyde wastewaters: Bipolar membrane electrodialysis processes and membrane selection. J. Membr. Sci. 2011, 379, 184–190. [Google Scholar] [CrossRef]
- Yu, L.; Guo, Q.; Hao, J.; Jiang, W. Recovery of acetic acid from dilute wastewater by means of bipolar membrane electrodialysis. Desalination 2000, 129, 283–288. [Google Scholar] [CrossRef]
- Du, H.; Xie, L.; Liu, J.; Xu, S. Concentration of mixed acid by electrodialysis for the intensification of absorption process in acrylic acid production. Chin. J. Chem. Eng. 2020, 36, 10–18. [Google Scholar] [CrossRef]
- Madzingaidzo, L.; Danner, H.; Braun, R. Process development and optimisation of lactic acid purification using electrodialysis. J. Biotechnol. 2002, 96, 223–239. [Google Scholar] [CrossRef]
- Ikegami, T.; Negishi, H.; Sakaki, K. Selective separation of n-butanol from aqueous solutions by pervaporation using silicone rubber-coated silicalite membranes. J. Chem. Technol. Biotechnol. 2011, 86, 845–851. [Google Scholar] [CrossRef]
- Olives, P.; Ramos, C.; Roda, I.R.; Margarit, J.; Carbonell, S.; Blandin, G. Simultaneous high volatile fatty acids concentration and ethanol extraction using nanofiltration, reverse osmosis and forward osmosis. Process Saf. Environ. Prot. 2025, 197, 106954. [Google Scholar] [CrossRef]
- Jia, Y.-X.; Li, F.-J.; Chen, X.; Wang, M. Model analysis on electrodialysis for inorganic acid recovery and its experimental validation. Sep. Purif. Technol. 2018, 190, 261–267. [Google Scholar] [CrossRef]
- Qiu, Y.; Ruan, H.; Tang, C.; Yao, L.; Shen, J.; Sotto, A. Study on Recovering High-Concentration Lithium Salt from Lithium-Containing Wastewater Using a Hybrid Reverse Osmosis (RO)–Electrodialysis (ED) Process. ACS Sustain. Chem. Eng. 2019, 7, 13481–13490. [Google Scholar] [CrossRef]
- Li, Q.; Xie, L.; Xu, S.; Zhang, W. Comparison of Coagulation-Integrated Sand Filtration and Ultrafiltration for Seawater Reverse Osmosis Pretreatment. Membranes 2024, 14, 125. [Google Scholar] [CrossRef]
- Wang, M.-L.; Wang, J.-T.; Choong, Y.-M. Simultaneous quantification of methanol and ethanol in alcoholic beverage using a rapid gas chromatographic method coupling with dual internal standards. Food Chem. 2003, 86, 609–615. [Google Scholar] [CrossRef]
- Padaki, M.; Isloor, A.M.; Wanichapichart, P.; Ismail, A.F. Preparation and characterization of sulfonated polysulfone and N-phthloyl chitosan blend composite cation-exchange membrane for desalination. Desalination 2012, 298, 42–48. [Google Scholar] [CrossRef]
- Patel, S.K.; Lee, B.; Westerhoff, P.; Elimelech, M. The potential of electrodialysis as a cost-effective alternative to reverse osmosis for brackish water desalination. Water Research 2024, 250, 121009. [Google Scholar] [CrossRef]
- Filteau, G.; Moss, P. Ultra-low pressure RO membranes: An analysis of performance and cost. Desalination 1997, 113, 147–152. [Google Scholar] [CrossRef]
- Lee, G. Effects of operating parameters on the removal performance of electrodialysis for treating wastewater containing cadmium. Desalination Water Treat. 2011, 35, 150–157. [Google Scholar] [CrossRef]
- Singh, A.K.; Kumar, S.; Bhushan, M.; Shahi, V.K. High performance cross-linked dehydro-halogenated poly (vinylidene fluoride- co -hexafluoro propylene) based anion-exchange membrane for water desalination by electrodialysis. Sep. Purif. Technol. 2020, 234, 116078. [Google Scholar] [CrossRef]
- Li, H.; Dong, J.; Yang, J.; Liu, R.; Ren, X.; Che, X. Anion Exchange Membranes Based on Sulfonated Poly(ether ether ketone) Crosslinked Methylpyrrolidinium Functionalized Poly (vinyl benzyl chloride) with High Chemical Stability. J. Electrochem. Soc. 2019, 166, F1134–F1141. [Google Scholar] [CrossRef]


| SW30-4040 | |
|---|---|
| Separation layer | Polyamide membrane |
| pH | 2~11 |
| Temperature (°C) | 10~40 |
| Maximum operating pressure (MPa) | 6.5 |
| Maximum feed flow rate (L·h−1) | 3600 |
| CEM (CT-4) | AEM (ATD) | |
|---|---|---|
| Thickness (μm) | 70~80 | 70~8 0 |
| Water content (wt.%) | 20~25 | 20~25 |
| Transport number | ≥0.98 | ≥0.97 |
| IEC (mmol·g−1) | 0.9~1.1 | 0.9~1.1 |
| Area electric resistance (Ω·cm2) | 3.5~4.0 | 4.0~5.5 |
| pH | 0~14 | 0~14 |
| Temperature (°C) | 15~40 | 15~40 |
| DMR100 | |
|---|---|
| Thickness (μm) | 75 |
| Tensile strength (transverse/longitudinal) (MPa) | ≥30/30 |
| Elongation at break (transverse/longitudinal) (MPa) | ≥100/100 |
| Electrical conductivity (mS/cm) | ≥30 |
| Chemical durability/h (90 °C, 30% RH) | 800 |
| Hydrogen permeability (mL/min cm2) | ≤0.01 |
| Cost (ED) | Cost (RO) | |
|---|---|---|
| Energy cost | Energy cost | |
| Energy consumption (kW h/kg) | 1.53 | 0.37 |
| Electricity charge (CNY/(kW h)) | 0.70 | 0.70 |
| Energy consumption for peripheral equipment(pump) (CNY/kg) | 0.14 | / |
| Total energy cost (CNY/kg) | 0.067 | 0.015 |
| Investment cost | Investment cost | |
| Membrane life (year) | 3 | 2 |
| Membrane price (CNY/m2) | 1515.14 | 320 |
| Membrane cost (CNY) | 254.54 | 45.71 |
| Membrane stack cost (CNY) | 381.81 | 68.56 |
| Peripheral equipment cost (CNY) | 572.72 | 137.13 |
| Total fixed cost (CNY/year) | 318.18 | 102.85 |
| Total fixed cost (CNY/kg) | 0.18 | 0.058 |
| Total process cost (CNY/kg) | 0.25 | 0.069 |
| CEM | AEM | |||
|---|---|---|---|---|
| ED properties | Before use | After use | Before use | After use |
| Transport number | 0.98 | 0.96 | 0.93 | 0.90 |
| Ion exchange capacity (mmol·g−1) | 1.10 | 0.96 | 1.09 | 0.91 |
| Area electric resistance (Ω·cm2) | 3.3 | 3.6 | 2.0 | 2.4 |
Disclaimer/Publisher’s Note: The statements, opinions and data contained in all publications are solely those of the individual author(s) and contributor(s) and not of MDPI and/or the editor(s). MDPI and/or the editor(s) disclaim responsibility for any injury to people or property resulting from any ideas, methods, instructions or products referred to in the content. |
© 2025 by the authors. Licensee MDPI, Basel, Switzerland. This article is an open access article distributed under the terms and conditions of the Creative Commons Attribution (CC BY) license (https://creativecommons.org/licenses/by/4.0/).
Share and Cite
Xu, S.; Zhang, L.; Zhang, Z.; Xie, L.; Zhang, W. The Enrichment of Acetic Acid Using an Integrated Reverse Osmosis–Electrodialysis Process. Membranes 2025, 15, 129. https://doi.org/10.3390/membranes15050129
Xu S, Zhang L, Zhang Z, Xie L, Zhang W. The Enrichment of Acetic Acid Using an Integrated Reverse Osmosis–Electrodialysis Process. Membranes. 2025; 15(5):129. https://doi.org/10.3390/membranes15050129
Chicago/Turabian StyleXu, Shichang, Long Zhang, Zhen Zhang, Lixin Xie, and Wen Zhang. 2025. "The Enrichment of Acetic Acid Using an Integrated Reverse Osmosis–Electrodialysis Process" Membranes 15, no. 5: 129. https://doi.org/10.3390/membranes15050129
APA StyleXu, S., Zhang, L., Zhang, Z., Xie, L., & Zhang, W. (2025). The Enrichment of Acetic Acid Using an Integrated Reverse Osmosis–Electrodialysis Process. Membranes, 15(5), 129. https://doi.org/10.3390/membranes15050129