
Consequences of the COVID-19 Outbreak Lockdown on Non-Viral Infectious Agents as Reported by a Laboratory-Based Surveillance System at the IHU Méditerranée Infection, Marseille, France

 , ,
, ,
Abstract
:1. Introduction
2. Materials and Methods
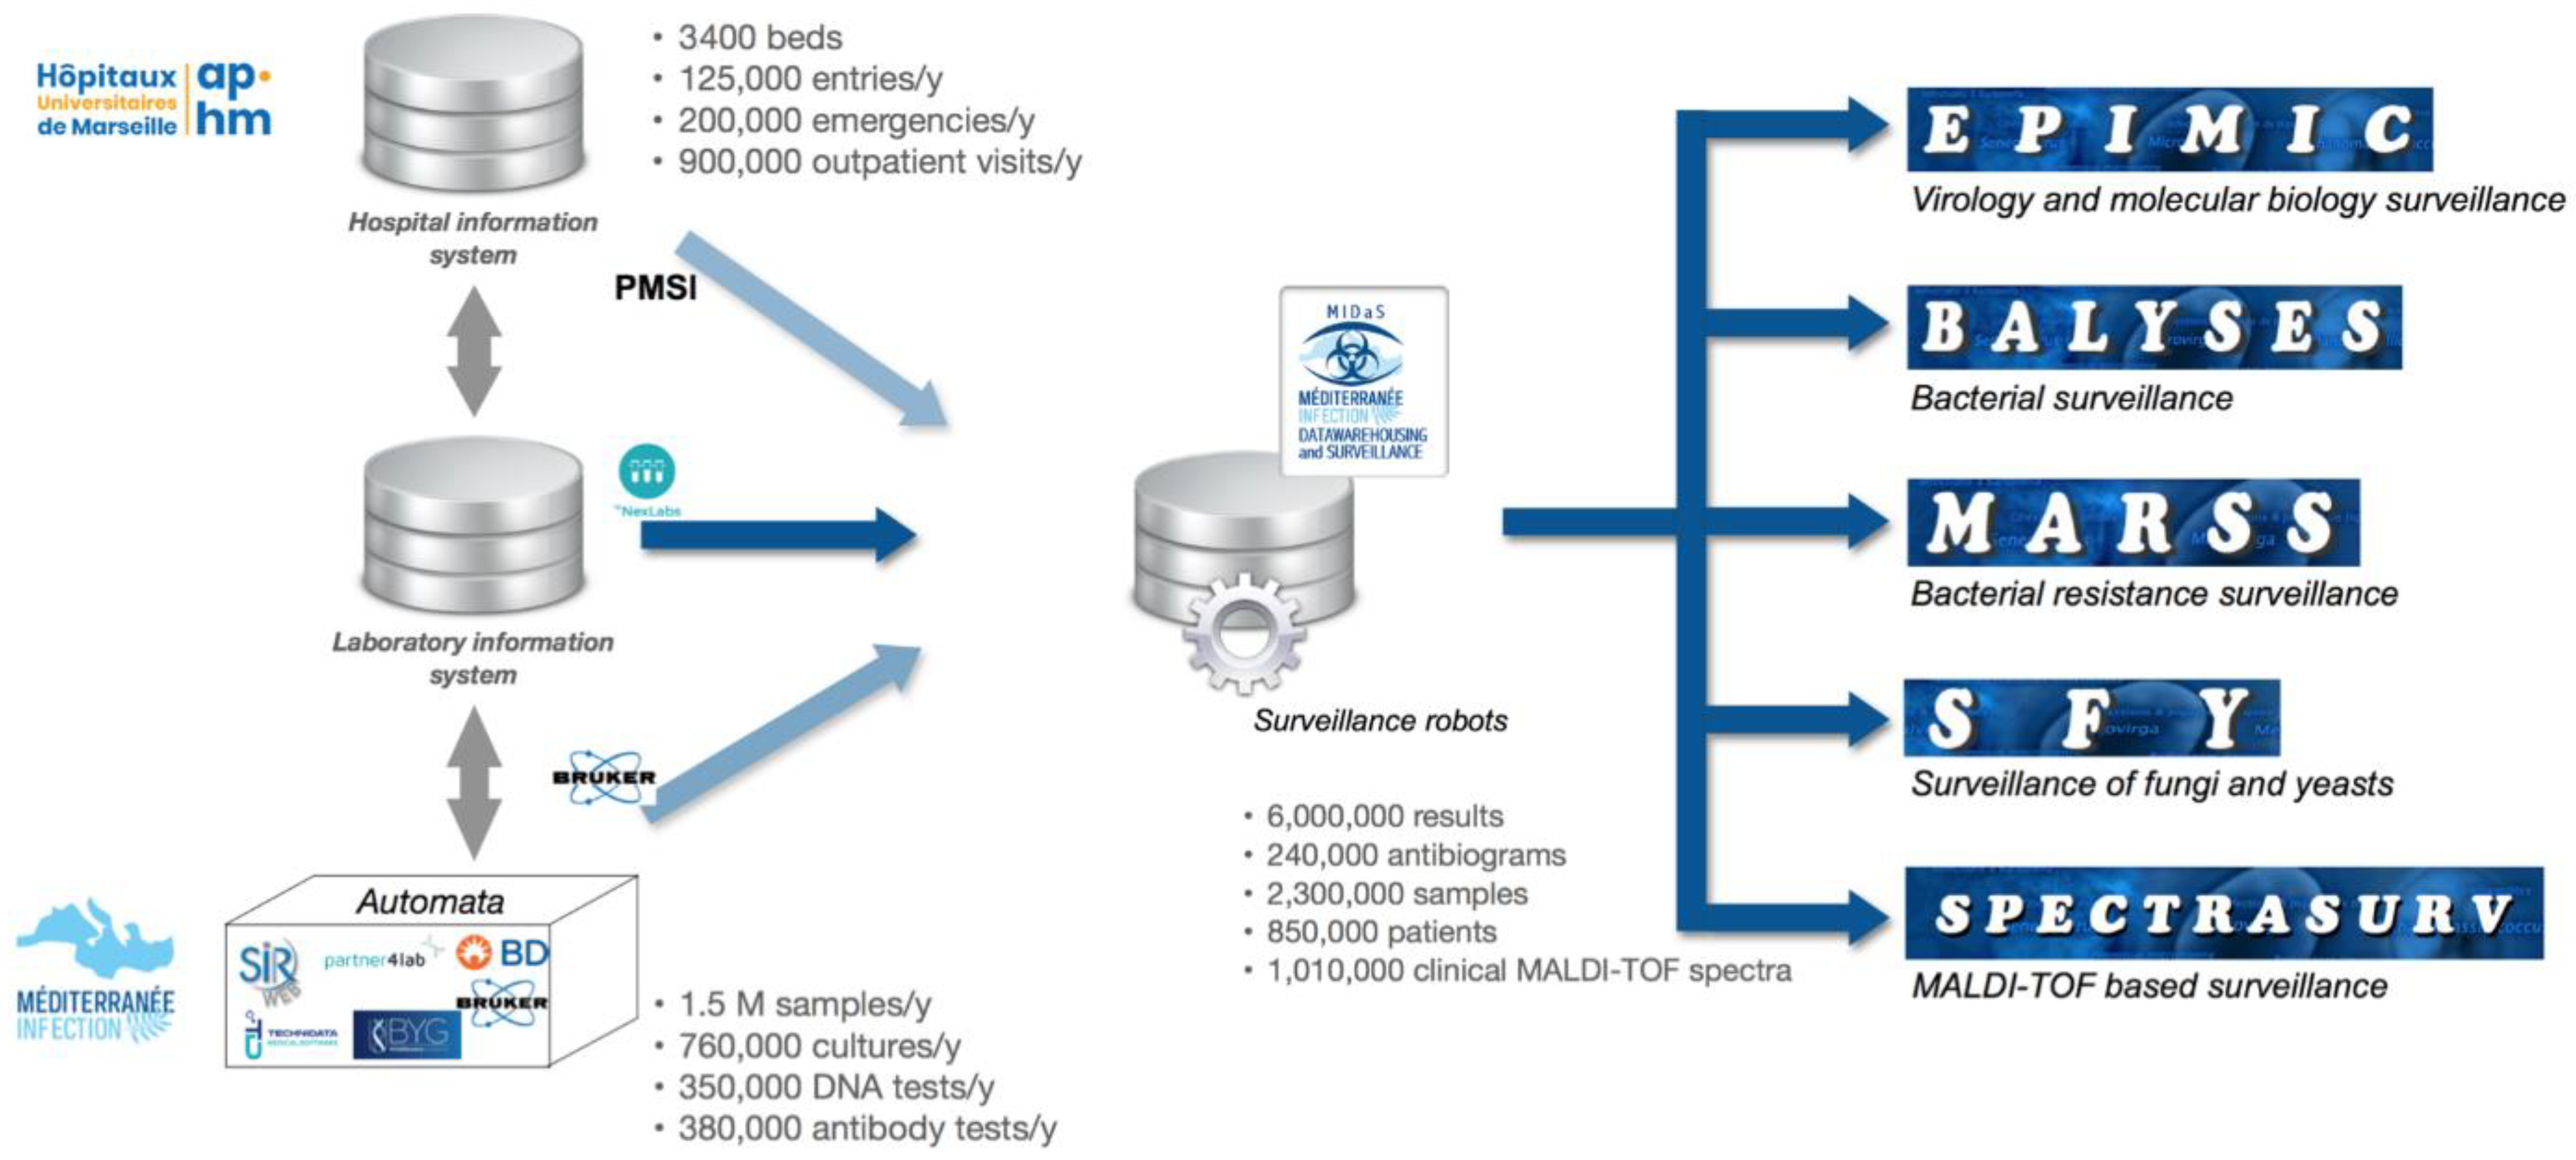
2.1. MIDaS, an Epidemiological Hub
2.2. MIDaS Data Collection
2.3. MIDaS Domain-Specific Monitoring Systems
2.4. Data for the Lockdown Analysis
2.4.1. Hospital Activities
2.4.2. Bacterial and Fungal Community
2.4.3. Evolution of Antibiotic Resistance
2.5. Statistical Analysis
3. Results
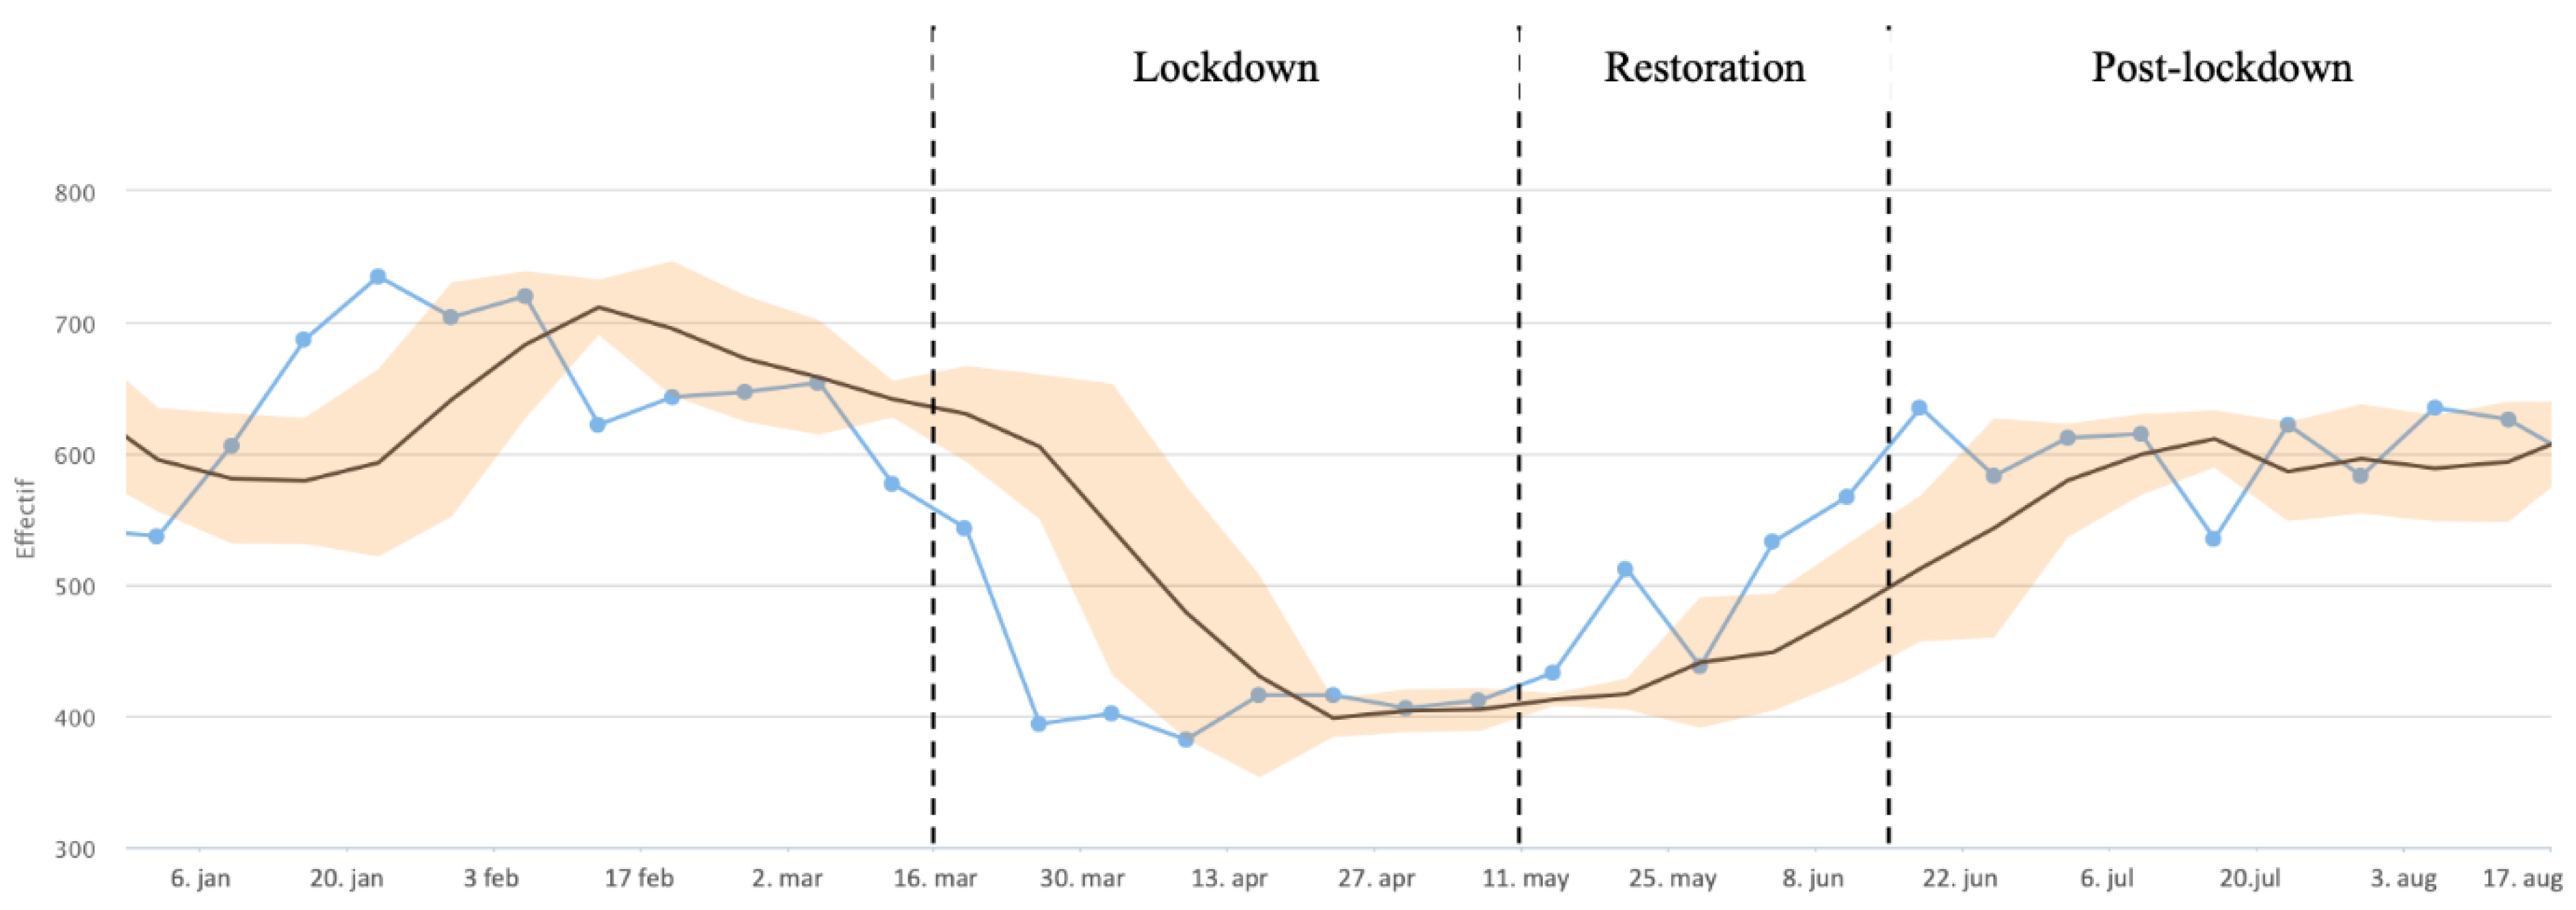
3.1. Hospital Activities
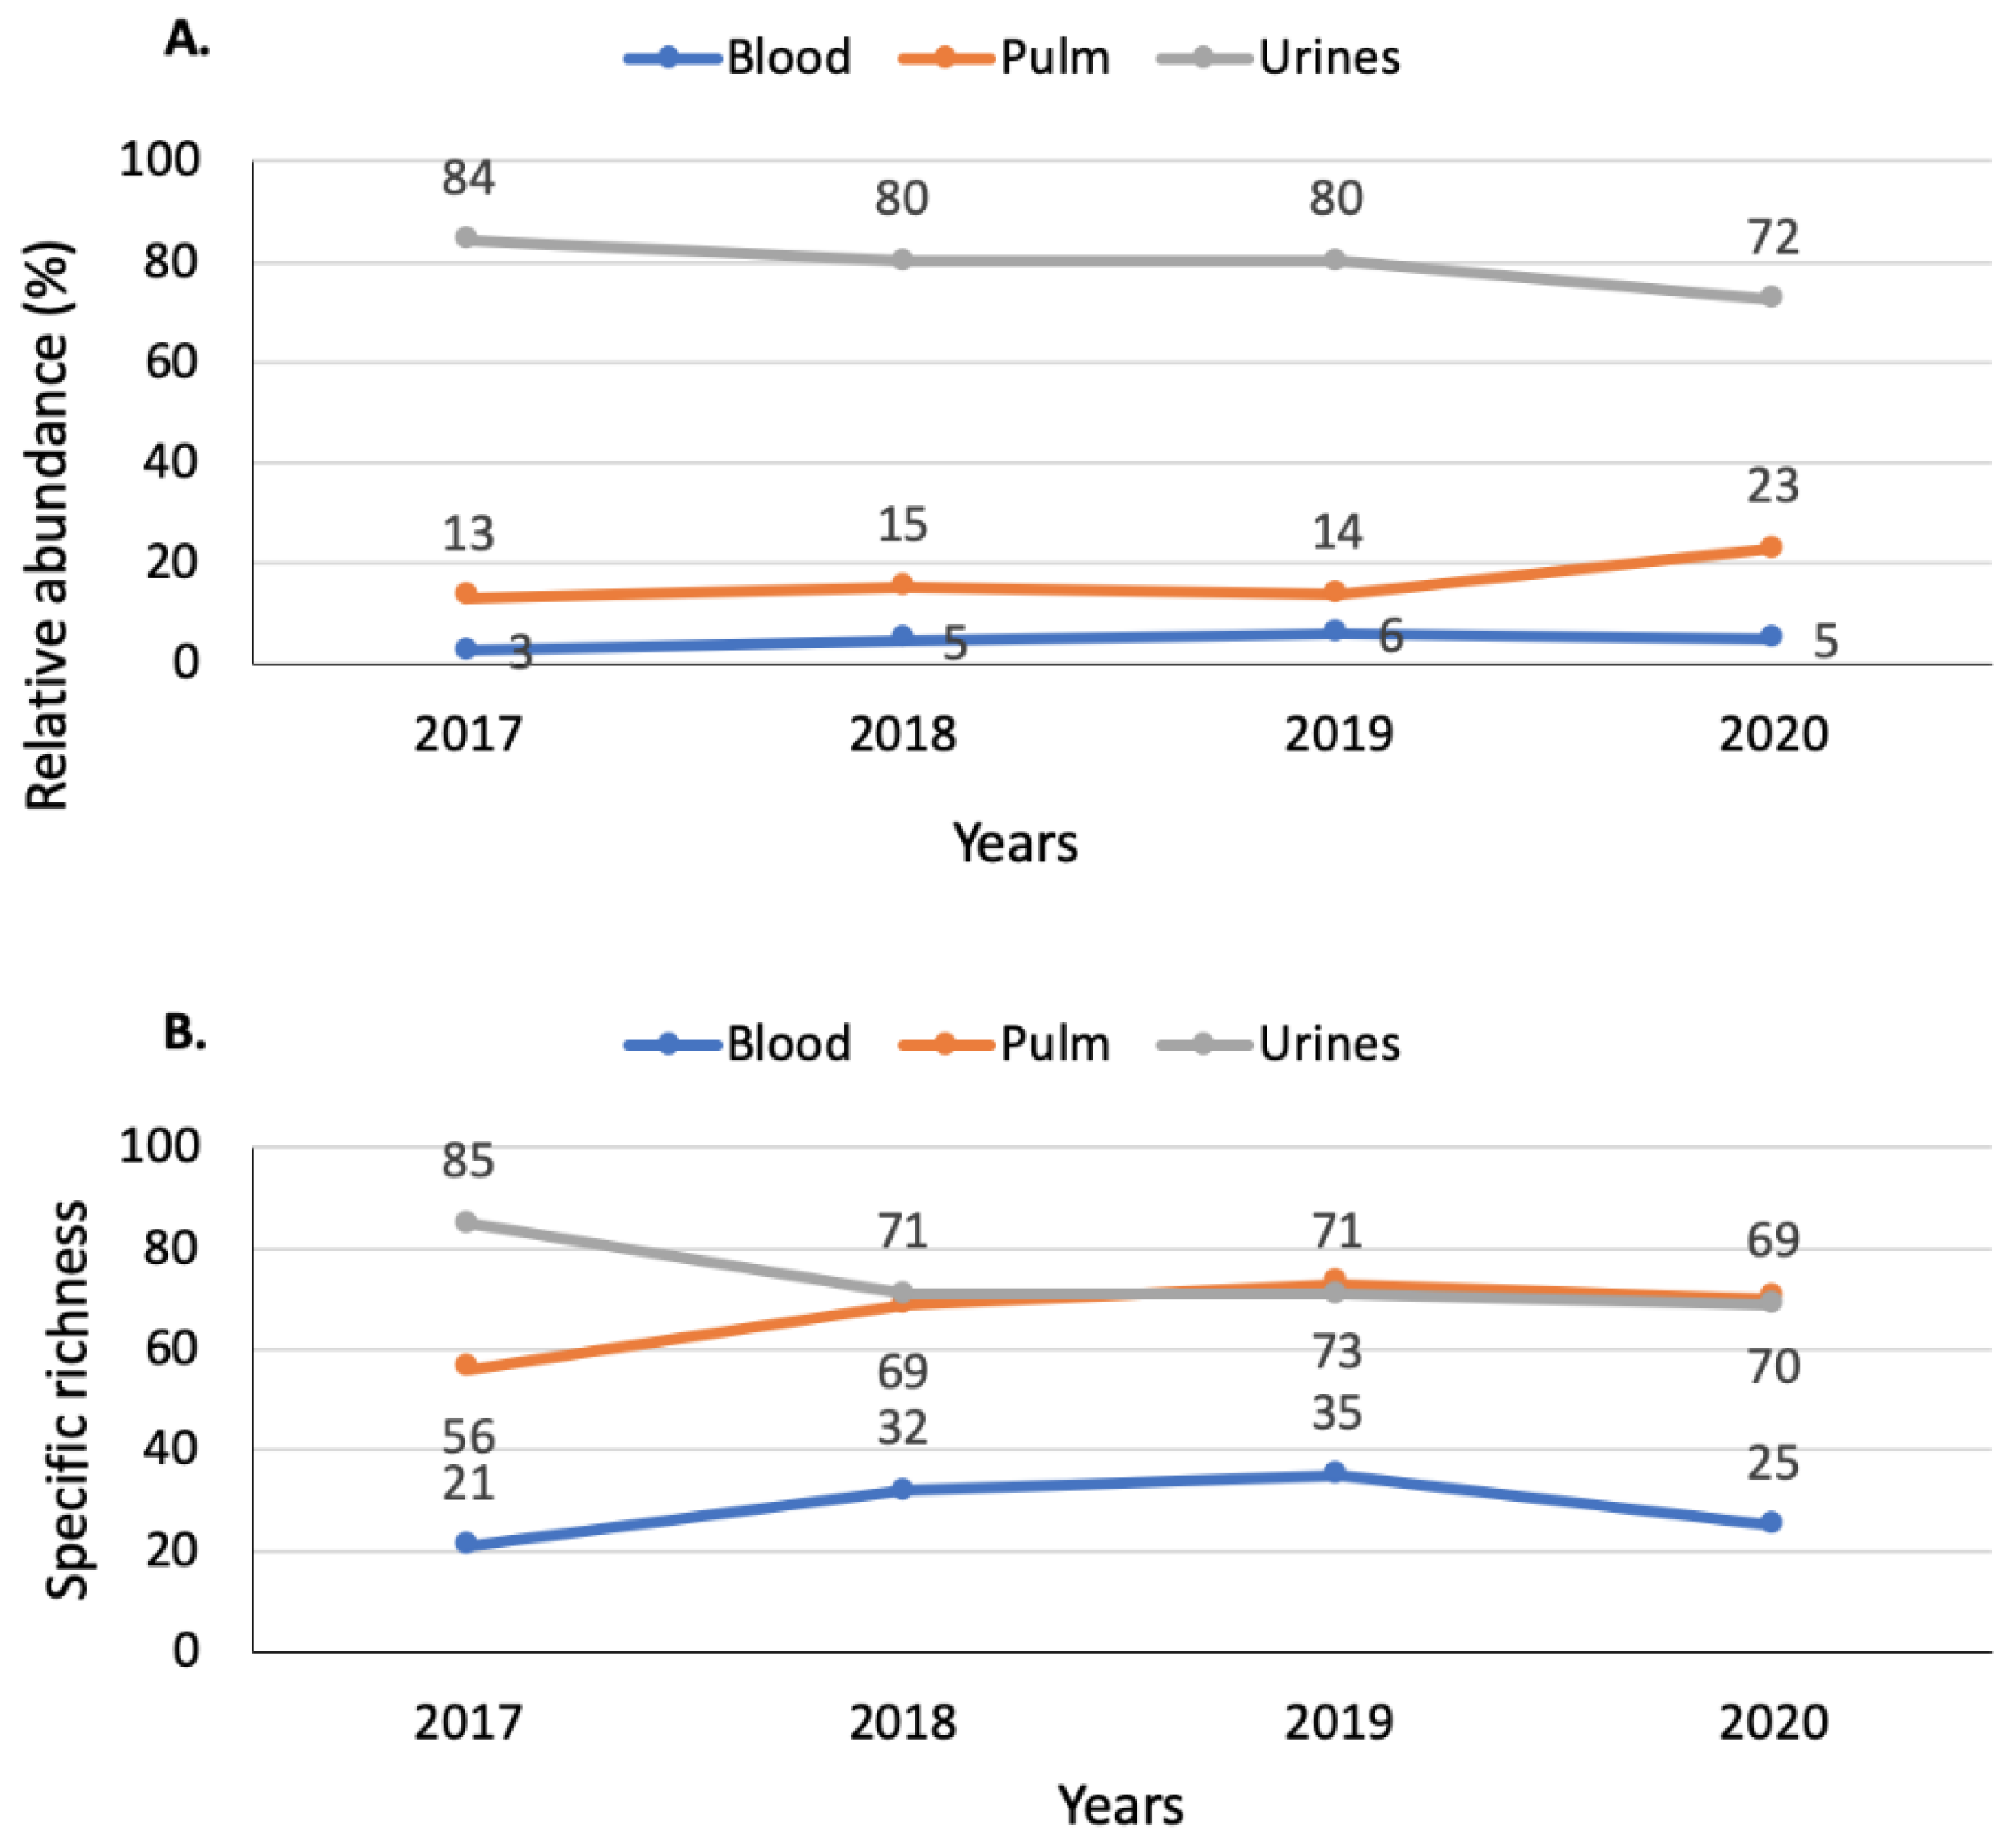
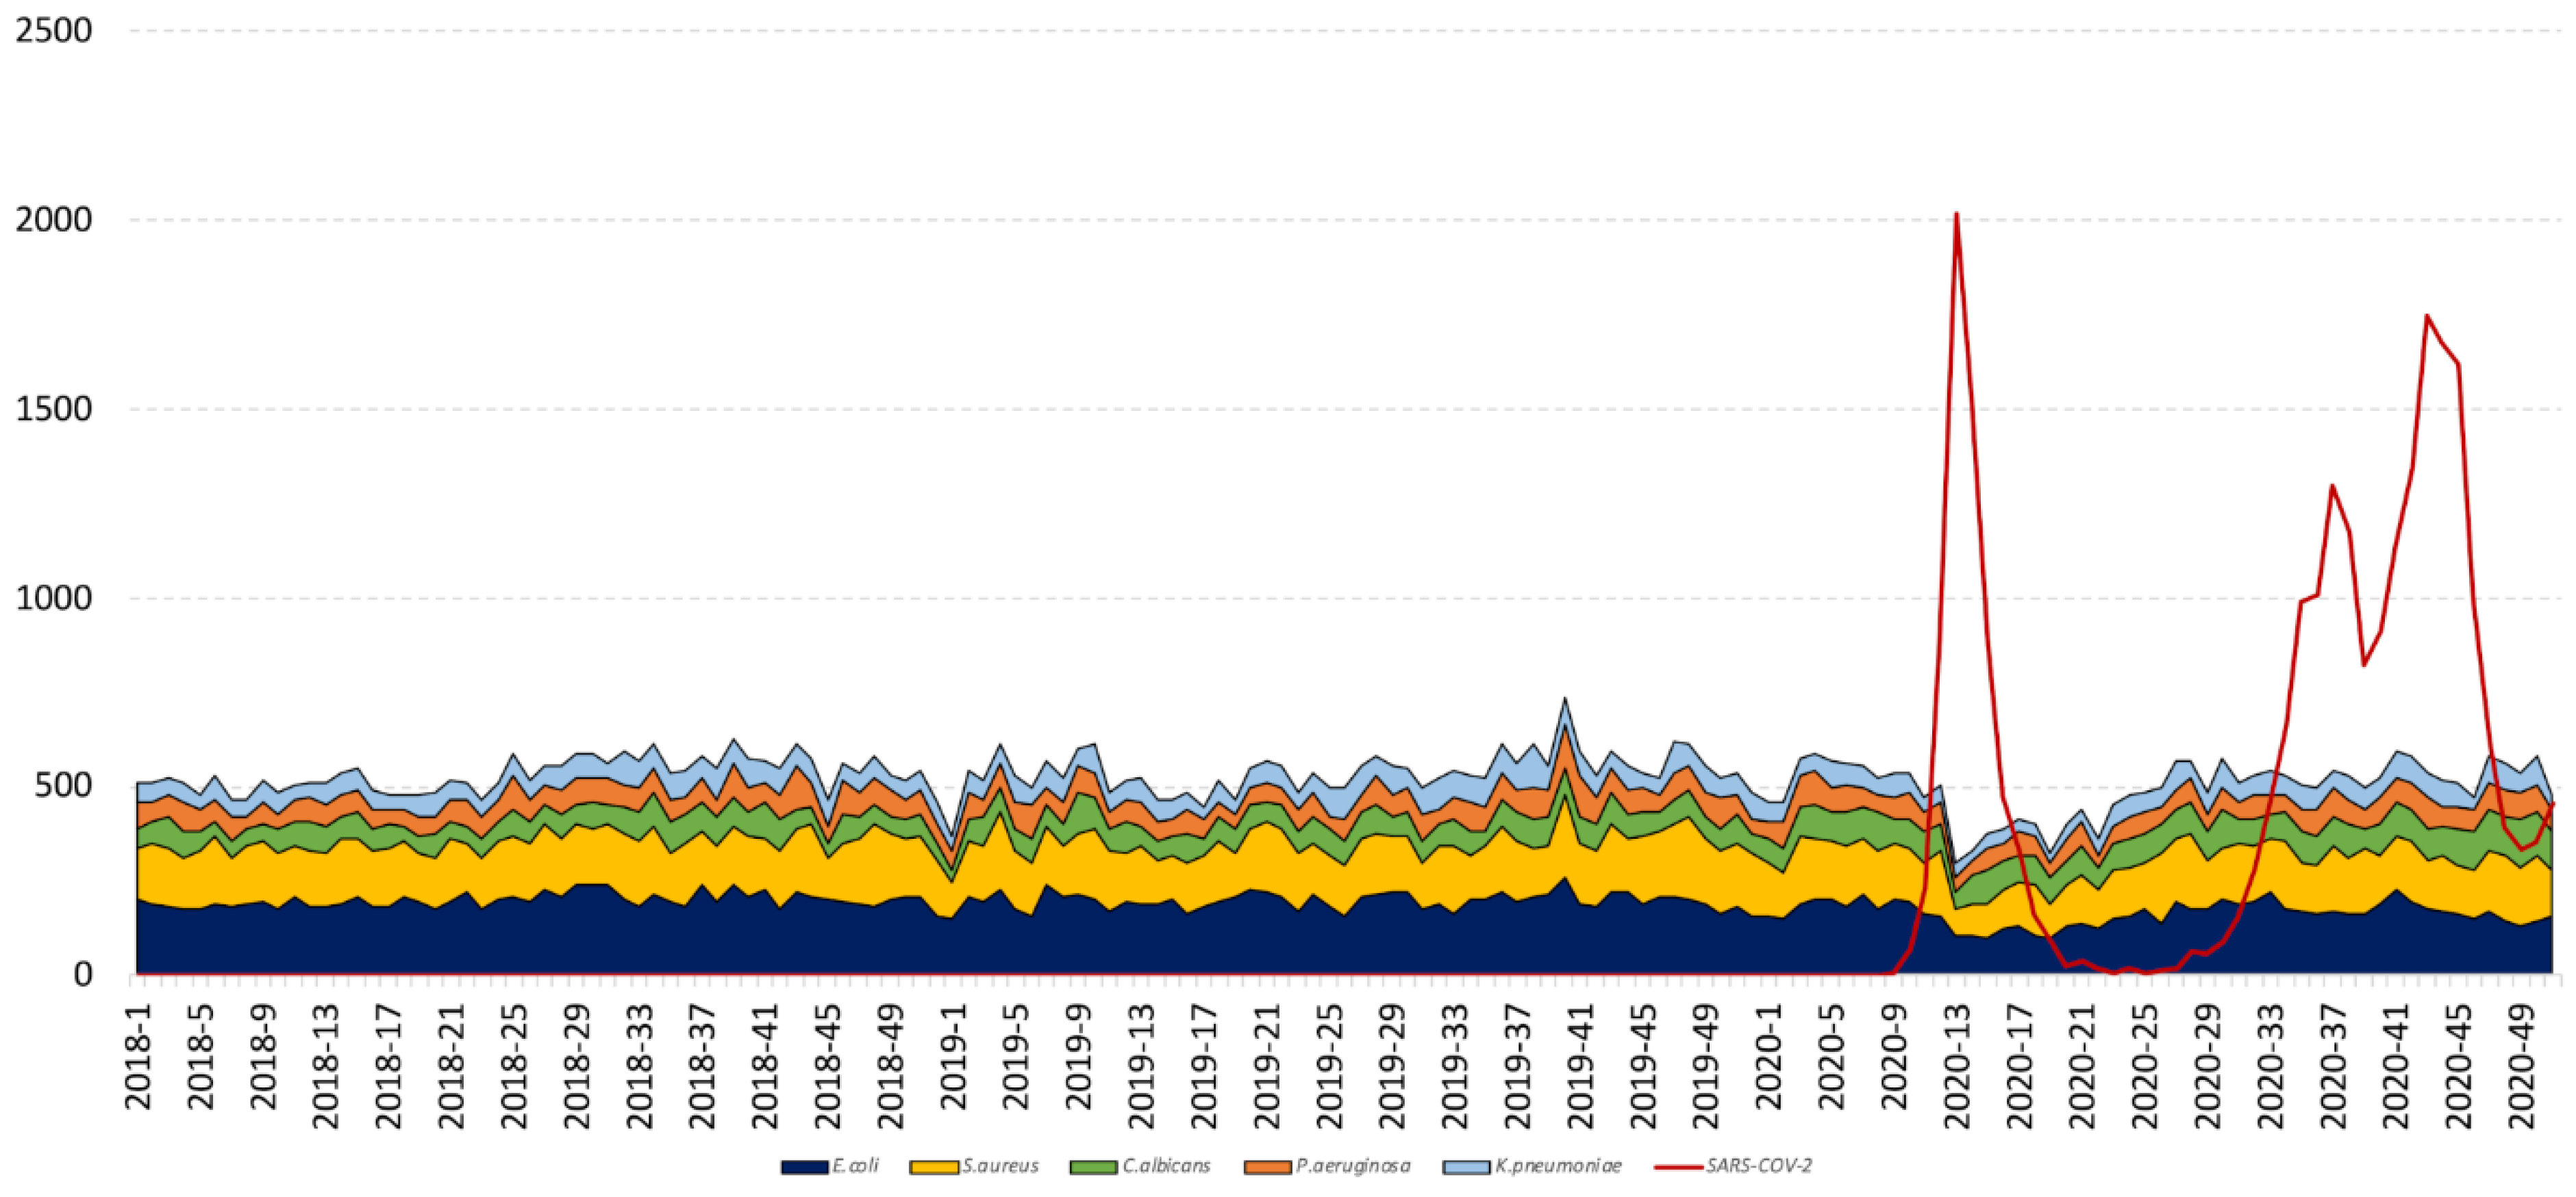
3.2. Bacterial and Fungal Community
3.2.1. Diversity in Respiratory Samples
3.2.2. Diversity in Blood Samples
3.2.3. Diversity in Urine Samples
3.2.4. Diversity in Intensive Care Units and Emergency Reception
3.3. Evolution of Antibiotic Resistance
4. Discussion
5. Conclusions
Author Contributions
Funding
Institutional Review Board Statement
Data Availability Statement
Conflicts of Interest
References
- Vanhems, P. SARS-CoV2 infection and primary school closure. Eur. Surveill. 2020, 25, 2000617. [Google Scholar] [CrossRef]
- Moatti, J.P. The French response to COVID-19: Intrinsic difficulties at the interface of science, public health, and policy. Lancet Public Health 2020, 5, e255. [Google Scholar] [CrossRef]
- Décret n°2020-260 du 16 Mars 2020 Portant Réglementation des Déplacements dans le Cadre de la Lutte Contre la Propagation du Virus COVID-19. Available online: https//www.legifrance.gouv.fr/affichTexte.do?cidTexte=JORFTEXT000041728476 (accessed on 18 November 2020).
- Thomas, H.; Boby, T.; Angrist, N.; Cameron-Blake, E.; Hallas, L.; Kira, B. Variation in Government Responses to COVID19. Version 9.0. Blavatnik School of Government Working Paper. 10 December 2020. Available online: www.bsg.ox.ac.uk/covidtracker (accessed on 22 January 2021).
- The Lancet Gastroenterology Hepatology. Drinking alone: COVID-19, lockdown, and alcohol-related harm. Lancet Gastroenterol. Hepatol. 2020, 5, 625. [Google Scholar] [CrossRef]
- Pierce, M.; Hope, H.; Ford, T.; Hatch, S.; Hotopf, M.; John, A.; Kontopantelis, E.; Webb, R.; Wessely, S.; McManus, S.; et al. Mental health before and during the COVID-19 pandemic: A longitudinal probability sample survey of the UK population. Lancet Psychiatry 2020, 7, 883–892. [Google Scholar] [CrossRef]
- Palazzolo, C.; Maffongelli, G.; D’Abramo, A.; Lepore, L.; Mariano, A.; Vulcano, A.; Bartoli, T.A.; Bevilacqua, N.; Giancola, M.L.; Di Rosa, E.; et al. Legionella pneumonia: Increased risk after COVID-19 lockdown? Italy, May to June 2020. Eur. Surveill. 2020, 25, 2001372. [Google Scholar] [CrossRef] [PubMed]
- Faber, M.; Ghisletta, A.; Schmidheiny, K. A lockdown index to assess the economic impact of the coronavirus. Swiss. J. Econ. Stat. 2020, 156, 11. [Google Scholar] [CrossRef] [PubMed]
- Flaherty, G.T.; Hession, P.; Liew, C.H.; Lim, B.C.W.; Leong, T.K.; Lim, V.; Sulaiman, L.H. COVID-19 in adult patients with pre-existing chronic cardiac, respiratory and metabolic disease: A critical literature review with clinical recommendations. Trop. Dis. Travel Med. Vaccines 2020, 6, 16. [Google Scholar] [CrossRef]
- Willan, J.; King, A.J.; Djebbari, F.; Turner, G.D.H.; Royston, D.J.; Pavord, S.; Collins, G.; Peniket, A. Assessing the impact of lockdown: Fresh challenges for the care of haematology patients in the COVID-19 pandemic. Br. J. Haematol. 2020, 189, e224–e227. [Google Scholar] [CrossRef]
- Stroup, D.F.; Williamson, G.D.; Herndon, J.L.; Karon, J.M. Detection of aberrations in the occurrence of notifiable diseases surveillance data. Stat. Med. 1989, 8, 323–332. [Google Scholar] [CrossRef] [PubMed]
- Lagier, J.C.; Khelaifia, S.; Alou, M.T.; Ndongo, S.; Dione, N.; Hugon, P.; Caputo, A.; Cadoret, F.; Traore, S.I.; Seck, E.H.; et al. Culture of previously uncultured members of the human gut microbiota by culturomics. Nat. Microbiol. 2016, 1, 16203. [Google Scholar] [CrossRef] [PubMed]
- Colson, P.; Rolain, J.M.; Abat, C.; Charrel, R.; Fournier, P.E.; Raoult, D. EPIMIC: A simple homemade computer program for real-time EPIdemiological surveillance and alert based on MICrobiological data. PLoS ONE 2015, 10, e0144178. [Google Scholar] [CrossRef] [PubMed] [Green Version]
- Abat, C.; Chaudet, H.; Colson, P.; Rolain, J.M.; Raoult, D. Real-time microbiology laboratory surveillance system to detect abnormal events and emerging infections, Marseille, France. Emerg. Infect. Dis. 2015, 21, 1302–1310. [Google Scholar] [CrossRef] [PubMed]
- Giraud-Gatineau, A.; Texier, G.; Garnotel, E.; Raoult, D.; Chaudet, H. insights into subspecies discrimination potentiality from bacteria MALDI-tof mass spectra by using data mining and diversity studies. Front. Microbiol. 2020, 11, 1931. [Google Scholar] [CrossRef] [PubMed]
- R Core Team. A Language and Environment for Statistical Computing; R Foundation for Statistical Computing: Vienna, Austria, 2019; Available online: https://www.R-project.org/ (accessed on 17 May 2021).
- Chu, K.H.; Brown, N.J.; Pelecanos, A.; Brown, A.F. Simpson’s paradox: A statistician’s case study. Emerg. Med. Australas. 2018, 30, 431–433. [Google Scholar] [CrossRef] [PubMed]
- Tikhomirova, A.; Kidd, S.P. Haemophilus influenzae and Streptococcus pneumoniae: Living together in a biofilm. Pathog. Dis. 2013, 69, 114–126. [Google Scholar] [CrossRef] [PubMed] [Green Version]
- Contou, D.; Claudinon, A.; Pajot, O.; Micaëlo, M.; Flandre, P.L.; Dubert, M.; Cally, R.; Logre, E.; Fraissé, M.; Mentec, H.; et al. Bacterial and viral co-infections in patients with severe SARS-CoV-2 pneumonia admitted to a French ICU. Ann. Intensive Care 2020, 10, 119. [Google Scholar] [CrossRef] [PubMed]
- Baldesi, O.; Bailly, S.; Ruckly, S.; Lepape, A.; L’Heriteau, F.; Aupee, M.; Boussat, S.; Bervas, C.; Machut, A.; Berger-Carbonne, A.; et al. ICU-acquired candidaemia in France: Epidemiology and temporal trends, 2004–2013—A study from the REA-RAISIN network. J. Infect. 2017, 75, 59–67. [Google Scholar] [CrossRef] [PubMed]
- De Pascale, G.; Tumbarello, M. Fungal infections in the ICU: Advances in treatment and diagnosis. Curr. Opin. Crit. Care 2015, 21, 421–429. [Google Scholar] [CrossRef]
- Kim, Y.J.; Lee, J.M.; Cho, J.; Lee, J. Change in the annual antibiotic susceptibility of escherichia coli in community-onset urinary tract infection between 2008 and 2017 in a Tertiary Care Hospital in Korea. J. Korean Med. Sci. 2019, 34, e228. [Google Scholar] [CrossRef] [PubMed]
- Préparation a la Phase Epidémique de COVID-19. Ministère des Solidarités et de la Santé, 16 March 2020. Available online: https://solidarites-sante.gouv.fr/IMG/pdf/guide-covid-19-phase-epidemique-v15-16032020.pdf (accessed on 27 March 2020).

| N | Species | During Lockdown (Weeks 12–19) | During Restoration (Weeks 20–24) | During Post-Lockdown (Weeks 25–35) | |||||||||
|---|---|---|---|---|---|---|---|---|---|---|---|---|---|
| 2017–2019 | 2020 | p-Value | Evol | 2017–2019 | 2020 | p-Value | Evol | 2017–2019 | 2020 | p-Value | Evol | ||
| % | % | % | % | % | % | ||||||||
| 1 | E. coli | 39.3 | 28.6 | <2.2 × 10⁻¹⁶ | ↘ | 37.8 | 32.2 | 8.2 × 10⁻⁵ | ↘ | 37.2 | 35.0 | 0.02 | ↘ |
| 2 | K. pneumoniae | 8.8 | 7.7 | 0.12 | → | 8.7 | 8.9 | 0.78 | → | 10.4 | 9.3 | 0.07 | → |
| 3 | E. faecalis | 6.7 | 7.4 | 0.28 | → | 6.3 | 6.3 | 0.94 | → | 6.2 | 5.9 | 0.50 | → |
| 4 | P. aeruginosa | 4.4 | 5.3 | 0.06 | → | 4.7 | 5.0 | 0.61 | → | 4.8 | 4.8 | 0.84 | → |
| 5 | C. albicans | 4.0 | 7.9 | 8.62 × 10⁻¹⁴ | ↗ | 3.9 | 6.4 | 4.2 × 10⁻⁵ | ↗ | 4.2 | 5.2 | 0.02 | ↗ |
| 6 | S. aureus | 3.7 | 4.5 | 0.11 | → | 3.7 | 4.9 | 0.05 | → | 3.5 | 4.5 | 0.01 | ↗ |
| 7 | S. epidermidis | 3.5 | 5.0 | 0.001 | ↗ | 3.3 | 4.7 | 0.02 | ↗ | 2.9 | 3.6 | 0.04 | ↗ |
| 8 | P. mirabilis | 2.7 | 2.8 | 0.80 | → | 2.6 | 2.9 | 0.54 | → | 3.0 | 3.3 | 0.36 | → |
| 9 | E. cloacae | 2.4 | 3.7 | 0.0005 | ↗ | 2.6 | 3.2 | 0.24 | → | 3.3 | 3.9 | 0.10 | → |
| 10 | S. agalactiae | 2.3 | 2.1 | 0.46 | → | 2. | 1.7 | 0.47 | → | 2.2 | 2.4 | 0.48 | → |
| 11 | K. oxytoca | 1.5 | 0.8 | 0.02 | ↘ | 1.4 | 1.7 | 0.44 | → | 1.3 | 1.1 | 0.37 | → |
| 12 | E. faecium | 1.5 | 1.4 | 0.71 | → | 1.2 | 1.2 | 0.34 | → | 1.2 | 1.2 | 0.80 | → |
| 13 | H. influenzae | 1.2 | 0.7 | 0.02 | ↘ | 1.0 | 0.8 | 0.53 | → | 0.8 | 0.5 | 0.05 | → |
| 14 | S. haemolyticus | 1.2 | 2.0 | 0.004 | ↗ | 1.3 | 1.7 | 0.34 | → | 1.1 | 1.3 | 0.19 | → |
| 15 | C. koseri | 1.1 | 1.4 | 0.33 | → | 1.4 | 0.7 | 0.03 | ↘ | 1.0 | 1.0 | 0.92 | → |
| 16 | E. aerogenes | 1.1 | 1.6 | 0.04 | ↗ | 1.0 | 1.0 | 0.87 | → | 1.3 | 1.6 | 0.12 | → |
| 17 | S. saprophyticus | 1.0 | 0.8 | 0.49 | → | 1.1 | 1.1 | 0.77 | → | 1.0 | 1.2 | 0.51 | → |
| 18 | M. morganii | 0.8 | 1.2 | 0.09 | → | 1.0 | 0.5 | 0.08 | → | 0.9 | 1.0 | 0.60 | → |
| 19 | S. pneumoniae | 0.7 | 0.5 | 0.18 | → | 0.6 | 0.4 | 0.40 | → | 0.5 | 0.5 | 0.85 | → |
| 20 | C. glabrata | 0.6 | 1.1 | 0.01 | ↗ | 0.7 | 0.8 | 0.81 | → | 0.6 | 0.7 | 0.65 | → |
| 21 | Autres | 11.6 | 13.4 | 0.03 | ↗ | 13.5 | 14.0 | 0.58 | → | 12.5 | 12.2 | 0.62 | → |
| N | Species | During Lockdown (Weeks 12–19) | During Restoration (Weeks 20–24) | During Post-Lockdown (Weeks 25–35) | |||||||||
|---|---|---|---|---|---|---|---|---|---|---|---|---|---|
| 2017–2019 | 2020 | p-Value | Evol | 2017–2019 | 2020 | p-Value | Evol | 2017–2019 | 2020 | p-Value | Evol | ||
| % | % | % | % | % | % | ||||||||
| 1 | E. coli | 7.5 | 3.3 | 0.001 | ↘ | 5.9 | 5.0 | 0.61 | → | 5.0 | 5.0 | 0.98 | → |
| 2 | K. pneumoniae | 5.0 | 4.5 | 0.69 | → | 5.7 | 2.2 | 0.02 | ↘ | 6.5 | 4.6 | 0.11 | → |
| 3 | E. faecalis | 2.5 | 3.1 | 0.51 | → | 1.1 | 3.9 | 0.004 | ↗ | 1.6 | 1.4 | 0.82 | → |
| 4 | P. aeruginosa | 9.0 | 9.6 | 0.69 | → | 10.0 | 11.1 | 0.61 | → | 8.6 | 9.4 | 0.57 | → |
| 5 | C. albicans | 7.4 | 17.6 | 2.1 × 10⁻⁹ | ↗ | 9.0 | 13.3 | <2.2 × 10⁻¹⁶ | ↗ | 8.4 | 13.5 | 0.00 | ↗ |
| 6 | S. aureus | 13.8 | 12.2 | 0.40 | → | 12.3 | 12.2 | 0.97 | → | 13.4 | 14.9 | 0.36 | → |
| 7 | S. epidermidis | 5.0 | 6.9 | 0.11 | → | 3.7 | 6.8 | 0.04 | ↗ | 3.3 | 5.0 | 0.07 | → |
| 8 | P. mirabilis | 0.9 | 0.6 | 0.76 | → | 0.9 | 1.8 | 0.31 | → | 0.8 | 1.6 | 0.12 | → |
| 9 | E. cloacae | 2.6 | 4.7 | 0.03 | ↗ | 3.1 | 3.2 | 0.95 | → | 5.3 | 5.0 | 0.68 | → |
| 10 | S. agalactiae | 1.0 | 0.4 | 0.36 | → | 0.0 | 1.1 | 0.02 | ↗ | 0.8 | 0.5 | 0.77 | → |
| 11 | K. oxytoca | 1.3 | 0.4 | 0.11 | → | 1.4 | 1.8 | 0.77 | → | 1.4 | 1.2 | 0.84 | → |
| 12 | E. faecium | 0.6 | 0.0 | 0.19 | → | 0.4 | 0.0 | 0.56 | → | 0.2 | 0.5 | 0.36 | → |
| 13 | H. influenzae | 8.7 | 2.9 | 2.5 × 10⁻⁵ | ↘ | 7.3 | 3.9 | 0.05 | → | 6.1 | 2.8 | 0.00 | → |
| 14 | S. haemolyticus | 2.3 | 3.1 | 0.37 | → | 2.9 | 2.5 | 0.76 | → | 1.7 | 1.8 | 0.90 | → |
| 15 | C. koseri | 1.0 | 0.8 | 1.00 | → | 0.7 | 0.4 | 1.00 | → | 0.5 | 0.5 | 1.00 | → |
| 16 | E. aerogenes | 1.3 | 2.7 | 0.07 | → | 1.1 | 0.7 | 0.73 | → | 1.6 | 2.1 | 0.38 | → |
| 17 | S. saprophyticus | 0.0 | 0.0 | 1.00 | → | 0.0 | 0.0 | 1.00 | → | 0.0 | 0.0 | 1.00 | → |
| 18 | M. morganii | 0.5 | 1.4 | 0.06 | → | 0.4 | 0.0 | 0.56 | → | 0.8 | 0.5 | 0.77 | → |
| 19 | S. pneumoniae | 4.6 | 2.0 | 0.01 | ↘ | 4.0 | 2.2 | 0.15 | → | 3.7 | 3.0 | 1.48 | → |
| 20 | C. glabrata | 1.0 | 1.4 | 0.41 | → | 1.3 | 0.7 | 0.74 | → | 0.7 | 1.1 | 0.40 | → |
| 21 | Autres | 24.3 | 22.5 | 0.42 | → | 28.7 | 27.2 | 0.64 | → | 29.8 | 25.4 | 0.05 | → |
| N | Species | During Lockdown (Weeks 12–19) | During Restoration (Weeks 20–24) | During Post-Lockdown (Weeks 25–35) | |||||||||
|---|---|---|---|---|---|---|---|---|---|---|---|---|---|
| 2017–2019 | 2020 | p-Value | Evol | 2017–2019 | 2020 | p-Value | Evol | 2017–2019 | 2020 | p-Value | Evol | ||
| % | % | % | % | % | % | ||||||||
| 1 | E. coli | 5.8 | 1.0 | 0.06 | → | 6.8 | 1.2 | 0.08 | → | 3.0 | 4.2 | 0.85 | → |
| 2 | K. pneumoniae | 3.7 | 1.9 | 0.53 | → | 2.4 | 2.4 | 1.00 | → | 5.7 | 3.7 | 0.30 | → |
| 3 | E. faecalis | 2.4 | 7.8 | 0.03 | ↗ | 1.9 | 0.0 | 0.58 | → | 2.8 | 4.8 | 0.18 | → |
| 4 | P. aeruginosa | 2.7 | 4.9 | 0.34 | → | 3.4 | 2.4 | 1.00 | → | 6.5 | 4.3 | 0.27 | → |
| 5 | C. albicans | 9.8 | 3.9 | 0.07 | → | 6.3 | 3.6 | 0.57 | → | 3.9 | 2.7 | 0.42 | → |
| 6 | S. aureus | 11.3 | 8.7 | 0.58 | → | 14.1 | 16.9 | 0.58 | → | 12.4 | 13.8 | 0.61 | → |
| 7 | S. epidermidis | 24.1 | 33.0 | 0.07 | → | 23.8 | 32.5 | 0.14 | → | 23.4 | 25.0 | 0.66 | → |
| 8 | P. mirabilis | 1.8 | 0.0 | 0.34 | → | 1.0 | 0.0 | 1.00 | → | 1.2 | 2.1 | 0.47 | → |
| 9 | E. cloacae | 2.7 | 1.9 | 1.00 | → | 3.9 | 4.8 | 0.75 | → | 4.5 | 5.3 | 0.66 | → |
| 10 | S. agalactiae | 0.3 | 0.0 | 1.00 | → | 0.0 | 0.0 | 1.00 | → | 0.4 | 0.5 | 1.00 | → |
| 11 | K. oxytoca | 0.9 | 1.0 | 1.00 | → | 1.0 | 0.0 | 1.00 | → | 0.6 | 0.0 | 0.57 | → |
| 12 | E. faecium | 0.6 | 1.0 | 1.00 | → | 1.0 | 0.0 | 1.00 | → | 0.6 | 1.1 | 0.62 | → |
| 13 | H. influenzae | 0.3 | 0.0 | 1.00 | → | 0.5 | 1.2 | 0.49 | → | 0.0 | 0.0 | 1.00 | → |
| 14 | S. haemolyticus | 3.4 | 10.7 | 0.003 | ↗ | 2.4 | 6.0 | 0.16 | → | 2.8 | 8.5 | 0.001 | ↗ |
| 15 | C. koseri | 0.0 | 0.0 | 1.00 | → | 0.0 | 1.2 | 0.29 | → | 0.2 | 0.0 | 1.00 | → |
| 16 | E. aerogenes | 0.3 | 1.0 | 1.00 | → | 0.5 | 1.2 | 0.49 | → | 0.4 | 1.1 | 0.30 | → |
| 17 | S. saprophyticus | 0.0 | 0.0 | 1.00 | → | 0.5 | 1.2 | 0.49 | → | 0.0 | 0.0 | 1.00 | → |
| 18 | M. morganii | 0.0 | 1.0 | 1.00 | → | 0.0 | 0.0 | 1.00 | → | 0.0 | 0.0 | 1.00 | → |
| 19 | S. pneumoniae | 0.3 | 0.0 | 1.00 | → | 0.5 | 0.0 | 1.00 | → | 0.0 | 0.0 | 1.00 | → |
| 20 | C. glabrata | 0.3 | 0.0 | 1.00 | → | 0.5 | 0.0 | 1.00 | → | 0.6 | 0.0 | 0.57 | → |
| 21 | Autres | 29.3 | 22.3 | 0.17 | → | 29.6 | 25.3 | 0.46 | → | 30.3 | 22.9 | 0.05 | → |
| N | Species | During Lockdown (Weeks 12–19) | During Restoration (Weeks 20–24) | During Post-Lockdown (Weeks 25–35) | |||||||||
|---|---|---|---|---|---|---|---|---|---|---|---|---|---|
| 2017–2019 | 2020 | p-Value | Evol | 2017–2019 | 2020 | p-Value | Evol | 2017–2019 | 2020 | p-Value | Evol | ||
| % | % | % | % | % | % | ||||||||
| 1 | E. coli | 46.5 | 38.4 | 8.9 × 10⁻⁹ | ↘ | 44.7 | 41.6 | 0.07 | → | 44.1 | 43.4 | 0.53 | → |
| 2 | K. pneumoniae | 9.7 | 9.2 | 0.48 | → | 9.5 | 11.2 | 0.10 | → | 11.3 | 10.7 | 0.43 | → |
| 3 | E. faecalis | 7.7 | 8.7 | 0.17 | → | 7.4 | 7.4 | 0.96 | → | 7.1 | 6.9 | 0.70 | → |
| 4 | P. aeruginosa | 3.6 | 4.0 | 0.51 | → | 3.9 | 3.6 | 0.72 | → | 4.2 | 3.8 | 0.43 | → |
| 5 | C. albicans | 3.0 | 5.1 | 8.3 × 10⁻⁵ | ↗ | 2.9 | 4.9 | 0.002 | ↗ | 3.6 | 3.6 | 0.91 | → |
| 6 | S. aureus | 1.6 | 1.7 | 0.62 | → | 1.8 | 2.1 | 0.57 | → | 1.5 | 1.6 | 0.55 | → |
| 7 | S. epidermidis | 2.1 | 2.5 | 0.35 | → | 2.3 | 2.0 | 0.56 | → | 1.8 | 1.9 | 0.80 | → |
| 8 | P. mirabilis | 3.1 | 3.7 | 0.22 | → | 3.0 | 3.5 | 0.46 | → | 3.5 | 3.8 | 0.45 | → |
| 9 | E. cloacae | 2.3 | 3.5 | 0.005 | ↗ | 2.5 | 3.1 | 0.28 | → | 2.9 | 3.5 | 0.08 | → |
| 10 | S. agalactiae | 2.7 | 2.7 | 0.93 | → | 2.3 | 2.0 | 0.53 | → | 2.5 | 2.9 | 0.24 | → |
| 11 | K. oxytoca | 1.6 | 1.0 | 0.07 | → | 1.4 | 1.8 | 0.38 | → | 1.3 | 1.2 | 0.48 | → |
| 12 | E. faecium | 1.7 | 1.8 | 0.70 | → | 1.3 | 1.6 | 0.46 | → | 1.4 | 1.3 | 0.67 | → |
| 13 | H. influenzae | 0.0 | 0.0 | 1.00 | → | 0.0 | 0.0 | 1.00 | → | 0.0 | 0.0 | 1.00 | → |
| 14 | S. haemolyticus | 0.8 | 1.0 | 0.47 | → | 1.0 | 1.1 | 0.79 | → | 0.8 | 0.7 | 0.51 | → |
| 15 | C. koseri | 1.2 | 1.7 | 0.17 | → | 1.6 | 0.8 | 0.04 | ↘ | 1.1 | 1.1 | 0.95 | → |
| 16 | E. aerogenes | 1.1 | 1.4 | 0.35 | → | 1.0 | 1.0 | 0.99 | → | 1.3 | 1.6 | 0.27 | → |
| 17 | S. saprophyticus | 1.2 | 1.2 | 0.81 | → | 1.4 | 1.3 | 0.89 | → | 1.3 | 1.5 | 0.34 | → |
| 18 | M. morganii | 0.9 | 1.2 | 0.39 | → | 1.1 | 0.5 | 0.05 | → | 1.0 | 1.2 | 0.38 | → |
| 19 | S. pneumoniae | 0.1 | 0.0 | 0.61 | → | 0.1 | 0.0 | 1.00 | → | 0.1 | 0.0 | 0.59 | → |
| 20 | C. glabrata | 0.6 | 1.1 | 0.02 | ↗ | 0.6 | 0.8 | 0.43 | → | 0.6 | 0.6 | 0.80 | → |
| 21 | Autres | 8.5 | 10.2 | 0.03 | ↗ | 10.2 | 9.9 | 0.75 | → | 8.9 | 8.7 | 0.82 | → |
| N | Species | During Lockdown (Weeks 12–19) | During Restoration (Weeks 20–24) | During Post-Lockdown (Weeks 25–35) | |||||||||
|---|---|---|---|---|---|---|---|---|---|---|---|---|---|
| 2017–2019 | 2020 | p-Value | Evol | 2017–2019 | 2020 | p-Value | Evol | 2017–2019 | 2020 | p-Value | Evol | ||
| % | % | % | % | % | % | ||||||||
| 1 | E. coli | 10.9 | 8.6 | 0.2 | → | 9.2 | 4.6 | 0,01 | ↘ | 15.3 | 13.4 | 0.27 | → |
| 2 | K. pneumoniae | 13.6 | 7.8 | 0.003 | ↘ | 0 | 0 | 1 | → | 8.1 | 5.5 | 0.04 | ↘ |
| 3 | E. faecalis | 0.8 | 2.8 | 0.003 | → | 4.3 | 0 | 0.0001 | ↘ | 6.8 | 7.4 | 0.64 | → |
| 4 | P. aeruginosa | 6.0 | 0 | 7.30 × 10⁻⁷ | ↘ | 10.7 | 17.4 | 0.002 | ↗ | 7.1 | 2.6 | 7.50 × 10⁻⁵ | ↘ |
| 5 | C. albicans | 4.1 | 10.4 | 3.40 × 10⁻⁶ | ↗ | 8.3 | 0 | 7.30 × 10⁻⁸ | ↘ | 8.7 | 19.3 | 2.70 × 10⁻¹¹ | ↗ |
| 6 | S. aureus | 3.0 | 24.8 | <2.2 × 10⁻¹⁶ | ↗ | 23 | 0.6 | <2.2 × 10⁻¹⁶ | ↘ | 10.1 | 8.6 | 0.3 | ↘ |
| 7 | S. epidermidis | 9.5 | 4.3 | 0.001 | ↘ | 3.5 | 34.9 | <2.2 × 10⁻¹⁶ | ↗ | 7.2 | 3.1 | 0.0003 | ↘ |
| 8 | P. mirabilis | 1.1 | 0.3 | 0.2 | → | 0.1 | 2.1 | 0.001 | ↗ | 2.4 | 1.6 | 0.25 | → |
| 9 | E. cloacae | 2.1 | 3.8 | 0.07 | → | 8.5 | 3.4 | 0.002 | ↘ | 5.7 | 7.9 | 0.05 | → |
| 10 | S. agalactiae | 0.8 | 1 | 0.75 | → | 0.2 | 0 | 1 | → | 0.8 | 0.3 | 0.38 | → |
| 11 | K. oxytoca | 1.4 | 0.3 | 0.09 | → | 1.7 | 0.3 | 0.08 | → | 1.2 | 2.8 | 0.01 | ↗ |
| 12 | E. faecium | 2.4 | 0.3 | 0.01 | ↘ | 1.4 | 0 | 0.02 | ↘ | 1 | 1.9 | 0.09 | → |
| 13 | H. influenzae | 7.7 | 0.3 | <4.5 × 10⁻⁸ | ↘ | 3.6 | 6.4 | 0.03 | ↗ | 0.8 | 0 | 0.03 | ↘ |
| 14 | S. haemolyticus | 1.8 | 0 | 0.01 | ↘ | 0.5 | 1.2 | 0.23 | → | 0.5 | 3.6 | 5.90 × 10⁻⁹ | ↗ |
| 15 | C. koseri | 1.1 | 0 | 0.04 | ↘ | 0.4 | 0 | 0.56 | → | 0.8 | 1.7 | 0.05 | ↗ |
| 16 | E. aerogenes | 2.5 | 5.6 | 0.003 | ↗ | 0.7 | 0.9 | 0.71 | → | 1.7 | 0.3 | 0.02 | ↘ |
| 17 | S. saprophyticus | 0 | 0.3 | 0.26 | → | 0 | 0 | 1 | → | 0.1 | 0 | 1 | → |
| 18 | M. morganii | 0.2 | 0.3 | 1 | → | 0 | 0 | 1 | → | 0.8 | 1.9 | 0.03 | ↗ |
| 19 | S. pneumoniae | 2.8 | 5.6 | 0.01 | ↗ | 2 | 0 | 0.01 | ↘ | 0.5 | 0.2 | 0.47 | → |
| 20 | C. glabrata | 2.0 | 1.3 | 0.32 | → | 0.1 | 1.5 | 0.01 | ↗ | 1 | 0.5 | 0.27 | → |
| 21 | Autres | 26.3 | 22.5 | 0.14 | → | 21.9 | 73.4 | <2.2 × 10⁻¹⁶ | ↗ | 80.5 | 17.2 | <2.2 × 10⁻¹⁶ | ↘ |
| N | Species | During Lockdown (Weeks 12–19) | During Restoration (Weeks 20–24) | During Post-Lockdown (Weeks 25–35) | |||||||||
|---|---|---|---|---|---|---|---|---|---|---|---|---|---|
| 2017–2019 | 2020 | p-Value | Evol | 2017–2019 | 2020 | p-Value | Evol | 2017–2019 | 2020 | p-Value | Evol | ||
| % | % | % | % | % | % | ||||||||
| 1 | E. coli | 31.0 | 17.7 | 3.50 × 10⁻⁷ | ↘ | 40.3 | 0.6 | <2.2 × 10⁻¹⁶ | ↘ | 25.0 | 39.0 | 1.10 × 10⁻¹⁴ | ↗ |
| 2 | K. pneumoniae | 1.3 | 3.3 | 0.01 | ↗ | 9.5 | 0.0 | 3.60 × 10⁻⁹ | ↘ | 11.0 | 11.5 | 0.64 | → |
| 3 | E. faecalis | 8.2 | 0.8 | 5.30 × 10⁻⁷ | ↘ | 0.3 | 13.6 | <2.2 × 10⁻¹⁶ | ↗ | 2.3 | 2.6 | 0.58 | → |
| 4 | P. aeruginosa | 5.9 | 2.2 | 0.004 | ↘ | 2.8 | 8.0 | 1.90 × 10⁻⁵ | ↗ | 5.2 | 6.0 | 0.36 | → |
| 5 | C. albicans | 7.8 | 0.6 | 3.80 × 10⁻⁷ | ↘ | 2.2 | 26.0 | <2.2 × 10⁻¹⁶ | ↗ | 3.7 | 3.5 | 0.82 | → |
| 6 | S. aureus | 5.5 | 14.4 | 2.70 × 10⁻⁹ | ↗ | 7.8 | 16.3 | 3.10 × 10⁻⁶ | ↗ | 6.1 | 0.7 | 2.70× 10⁻¹¹ | ↘ |
| 7 | S. epidermidis | 8.1 | 14.1 | 0.0004 | ↗ | 7.1 | 0.0 | 4.50 × 10⁻⁷ | ↘ | 5.7 | 7.5 | 0.06 | → |
| 8 | P. mirabilis | 1.9 | 0 | 0.008 | ↘ | 0.6 | 0.0 | 0.36 | → | 3.9 | 4.2 | 0.7 | → |
| 9 | E. cloacae | 0.8 | 0.8 | 1 | → | 0.3 | 7.7 | <2.2 × 10⁻¹⁶ | ↗ | 4.6 | 1.3 | 9.50 × 10⁻⁶ | ↘ |
| 10 | S. agalactiae | 0.2 | 4.7 | 3.10 × 10⁻¹⁰ | ↗ | 1.1 | 0.6 | 0.54 | → | 2.3 | 0.1 | 1.40 × 10⁻⁵ | ↘ |
| 11 | K. oxytoca | 1.3 | 2.8 | 0.04 | ↗ | 0.8 | 0.0 | 0.13 | → | 1.2 | 0.3 | 0.02 | ↘ |
| 12 | E. faecium | 1.2 | 0 | 0.04 | ↘ | 0.5 | 0.0 | 0.35 | → | 1.0 | 1.4 | 0.31 | → |
| 13 | H. influenzae | 0.7 | 0 | 0.23 | → | 2.3 | 2.4 | 0.98 | → | 1.3 | 0.1 | 0.002 | ↘ |
| 14 | S. haemolyticus | 2.3 | 4.7 | 0.01 | ↗ | 1.9 | 1.2 | 0.36 | → | 1.6 | 0.4 | 0.01 | ↘ |
| 15 | C. koseri | 1.3 | 0 | 0.02 | ↘ | 0.1 | 0.0 | 1 | → | 0.9 | 1.0 | 0.73 | → |
| 16 | E. aerogenes | 0.2 | 0.8 | 0.11 | → | 0.3 | 4.4 | 4.60 × 10⁻⁸ | ↗ | 2.4 | 1.5 | 0.13 | → |
| 17 | S. saprophyticus | 0.1 | 3.9 | 2.70 × 10⁻¹⁰ | ↗ | 1.4 | 0.0 | 0.03 | ↘ | 1.7 | 0.0 | 6.80 × 10⁻⁵ | ↘ |
| 18 | M. morganii | 0.9 | 2.5 | 0.03 | ↗ | 0.2 | 0.0 | 1 | ↘ | 0.3 | 0.0 | 0.19 | → |
| 19 | S. pneumoniae | 1.1 | 0 | 0.06 | → | 1.8 | 0.6 | 0.1 | → | 0.6 | 1.0 | 0.21 | → |
| 20 | C. glabrata | 0.4 | 3.3 | 4.90 × 10⁻⁶ | ↗ | 0.8 | 0.0 | 0.22 | → | 0.6 | 0.0 | 0.13 | → |
| 21 | Autres | 19.8 | 76.5 | <2.2 × 10⁻¹⁶ | ↗ | 17.9 | 81.4 | <2.2 × 10⁻¹⁶ | ↗ | 81.4 | 82.3 | 0.55 | → |
| Species | Global | Origin of Infection | ||||||||||||||||||||||
|---|---|---|---|---|---|---|---|---|---|---|---|---|---|---|---|---|---|---|---|---|---|---|---|---|
| 2017–2019 | 2020 | p-Value | Evol | Nosocomial | Community | |||||||||||||||||||
| W | R | % | W | R | % | 2017–2019 | 2020 | p-Value | Evol | 2017–2019 | 2020 | p-Value | Evol | |||||||||||
| W | R | % | W | R | % | W | R | % | W | R | % | |||||||||||||
| A. baumannii | 74 | 22 | 77.1 | 9 | 3 | 75.0 | 1.00 | → | 20 | 22 | 47.6 | 9 | 3 | 75 | 0.11 | → | 54 | 0 | 100 | 0 | 0 | - | - | → |
| E. aerogenes | 342 | 49 | 87.5 | 119 | 16 | 88.2 | 0.84 | → | 121 | 31 | 79.6 | 0 | 16 | 0 | 1.6 × 10⁻¹⁰ | ↘ | 221 | 18 | 92.5 | 119 | 0 | 100 | 0.001 | ↗ |
| E. cloacae | 786 | 348 | 69.3 | 265 | 92 | 74.2 | 0.08 | → | 515 | 0 | 100 | 0 | 0 | - | - | → | 271 | 348 | 43.8 | 265 | 92 | 74.2 | <2.2 × 10⁻¹⁶ | ↗ |
| E. faecalis | 1987 | 9 | 99.6 | 348 | 1 | 99.7 | 1.00 | → | 1374 | 1 | 99.9 | 0 | 1 | 0 | 0.001 | ↘ | 613 | 8 | 98.7 | 348 | 0 | 100 | 0.06 | → |
| E. faecium | 393 | 60 | 86.8 | 64 | 5 | 92.8 | 0.16 | → | 273 | 42 | 86.7 | 0 | 5 | 0 | 5.7 × 10⁻⁵ | ↘ | 120 | 18 | 87.0 | 64 | 0 | 100 | 0.001 | ↗ |
| E. coli | 4791 | 5771 | 45.4 | 1315 | 1398 | 48.5 | 0.004 | ↗ | 0 | 1892 | 0.0 | 0 | 1398 | 0 | 1.00 | → | 4791 | 3879 | 55.3 | 1315 | 0 | 100 | <2.2 × 10⁻¹⁶ | ↗ |
| K. oxytoca | 408 | 91 | 81.8 | 103 | 22 | 82.4 | 0.87 | → | 148 | 61 | 70.8 | 0 | 22 | 0 | 2.2 × 10⁻¹¹ | ↘ | 260 | 30 | 89.7 | 103 | 0 | 100 | 0.0001 | ↗ |
| K. pneumoniae | 1542 | 1047 | 59.6 | 484 | 231 | 67.7 | 7.7 × 10⁻⁵ | ↗ | 1027 | 373 | 73.4 | 484 | 0 | 100 | <2.2 × 10⁻¹⁶ | ↗ | 515 | 674 | 43.3 | 0 | 231 | 0 | <2.2 × 10⁻¹⁶ | ↘ |
| M. morganii | 285 | 52 | 84.6 | 81 | 14 | 85.3 | 0.87 | → | 180 | 38 | 82.6 | 0 | 14 | 0 | 1.8 × 10⁻¹⁰ | ↘ | 105 | 14 | 88.2 | 81 | 0 | 100 | 0.001 | ↗ |
| P. mirabilis | 532 | 411 | 56.4 | 177 | 99 | 64.1 | 0.02 | ↗ | 154 | 287 | 34.9 | 0 | 0 | - | - | → | 378 | 124 | 75.3 | 177 | 99 | 64.1 | 0.001 | ↘ |
| P. aeruginosa | 1343 | 1055 | 56.0 | 432 | 234 | 64.9 | 4.2 × 10⁻⁵ | ↗ | 901 | 637 | 58.6 | 0 | 234 | 0 | <2.2 × 10⁻¹⁶ | ↘ | 442 | 418 | 51.4 | 432 | 0 | 100 | 0.001 | ↗ |
| S. marcescens | 304 | 8 | 97.4 | 119 | 7 | 94.4 | 0.15 | → | 191 | 6 | 97.0 | 0 | 7 | 0 | 6.5 × 10⁻¹⁰ | ↘ | 113 | 2 | 98.3 | 119 | 0 | 100 | 0.24 | → |
| S. aureus | 4458 | 486 | 90.2 | 31 | 2 | 93.9 | 0.77 | → | 1455 | 154 | 90.4 | 0 | 0 | - | - | → | 3003 | 332 | 90.0 | 31 | 2 | 93.9 | 0.77 | → |
| S. agalactiae | 770 | 43 | 94.7 | 123 | 5 | 96.1 | 0.51 | → | 253 | 0 | 100 | 0 | 0 | - | - | → | 517 | 43 | 92.3 | 123 | 5 | 96.1 | 0.17 | → |
Publisher’s Note: MDPI stays neutral with regard to jurisdictional claims in published maps and institutional affiliations. |
© 2021 by the authors. Licensee MDPI, Basel, Switzerland. This article is an open access article distributed under the terms and conditions of the Creative Commons Attribution (CC BY) license (https://creativecommons.org/licenses/by/4.0/).
Share and Cite
Kaba, L.; Giraud-Gatineau, A.; Jimeno, M.-T.; Rolain, J.-M.; Colson, P.; Raoult, D.; Chaudet, H. Consequences of the COVID-19 Outbreak Lockdown on Non-Viral Infectious Agents as Reported by a Laboratory-Based Surveillance System at the IHU Méditerranée Infection, Marseille, France. J. Clin. Med. 2021, 10, 3210. https://doi.org/10.3390/jcm10153210
Kaba L, Giraud-Gatineau A, Jimeno M-T, Rolain J-M, Colson P, Raoult D, Chaudet H. Consequences of the COVID-19 Outbreak Lockdown on Non-Viral Infectious Agents as Reported by a Laboratory-Based Surveillance System at the IHU Méditerranée Infection, Marseille, France. Journal of Clinical Medicine. 2021; 10(15):3210. https://doi.org/10.3390/jcm10153210
Chicago/Turabian StyleKaba, Lanceï, Audrey Giraud-Gatineau, Marie-Thérèse Jimeno, Jean-Marc Rolain, Philippe Colson, Didier Raoult, and Hervé Chaudet. 2021. "Consequences of the COVID-19 Outbreak Lockdown on Non-Viral Infectious Agents as Reported by a Laboratory-Based Surveillance System at the IHU Méditerranée Infection, Marseille, France" Journal of Clinical Medicine 10, no. 15: 3210. https://doi.org/10.3390/jcm10153210