
Non-Invasive Indirect Markers of Liver Fibrosis after Interferon-Free Treatment for Hepatitis C

 ,
,
Abstract
:1. Introduction
2. Materials and Methods
2.1. Patients
2.2. Blood Sampling
2.3. Diagnosis
2.4. Treatment
2.5. Laboratory Testing
- APRI = (AST [IU/L]/ULN)/(PLT [109/L]) * 100 [9]
- *ULN, AST upper level of normal (50 IU/L)
- GAPRI = (GGT [IU/L]/ULN/(PLT [109/L]) * 100 [10]
- *ULN, GGT upper level of normal (40 IU/L for women, 75 IU/L for men)
- FIB-4 = (age [y] * AST [IU/L])/(PLT [109/L] * √(ALT [IU/L]) [11]
- Forn’s index = 7.811 − 3.131 ln (PLT [109/L]) + 0.781 ln (GGT [IU/L]) + 3.467 ln (age) − 0.014 (cholesterol [mg/dL]) [12]
- AP index = age [y] + PLT (age: <30 = 0; 30–39 = 1; 40–49 = 2; 50–59 = 3; 60–69 = 4; ≥70 = 50, PLT [× 109/L]: ≥225 = 0; 200–224 = 1; 175–199 = 2; 150–174 = 3; 125–149 = 4; <125 = 5) [13]
- HUI score = 3.138 + 0.167 × BMI + 0.088 × bilirubin [mg/dL] − 0.151 × albumin [g/dL] − 0.019 × PLT [109/L] [14].
2.6. Detection and Quantification of HCV RNA
2.7. Statistical Analysis
3. Results
4. Discussion
5. Conclusions
Author Contributions
Funding
Institutional Review Board Statement
Informed Consent Statement
Data Availability Statement
Conflicts of Interest
Abbreviations
References
- Bertino, G.; Ardiri, A.; Proiti, M.; Rigano, G.; Frazzetto, E.; Demma, S.; Ruggeri, M.I.; Scuderi, L.; Malaguarnera, G.; Bertino, N.; et al. Chronic hepatitis C: This and the new era of treatment. World J. Hepatol. 2016, 8, 92–106. [Google Scholar] [CrossRef]
- Ahmed, H.; Abushouk, A.I.; Menshawy, A.; Mohamed, A.; Negida, A.; Loutfy, S.A.; Abdel-Daim, M.M. Safety and Efficacy of Ombitasvir/Paritaprevir/Ritonavir and Dasabuvir with or without Ribavirin for Treatment of Hepatitis C Virus Genotype 1: A Systematic Review and Meta-analysis. Clin. Drug. Investig. 2017, 37, 1009–1023. [Google Scholar] [CrossRef]
- ASLD/IDSA HCV guidance panel. Hepatitis C guidance: AASLD-IDSA recommendations for testing, managing, and treating adults infected with hepatitis C virus. Hepatology 2015, 62, 932–954. [Google Scholar] [CrossRef] [Green Version]
- AbbVie Corporation. Product Monograph Including Patient Medication Information PrHOLKIRA™ PAK. AbbVie Corporation. 2016. Available online: http://www.abbvie.ca/content/dam/abbviecorp/ca/english/docs/HOLKIRA_PAK_PM_EN.pdf (accessed on 22 April 2016).
- EMA. EMA Committee for Medicinal Products for Human Use (CHMP) Assessment Report. Exviera. International Non-Proprietary Name: Dasabuvir. Procedure No. EMEA/H/C/003837/0000. Available online: http://www.ema.europa.eu/docs/en_GB/document_library/EPAR_-_Public_assessmen (accessed on 17 April 2016).
- European Association for the Study of the Liver. EASL recommendations on treatment of hepatitis C 2018. J. Hepatol. 2018, 69, 461–511. [Google Scholar] [CrossRef] [Green Version]
- Cadranel, J.F.; Rufat, P.; Degos, F. Practices of liver biopsy in France: Results of a prospective nationwide survey. For the Group of Epidemiology of the French Association for the Study of the Liver (AFEF). Hepatology 2000, 32, 477–481. [Google Scholar] [CrossRef]
- Stauber, R.E.; Lackner, C. Noninvasive diagnosis of hepatic fibrosis in chronic hepatitis C. World J. Gastroenterol. 2007, 13, 4287–4294. [Google Scholar] [CrossRef]
- Wai, C.T.; Greenson, J.K.; Fontana, R.J.; Kalbfleisch, J.D.; Marrero, J.A.; Conjeevaram, H.S.; Lok, A.S. A simple noninvasive index can predict both significant fibrosis and cirrhosis in patients with chronic hepatitis C. Hepatology 2003, 38, 518–526. [Google Scholar] [CrossRef] [PubMed] [Green Version]
- Vardar, R.; Vardar, E.; Demiri, S.; Sayhan, S.E.; Bayol, U.; Yildiz, C.; Postaci, H.; Vardar, E.; Demiri, S.; Sayhan, S.E.; et al. Is there any non-invasive marker replace the needle liver biopsy predictive for liver fibrosis, in patients with chronic hepatitis. Hepatogastroenterology 2009, 56, 1459–1465. [Google Scholar]
- Vallet Pichard, A.; Mallet, V.; Nalpas, B.; Verkarre, V.; Nalpas, A.; Dhalluin Venier, V.; Fontaine, H.; Pol, S. FIB-4: An inexpensive and accurate marker of fibrosis in HCV infection. Comparison with liver biopsy and Fibrotest. Hepatology 2007, 46, 32–36. [Google Scholar] [CrossRef]
- Forns, X.; Ampurdanes, S.; Llovet, J.M.; Aponte, J.; Quinto, L.; Martinez-Bauer, E.; Bruguera, M.; Sanchez-Tapias, J.M.; Rodes, J. Identification of chronic hepatits C patients without hepatic fibrosis by a simple predictive model. Hepatology 2002, 4, 987–992. [Google Scholar]
- Poynard, T.; Bedossa, P. Age and platelet count: A simple index for predicting the presence of histological lesions in patients with antibodies to hepatitis C virus. METAVIR and CLINIVIR Cooperative Study Groups. J. Viral. Hepatol. 1997, 4, 199–208. [Google Scholar] [CrossRef]
- Hui, A.Y.; Chan, H.L.; Wong, V.W.; Liew, C.T.; Chim, A.M.; Chan, F.K.; Sung, J.J. Identification of chronic hepatitis B patients without significant liver fibrosis by a simple noninvasive predictive model. Am. J. Gastroenterol. 2005, 100, 616–623. [Google Scholar] [CrossRef]
- Spycher, C.; Zimmermann, A.; Reichen, J. The diagnostic value of liver biopsy. BMC Gastroenterol. 2001, 1, 12. [Google Scholar] [CrossRef] [Green Version]
- Poynard, T.; Munteanu, M.; Imbert-Bismut, F.; Charlotte, F.; Thabut, D.; Le Calvez, S.; Messous, D.; Thibault, V.; Benhamou, Y.; Moussalli, J.; et al. Prospective analysis of discordant results between biochemical markers and biopsy in patients with chronic hepatitis C. Clin. Chem. 2004, 50, 1344–1355. [Google Scholar] [CrossRef] [Green Version]
- Sandrin, L.; Fourquet, B.; Hasquenoph, J.M.; Yon, S.; Fournier, C.; Mal, F.; Christidis, C.; Ziol, M.; Poulet, B.; Kazemi, F.; et al. Transient elastography: A new noninvasive method for assessment of hepatic fibrosis. Ultrasound Med. Biol. 2003, 29, 1705–1713. [Google Scholar] [CrossRef]
- Shaheen, A.A.; Wan, A.F.; Myers, R.P. FibroTest and FibroScan for the prediction of hepatitis C-related fibrosis: A systematic review of diagnostic test accuracy. Am. J. Gastroenterol. 2007, 102, 2589–2600. [Google Scholar] [CrossRef] [PubMed]
- Parkes, J.; Guha, I.N.; Harris, S.; Rosenberg, W.M.; Roderick, P.J. Systematic review of the diagnostic performance of serum markers of liver fibrosis in alcoholic liver disease. Comp. Hepatol. 2012, 11, 5. [Google Scholar] [CrossRef] [PubMed] [Green Version]
- Pessoa, M.G.; Ramalho-Madruga, J.V.; Alves, K.; Nunes, E.P.; Cheinquer, H.; Brandão-Mello, C.E.; Mendes-Correa, M.C.; Ferraz, M.L.; Ferreira, P.R.A.; Álvares-da-Silva, M.R.; et al. Efficacy and Safety of Ombitasvir/Paritaprevir/Ritonavir and Dasabuvir ± Ribavirin for HCV in Brazilian Adults with Advanced Fibrosis. Ann. Hepatol. 2018, 17, 959–968. [Google Scholar] [CrossRef]
- Badri, P.S.; King, J.R.; Polepally, A.R.; McGovern, B.H.; Dutta, S.; Menon, R.M. Dosing Recommendations for Concomitant Medications During 3D Anti-HCV Therapy. Clin. Pharmacokinet. 2016, 55, 275–295. [Google Scholar] [CrossRef] [Green Version]
- Poordad, F.; Nelson, D.R.; Feld, J.J.; Fried, M.W.; Wedemeyer, H.; Larsen, L.; Cohen, D.E.; Cohen, E.; Mobashery, N.; Tatsch, F.; et al. Safety of the 2D/3D direct-acting antiviral regimen in HCV-induced Child-Pugh A cirrhosis—A pooled analysis. J. Hepatol. 2017, 67, 700–707. [Google Scholar] [CrossRef] [Green Version]
- Leung, D.H.; Wirth, S.; Yao, B.B.; Viani, R.M.; Gonzalez-Peralta, R.P.; Jonas, M.M.; Lobritto, S.J.; Narkewicz, M.R.; Sokal, E.; Fortuny, C.; et al. Ombitasvir/Paritaprevir/Ritonavir with or Without Dasabuvir and With or Without Ribavirin for Adolescents With HCV Genotype 1 or 4. Hepatol. Commun. 2018, 2, 1311–1319. [Google Scholar] [CrossRef] [PubMed] [Green Version]
- Gökcan, H.; Kuzu, U.B.; Öztaş, E.; Saygılı, F.; Öztuna, D.; Suna, N.; Tenlik, İ.; Akdoğan, M.; Kaçar, S.; Kılıç, Z.M.; et al. The predictive value of noninvasive serum markers of liver fibrosis in patients with chronic hepatitis C. Turk. J. Gastroenterol. 2016, 27, 156–164. [Google Scholar] [CrossRef] [PubMed] [Green Version]
- Sahin, T.; Serin, A.; Emek, E.; Bozkurt, B.; Arikan, B.T.; Tokat, Y. Effectiveness of Noninvasive Fibrosis Markers for the Prediction of Hepatocellular Carcinoma in Chronic Hepatitis B and Chronic Hepatitis B+D Induced Cirrhosis. Transplant. Proc. 2019, 51, 2397–2402. [Google Scholar] [CrossRef]
- Arena, U.; Vizzutti, F.; Abraldes, J.G.; Corti, G.; Stasi, C.; Moscarella, S.; Milani, S.; Lorefice, E.; Petrarca, A.; Romanelli, R.G.; et al. Reliability of transient elastography for the diagnosis of advanced fibrosis in chronic hepatitis C. Gut 2008, 57, 1288–1293. [Google Scholar] [CrossRef] [PubMed] [Green Version]


| Sex/ Week of Treatment | Treatment | Median | Minimum | Maximum | p | |
|---|---|---|---|---|---|---|
| Sex | Women n = 32 | Experienced | 62 | 35 | 69 | 0.056 |
| Naïve | 46 | 27 | 74 | |||
| Men n = 38 | Experienced | 50 | 30 | 81 | 0.399 | |
| Naïve | 43 | 24 | 77 | |||
| BMI [kg/m2] | Women n = 32 | Experienced | 27.0 | 22.5 | 43.1 | 0.027 * |
| Naïve | 23.6 | 20.4 | 30.8 | |||
| Men n = 38 | Experienced | 26.2 | 12.9 | 30.5 | 0.690 | |
| Naïve | 26.0 | 22,3 | 33.6 | |||
| Viremia [IU/mL] | 0 | Experienced | 853,000 | 20,300 | 8,507,396 | 0.917 a |
| 12 | ND | ND | ND | |||
| 0 | Naïve | 943,000 | 31 | 111,400,000 | ||
| 12 | ND | ND | ND | |||
| FibroScan [kPa] | 0 | Experienced | 8.4 | 3.7 | 32.8 | 0.273 a 0.043 b,* |
| 12 | 7.0 | 3.3 | 44.3 | |||
| 0 | Naïve | 6.6 | 2.8 | 69.1 | 0.081 b 0.390 c | |
| 12 | 6.6 | 3.5 | 36.3 |
| Treatment | Week | Median | Minimum | Maximum | p | |
|---|---|---|---|---|---|---|
| ALT [IU/L] | Experienced n = 31 | 0 | 60 | 14 | 94 | 0.000 * |
| 12 | 19 | 5 | 39 | |||
| Naïve n = 39 | 0 | 56 | 17 | 290 | 0.000 * | |
| 12 | 20 | 10 | 44 | |||
| AST [IU/L] | Experienced n = 31 | 0 | 47 | 26 | 96 | 0.000 * |
| 12 | 21 | 14 | 58 | |||
| Naïve n = 39 | 0 | 45 | 19 | 309 | 0.000 * | |
| 12 | 21 | 11 | 41 | |||
| GGT [IU/L] | Experienced n = 31 | 0 | 64 | 14 | 365 | 0.000 * |
| 12 | 25 | 10 | 70 | |||
| Naïve n = 39 | 0 | 47 | 11 | 215 | 0.000 * | |
| 12 | 19 | 9 | 32 | |||
| BIL [µmol/L] | Experienced n = 31 | 0 | 10.3 | 4.3 | 35.9 | 0.304 |
| 12 | 10.3 | 4.4 | 17.1 | |||
| Naïve n = 39 | 0 | 8.6 | 3.8 | 31.5 | 0.667 | |
| 12 | 7.7 | 4.4 | 41.7 | |||
| PLT [×109] | Experienced n = 31 | 0 | 189 | 64 | 450 | 0.299 |
| 12 | 187 | 44 | 427 | |||
| Naïve n = 39 | 0 | 216 | 37 | 431 | 0.002 * | |
| 12 | 229 | 64 | 409 | |||
| ALB [g/L] | Experienced n = 31 | 0 | 39 | 26.7 | 5 | 0.038 * |
| 12 | 43.0 | 36.0 | 47.8 | |||
| Naïve n = 39 | 0 | 39 | 31.6 | 48.4 | 0.346 | |
| 12 | 39 | 31.6 | 50 | |||
| CHOL [mmol/L] | Experienced n = 31 | 0 | 4.78 | 2.63 | 7.75 | 0.983 |
| 12 | 4.65 | 3.04 | 6.14 | |||
| Naïve n = 39 | 0 | 4.58 | 2.52 | 7.75 | 0.809 | |
| 12 | 4.58 | 2.73 | 7.02 |
| METAVIR Score | Week 0 n (%) | Week 12 n (%) |
|---|---|---|
| F0–F1 | 33 (47.1) | 42 (60) |
| F1 | 1 (1.4) | 5 (7.1) |
| F1–F2 | 8 (11.4) | 10 (14.3) |
| F2 | 4 (5.7) | 0 (0) |
| F2–F3 | 1 (1.4) | 0 (0) |
| F3 | 5 (7.1) | 5 (7.1) |
| F3–F4 | 1 (1.4) | 0 (0) |
| F4 | 15 (21.4) | 8 (11.4) |
| Total | 70 (100) | 70 (100) |
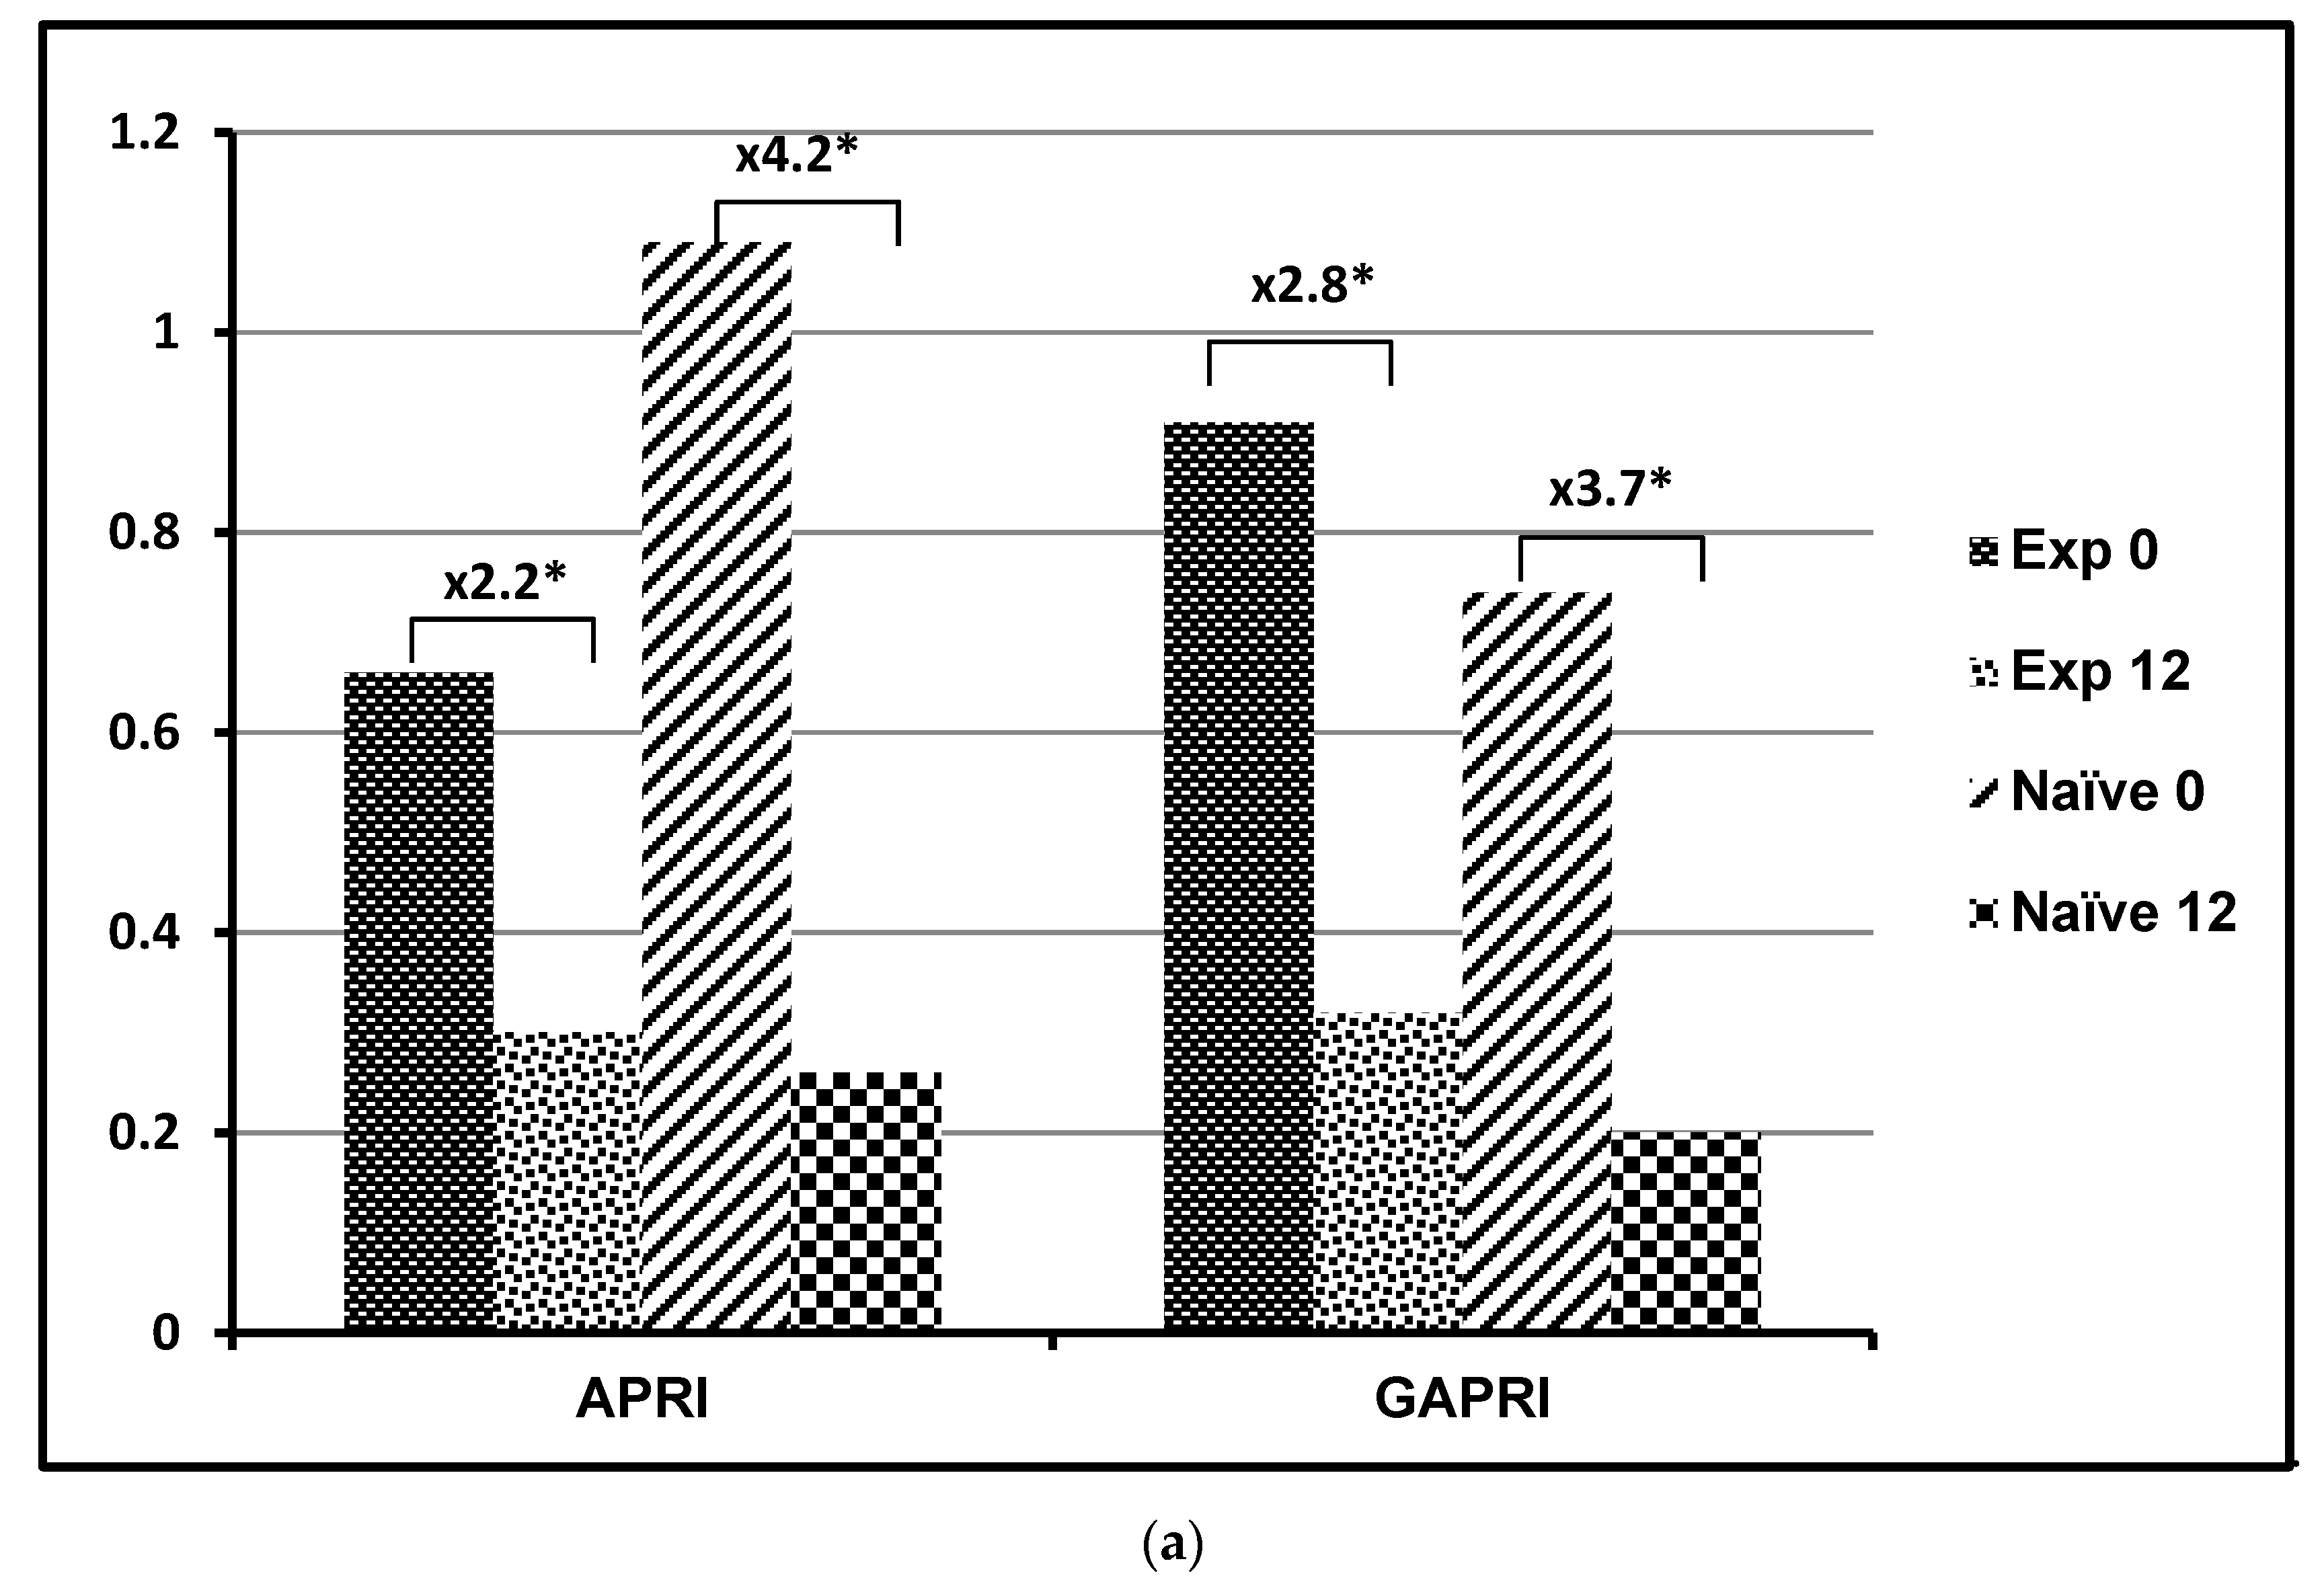
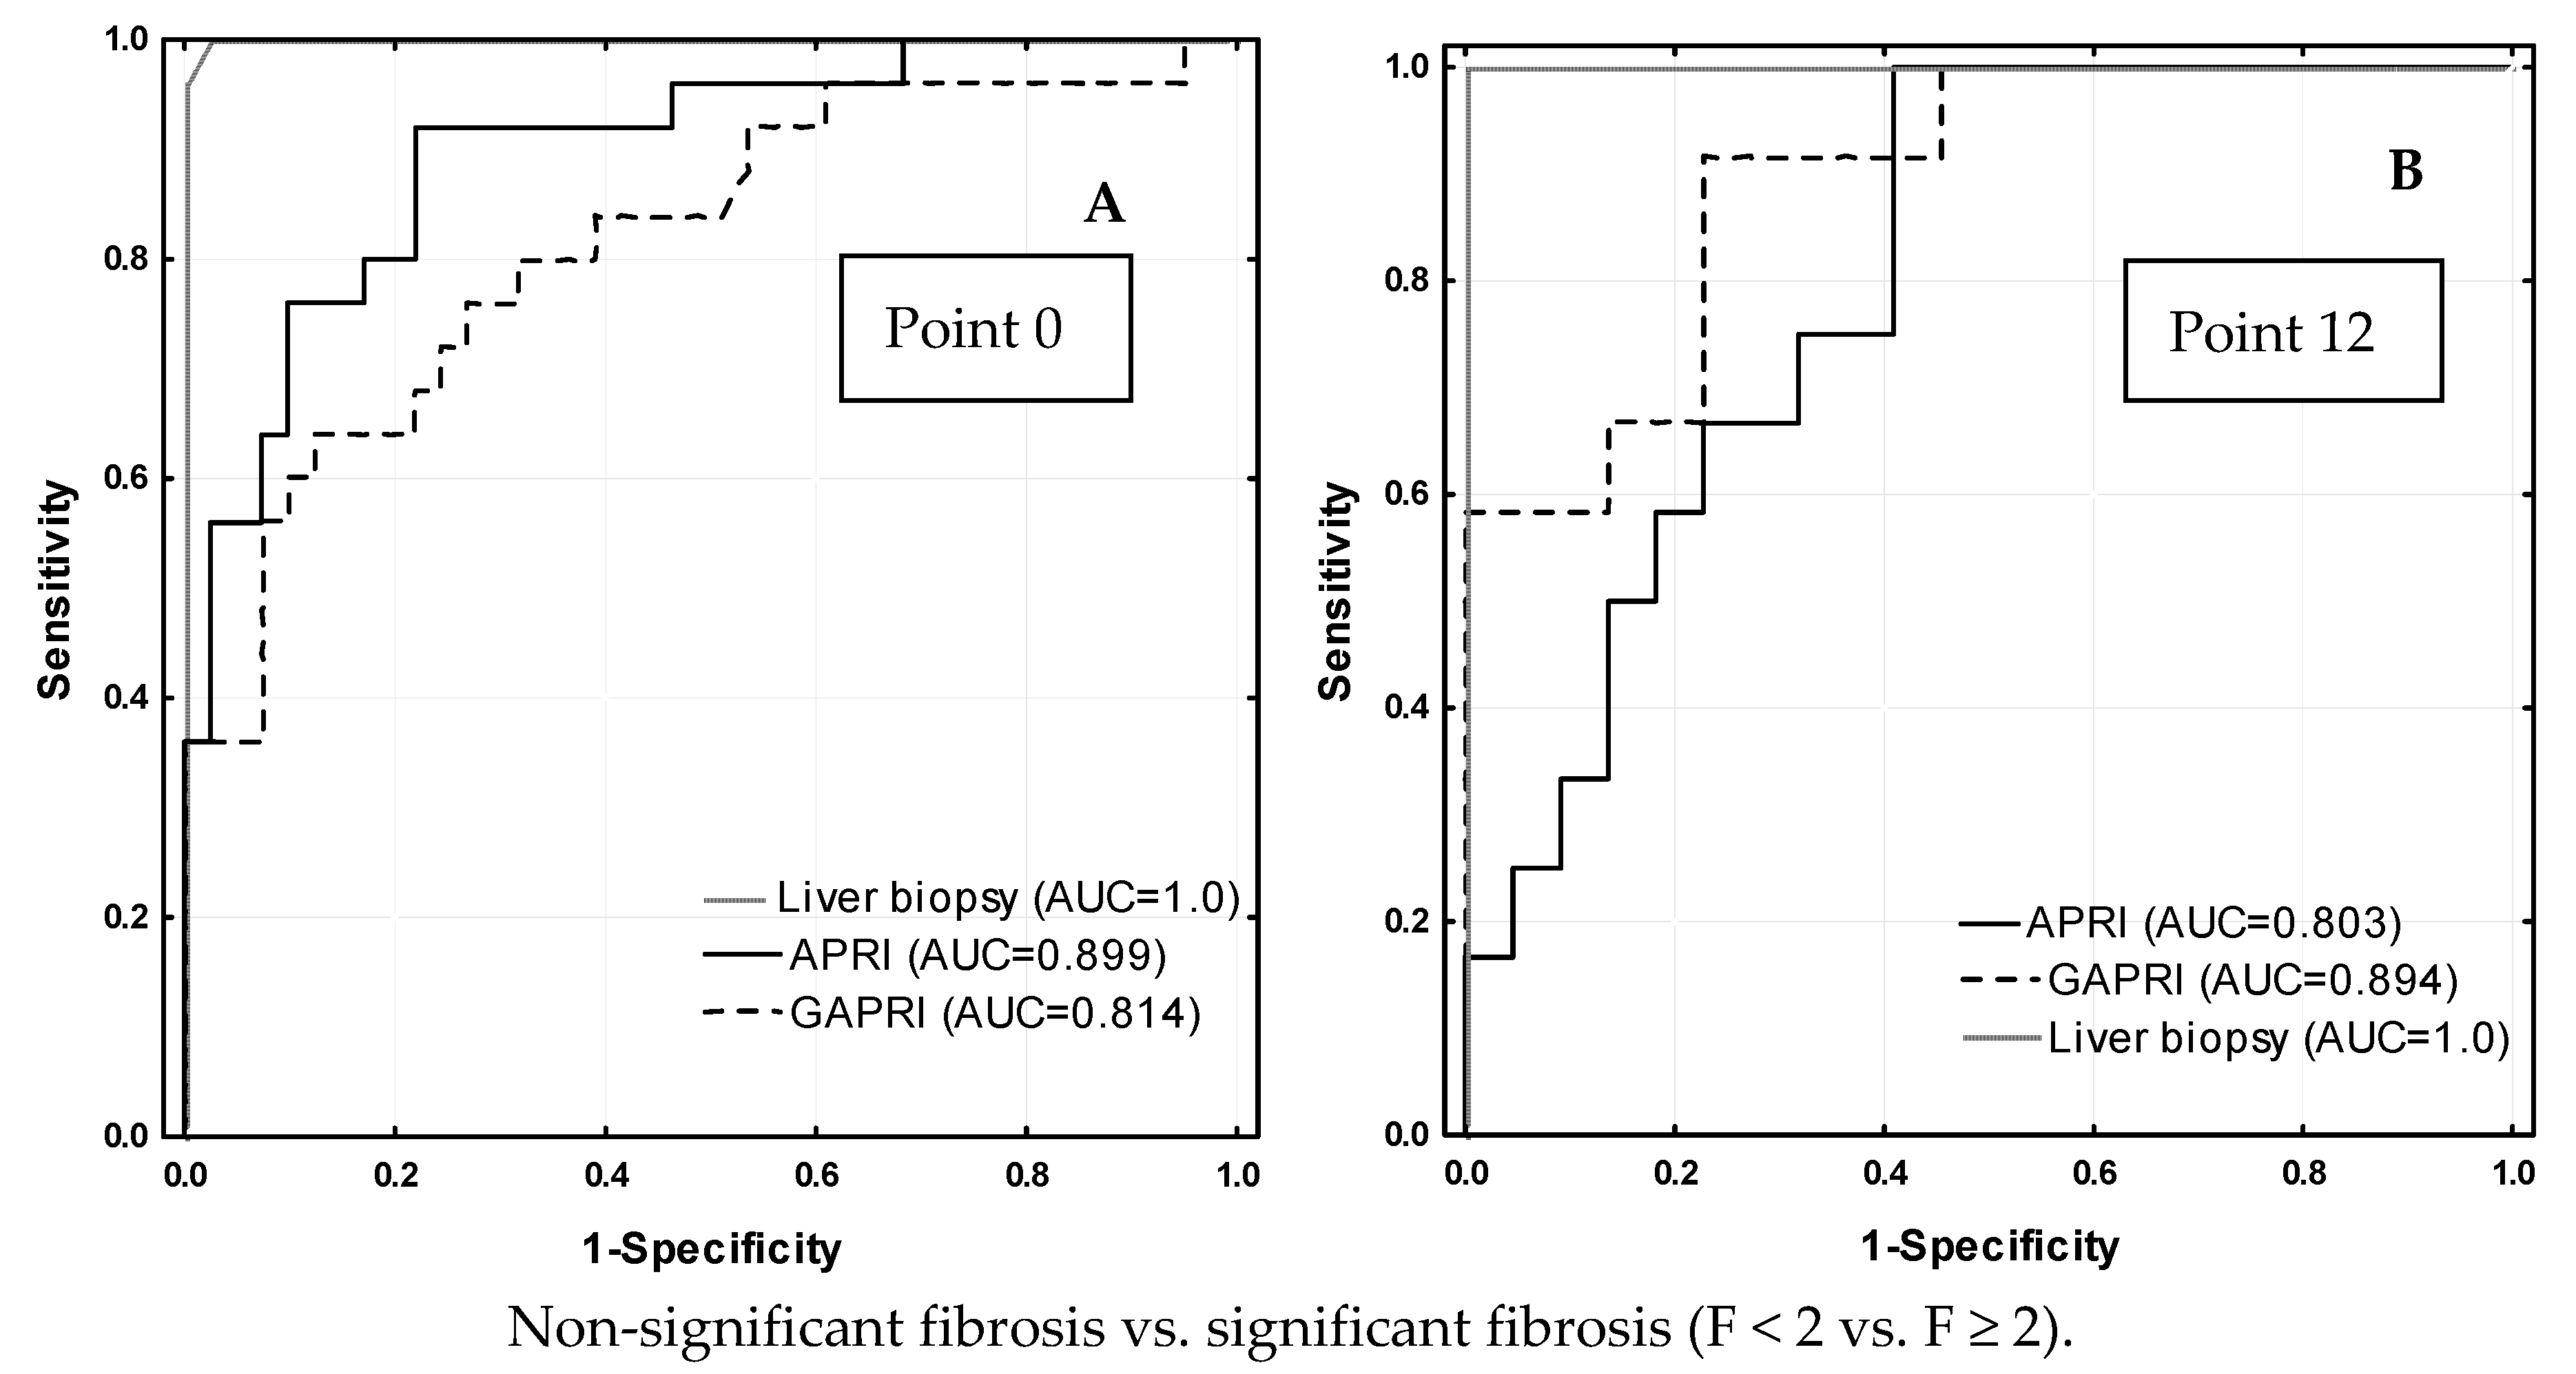
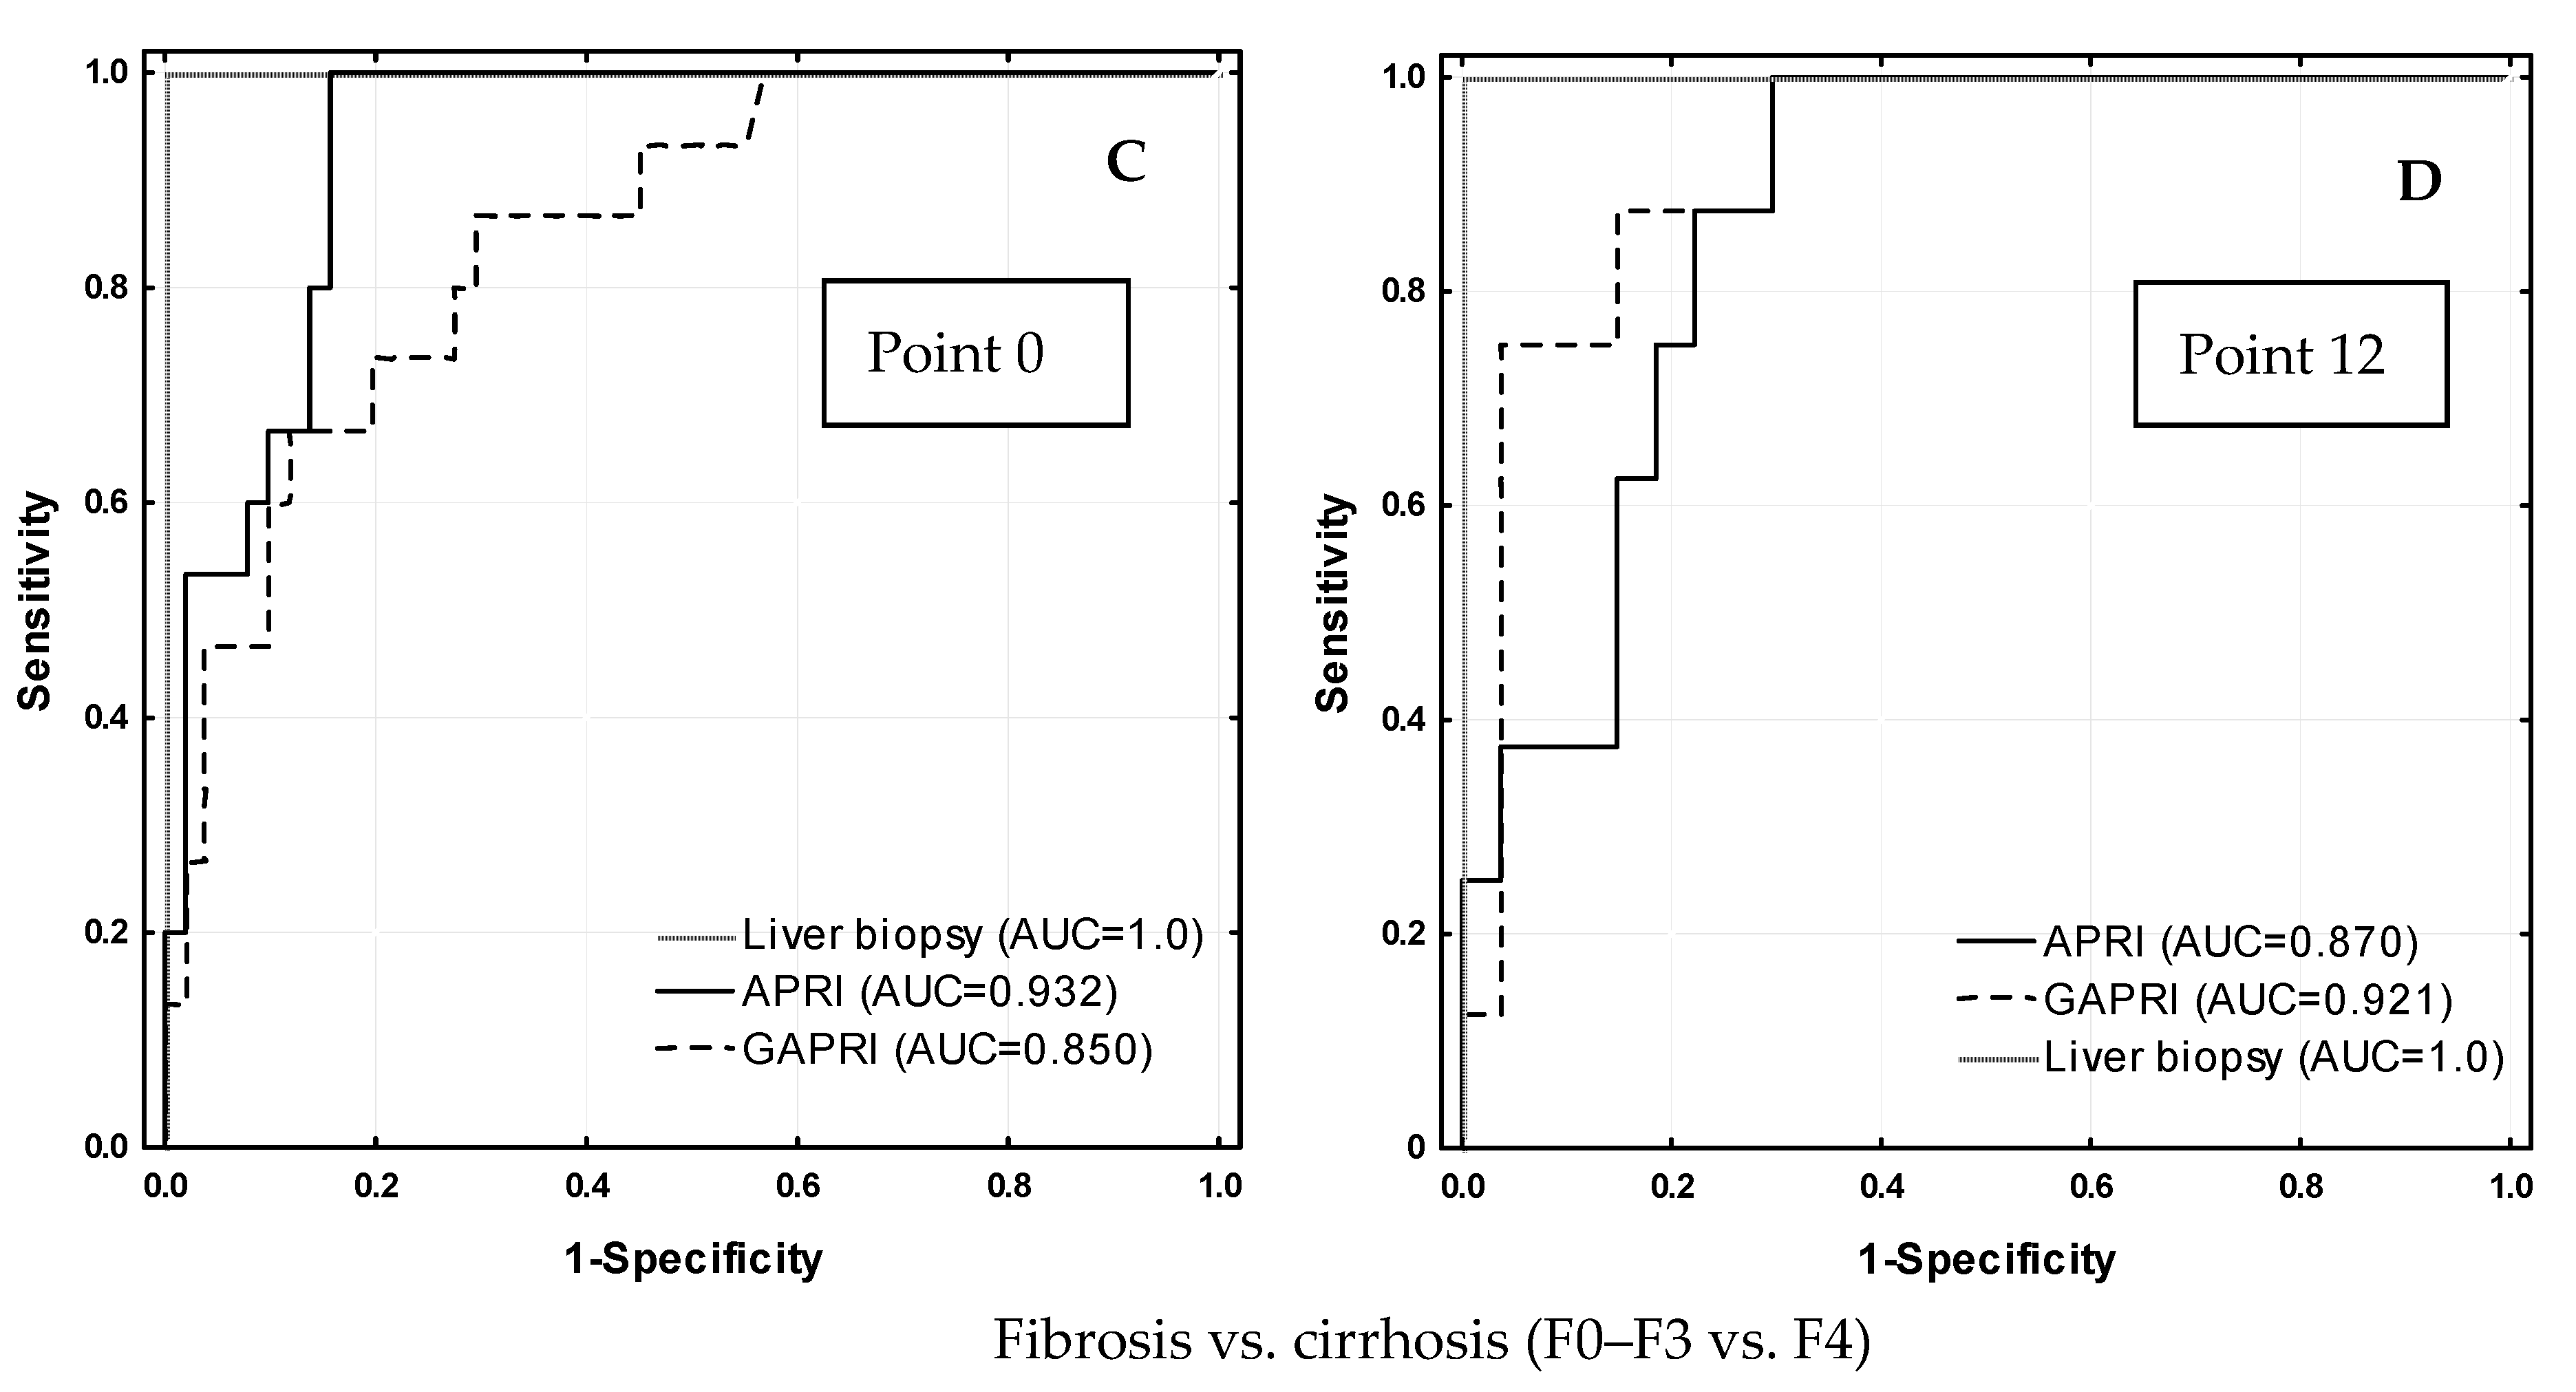
| Test | Treatment | Point 0 | Comparison 1 | Point 12 | Comparison 1 | Comparison 2 | Cut-Off [Ref.] |
|---|---|---|---|---|---|---|---|
| APRI | Experienced | 0.66 ± 0.53 | Z = −0.827 p = 0.408 | 0.30 ± 0.26 | Z = −1.382 p = 0.167 | p = 0.003 p = 0.007 | ≤0.5 [15] |
| Naïve | 1.09 ± 2.71 | 0.26 ± 0.25 | |||||
| GAPRI | Experienced | 0.91 ± 0.83 | Z = −0.943 p = 0.346 | 0.32 ± 0.36 | Z = −1.305 p = 0.192 | p < 0.001 p < 0.001 | 0.52 [16] |
| Naïve | 0.74 ± 0.77 | 0.19 ± 0.14 | |||||
| FIB-4 | Experienced | 2.48 ± 2.04 | Z = −1.459 p = 0.144 | 1.87 ± 1.63 | Z = −2.093 p = 0.036 * | p = 0.421 p = 0.234 | <1.45 [17] |
| Naïve | 2.80 ± 4.37 | 1.43 ± 1.28 | |||||
| AP index | Experienced | 5.32 ± 2.48 | Z = −2.014 p = 0.044 * | 5.17 ± 2.22 | Z = −2.519 p = 0.012 * | p = 0.704 p = 0.816 | <4 [18] |
| Naïve | 3.97 ± 2.81 | 3.59 ± 2.56 | |||||
| HUI | Experienced | 4.46 ± 2.37 | Z = −1.648 p = 0.100 | 4.22 ± 1.97 | Z = −1.795 p = 0.073 | p = 0.733 p = 1.0 | 5.54 [19] |
| Naïve | 3.67 ± 2.19 | 3.55 ± 2.47 | |||||
| FORNS | Experienced | 6.08 ± 2.00 | Z = −1.434 p = 0.152 | 5.32 ± 1.92 | Z = −2.196 p = 0.028 * | p = 0.517 p = 0.060 | <4.21 [20] |
| Naïve | 5.34 ± 2.62 | 4.19 ± 2.25 |
| Test | FibroScan at Point 0 | FibroScan at Point 12 |
|---|---|---|
| APRI | R = 0.744 * (p < 0.001) | R = 0.664 * (p < 0.001) |
| FIB-4 | R = 0.736 * (p < 0.001) | R = 0.611 * (p < 0.001) |
| FORNS | R = 0.704 * (p < 0.001) | R = 0.647 * (p < 0.001) |
| AP index | R = 0.643 * (p < 0.001) | R = 0.590 * (p < 0.001) |
| HUI | R = 0.662 * (p < 0.001) | R = 0.561 * (p = 0.001) |
| GAPRI | R = 0.509 * (p < 0.001) | R = 0.701 * (p < 0.001) |
Publisher’s Note: MDPI stays neutral with regard to jurisdictional claims in published maps and institutional affiliations. |
© 2021 by the authors. Licensee MDPI, Basel, Switzerland. This article is an open access article distributed under the terms and conditions of the Creative Commons Attribution (CC BY) license (https://creativecommons.org/licenses/by/4.0/).
Share and Cite
Przekop, D.; Klapaczynski, J.; Grytczuk, A.; Gruszewska, E.; Gietka, A.; Panasiuk, A.; Golaszewski, S.; Cylwik, B.; Chrostek, L. Non-Invasive Indirect Markers of Liver Fibrosis after Interferon-Free Treatment for Hepatitis C. J. Clin. Med. 2021, 10, 3951. https://doi.org/10.3390/jcm10173951
Przekop D, Klapaczynski J, Grytczuk A, Gruszewska E, Gietka A, Panasiuk A, Golaszewski S, Cylwik B, Chrostek L. Non-Invasive Indirect Markers of Liver Fibrosis after Interferon-Free Treatment for Hepatitis C. Journal of Clinical Medicine. 2021; 10(17):3951. https://doi.org/10.3390/jcm10173951
Chicago/Turabian StylePrzekop, Dagmara, Jakub Klapaczynski, Agnieszka Grytczuk, Ewa Gruszewska, Andrzej Gietka, Anatol Panasiuk, Slawomir Golaszewski, Bogdan Cylwik, and Lech Chrostek. 2021. "Non-Invasive Indirect Markers of Liver Fibrosis after Interferon-Free Treatment for Hepatitis C" Journal of Clinical Medicine 10, no. 17: 3951. https://doi.org/10.3390/jcm10173951
APA StylePrzekop, D., Klapaczynski, J., Grytczuk, A., Gruszewska, E., Gietka, A., Panasiuk, A., Golaszewski, S., Cylwik, B., & Chrostek, L. (2021). Non-Invasive Indirect Markers of Liver Fibrosis after Interferon-Free Treatment for Hepatitis C. Journal of Clinical Medicine, 10(17), 3951. https://doi.org/10.3390/jcm10173951