Abstract
Fetal growth restriction has been associated with an increased risk of adverse perinatal outcomes (APOs). We determined the importance of fetal growth detention (FGD) in late gestation for the occurrence of APOs in small-for-gestational-age (SGA) and appropriate-for-gestational-age (AGA) newborns. For this purpose, we analyzed a retrospective cohort study of 1067 singleton pregnancies. The newborns with higher APOs were SGA non-FGD and SGA FGD in 40.9% and 31.5% of cases, respectively, and we found an association between SGA non-FGD and any APO (OR 2.61; 95% CI: 1.35–4.99; p = 0.004). We did not find an increased APO risk in AGA FGD newborns (OR: 1.13, 95% CI: 0.80, 1.59; p = 0.483), except for cesarean delivery for non-reassuring fetal status (NRFS) with a decrease in percentile cutoff greater than 40 (RR: 2.41, 95% CI: 1.11–5.21) and 50 (RR: 2.93, 95% CI: 1.14–7.54). Conclusions: Newborns with the highest probability of APOs are SGA non-FGDs. AGA FGD newborns do not have a higher incidence of APOs than AGA non-FGDs, although with falls in percentile cutoff over 40, they have an increased risk of cesarean section due to NRFS. Further studies are warranted to detect these newborns who would benefit from close surveillance in late gestation and at delivery.
1. Introduction
Identifying newborns who have experienced intrauterine growth restriction is one of the greatest challenges in modern perinatology. The term fetal growth restriction (FGR) is used to define those newborns who have not reached their optimal intrauterine growth potential, and FGR can occur from the early to final stages of pregnancy [1,2,3] due to placental insufficiency [1,2,4,5,6]. It is estimated that 1 of every 10 pregnancies could present FGR and up to 20% in underdeveloped countries [7,8]. FGR is associated with increased rates of stillbirth, neonatal morbidity, and mortality [9,10,11,12]. In addition, individuals who have undergone FGR have poor long-term health outcomes, including risk of impaired neurodevelopment and a deterioration of cognitive abilities, a higher incidence of persistent short stature in childhood and adolescence, and cardiovascular and endocrine diseases in adulthood [13,14,15,16]. Correct identification of FGR can improve pregnancy surveillance [17,18] and the adequate treatment of associated complications, such as hypothermia or hypoglycemia, thereby improving long-term outcomes. [5].
The term small for gestational age (SGA) is usually used to refer to newborns whose birthweight is lower than the 10th centile [19,20]. Although most FGRs are SGA at delivery, some demographic factors, such as maternal age, parity, ethnicity, or body mass index, can be related to weight and height at birth [21,22], so SGA does not necessarily imply a pathological condition. Up to 70% are constitutionally small but healthy fetuses; that is, they have reached their full potential for intrauterine growth and are not at high risk of perinatal morbidity and mortality [23]. By applying the SGA definition, small but healthy newborns can be subjected to unnecessary interventions [5], as constitutionally small ones will be over diagnosed with SGA, and FGR will be underdiagnosed in fetuses with an estimated fetal weight (EFW) > 10th percentile [2].
Moreover, it has been postulated that some newborns with a weight percentile between 10 and 90 who have not reached their growth potential are actually FGR and are at increased risk of adverse outcomes [24]. Akolekar et al. observed that although the incidence of perinatal side effects is higher in SGA, most adverse perinatal outcomes occurred in AGAs [25].
Thus, fetal growth detention (FGD) has been considered as a reduction in EFW by 20 or more percentiles during the third trimester of pregnancy [26]. This cutoff point, or a higher one (30), has been taken in other studies, although with an interval of 6–8 weeks in the 3rd trimester, [26,27,28] or between the 2nd and 3rd trimester [29].
The present study determined whether newborns appropriate for gestational age (AGA) who have suffered FGD, defined as a reduction in estimated fetal growth by a decrease of 20 or more centiles between the 35th gestational week and delivery, had similar APOs to those diagnosed with SGA.
2. Materials and Methods
2.1. Study Design
The GROWth declINing Newborns (GROWIN) study was an observational, retrospective cohort study of births assisted at the Villalba University General Hospital between January 2015 and June 2017. Follow-up of the newborns included fetal growth up to delivery and their evolution in the first two years after delivery. The study was approved by the Clinical Research Ethics Committee of Fundación Jimenez Díaz (Madrid, Spain) (EO090-19_HGV) and the Central Research Commission of Primary Care Management (23/19).
The inclusion criteria were as follows: (i) live singleton pregnancies controlled in our center from the first trimester of gestation, (ii) fetal ultrasound assessment at gestational age of 35 (range 34–37) weeks; and (iii) deliveries between 37 and 42 weeks of gestational age with fetuses without structural malformations, chromosomal abnormalities, or metabolic diseases. This study followed the Strengthening the Reporting of Observational Studies in Epidemiology (STROBE) guidelines for cohort studies [30].
The variables collected in the study were maternal age, weight, height, and body mass index (BMI) at the beginning of pregnancy and parity, pregnancy and fetal pathology, type of delivery, cause of instrumental deliveries or cesarean sections. The last menstrual period was adjusted by the first trimester ultrasound [31] and an ultrasound screening was performed at 35 weeks (range 34–37 weeks) using either an ultrasound machine Voluson E8 (General Electric, Healthcare, Zipf, Austria) or a Toshiba Aplio500 (Toshiba Corporation, Tokio, Japan). EFW was calculated with the Hadlock et al. formula including biparietal diameter (BPD), head circumference (HC), abdominal circumference (AC), and femur length (FL) measurements [32]. The estimated percentile weight by ultrasound was calculated with a Spanish intrauterine growth standard [22] and the birthweight percentiles using a growth reference for the Spanish population [33]
We also collected perinatal outcomes to analyze APOs defined as the occurrence of 5 min Apgar score ≤ 7, arterial cord blood pH ≤ 7.10, instrumental or cesarean delivery for NRFS, basic and advanced neonatal resuscitation admission at birth in neonatal intensive care unit (NICU) due to asphyxia, sepsis, respiratory distress syndrome, and transient tachypnea. In addition, we collected newborn gender and somatometry at birth (birthweight, height, and cephalic circumference).
2.2. Study Groups
We considered the following patient groups based on percentile birthweight: (i) SGA newborns, those with a birthweight below the 10th percentile in the population of reference charts for that specific gestational age, with no fetal growth detention (SGA non-FGD); (ii) SGA newborns with fetal growth detention (SGA FGD) determined by a decrease of 20 or more centiles with respect to the estimated percentile weight in the third trimester ultrasound reflecting a fall in growth trajectory; (iii) appropriate-for-gestational-age (AGA), those with a birthweight between the 10th and 90th percentile, with no fetal growth detention (AGA non-FGD); (iv) AGA newborns with fetal growth detention (AGA FGD); and (v) large-for-gestational-age (LGA), defined as a birthweight above the 90th percentile.
2.3. Statistical Analyses
Data were extracted, and quantitative variables were described by medians and interquartile ranges (p25th–p75th), and qualitative variables were described by frequencies and percentages. Comparisons of quantitative variables were performed using the Mann–Whitney test when comparing two groups, or the Kruskal–Wallis test when comparing three or more groups. Qualitative variables were compared using the Chi-square test or the Fisher’s exact test. The predictive ability of AGA FGD newborns to diagnose APOs was analyzed using the area under receiver operating characteristics (ROC) curve and a threshold was sought for a specificity of 90%. A sensitivity (detection rate) of 10% was established for false positive rates (FPR). The percentile threshold point corresponding to the FPR values was also calculated.
The association between the five study groups and the presence of APOs was analyzed using univariate logistic regression models. In addition, we analyzed independent association using multivariate analysis adjusted by nulliparity, maternal BMI, hypertension, and diabetes. The models were summarized by the odds ratio, its 95% confidence interval and the p-value. The AGA non-FGD group was taken as a reference category for the odds ratio calculation.
Moreover, we explored how a greater decrease in percentile for the AGA FGD group could increase the risk ratio of APOs. We calculated the relative risk with a confidence interval at 95% for three decreases in percentile cutoffs (of 30, 40, and 50 centiles).
The significance level was set at 0.05 for all comparisons. Statistical analyses were performed using R v. 4.0.0 programming language (The R Foundation for Statistical Computing, Vienna, Austria).
3. Results
3.1. Descriptive Results
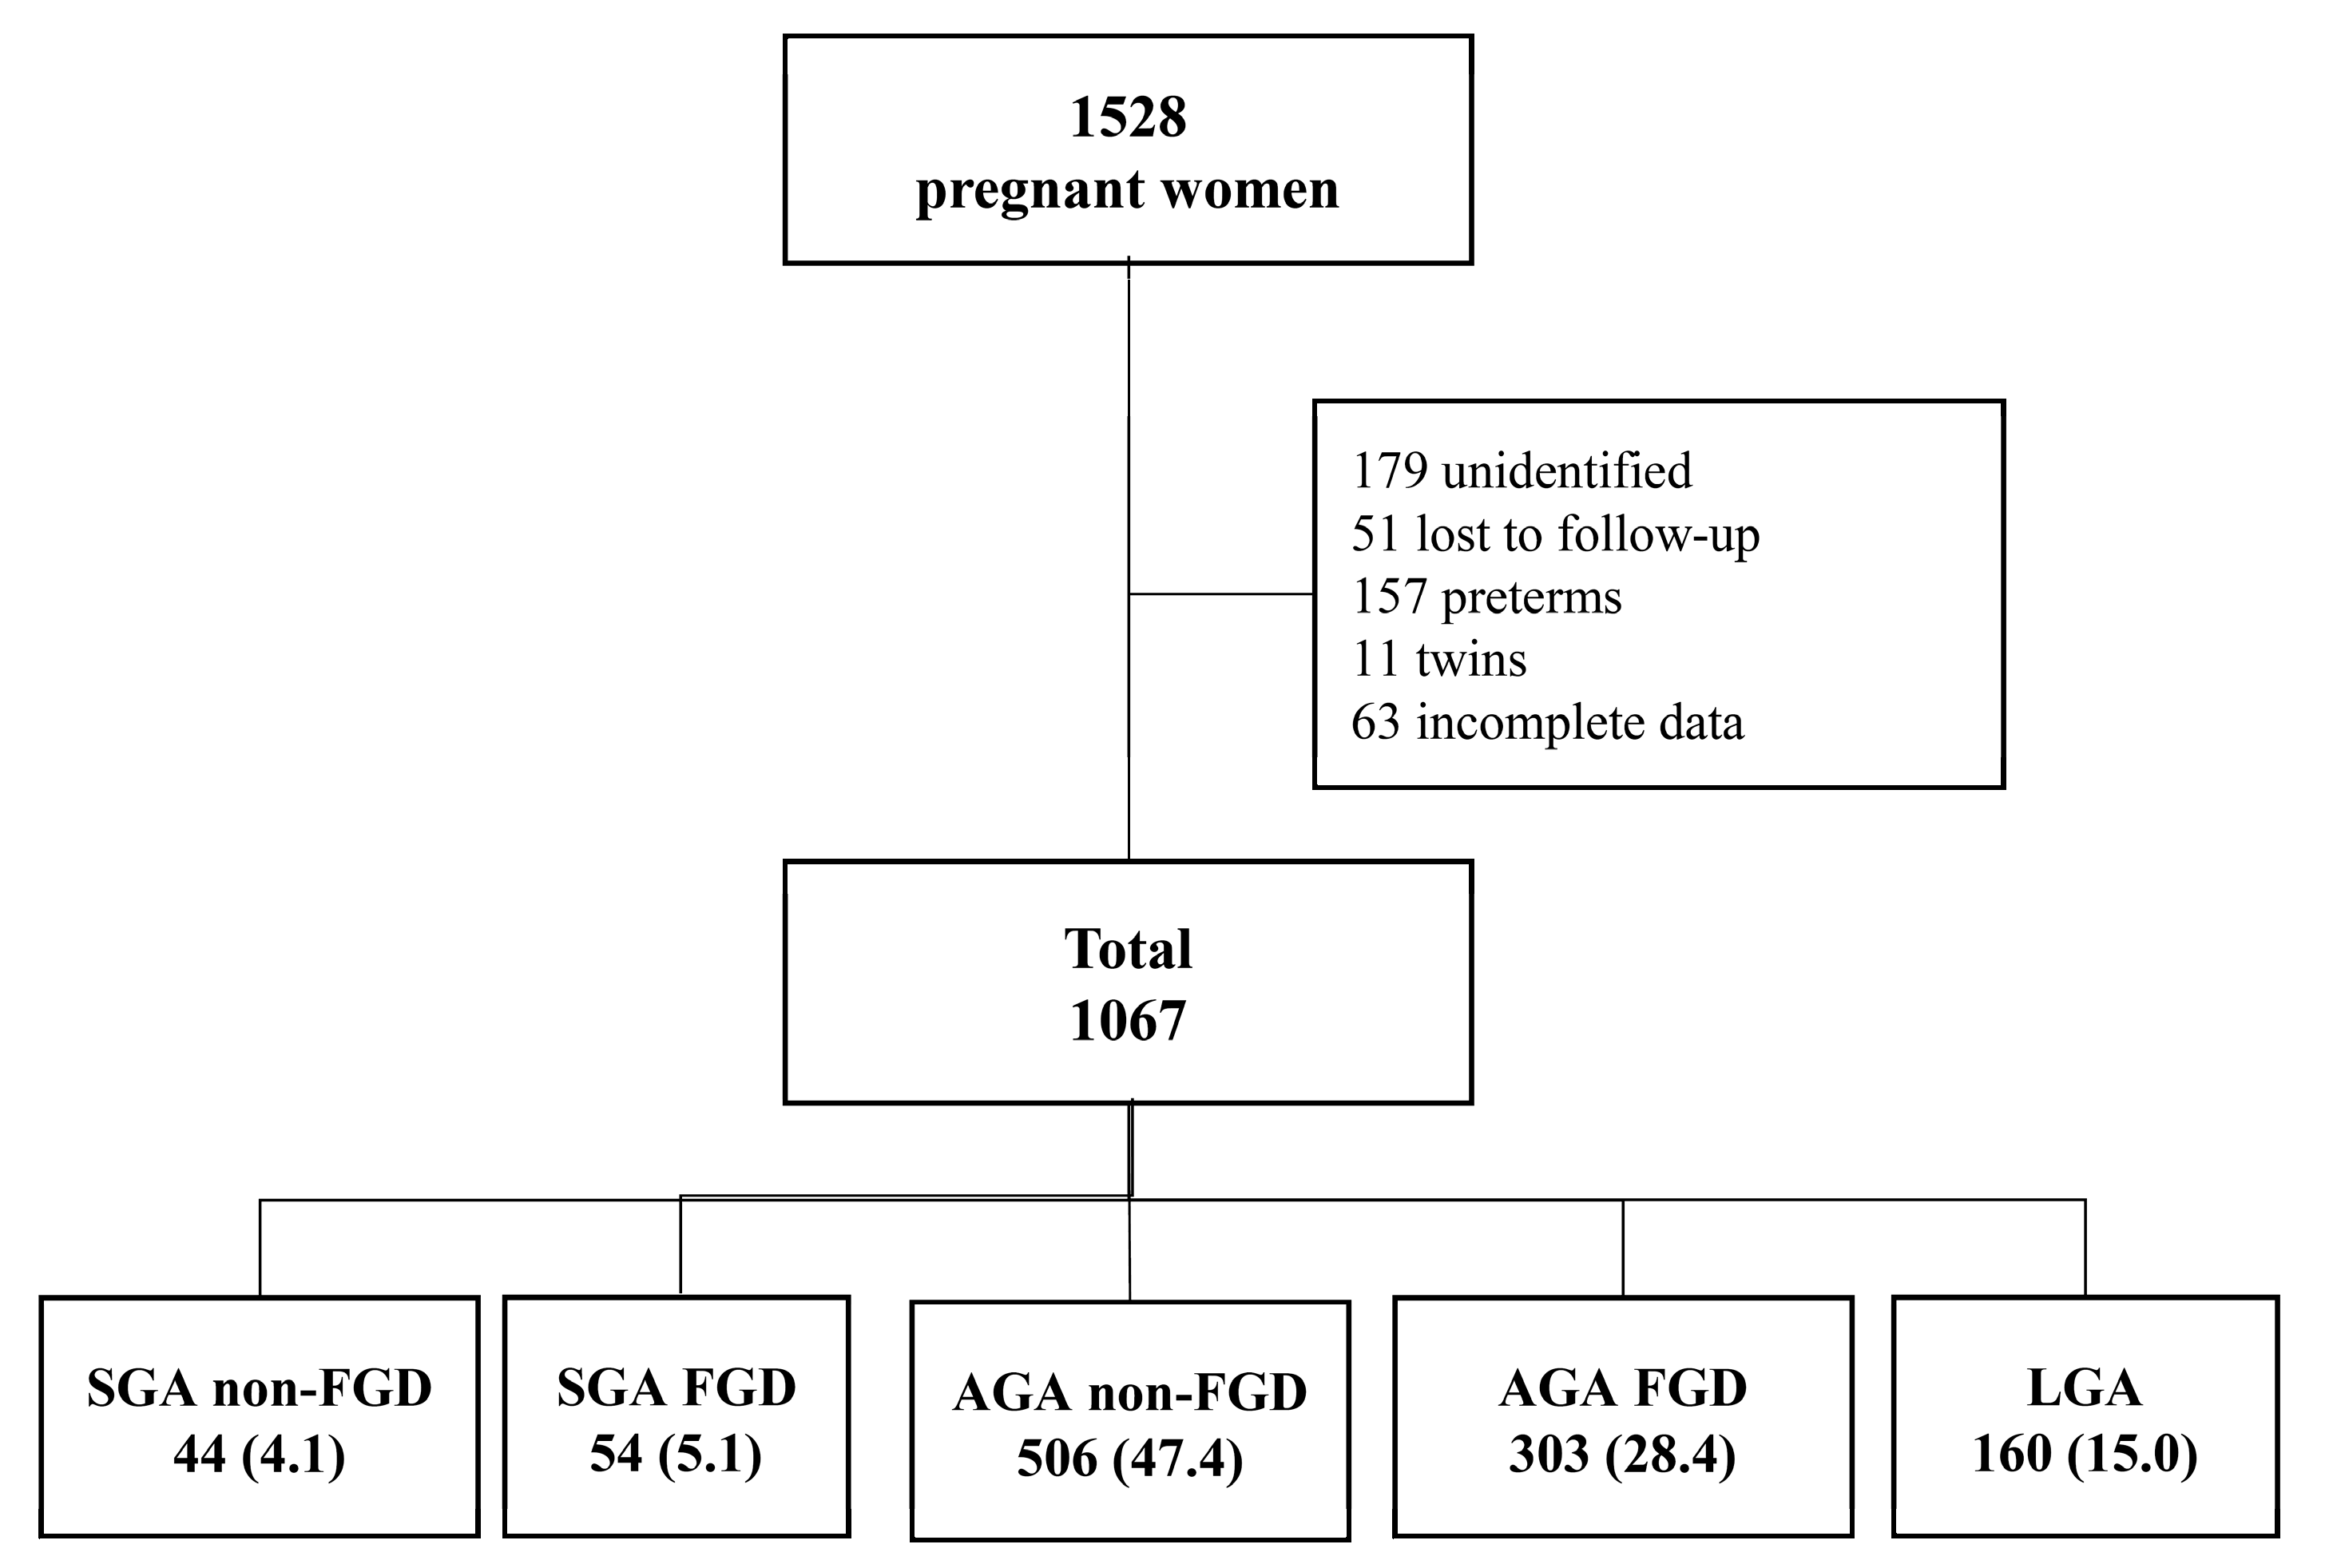
A total of 1067 pregnant women of 1528 eligible women were included in the present study (Figure 1).

Figure 1.
Flowchart of the study cohort. Data are reported as n (%). AGA FGD: appropriate for gestational age with fetal growth detention; AGA non-FGD: appropriate for gestational age without fetal growth detention; LGA: large for gestational age; SGA FGD: small for gestational age with fetal growth detention; SGA non-FGD: small for gestational age without fetal growth detention.
The descriptive characteristics of the 1067 participants divided into the five study groups are shown in Table 1. There were no significant differences between the groups in terms of general characteristics, mother’s age, size, date of third trimester ultrasound scan, or type of delivery. However, significant differences were observed in mother’s weight and BMI at the beginning of pregnancy, which were lower in both SGA groups for weight and SGA non-FGD for BMI, in parity with a higher percentage of nulliparous in SGA groups (p < 0.001). Differences were also found in pregnancy pathology in terms of gestational diabetes, finding more cases in the LGA group (p = 0.014). SGA non-FGD had a median percentile at third trimester ultrasound (15.5) lower than SGA FGD had (44.5). In the study group AGA FGD, newborns were smaller than AGA non-FGD, with a median birthweight of 3105 (345) g vs. 3362 (465) g (p < 0.001) and median birthweight centile of 33.8 (27.1) vs. 60.4 (37.5) (p < 0.001), respectively.

Table 1.
Descriptive baseline characteristics. Data are reported as n (%) or median and interquartile range (p25th–p75th). AGA FGD: appropriate for gestational age with fetal growth detention; AGA non-FGD: appropriate for gestational age without fetal growth detention; LGA: large for gestational age; NRFS: non-reassuring fetal status; SGA FGD: small for gestational age with fetal growth detention; SGA non-FGD: small for gestational age without fetal growth detention.
3.2. Adverse Perinatal Outcomes
Table 2 describes the percentage of APOs in the five study groups and the differences between them. We found statistically significant differences between groups in relation to any adverse perinatal outcome (p = 0.050), instrumental (p = 0.030), cesarean deliveries for NRFS (p = 0.034), and admission at birth in NICU (p = 0.023). The newborns with higher APOs were SGA FGD (31.5%) and SGA non-FGD (40.9%).
Table 2.
Percentage of adverse perinatal outcomes (APOs) in the study groups and the differences between them. Data are reported as n (%). AGA FGD: appropriate for gestational age with fetal growth detention; AGA non-FGD: appropriate for gestational age without fetal growth detention; LGA: large for gestational age; NICU: neonatal intensive care unit; NRFS: non-reassuring fetal status; SGA FGD: small for gestational age with fetal growth detention; SGA non-FGD: small for gestational age without fetal growth detention.
Table 3 and Figure 2 display AUCs and sensitivity values plus the percentile threshold points for different FPR to predict total APOs in AGA FGD newborns. We found that AGA FGD had no predictive capacity for any APO (AUC 0.53; 95% CI, 0.49–0.57) with a decrease of at least 41.3 percentiles (90% specificity).
Table 3.
Values of area under the receiver operating characteristic curves (AUCs) and sensitivities plus the percentile threshold point for different false positive rates (FPR) to predict total adverse perinatal outcomes (APOs) by fetal growth detention. NICU: neonatal intensive care unit; NRFS: non-reassuring fetal status.
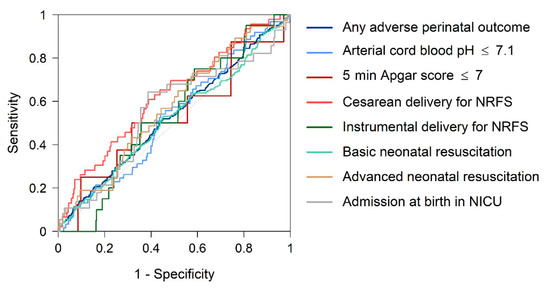
Figure 2.
Receiver operating characteristic curves: fetal growth detention as predictor of adverse perinatal outcomes (APOs). NRFS: non-reassuring fetal status.
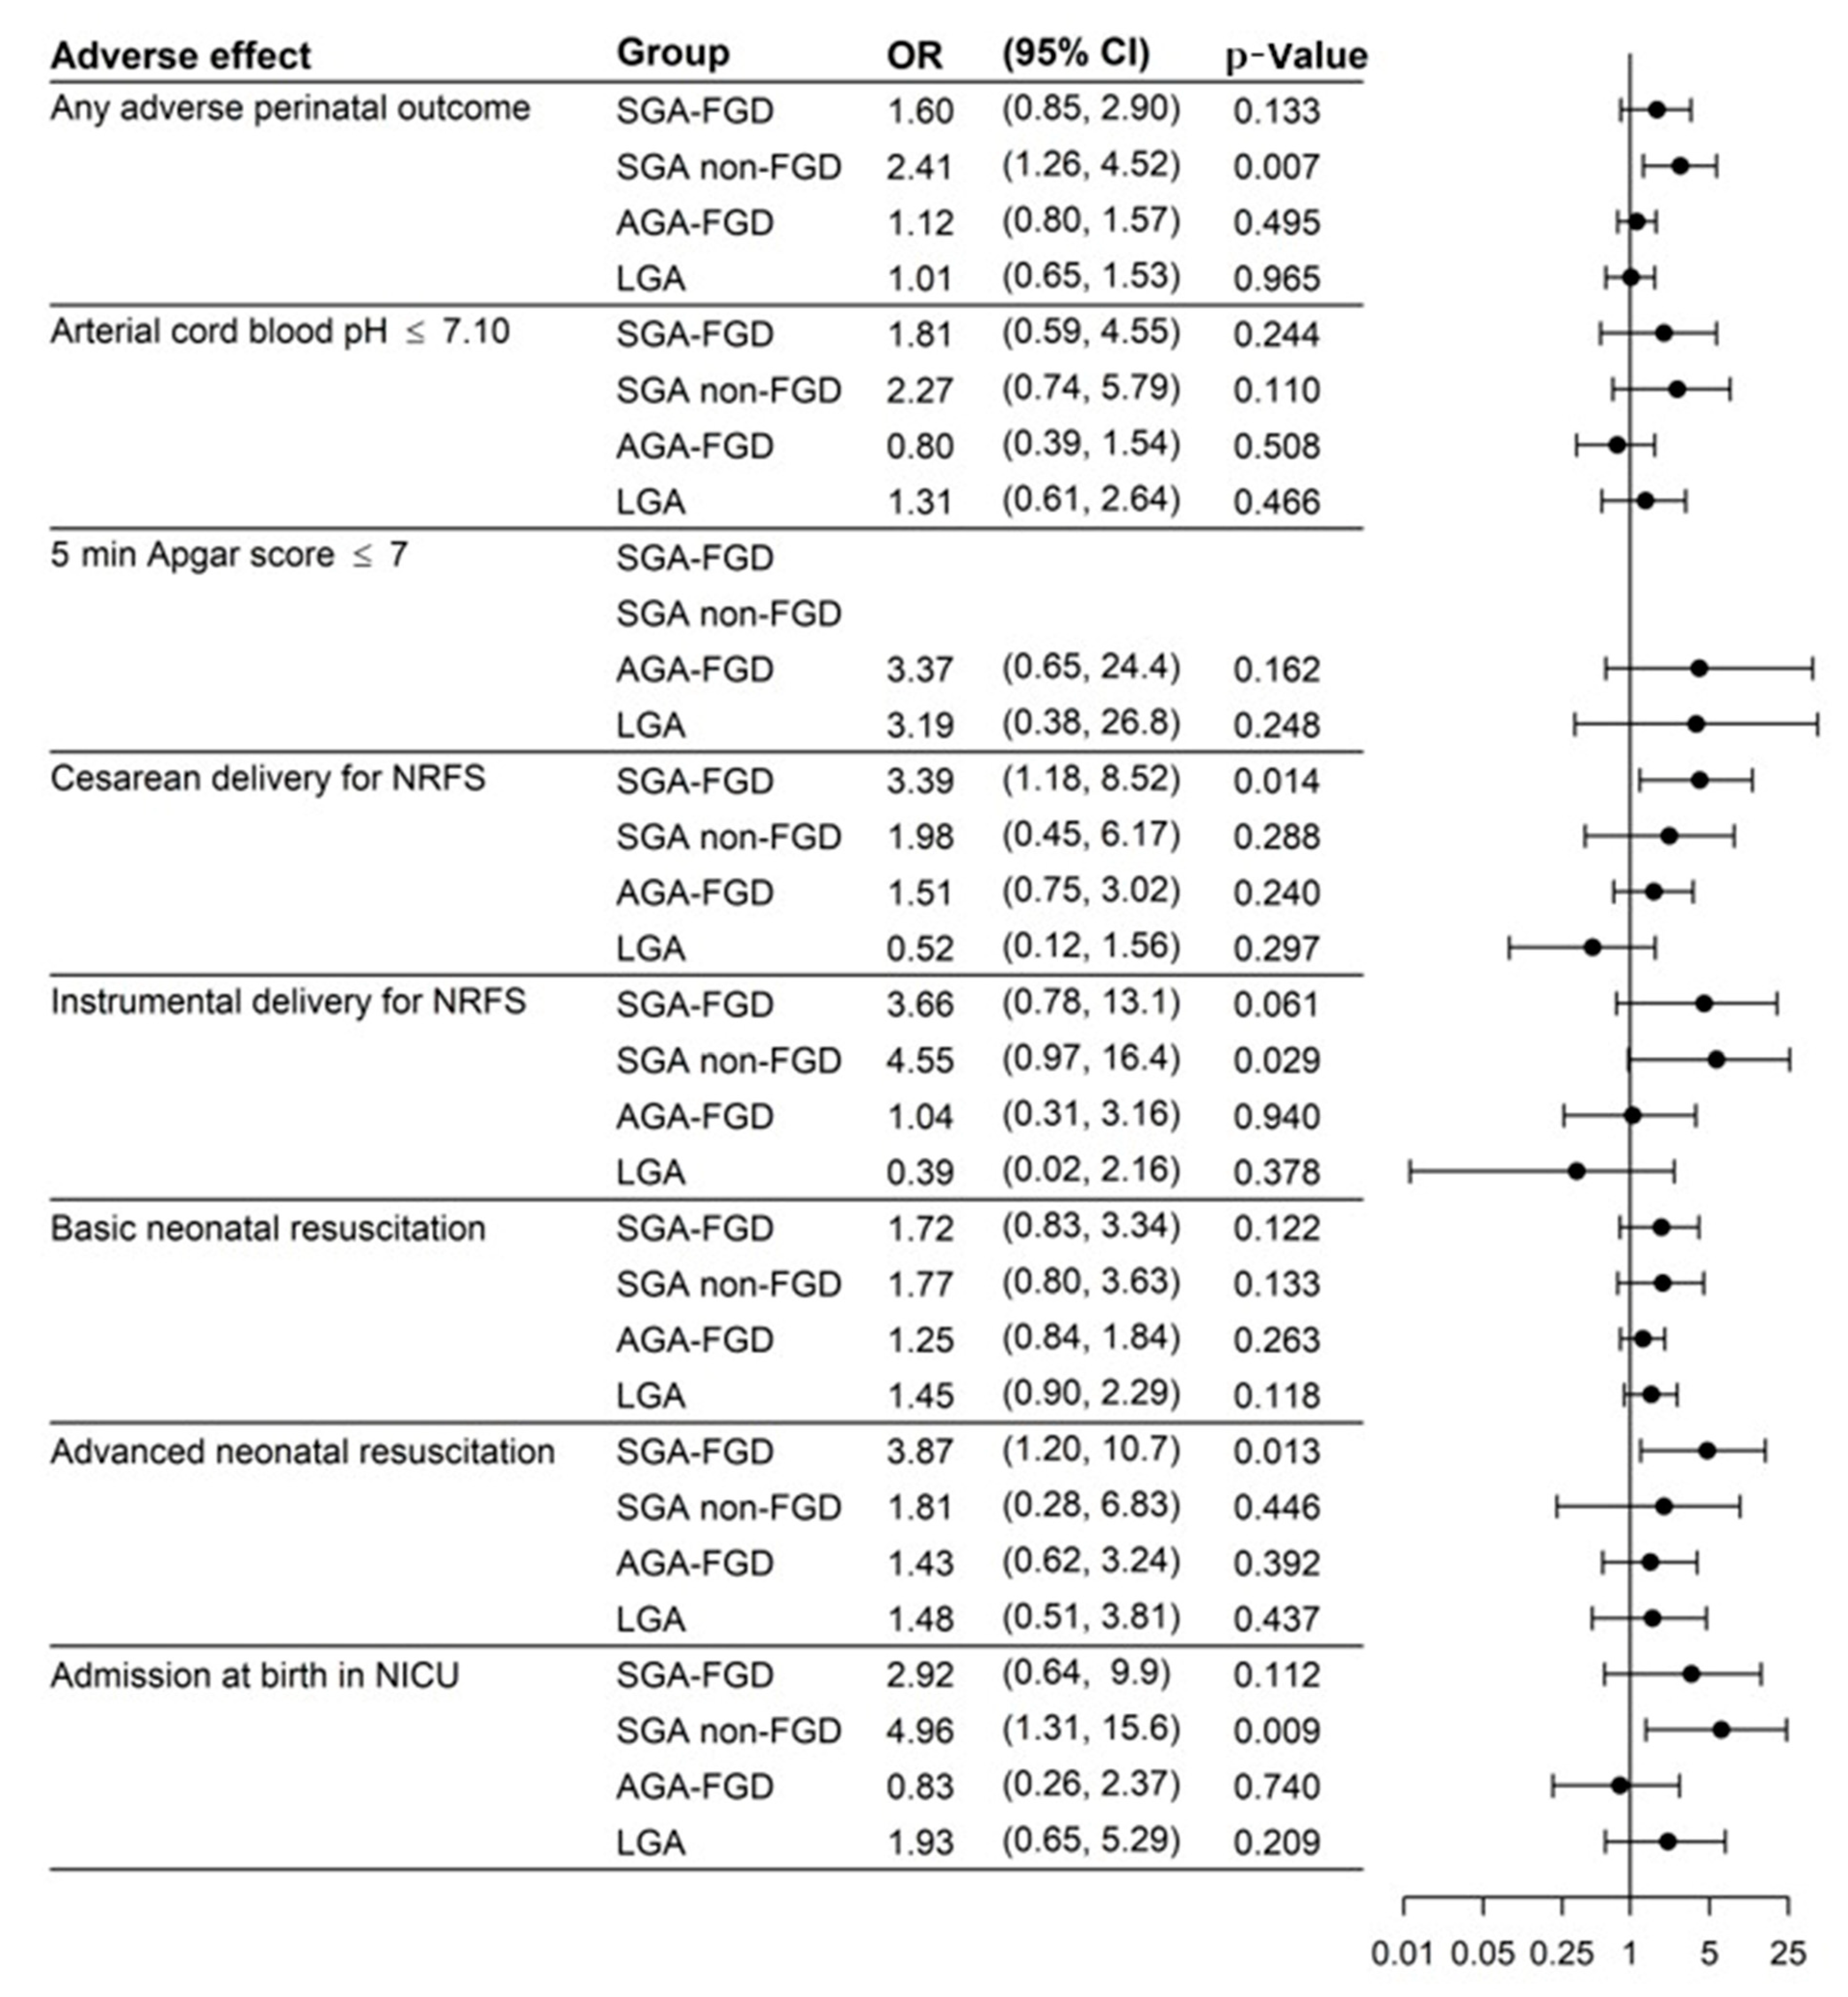
Figure 3 displays the results of the univariate logistic regression model and Figure 4 displays the results of the multivariate logistic regression model (adjusted by nulliparity, maternal BMI, hypertension, and diabetes) with the ORs, 95% CIs, and p-values to predict APOs. Evaluations in the multivariate analysis showed that SGA was the group with the highest risk for any APO, OR 1.49 (95% CI: 0.78, 2.75; p = 0.207) for SGA FGD and OR 2.61 (95% CI: 1.35, 4.99; p = 0.004) for SGA non-FGD, and only the result for SGA non-FGD was significant for any APO. We also found an increased risk in SGA non-FGD for instrumental delivery for NRFS (OR 4.67; 95% CI: 0.97,17.14; p = 0.030) or admission at birth in NICU (OR 5.46; 95% CI: 1.41, 17.8; p = 0.007). SGA FGD had a higher risk of cesarean delivery for NRFS (OR 2.99; 95% CI: 1.03, 7.72; p = 0.030) and advanced neonatal resuscitation (OR 3.76; 95% CI: 1.15, 10.7; p = 0.018). LGA presented a higher risk of basic neonatal resuscitation (OR 1.62; 95% CI: 1.00–2.60; p = 0.047).

Figure 3.
Results of the logistic regression model (univariate analysis). AGA FGD: appropriate for gestational age with fetal growth detention; AGA non-FGD: appropriate for gestational age without fetal growth detention; LGA: large for gestational age; NICU: neonatal intensive care unit; NRFS: non-reassuring fetal status; SGA FGD: small for gestational age with fetal growth detention; SGA non-FGD: small for gestational age without fetal growth detention.
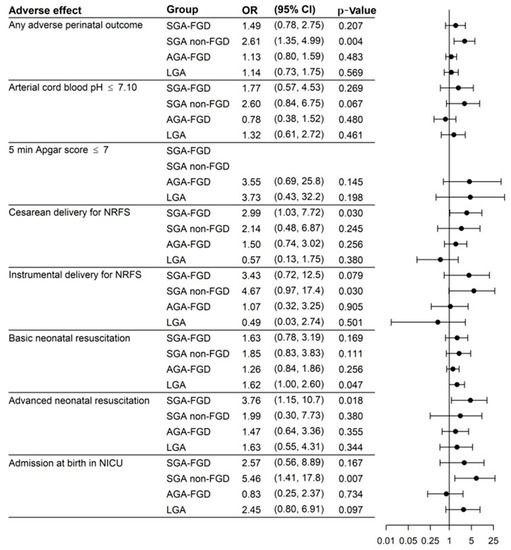
Figure 4.
Results of the logistic regression model (multivariate analysis adjusted by nulliparity, maternal BMI, hypertension, and diabetes). AGA FGD: appropriate for gestational age with fetal growth detention; AGA non-FGD: appropriate for gestational age without fetal growth detention; LGA: large for gestational age; NICU: neonatal intensive care unit; NRFS: non-reassuring fetal status; SGA FGD: small for gestational age with fetal growth detention; SGA non-FGD: small for gestational age without fetal growth detention.
We also estimated how a greater decrease in the percentile cutoff could increase the APO risk ratio for the AGA FGD group. Table 4 shows the relative risk of each amount of percentile decrease (30, 40, or 50 centiles) relative to each APO in the AGA FGD group. On the whole, we did not find differences for each individual APO regardless of the percentile decrease in AGA FGD newborns. The only exception was the cesarean delivery for NRFS, for which we observed a higher risk with decreases in percentile cutoffs of over 40 (RR: 2.41, 95% CI: 1.11–5.21) and 50 centiles (RR: 2.93, 95% CI: 1.14–7.54).
Table 4.
Relative risk of each amount of percentile decreases relative to each APO in the AGA FGD group.
4. Discussion
4.1. Principal Findings
The newborns with the highest rate and risk of APOs were SGAs, and the only group that presented a significant risk corresponded to the SGA non-FGD group. We did not find an association between AGA FGD infants, determined by a decrease of 20 or more weight centiles between the third trimester ultrasound and delivery, and a higher incidence of APOs compared with AGA non-FGD newborns. However, AGA FGD newborns with decreases in percentile cutoffs of over 40 had an increased risk of cesarean section due to NRFS. Therefore, the risk of APO increases if the birthweight percentile is less than 10, but there is less evidence of APO risk related to the percentile fall between ultrasound at 35 weeks and delivery.
4.2. Birthweight Percentile and APOs
Our results regarding SGA newborns and other APOs, such as respiratory distress syndrome, arterial cord blood pH < 7.10, admission at birth, and prolonged stay in NICU were similar to those previously reported [8,34,35,36,37]
When SGA is suspected by ultrasound, these fetuses are closely monitored antenatally. By contrast, if AGA fetuses are suspected, there is not such a close follow-up. It has been suggested that newborns with an intrauterine restriction who do not reach their full genetic growth potential, in spite of a normal birthweight, are at higher risk of APOs than SGA [38,39]. We did not find increased APOs in AGA FGD compared with AGA non-FGD newborns, even with greater falls in percentile cutoff points, except for cesarean delivery for NRFS after falls of over 40 centiles. We could, therefore, consider birthweight to be a more important determinant of APO presentation than the percentile drop from 35 weeks to delivery per se.
4.3. Fetal Growth Percentile Deceleration and APOs
Prenatally undetected FGR is the most important risk factor for stillbirth. It increases the risk up to 8-fold and goes undiagnosed in most pregnancies, so preventive strategies should focus on improving its prenatal detection [12]. Fetal growth can be examined either by cross-sectionally measuring the fetal biometry [40] or by following the longitudinal growth of the fetuses with several measurements [41].
Fetal growth velocity is defined as the rate of fetal growth over a given time interval and is usually represented as a deviation from growth velocity charts (changes in centiles or Z-score with advancing gestation), which is significant to determine fetal growth [1,42].
In terms of fetal growth velocity and individual biometric measurements, there is an initial peak growth of BPD, HC, FL, and AC at 13, 14, 15, and 16 weeks, respectively, and BPD, HC, and AC have a second acceleration at 19 to 22, 19 to 21 and 27 to 31 weeks, respectively [43]. In general, normal growth in singletons increases from approximately 5 g/day at 14 to 15 weeks of gestation to 10 g/day at 20 weeks, peaking at 30 to 35 g/day at 32 to 34 weeks, after which the growth rates decrease [21].
According to the Delphi consensus [2], a fall of more than two quartiles in EFW in growth charts can diagnose these late onset FGR. Recently, the international Fetal Growth Velocity Increment Standards have been published from the Fetal Growth Longitudinal Study of the INTERGROWTH-21st project to facilitate the monitoring of fetal wellbeing exhaustively all over the world [42].
Although the cutoff point of 50 centiles is random, it shows the importance of growth velocity deceleration as a significant contributor to present APOs in SGA [35,44] and AGA fetuses [26,28,45]. Moreover, several previous studies have reported a link between fetal growth detection between ultrasounds and increased risk of APOs in both SGA and AGA newborns [36,37,44,46,47,48,49,50].
MacDonald et al. [28] concluded that a reduction in growth velocity between 28 and 36 weeks of pregnancy in AGA newborns is associated with increased risk of adverse outcomes, including stillbirth, so these fetuses may be undetected. When they investigated a decrease in EFW of less than 30 centiles, they found that it only occurs in 8.4% of the fetuses, suggesting it could be used as a tool with a good predictive value for detecting AGA in fetuses with placental insufficiency. We studied the decline in fetal growth from 35 weeks to birth in both SGA and AGA newborns with a cutoff of 20 centiles and did not find a clear association between APOs and this reduction. Hendrix et al. [51] noticed that abnormal fetal growth velocities, especially AC velocity between 20–32 weeks of gestational age, are associated with an adverse neonatal outcome of suspected AGA neonates resulting from suboptimal fetal growth. Our results are different because our observations were made later, from 35 weeks onwards, compared with those of Hendrix. Stratton et al. [26] observed that a fall of 20 or more centiles between two ultrasound scans in the 3rd trimester in AGA newborns was not associated with a higher risk of intrapartum complications, or perinatal morbidity, than those with adequate intrauterine growth, although there was an increased incidence of admission to NICU. We assessed the percentile drop from 35 weeks to delivery, but we did not study growth velocity. Our data suggest that late fetal growth detentions are associated with an increased risk of cesarean for NRFS in cases with a fall of more than 40 centiles. This could be explained by the fact that these are fetuses with some degree of placental insufficiency and are probably subjected to more stress during delivery than AGA non-FGD, which leads to an indication for cesarean section, but this insufficiency is presumably not as severe as in SGA. Probably, if the pregnancy were to continue, these fetuses would end up as SGA. However, they are not born with a percentile lower than 10 and this protects them from other APOs.
Chatzakis et al. [52] found that fetuses falling ≥ 50 estimated fetal weight centiles between the second and third trimester had increased rates of NICU admissions (OR 1.8) and perinatal death (OR 3.8), compared with AGA fetuses. This drop was a significant predictor of perinatal death and represents an increased risk of APOs. They investigated an earlier reduction in growth, in the phase of normal growth acceleration, which could justify different results to ours.
Pacora et al. [53] found that fetuses that suffered antenatal death at ≥20 weeks of gestation had decreased fetal growth velocity compared with controls. In addition, fetuses with an EFW percentile velocity < 10th centile had an increased risk of dying antepartum. They suggested that tools for better detection of fetuses at risk of death are needed. Verkauskiene et al. [29] performed an ultrasound scan every 4 weeks from week 22 to 36 and defined FGR as a drop of 20 centiles from 22 gestational weeks to birth. They concluded that FGR had an impact on body composition and hormonal parameters in AGA newborn infants, suggesting that these babies could have the same metabolic risk as SGA.
However, Bligh et al. [45], in a cohort of 436 women, demonstrated that decreased growth velocity in AGA fetuses at term (measured by EFW z-score change per week from 36 weeks until delivery) was associated with an increased risk of adverse neonatal outcomes. Although, unlike us, they studied the decreased z-score and compared the mean percentile loss between the APO and non-APO groups. We have not been able to demonstrate that AGA FGDs had the same APOs as SGAs, although there was a trend towards more adverse effects than AGA non-FGD, and in cases with a fall of more than 40 centiles, we found an increased risk of cesarean for NRFS. SGA non-FGD showed this low estimated weight from earlier stages of gestation than SGA FGDs, which had a later fall in weight, and, therefore, in cases where low birth weight was a consequence of placental insufficiency, this occurred at different times. For this reason, it is possible that SGA FGDs with a later weight loss may have less fetal impairment and fewer APOs. Thus, in the SGA group, the drop in percentile was also significant, showing that those with low percentiles from early gestation were the ones with the highest APOs.
Hence, clinical efforts should focus on the diagnosis and prediction of SGAs, especially those with the highest number of APOs, such as the SGA non-FGD group, the group of greatest interest, in order to proceed according to established protocols [54]. The best time to diagnose them would be the third trimester ultrasound. At this point, they are likely to have low estimated weight percentiles, although perhaps not all below the 10th percentile. Therefore, fetuses with low percentiles at 35 weeks ultrasound, even if they are not SGAs at that time, are worth following up. However, more studies are needed to determine the clinical implications of falls in percentile cutoffs of more than 40 points at the end of pregnancy in the AGA group.
Thus, in a specific group of pregnant women, it could be recommendable to repeat ultrasound prior to delivery. Furthermore, although they are a smaller group, identifying AGA newborns with an intrauterine growth restriction is important to be able to monitor them more closely in the third trimester. It is, therefore, important to continue to search for new methods of this monitoring, which would probably entail a combination of maternal, obstetric, and fetal factors.
4.4. Strengths and Limitations of the Study
Our research has several strengths as it includes a large sample size. We also defined the study groups following the longitudinal growth, not by cross-sectionally measuring the fetal biometry. We investigated the percentile decrease in both AGA and SGA newborns separately, on the basis of birth weight, so we do not have the bias of a percentile drop in newborns who are already SGAs and therefore have an increased risk of APOs based only on their percentile at birth.
Regarding limitations, this was a retrospective study, and when calculating EFW weight by ultrasound, an error of the technique can be assumed [55]. However, in similar studies that calculate the growth velocity between ultrasounds scans, this risk is taken on. Additionally, we had many patients in our sample with fetal growth detention, which could be due to interpersonal variability when performing ultrasound or an unrestrictive cutoff point (20 centiles). Moreover, we did not consider the time between ultrasound and delivery when calculating the percentile difference.
5. Conclusions
Newborns with the highest probability of APOs are SGAs. Of these, the only group that presents a significant risk are the SGA non-FGD newborns, which are therefore the most important group to detect antenatally. AGA FGD newborns do not have a higher incidence of APOs than AGA non-FGDs, although with decreases in percentile cutoffs of more than 40 points, they have an increased risk of cesarean section due to NRFS. Further research is required to determine whether this group would benefit from closer surveillance during late pregnancy and birth.
Author Contributions
Conceptualization, R.S.-C., M.S.G.A., L.M.E. and I.M.-F.; methodology, R.S.-C., M.S.G.A., I.M.-F. and L.M.E.; software, I.M.-F. and L.M.E.; validation, L.M.E.; resources, Villalba University General Hospital; data curation, R.S.-C., M.S.G.A., L.M.E. IMF; writing—original draft preparation, M.S.G.A. and R.S.-C.; writing—review and editing, L.M.E., I.M.-F., M.S.d.P., M.A.-G. and R.P.P. All authors have read and agreed to the published version of the manuscript.
Funding
Villalba University General Hospital.
Institutional Review Board Statement
The study was conducted in accordance with the guidelines of the Declaration of Helsinki and approved by the Clinical Research Ethics Committee of Fundación Jimenez Díaz (Madrid) (EO090-19_HGV) and the Central Research Commission of Primary Care Management (23/19).
Informed Consent Statement
Patient consent was waived, as due to the retrospective observational nature of this study, data could be fully anonymized.
Data Availability Statement
The data analyzed were retrieved from the Villalba University General Hospital database.
Acknowledgments
We gratefully thank all the staff of the Ultrasound and Prenatal Diagnosis Unit and Department of Neonatology of the Villalba University General Hospital (Madrid, Spain), specially to Diego Hernández Martín, for their help in the acquisition and management of data. We also thank Juan Rodríguez Delgado, primary care pediatrician, and the Primary Care Management Department.
Conflicts of Interest
The authors declare no conflict of interest. The funders had no role in the design of the study, in the collection, analyzes, or interpretation of data, in the writing of the manuscript, or in the decision to publish the results.
References
- Salomon, L.J.; Alfirevic, Z.; Da Silva Costa, F.; Deter, R.L.; Figueras, F.; Ghi, T.; Glanc, P.; Khalil, A.; Lee, W.; Napolitano, R.; et al. ISUOG Practice Guidelines: Ultrasound assessment of fetal biometry and growth. Ultrasound Obstet. Gynecol. 2019, 53, 715–723. [Google Scholar] [CrossRef]
- Gordijn, S.J.; Beune, I.M.; Thilaganathan, B.; Papageorghiou, A.; Baschat, A.A.; Baker, P.N.; Silver, R.M.; Wynia, K.; Ganzevoort, W. Consensus definition of fetal growth restriction: A Delphi procedure. Ultrasound Obstet. Gynecol. 2016, 48, 333–339. [Google Scholar] [CrossRef] [PubMed]
- Audette, M.C.; Kingdom, J.C. Screening for fetal growth restriction and placental insufficiency. Semin. Fetal Neonatal Med. 2018, 23, 119–125. [Google Scholar] [CrossRef] [PubMed]
- Flenady, V.; Koopmans, L.; Middleton, P.; Frøen, J.F.; Smith, G.C.; Gibbons, K.; Coory, M.; Gordon, A.; Ellwood, D.; McIntyre, H.D.; et al. Major risk factors for stillbirth in high-income countries: A systematic review and meta-analysis. Lancet 2011, 377, 1331–1340. [Google Scholar] [CrossRef]
- Beune, I.M.; Bloomfield, F.H.; Ganzevoort, W.; Embleton, N.D.; Rozance, P.J.; van Wassenaer-Leemhuis, A.G.; Wynia, K.; Gordijn, S.J. Consensus Based Definition of Growth Restriction in the Newborn. J. Pediatr. 2018, 196, 71–76. [Google Scholar] [CrossRef]
- McCowan, L.M.; Figueras, F.; Anderson, N.H. Evidence-based national guidelines for the management of suspected fetal growth restriction: Comparison, consensus, and controversy. Am. J. Obstet. Gynecol. 2018, 218, S855–S868. [Google Scholar] [CrossRef] [PubMed] [Green Version]
- Lee, A.C.C.; Kozuki, N.; Cousens, S.; Stevens, G.A.; Blencowe, H.; Silveira, M.F.; Sania, A.; Rosen, H.E.; Schmiegelow, C.; Adair, L.S.; et al. Estimates of burden and consequences of infants born small for gestational age in low and middle income countries with INTERGROWTH-21st standard: Analysis of CHERG datasets. BMJ 2017, 358, 1–11. [Google Scholar] [CrossRef] [PubMed] [Green Version]
- Kesavan, K.; Devaskar, S.U. Intrauterine Growth Restriction: Postnatal Monitoring and Outcomes. Pediatr. Clin. North Am. 2019, 66, 403–423. [Google Scholar] [CrossRef]
- Lees, C.; Marlow, N.; Arabin, B.; Bilardo, C.M.; Brezinka, C.; Derks, J.B.; Duvekot, J.; Frusca, T.; Diemert, A.; Ferrazzi, E.; et al. Perinatal morbidity and mortality in early-onset fetal growth restriction: Cohort outcomes of the trial of randomized umbilical and fetal flow in Europe (TRUFFLE). Ultrasound Obstet. Gynecol. 2013, 42, 400–408. [Google Scholar] [CrossRef] [PubMed]
- Pérez-Cruz, M.; Cruz-Lemini, M.; Fernández, M.T.; Parra, J.A.; Bartrons, J.; Gõmez-Roig, M.D.; Crispi, F.; Gratacõs, E. Fetal cardiac function in late-onset intrauterine growth restriction vs. small-for-gestational age, as defined by estimated fetal weight, cerebroplacental ratio and uterine artery Doppler. Ultrasound Obstet. Gynecol. 2015, 46, 465–471. [Google Scholar] [CrossRef] [Green Version]
- Kady, S.M.; Gardosi, J. Perinatal mortality and fetal growth restriction. Best Pract. Res. Clin. Obstet. Gynaecol. 2004, 18, 397–410. [Google Scholar] [CrossRef] [PubMed]
- Gardosi, J.; Madurasinghe, V.; Williams, M.; Malik, A.; Francis, A. Maternal and fetal risk factors for stillbirth: Population based study. BMJ 2013, 346, 1–14. [Google Scholar] [CrossRef] [PubMed] [Green Version]
- Claris, O.; Beltrand, J.; Levy-Marchal, C. Consequences of intrauterine growth and early neonatal catch-up growth. Semin. Perinatol. 2010, 34, 207–210. [Google Scholar] [CrossRef] [PubMed]
- Barker, D.J.; Osmond, C.; Golding, J.; Kuh, D.; Wadsworth, M.E. Growth in utero, blood pressure in childhood and adult life, and mortality from cardiovascular disease. BMJ 1989, 298, 564–567. [Google Scholar] [CrossRef] [PubMed] [Green Version]
- De Boo, H.A.; Harding, J.E. The Developmental origins of adult disease (Barker) hypothesis. Aust. N. Zeal. J. Obstet. Gynaecol. 2006, 46, 4–14. [Google Scholar] [CrossRef]
- Jarvis, S.; Glinianaia, S.V.; Torrioli, M.G.; Platt, M.J.; Miceli, M.; Jouk, P.S.; Johnson, A.; Hutton, J.; Hemming, K.; Hagberg, G.; et al. Cerebral palsy and intrauterine growth in single births: European collaborative study. Lancet 2003, 362, 1106–1111. [Google Scholar] [CrossRef]
- Lindqvist, P.G.; Molin, J. Does antenatal identification of small-for-gestational age fetuses significantly improve their outcome? Ultrasound Obstet. Gynecol. 2005, 25, 258–264. [Google Scholar] [CrossRef]
- Melamed, N.; Baschat, A.; Yinon, Y.; Athanasiadis, A.; Mecacci, F.; Figueras, F.; Berghella, V.; Nazareth, A.; Tahlak, M.; McIntyre, H.D.; et al. FIGO (International Federation of Gynecology and Obstetrics) initiative on fetal growth: Best practice advice for screening, diagnosis, and management of fetal growth restriction. Int. J. Gynecol. Obstet. 2021, 152, 3–57. [Google Scholar] [CrossRef]
- Gardosi, J.; Clausson, B.; Francis, A. The value of customised centiles in assessing perinatal mortality risk associated with parity and maternal size. BJOG Int. J. Obstet. Gynaecol. 2009, 116, 1356–1363. [Google Scholar] [CrossRef]
- McCowan, L. Customised birthweight centiles predict SGA pregnancies with perinatal morbidity. BJOG Int. J. Obstet. Gynaecol. 2005, 112, 1026–1033. [Google Scholar] [CrossRef]
- Resnik, R. Intrauterine growth restriction. Obstet. Gynecol. 2002, 99, 490–496. [Google Scholar] [PubMed]
- Savirón-Cornudella, R.; Esteban, L.M.; Lerma, D.; Cotaina, L.; Borque, Á.; Sanz, G.; Castán, S. Comparison of fetal weight distribution improved by paternal height by Spanish standard versus Intergrowth 21st standard. J. Perinat. Med. 2018, 46, 750–759. [Google Scholar] [CrossRef] [Green Version]
- Unterscheider, J.; Daly, S.; Geary, M.P.; Kennelly, M.M.; McAuliffe, F.M.; O’Donoghue, K.; Hunter, A.; Morrison, J.J.; Burke, G.; Dicker, P.; et al. Optimizing the definition of intrauterine growth restriction: The multicenter prospective PORTO Study. Am. J. Obstet. Gynecol. 2013, 208, 290.e1–290.e6. [Google Scholar] [CrossRef] [PubMed]
- Vasaks, B.; Koenen, V.; Koster, M.P.H.; Hukkelhoven, C.W.P.M.; Franx, A.; Hanson, M.A.; Visser, G.H.A. Human fetal growth is constrained below optimal for perinatal survival. Ultrasound Obstet. Gynecol. 2015, 45, 162–167. [Google Scholar] [CrossRef] [PubMed]
- Akolekar, R.; Syngelaki, A.; Gallo, D.M.; Poon, L.C.; Nicolaides, K.H. Umbilical and fetal middle cerebral artery Doppler at 35–37 weeks’ gestation in the prediction of adverse perinatal outcome. Ultrasound Obstet. Gynecol. 2015, 46, 82–92. [Google Scholar] [CrossRef] [PubMed]
- Stratton, J.F.; Ni Scanaill, S.; Stuart, B.; Turner, M.J. Are babies of normal birth weight who fail to reach their growth potential as diagnosed by ultrasound at increased risk? Ultrasound Obstet. Gynecol. 1995, 5, 114–118. [Google Scholar] [CrossRef]
- Bardien, N.; Whitehead, C.L.; Tong, S.; Ugoni, A.; McDonald, S.; Walker, S.P. Placental insufficiency in fetuses that slow in growth but are born appropriate for gestational age: A prospective longitudinal study. PLoS ONE 2016, 11, e0142788. [Google Scholar] [CrossRef] [Green Version]
- MacDonald, T.M.; Hui, L.; Tong, S.; Robinson, A.J.; Dane, K.M.; Middleton, A.L.; Walker, S.P. Reduced growth velocity across the third trimester is associated with placental insufficiency in fetuses born at a normal birthweight: A prospective cohort study. BMC Med. 2017, 15, 164. [Google Scholar] [CrossRef]
- Verkauskiene, R.; Beltrand, J.; Claris, O.; Chevenne, D.; Deghmoun, S.; Dorgeret, S.; Alison, M.; Gaucherand, P.; Sibony, O.; Lévy-Marchal, C. Impact of fetal growth restriction on body composition and hormonal status at birth in infants of small and appropriate weight for gestational age. Eur. J. Endocrinol. 2007, 157, 605–612. [Google Scholar] [CrossRef] [PubMed]
- Von Elm, E.; Altman, D.G.; Egger, M.; Pocock, S.J.; Gøtzsche, P.C.; Vandenbroucke, J.P. Strengthening the reporting of observational studies in epidemiology (StroBE) statement: Guidelines for reporting observational studies. BMJ 2007, 335, 806–808. [Google Scholar] [CrossRef] [Green Version]
- American College of Obstetricians and Gynecologists. Methods for Estimating the Due Date. Comitee Opinion No. 700. Obstet. Gynecol. 2017, 129, e150–e154. [Google Scholar] [CrossRef]
- Hadlock, F.P.; Harrist, R.B.; Sharman, R.S.; Deter, R.L.; Park, S.K. Estimation of fetal weight with the use of head, body, and femur measurements—A prospective study. Am. J. Obstet. Gynecol. 1985, 151, 333–337. [Google Scholar] [CrossRef]
- Carrascosa, A.; Fernández, J.M.; Ferrández, Á.; López-Siguero, J.P.; López, D.; Sánchez, E.; Colaborador, G. Estudios Españoles de Crecimiento 2010. Revista Española Endocrinología Pediátrica 2011, 2 (Suppl. 1), 59–62. [Google Scholar]
- Madden, J.V.; Flatley, C.J.; Kumar, S. Term small-for-gestational-age infants from low-risk women are at significantly greater risk of adverse neonatal outcomes. Am. J. Obstet. Gynecol. 2018, 218, 525.e1–525.e9. [Google Scholar] [CrossRef] [Green Version]
- Caradeux, J.; Eixarch, E.; Mazarico, E.; Basuki, T.R.; Gratacos, E.; Figueras, F. Longitudinal growth assessment for prediction of adverse perinatal outcome in fetuses suspected to be small-for-gestational age. Ultrasound Obstet. Gynecol. 2018, 52, 325–331. [Google Scholar] [CrossRef] [PubMed] [Green Version]
- Illa, M.; Coloma, J.L.; Eixarch, E.; Meler, E.; Iraola, A.; Gardosi, J.; Gratacós, E.; Figueras, F. Growth deficit in term small-for-gestational fetuses with normal umbilical artery Doppler is associated with adverse outcome. J. Perinat. Med. 2009, 37, 48–52. [Google Scholar] [CrossRef] [PubMed]
- Iraola, A.; González, I.; Eixarch, E.; Meler, E.; Illa, M.; Gardosi, J.; Gratacós, E.; Figueras, F. Prediction of adverse perinatal outcome at term in small-for-gestational age fetuses: Comparison of growth velocity vs. customized assessment. J. Perinat. Med. 2008, 36, 531–535. [Google Scholar] [CrossRef] [PubMed]
- Altman, D.G.; Hytten, F.E. Intrauterine growth retardation: Let’s be clear about it. BJOG Int. J. Obstet. Gynaecol. 1989, 96, 1127–1128. [Google Scholar] [CrossRef]
- Fay, R.A.; Dey, P.L.; Saadie, C.M.J.; Buhl, J.A.; Gebski, V.J. Ponderal Index: A Better Definition of the ‘At Risk’ Group with Intrauterine Growth Problems than Birth-weight for Gestational Age in Term Infants. Aust. N. Zeal. J. Obstet. Gynaecol. 1991, 31, 17–19. [Google Scholar] [CrossRef]
- Unterscheider, J.; Daly, S.; Geary, M.P.; Kennelly, M.M.; McAuliffe, F.M.; O’Donoghue, K.; Hunter, A.; Morrison, J.J.; Burke, G.; Dicker, P.; et al. Definition and management of fetal growth restriction: A survey of contemporary attitudes. Eur. J. Obstet. Gynecol. Reprod. Biol. 2014, 174, 41–45. [Google Scholar] [CrossRef]
- Owen, P.; Khan, K.S. Fetal growth velocity in the prediction of intrauterine growth retardation in a low risk population. BJOG Int. J. Obstet. Gynaecol. 1998, 105, 536–540. [Google Scholar] [CrossRef] [Green Version]
- Ohuma, E.O.; Villar, J.; Feng, Y.; Xiao, L.; Salomon, L.; Barros, F.C.; Cheikh Ismail, L.; Stones, W.; Jaffer, Y.; Oberto, M.; et al. Fetal growth velocity standards from the Fetal Growth Longitudinal Study of the INTERGROWTH-21st Project. Am. J. Obstet. Gynecol. 2021, 224, 208.e1–208.e18. [Google Scholar] [CrossRef] [PubMed]
- Grantz, K.L.; Kim, S.; Grobman, W.A.; Newman, R.; Owen, J.; Skupski, D.; Grewal, J.; Chien, E.K.; Wing, D.A.; Wapner, R.J.; et al. Fetal growth velocity: The NICHD fetal growth studies. Am. J. Obstet. Gynecol. 2018, 219, 285.e1–285.e36. [Google Scholar] [CrossRef] [PubMed] [Green Version]
- Sovio, U.; White, I.R.; Dacey, A.; Pasupathy, D.; Smith, G.C.S. Screening for fetal growth restriction with universal third trimester ultrasonography in nulliparous women in the Pregnancy Outcome Prediction (POP) study: A prospective cohort study. Lancet 2015, 386, 2089–2097. [Google Scholar] [CrossRef] [Green Version]
- Bligh, L.N.; Flatley, C.J.; Kumar, S. Reduced growth velocity at term is associated with adverse neonatal outcomes in non-small for gestational age infants. Eur. J. Obstet. Gynecol. Reprod. Biol. 2019, 240, 125–129. [Google Scholar] [CrossRef]
- Caradeux, J.; Eixarch, E.; Mazarico, E.; Basuki, T.R.; Gratacós, E.; Figueras, F. Second- to third-trimester longitudinal growth assessment for prediction of small-for-gestational age and late fetal growth restriction. Ultrasound Obstet. Gynecol. 2018, 51, 219–224. [Google Scholar] [CrossRef] [Green Version]
- Cavallaro, A.; Veglia, M.; Svirko, E.; Vannuccini, S.; Volpe, G.; Impey, L. Using fetal abdominal circumference growth velocity in the prediction of adverse outcome in near-term small-for-gestational-age fetuses. Ultrasound Obstet. Gynecol. 2018, 52, 494–500. [Google Scholar] [CrossRef]
- Barker, E.D.; McAuliffe, F.M.; Alderdice, F.; Unterscheider, J.; Daly, S.; Geary, M.P.; Kennelly, M.M.; O’Donoghue, K.; Hunter, A.; Morrison, J.J.; et al. The role of growth trajectories in classifying fetal growth restriction. Obstet. Gynecol. 2013, 122, 248–254. [Google Scholar] [CrossRef] [Green Version]
- De Jong, C.L.D.; Francis, A.; Van Geijn, H.P.; Gardosi, J. Fetal growth rate and adverse perinatal events. Ultrasound Obstet. Gynecol. 1999, 13, 86–89. [Google Scholar] [CrossRef]
- Marconi, A.M.; Ronzoni, S.; Bozzetti, P.; Vailati, S.; Morabito, A.; Battaglia, F.C. Comparison of fetal and neonatal growth curves in detecting growth restriction. Obstet. Gynecol. 2008, 112, 1227–1234. [Google Scholar] [CrossRef] [Green Version]
- Hendrix, M.L.E.; Van Kuijk, S.M.J.; Gavilanes, A.W.D.; Kramer, D.; Spaanderman, M.E.A.; Al Nasiry, S. Reduced fetal growth velocities and the association with neonatal outcomes in appropriate-for-gestational-age neonates: A retrospective cohort study. BMC Pregnancy Childbirth 2019, 19, 1–10. [Google Scholar] [CrossRef] [PubMed]
- Chatzakis, C.; Papaioannou, G.K.; Eleftheriades, M.; Makrydimas, G.; Dinas, K.; Sotiriadis, A. Perinatal outcome of appropriate-weight fetuses with decelerating growth. J. Matern. Fetal Neonatal Med. 2021, 34, 3362–3369. [Google Scholar] [CrossRef] [PubMed]
- Pacora, P.; Romero, R.; Jung, E.; Gudicha, D.W.; Hernandez-Andrade, E.; Musilova, I.; Kacerovsky, M.; Jaiman, S.; Erez, O.; Hsu, C.D.; et al. Reduced fetal growth velocity precedes antepartum fetal death. Ultrasound Obstet. Gynecol. 2021, 57, 942–952. [Google Scholar] [CrossRef] [PubMed]
- Savirón-Cornudella, R.; Esteban, L.M.; Aznar-Gimeno, R.; Dieste Pérez, P.; Pérez-López, F.R.; Castán-Larraz, B.; Sanz, G.; Tajada-Duaso, M. Prediction of Large for Gestational Age by Ultrasound at 35 Weeks and Impact of Ultrasound-Delivery Interval: Comparison of 6 Standards. Fetal Diagn. Ther. 2021, 48, 15–23. [Google Scholar] [CrossRef]
- Dudley, N.J. A systematic review of the ultrasound estimation of fetal weight. Ultrasound Obstet. Gynecol. 2005, 25, 80–89. [Google Scholar] [CrossRef] [PubMed]


Publisher’s Note: MDPI stays neutral with regard to jurisdictional claims in published maps and institutional affiliations. |
© 2021 by the authors. Licensee MDPI, Basel, Switzerland. This article is an open access article distributed under the terms and conditions of the Creative Commons Attribution (CC BY) license (https://creativecommons.org/licenses/by/4.0/).