Article

Progressive Comparison of Density Assessment of Alveolar Bone Graft in Patients with Unilateral and Bilateral Cleft

1
Craniofacial Research Center, Department of Plastic and Reconstructive Surgery, Chang Gung Memorial Hospital, Chang Gung University, Taoyuan 33302, Taiwan
2
Department of Medical Imaging and Intervention, Chang Gung Memorial Hospital at Keelung, College of Medicine, Chang Gung University, Taoyuan 33302, Taiwan
3
Craniofacial Research Center, Department of Craniofacial Orthodontics, Chang Gung Memorial Hospital, Chang Gung University, Taoyuan 33302, Taiwan
4
Clinical Trial Center, Biostatistics Unit, Chang Gung Memorial Hospital, Taoyuan 33302, Taiwan
*
Author to whom correspondence should be addressed.
J. Clin. Med. 2021, 10(21), 5143; https://doi.org/10.3390/jcm10215143
Submission received: 30 September 2021 / Revised: 27 October 2021 / Accepted: 29 October 2021 / Published: 1 November 2021
(This article belongs to the Special Issue Bone Regeneration in Dentistry, Oral and Maxillofacial Surgery)

Abstract

:
(1) Background: Continuing to observe the grafted bone mineral density (BMD) is essential to ensure the success of alveolar bone grafting (ABG) in patients with cleft lip and palate. This study elaborates on three methods that can be used to evaluate the progressive BMD. (2) Methods: Forty patients with unilateral or bilateral clefts receiving ABG were enrolled. Cone beam computed tomography (CBCT) scans were taken at 6 months (T1) and 2 years (T2) postoperatively. In CBCT, measurements were obtained on three different planes using the circle located 1 mm from the adjacent teeth (Method A), the largest circle within the defect (Method B), or the central circle with a diameter of 2 mm (Method C). The BMD was the average density of the three planes and was adjusted by pogonion density. Bland–Altman plots were used to evaluate the agreement of each method. Inter-rater reliability was confirmed by the intraclass correlation coefficient (ICC). (3) Results: For Method A, B, and C, the mean-adjusted BMD (BMD/pogonion density, BMDa) was 17.44%, 17.88%, and 17.69%, respectively, at T1 (p = 0.495), and 22.51%, 22.87%, and 22.74%, respectively, at T2 (p = 0.690); the density enhancement rates were 40.54%, 38.92%, and 43.15% (p = 0.382). Significant differences between the BMDa at T1 and T2 were observed (p < 0.001, <0.001, and 0.001, for Method A, B, and C, respectively). The volume of the grafted tissue remained stable during T1 and T2, and no significant correlation between density enhancement rate and volume loss was observed. (4) Conclusions: A significant increase in the BMD of grafted tissue was observed in the 2-year postoperative follow-up. The three methods for measuring BMDa via CBCT can be applied in post-ABG evaluations.

1. Introduction

Secondary alveolar bone grafting (ABG) is a standard and necessary procedure for treating patients with cleft lip and palate (CLP) [1,2]. ABG serves to stabilize the continuity of the maxillary arch, provide support for tooth eruption, provide bony support for adjacent teeth to ensure long-term periodontal health, support the alar base, and improve speech. If ABG is not performed properly, midface retrusion may be observed when the bone matures [3,4,5].
Traditionally, imaging assessment of ABG outcomes is conducted using two-dimensional radiography and scales, such as the Bergland scale; however, computed tomography (CT)-based studies have indicated that conventional radiographs tend to overestimate bone growth [3,6,7]. Cone beam CT (CBCT) is characterized by a low radiation dose and cost effectiveness; it can be performed using high-quality three-dimensional (3D) image acquisition and reconstruction parameters, including the characteristics of the maxillary alveolar anatomical boundaries; therefore, researchers are increasingly using CBCT for diagnostic and therapeutic evaluations of ABG [8,9,10]. Because the success of a dental implantation is affected by bone quality, assessing bone height and bone mineral density (BMD) is essential before a dental implantation is performed [11]. Many studies have examined bone height; however, few have proposed methods for assessing the BMD of grafted tissue and tracking the progression of BMD.
A new ABG method for Scarpa’s fascia grafts [2] and obtained CBCT images of children with CLP were adopted to prepare for postoperative follow-up. In the present study, we used the aforementioned CBCT images to design a new and easier method for evaluating the BMD of grafted tissue. We proposed three methods for measuring BMD and hypothesized that the three methods would yield similar results. In addition, we compared the density of grafted tissues with adjacent bony tissue in the growth stages and assessed the density enhancement rate in the first 2 years after surgery.

2. Patients and Methods

2.1. Patient Information and Data Collection

Patients who had nonsyndromic unilateral or bilateral cleft lip and alveolus with or without cleft palate and received ABG at our center between 2016 and 2018 were enrolled. All patients underwent at least 2 CBCT scans after operation. Postoperative image acquisition was performed at two time points, namely 6 months (T1) and 2 years (T2) after ABG. The ABG procedures for all patients were performed by the same senior surgeon as per the protocol of our center, which comprises an iliac cancellous bone graft and the sealing of Scarpa’s fascia to the defect before the bone graft is packed [2,12]. Patients who had syndromic cleft alveolus, who underwent two-stage ABG (performed for bilateral cases), or who exhibited failed grafted tissue were excluded. In total, 40 patients were enrolled in the present study. The demographic and clinical variables for ABG were retrospectively collected through a review of medical charts. All CBCT images were obtained using an i-CAT CBCT scanner (Imaging Sciences International, Hatfield, PA, USA); the parameters for the images are as follows: 120 kVp, voxel size of 0.4 × 0.4 × 0.4 mm3, 40 s scan time, and 22 × 16 cm field of view.

2.2. BMD Measurement and Volumetric Analysis

The Picture Archiving and Communication System (PACS) was applied for BMD analysis. Three methods (A, B, and C), which differed by the size of the selected area, were designed to measure Hounsfield units (HUs). For all methods, we first identified the most superior and inferior planes transecting the grafted tissue on the coronal view image; subsequently, the middle plane of the grafted tissue was identified (Figure 1). For the selected plane, the distance between two teeth had to be larger than 2.5 mm in diameter; this was required for all three methods. On each plane, the selected circular area is defined as being located at the midpoint of the line between the centers of the two adjacent teeth. The HU of the selected area could be obtained using PACS.
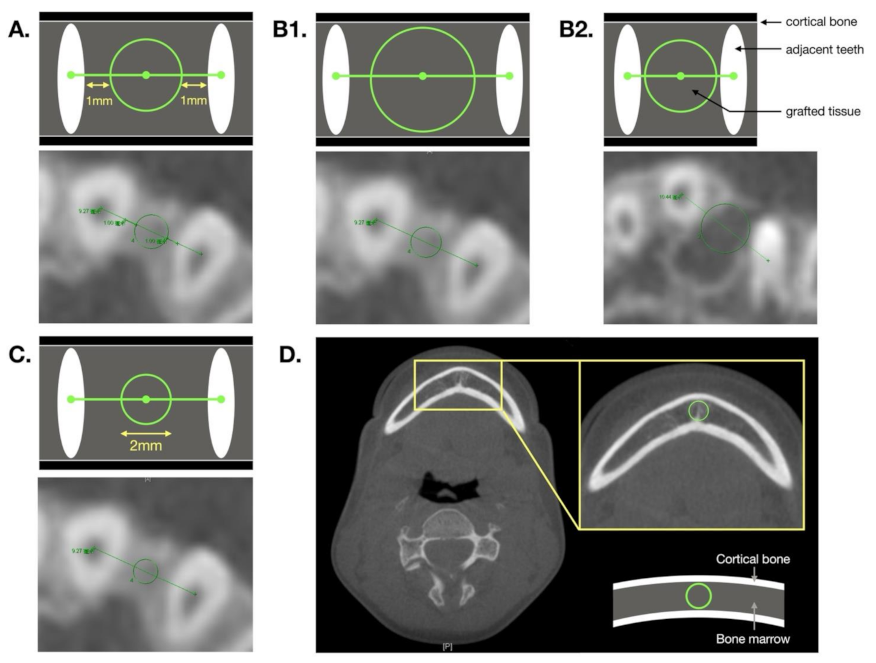
For Method A, the circular zone located 1 mm from the adjacent teeth was selected. For Method B, the largest circular zone that exactly transected the two adjacent teeth or was tangent to the surrounding cortical bone was selected. For Method C, a circle was drawn with a diameter of 2 mm. Furthermore, the largest circular zone in the pogonion bone marrow was selected to obtain its HU at T1 and T2; this was the reference for calibration (Figure 1 and Figure 2). HU was the reference for BMD and represented the average density of the three planes. We defined the adjusted BMD (BMDa, %) using the following formula:
BMD a %   =   HU selected   zone HU pogonion   ×   100 .
The density enhancement rate (%) was calculated using the following formula:
Density   enhancing   rate   %   =   BMD aT 2     BMD aT 1 BMD aT 1   ×   100 ,
where BMDaT2 is BMDa measured at T2 and BMDaT1 is the BMDa at T1.
All the BMD and pogonion density data were measured by one examiner and repeated twice on different dates that were separated by a 3-month interval; the second round of measurements was conducted without reference to the first-round measurements. The average of the six sets of data (two measurements for each of the three planes) was used for the final statistical analysis.
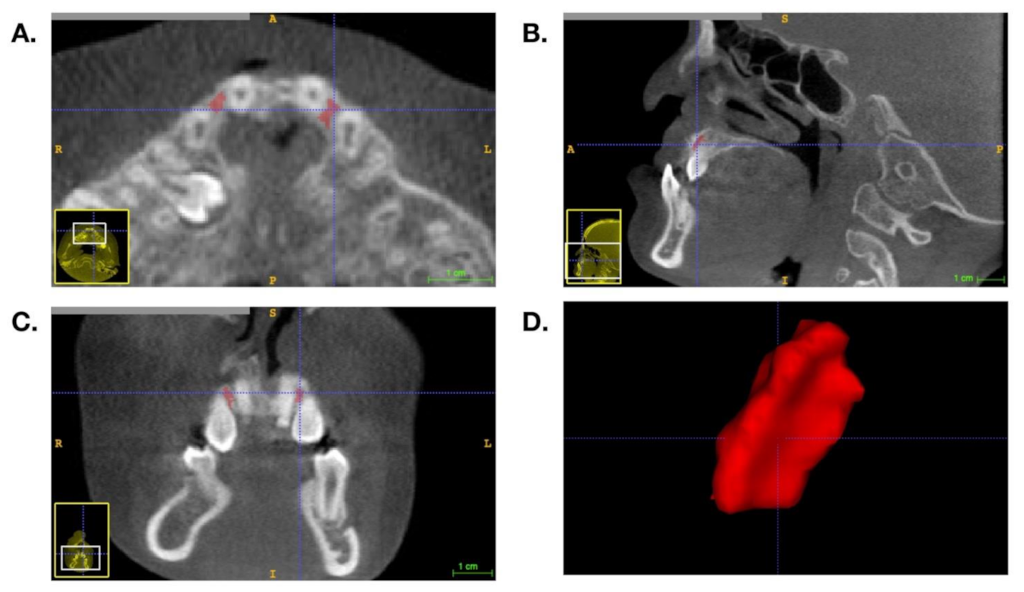
As for the volumetric analysis, segmentation of the grafted tissue was performed using ITK-SNAP 3.6.0 open-source software [13]. The grafted tissue was confirmed by axial, coronal, and sagittal views at the same time (Figure 3), and the volume of the segmented area could be displayed.

2.3. Statistical Analysis

In the descriptive analysis, continuous variables were summarized by means ± standard deviations, with an independent t-test used to compare the means between two groups; a chi-squared test or Fisher’s exact test was used for categorical data. Furthermore, we performed analysis of variance (ANOVA) with repeated measurements to compare the differences between the three methods with respect to BMDa measurements and density enhancement rates; a Friedman test was used for the bilateral group due to a small sample size. To compare the differences in BMDa at T1 and T2, we performed a paired t-test or a Wilcoxon signed-rank test for the bilateral group. The correlation between volume loss and density enhancement rate between T1 and T2 was performed using Spearman’s correlation. Bland–Altman plots were used to evaluate the agreement of each method. Intraclass correlation coefficients (ICCs) were calculated as the measure of the intrarater reliability for the three methods. All data were analyzed using SPSS 24.0 (SPSS, Chicago, IL, USA). A p-value of less than 0.05 was considered statistically significant by two-tailed tests.

3. Results

3.1. Subject Characteristics

The study was approved by the relevant institutional review board. In total, 40 patients, who had an average age of 9.45 ± 1.61 years when they received ABG, were enrolled. Among the patients, 60% (n = 24) were male and 82.5% (n = 33) had unilateral alveolar cleft. The first (T1) and second (T2) follow-up CBCTs were taken at 6.67 ± 0.82 months and 24.04 ± 5.15 months after ABG (Table 1).

3.2. Adjusted BMD and Density Enhancement Rate

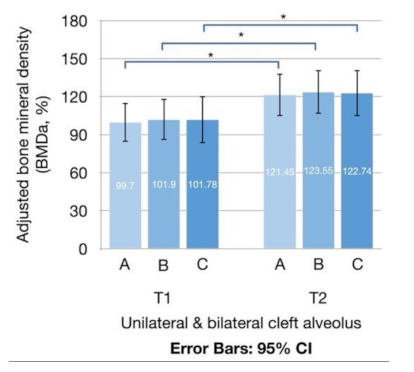
The mean BMDa of the grafted tissue at T1 were 99.70% ± 49.18%, 101.90% ± 52.05%, and 101.78% ± 59.74% when measured by Method A, B, and C, respectively; at T2, the values were 121.45% ± 53.98%, 123.55% ± 55.52%, and 122.74% ± 58.81% for Method A, B, and C, respectively (Figure 4 and Table 2). When comparing the progressing density between T1 and T2, significant differences in BMDa were observed for the three measurement methods (p = 0.004, 0.004, and 0.009 for Method A, B, and C, respectively). The mean density enhancement rates were 35.85% ± 51.99%, 35.61% ± 51.75%, and 37.59% ± 56.41% for Method A, B, and C, respectively. When comparing the differences in measurement values between the three methods, no statistical difference was observed for BMDa (p = 0.536 at T1 and p = 0.689 at T2) or density enhancement rate (p = 0.681).
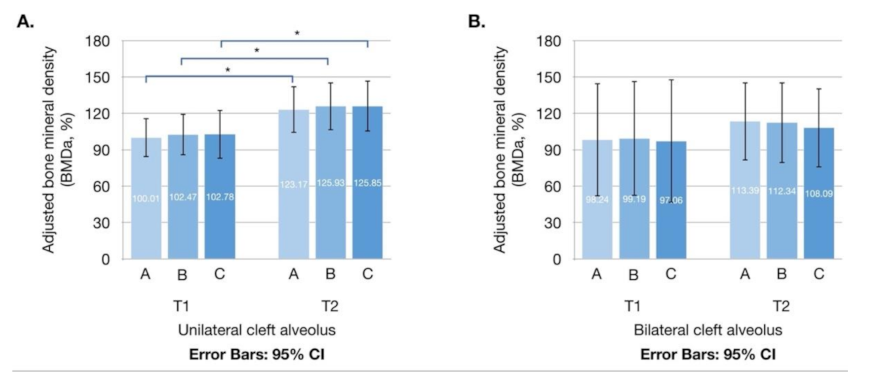
In unilateral cases, the BMDa at T1 (BMDaT1) was 100.01% ± 46.98%, 102.47% ± 50.33%, and 102.78% ± 58.83%; the BMDa at T2 (BMDaT2) was 123.17% ± 56.38%, 125.93% ± 57.82%, and 125.85% ± 61.62%; and the density enhancement rate was 36.37% ± 54.51%, 36.60% ± 53.41%, and 38.25% ± 58.38% for Method A, B, and C, respectively. No significant difference was observed for BMDaT1 (p = 0.524), BMDaT2 (p = 0.572), or density enhancement rate (p = 0.725) when comparing the differences among the three methods. In bilateral cases, the BMDaT1 was 98.24% ± 62.85%, 99.19% ± 63.97%, and 97.06% ± 68.63%; the BMDaT2 was 113.39% ± 43.53%, 112.34% ± 45.00%, and 108.09% ± 43.88%; and the density enhancement rate was 33.41% ± 41.41%, 30.94% ± 46.47%, and 34.46% ± 49.91% for Method A, B, and C, respectively. No significant difference was observed for BMDaT1 (p = 0.066), BMDaT2 (p = 1.000) or density enhancement rate (p = 0.66) when comparing the differences among the three methods.
When comparing the progressing density between T1 and T2, significant differences in BMDa were observed for the three measurement methods in unilateral cases (p = 0.007, 0.007, and 0.012 for Method A, B, and C, respectively; Figure 5A); however, no significant differences were noted in bilateral cases (p = 0.237, 0.237, and 0.237 for Method A, B, and C, respectively; Figure 5B).
The volume of the grafted tissue in unilateral cases was 107.65 mm3 ± 97.67 mm3 at T1 and 103.52 mm3 ± 94.33 mm3 at T2; the volume of the grafted tissue in bilateral cases was 77.68 mm3 ± 47.57 mm3 at T1 and 72.93 mm3 ± 31.62 mm3 at T2. There was no significant difference when comparing the progressing volumetric change between T1 and T2 (p = 0.781 in unilateral cleft, and p = 0.893 in bilateral cleft) (Table 2). Besides, the density enhancement rate of the grafted tissue did not show a significant relationship with the volume loss (Table 3).

3.3. Intrarater Reliability

Our Bland–Altman analysis verified an agreement between the two examinations performed using each method at the two follow-up time points (Figure 6). Excellent intrarater reliability (ICCs > 0.9) was noted for all measurements (Supplementary Table S1) [14].

4. Discussion

No significant differences among the three methods were observed with respect to the BMDa and density enhancement rates obtained for unilateral and bilateral alveolar cleft cases. This demonstrates that all three methods produced consistent results. However, each method still has certain advantages and disadvantages.
For Method A, the 1 mm gap relative to both adjacent teeth ensures that BMD measurements are not affected by the density of those teeth. Zhang et al. [11] proposed a similar method; the difference is that Method A involves the drawing of a maximum circle in the axial view, whereas the method proposed by Zhang et al. involves the drawing of six circles with a fixed size of 5 mm2 in the sagittal view. A drawback of Method A is that the surrounding cortical bone density and air density are often included in examinations of patients with large alveolar gaps. Therefore, the density of the selected area does not fully represent that of the grafted tissue.
For Method B, the selected circle contains most of the grafted area; hence, the risk of the surrounding cortical bone and air density being included is low relative to Method A. Consequently, the BMD obtained using Method B is a more objective reference. However, because the distance to the two teeth is almost tangential, but not contained, measurements must be carefully taken to avoid including sections of the teeth and therefore reducing the accuracy of the density results.
For Method C, each selected area is fixed in size and smaller than that used in Method A; therefore, the surrounding tissue is unlikely to be included, and the density of the selected area is more consistently represented relative to the other methods. However, if the alveolar gap is too wide, the selected area will not be representative of the overall density. BMD may decrease due to osteonecrosis caused by poor peripheral blood circulation [15]; furthermore, bone density may not be evenly distributed, and in patients with large alveolar gaps the results are less representative of overall BMD relative to those obtained using the other methods.
The positive and negative aspects as well as the operating precautions of the three methods are summarized in Table 4. Of the three methods, Method B theoretically produced the most representative density results for grafted tissue; however, our study revealed no statistical differences among the three methods. In addition, the correlation among all three methods was high (ICCs > 0.9), indicating that all three measurement methods can be applied in clinical settings.
Studies have investigated, but not validated, measurements of grafted tissue density in patients with orofacial clefts; between-method differences in BMD measurements were also observed [9,11,16,17,18,19]. Zhang et al. [11] obtained the following mean BMD measurements for grafted tissue: 406.51 ± 71.28 HU at 3 months postoperatively and 409.53 ± 46.37 HU at 6 months postoperatively. Benlidayi et al. [16] selected three sequential cross-sectional slices from the center of the corresponding area in CBCT images and obtained a BMD of 426.1 ± 120.1 HU with a mean follow-up period of 47.33 ± 13.79 months. Canan et al. [17] obtained BMD (273.9 ± 175.4 HU at 6 months postsurgery) measurements in five sequential axial planes with a height of 1 mm from multislice CTs. In the study of Shawky et al. [19], BMD was measured on the axial view of CTs, and the data obtained were presented as the mean of three points detected in the same axial section; these researchers obtained a mean density of 384.03 HU (214.98–549.95 HU) at 6 months postsurgery. Rychlik et al. [18] calculated BMD at every tomographic layer of the grafted tissue in CTs and obtained a grafted tissue density of 352.22 ± 84.93 HU at 6 months after ABG.
As stated, the three methods proposed in the present study have their advantages and disadvantages. Variations in density expressed as HU may be present in CBCT images [10]; therefore, the use of HU to represent BMD on unadjusted CBCT images is a drawback of the methods proposed by Zhang et al. [11] and Benlidayi et al. [16] Moreover, when children grow older, their bone density also changes [20]. To solve the aforementioned problems, we selected the density of pogonion bone marrow as the reference for calibration, thereby ensuring that our methods and collected data would be more representative of actual density than the methods proposed in previous studies. Nasoalveolar molding (NAM) solves the problem of inconsistencies in alveolar gap approximation. In our current protocol for CLP, presurgical management with NAM was used to restrict the size of the alveolar gap [12]. However, the method proposed by Shawky et al. [19] is only suitable for cases involving large alveolar gaps. Canan et al. [17] introduced a calibration method based on cerebrospinal fluid density for grafted tissue BMD analyses; this calibration method is similar to that applied in our study. However, the changes in BMD during growth must also be considered.
Although between-study comparisons of BMD results are not meaningful, changes in BMD over time can be compared across studies. Feichtinger et al. [21] discovered that the resorption of the bone graft (which is defined by volumetric change) occurred mainly within the first year after surgery, with a mean rate of 49.5%; however, a three-dimensional CT-based analysis revealed a mean bone volume that was 81% of the original value at 3 years after surgery. Several studies have assessed bone resorption using bone density. Zhang et al. [11] reported that BMD remained stable between 3 and 6 months postoperatively, and Canan et al. [17] also did not detect any significant difference in BMD among the results obtained at 3 (332.1 ± 103.0 HU), 6 (273.9 ± 175.4 HU), and 12 months (263.7 ± 183.4 HU) postoperatively.
The present study had a long follow-up period, during which the BMDa of grafted tissue at 6 months and at 2 years after ABG was compared. In our study, we calculated the volume of the grafted tissue at 6 months and 2 years after the ABG procedure, and there was no significant difference between the volume at T1 and T2, which indicated that the bone volume remained stable and the results were consistent with the current consensus. Bone resorption with volume loss was published in many studies [21,22,23]; however, a significant increase in the BMDa in grafted tissue was observed, and some grafted tissue BMD results were even higher than the pogonion BMD, which was compatible with the process of successful bone graft healing, i.e., osteoconduction, osteoinduction, and osteogenesis [24,25]. No correlation was observed between the density enhancement and the volume loss, thereby verifying that our ABG method was effective and that the BMDa of grafted tissue increased with age.
Van der Meij et al. [23] compared unilateral and bilateral groups by using CT scans to compare the transplanted bone 1 year after ABG; their results indicated that less bone remained in the bilateral group (45%) relative to the unilateral group (70%); however, no significance testing was performed due to the small sample size. In a study by Tai et al. [22], postsurgical 1-year follow-up axial and coronal CT scans revealed no significant difference in maximal bone height, coronal volume, axial volume, maximal anteroposterior width, and maximal transverse width between unilateral and bilateral groups. In our present study, the density enhancement rate was also higher in unilateral group, but no significant difference was observed, which was consistent with the current study. Furthermore, all seven children with bilateral CLP underwent one-stage ABG, indicating that even for the more difficult bilateral cleft ABG procedure (relative to the unilateral cleft ABG procedure) [26,27,28], the progressive consolidation of grafted tissue was not inferior to that of the unilateral group.
The present study had several limitations. First, only 40 patients were examined. A larger sample size will increase the representativeness of the results pertaining to the improved BMDa in the patients with alveolar clefts who underwent ABG surgery. Such a sample size will also allow us to better detect differences between the three methods. Second, only seven patients were diagnosed as having bilateral CLP, which limited our ability to compare unilateral and bilateral CLP results; the rarer occurrence of bilateral CLP may also explain the lack of such comparisons in the literature. Third, all patients received the same ABG procedure; therefore, we could not compare the difference in density enhancement rates relative to other surgical procedures. Last, we used adjusted BMD (%) in order to overcome the concern of density variations expressed as HU in CBCT images, as well as to assess the progression of BMD at different time points in cleft children; however, BMD should theoretically be the absolute value utilizing the solid phantoms, which will be improved in future studies.
We used CBCT-derived PACS as the analysis tool due to its accessibility to all surgeons; however, PACS compresses data and thus produces images of poorer quality relative to original images [29]. Furthermore, we only selected three planes as a representation of density to increase the feasibility of our proposed methods in clinical settings. In the future, 3D medical imaging software can be used to analyze images in the Digital Imaging and Communications in Medicine (i.e., DICOM) format; this allows researchers to obtain the BMDa of all grafted tissue and compare the BMDa results obtained using our proposed methods with the BMDa of the overall graft area. Finally, bone density increases when the bone matures, and these pediatric patients with CLP will undergo further orthognathic surgery (OGS) at our craniofacial center at the age of 16–20 years [12]. Therefore, with the pre-OGS CBCTs of this group [12], we can track the progressive changes in BMD between ABG and OGS.

5. Conclusions

The present study reports a significant increase in BMDa from 6 months to 2 years after ABG, verifying the success and feasibility of the current ABG surgical protocol. We also observed that the patients’ BMDa increased by time. Furthermore, we demonstrated that our three proposed methods for measuring BMDa in CBCT images can be applied in post-ABG evaluations.

Supplementary Materials

The following are available online at https://www.mdpi.com/article/10.3390/jcm10215143/s1, Table S1: Inter-rater reliability for bone mineral density (BMD) measurements of alveolar defect and pogo-nion density.

Author Contributions

Conception and design: P.-R.C. and P.-Y.C. Acquisition, analysis, and interpretation of data: P.-R.C., Y.-C.L., B.C.-J.P. and H.-J.T. Drafting the article: P.-R.C. and Y.-C.L. Critically revising the article: L.-J.L. and P.-Y.C. Reviewed submitted version of manuscript. All authors have read and agreed to the published version of the manuscript.

Funding

This work was supported in part by a grant from the Ministry of Science and Technology, Taiwan (MOST 107-2314-B-182A-117—NRRPG3H0081), and the Craniofacial Research Center, Taoyuan Chang Gung Memorial Hospital (CMRPG3J0823, CMRPG3L0361).

Institutional Review Board Statement

The study (201600968A3) was approved by the Ethics Committee for Human Research, Taoyuan Chang Gung Memorial Hospital, Taiwan.

Informed Consent Statement

Not applicable.

Data Availability Statement

The data presented in this study are available on request from the corresponding author. The data are not publicly available due to privacy.

Acknowledgments

The authors would like to thank Tanny Yi-Tan Hong for imaging data processing and the Biostatistics Unit, Clinical Trial Center, Chang Gung Memorial Hospital for statistical assistance.

Conflicts of Interest

The authors declare that the article content was composed in the absence of any commercial or financial relationships that could be construed as a potential conflict of interest.

References

  1. Bajaj, A.K.; Wongworawat, A.A.; Punjabi, A. Management of alveolar clefts. J. Craniofac. Surg. 2003, 14, 840–846. [Google Scholar] [CrossRef]
  2. Lonic, D.; Yamaguchi, K.; Chien-Jung Pai, B.; Lo, L.J. Reinforcing the Mucoperiosteal Pocket with the Scarpa Fascia Graft in Secondary Alveolar Bone Grafting: A Retrospective Controlled Outcome Study. Plast. Reconstr. Surg. 2017, 140, 568e–578e. [Google Scholar] [CrossRef] [PubMed]
  3. Semb, G. Alveolar bone grafting. Front. Oral Biol. 2012, 16, 124–136. [Google Scholar] [CrossRef]
  4. Chou, P.Y.; Denadai, R.; Hallac, R.R.; Dumrongwongsiri, S.; Hsieh, W.C.; Pai, B.C.; Lo, L.J. Comparative Volume Analysis of Alveolar Defects by 3D Simulation. J. Clin. Med. 2019, 8, 1401. [Google Scholar] [CrossRef] [PubMed] [Green Version]
  5. Coots, B.K. Alveolar bone grafting: Past, present, and new horizons. Semin. Plast. Surg. 2012, 26, 178–183. [Google Scholar] [CrossRef] [PubMed] [Green Version]
  6. Han, K.; Jeong, W.; Yeo, H.; Choi, J.; Kim, J.; Son, D.; Oh, S.; Kim, C. Long-term results of secondary alveolar bone grafting using a technique to harvest pure calvarial cancellous bone: Evaluation based on plain radiography and computed tomography. J. Plast. Reconstr. Aesthet. Surg. 2017, 70, 352–359. [Google Scholar] [CrossRef] [PubMed]
  7. Weissler, E.H.; Paine, K.M.; Ahmed, M.K.; Taub, P.J. Alveolar Bone Grafting and Cleft Lip and Palate: A Review. Plast. Reconstr. Surg. 2016, 138, 1287–1295. [Google Scholar] [CrossRef]
  8. De Mulder, D.; Cadenas de Llano-Pérula, M.; Jacobs, R.; Verdonck, A.; Willems, G. Three-dimensional radiological evaluation of secondary alveolar bone grafting in cleft lip and palate patients: A systematic review. Dentomaxillofac. Radiol. 2018, 48, 20180047. [Google Scholar] [CrossRef]
  9. Stasiak, M.; Wojtaszek-Słomińska, A.; Racka-Pilszak, B. Current methods for secondary alveolar bone grafting assessment in cleft lip and palate patients—A systematic review. J. Craniomaxillofac. Surg. 2019, 47, 578–585. [Google Scholar] [CrossRef] [PubMed]
  10. Pauwels, R.; Jacobs, R.; Singer, S.R.; Mupparapu, M. CBCT-based bone quality assessment: Are Hounsfield units applicable? Dentomaxillofac. Radiol. 2015, 44, 20140238. [Google Scholar] [CrossRef] [Green Version]
  11. Zhang, D.Z.; Xiao, W.L.; Zhou, R.; Xue, L.F.; Ma, L. Evaluation of Bone Height and Bone Mineral Density Using Cone Beam Computed Tomography After Secondary Bone Graft in Alveolar Cleft. J. Craniofac. Surg. 2015, 26, 1463–1466. [Google Scholar] [CrossRef] [PubMed]
  12. Pai, B.C.J.; Hung, Y.T.; Wang, R.S.H.; Lo, L.J. Outcome of Patients with Complete Unilateral Cleft Lip and Palate: 20-Year Follow-Up of a Treatment Protocol. Plast. Reconstr. Surg. 2019, 143, 359e-367e. [Google Scholar] [CrossRef]
  13. Yushkevich, P.A.; Piven, J.; Hazlett, H.C.; Smith, R.G.; Ho, S.; Gee, J.C.; Gerig, G. User-guided 3D active contour segmentation of anatomical structures: Significantly improved efficiency and reliability. Neuroimage 2006, 31, 1116–1128. [Google Scholar] [CrossRef] [Green Version]
  14. Koo, T.K.; Li, M.Y. A Guideline of Selecting and Reporting Intraclass Correlation Coefficients for Reliability Research. J. Chiropr. Med. 2016, 15, 155–163. [Google Scholar] [CrossRef] [PubMed] [Green Version]
  15. Pape, H.C.; Evans, A.; Kobbe, P. Autologous bone graft: Properties and techniques. J. Orthop. Trauma. 2010, 24 (Suppl. S1), S36–S40. [Google Scholar] [CrossRef] [PubMed]
  16. Benlidayi, M.E.; Tatli, U.; Kurkcu, M.; Uzel, A.; Oztunc, H. Comparison of bovine-derived hydroxyapatite and autogenous bone for secondary alveolar bone grafting in patients with alveolar clefts. J. Oral Maxillofac. Surg. 2012, 70, e95–e102. [Google Scholar] [CrossRef]
  17. Canan, L.W., Jr.; da Silva Freitas, R.; Alonso, N.; Tanikawa, D.Y.; Rocha, D.L.; Coelho, J.C. Human bone morphogenetic protein-2 use for maxillary reconstruction in cleft lip and palate patients. J. Craniofac. Surg. 2012, 23, 1627–1633. [Google Scholar] [CrossRef] [PubMed]
  18. Rychlik, D.; Wójcicki, P. Bone graft healing in alveolar osteoplasty in patients with unilateral lip, alveolar process, and palate clefts. J. Craniofac. Surg. 2012, 23, 118–123. [Google Scholar] [CrossRef]
  19. Shawky, H.; Seifeldin, S.A. Does Platelet-Rich Fibrin Enhance Bone Quality and Quantity of Alveolar Cleft Reconstruction? Cleft. Palate Craniofac. J. 2016, 53, 597–606. [Google Scholar] [CrossRef]
  20. Weaver, C.M.; Gordon, C.M.; Janz, K.F.; Kalkwarf, H.J.; Lappe, J.M.; Lewis, R.; O’Karma, M.; Wallace, T.C.; Zemel, B.S. The National Osteoporosis Foundation’s position statement on peak bone mass development and lifestyle factors: A systematic review and implementation recommendations. Osteoporos. Int. 2016, 27, 1281–1386. [Google Scholar] [CrossRef] [Green Version]
  21. Feichtinger, M.; Mossböck, R.; Kärcher, H. Assessment of bone resorption after secondary alveolar bone grafting using three-dimensional computed tomography: A three-year study. Cleft. Palate Craniofac. J. 2007, 44, 142–148. [Google Scholar] [CrossRef]
  22. Tai, C.C.; Sutherland, I.S.; McFadden, L. Prospective analysis of secondary alveolar bone grafting using computed tomography. J. Oral Maxillofac Surg. 2000, 58, 1241–1249. [Google Scholar] [CrossRef] [PubMed]
  23. Van der Meij, A.J.; Baart, J.A.; Prahl-Andersen, B.; Valk, J.; Kostense, P.J.; Tuinzing, D.B. Bone volume after secondary bone grafting in unilateral and bilateral clefts determined by computed tomography scans. Oral Surg. Oral Med. Oral Pathol. Oral Radiol. Endod. 2001, 92, 136–141. [Google Scholar] [CrossRef]
  24. Lee, C.Y.; Prasad, H.S.; Suzuki, J.B.; Stover, J.D.; Rohrer, M.D. The correlation of bone mineral density and histologic data in the early grafted maxillary sinus: A preliminary report. Implant. Dent. 2011, 20, 202–214. [Google Scholar] [CrossRef] [PubMed]
  25. Roberts, T.T.; Rosenbaum, A.J. Bone grafts, bone substitutes and orthobiologics: The bridge between basic science and clinical advancements in fracture healing. Organogenesis 2012, 8, 114–124. [Google Scholar] [CrossRef] [PubMed] [Green Version]
  26. Abyholm, F.E.; Bergland, O.; Semb, G. Secondary bone grafting of alveolar clefts. A surgical/orthodontic treatment enabling a non-prosthodontic rehabilitation in cleft lip and palate patients. Scand. J. Plast. Reconstr. Surg. 1981, 15, 127–140. [Google Scholar] [CrossRef] [PubMed]
  27. Collins, M.; James, D.R.; Mars, M. Alveolar bone grafting: A review of 115 patients. Eur. J. Orthod. 1998, 20, 115–120. [Google Scholar] [CrossRef] [PubMed] [Green Version]
  28. Heidbuchel, K.L.; Kuijpers-Jagtman, A.M.; Freihofer, H.P. An orthodontic and cephalometric study on the results of the combined surgical-orthodontic approach of the protruded premaxilla in bilateral clefts. J. Craniomaxillofac. Surg. 1993, 21, 60–66. [Google Scholar] [CrossRef]
  29. Khorasani, R. Image compression in your PACS: Should you do it? What are the issues? J. Am. Coll. Radiol. 2004, 1, 780–781. [Google Scholar] [CrossRef]
Figure 1. Identification of the selected planes. (A) Identified the most superior and inferior planes transecting the grafted tissue on the coronal view image; subsequently, the middle plane of the grafted tissue was identified. (B) The pogonion was identified on the sagittal view.
Jcm 10 05143 g001
Figure 2. Axial image of grafted area with schemes. (A) For Method A, a circle located 1 mm from the adjacent teeth is sketched. For Method B, the largest circular area of grafted tissue is sketched. Two possible conditions apply for Method B. (B1) If the distance between two adjacent teeth is greater than the thickness of the alveolar defect, a circle tangent to surrounding cortical bone density is drawn. (B2) If the distance between two adjacent teeth is less than the thickness of the alveolar defect, a circle transecting the two adjacent teeth is selected. (C) For Method C, a central circle with a diameter of 2 mm is drawn. Note that (A), (B1), and (C) are images of the same patient. (D) The largest circular zone within the pogonion bone marrow is used to obtain the pogonion density for calibration.
Jcm 10 05143 g002
Figure 3. Volumetric analysis of the grafted tissue using ITK-SNAP 3.6.0 open-source software. (A) The axial view of the grafted tissue. (B) The sagittal view of the grafted tissue. (C) The coronal view of the grafted tissue. (D) The 3D display of the grafted tissue after segmentation.
Jcm 10 05143 g003
Figure 4. Error bars of adjusted bone mineral density (BMDa) of grafted tissue at T1 and T2. Stars indicate significant differences in BMDa between T1 and T2: *, p < 0.05.
Jcm 10 05143 g004
Figure 5. Error bars of adjusted bone mineral density (BMDa) of grafted tissue at T1 and T2 in individuals with (A) unilateral alveolar cleft and (B) bilateral alveolar cleft. Significant differences among the three methods were observed in unilateral alveolar cleft (n = 33), but no significant differences among the three methods (p = 0.176 for all three methods) were observed in bilateral alveolar cleft. Stars indicate significant differences in BMDa between T1 and T2: *, p < 0.05.
Jcm 10 05143 g005
Figure 6. Distribution and consistency of results of two measurements using the same method and Bland–Altman plots. (A1), (B1), and (C1) plots are comparisons of two measurements conducted using Method A, B, and C, respectively, at T1; (A2), (B2), and (C2) plots are comparisons of two measurements conducted using Method A, B, and C, respectively, at T2. The mean values of differences in BMDa between two measurements of grafted tissue are approximately at and evenly distributed within the zero line, indicating that the two methods produced similar results.
Jcm 10 05143 g006
Table 1. Patient demographics and follow-up length.
VariablesAll (n = 40)Unilateral (n = 33)Bilateral (n = 7)p-Value
Age at ABG (year)9.45 ± 1.619.36 ± 1.699.86 ± 1.120.467
Men (n (%))24 (60.0%)19 (57.6%)5 (71.4%)0.681
ABG method
    Scarpa’s fascia (n (%))40 (100%)33 (100%)7 (100%)
    Bone graft from iliac crest (n (%))40 (100%)33 (100%)7 (100%)
Graft volume (mL) [2]2.0 ± 0.63.8 ± 1.0
CBCT follow-up post-surgery
    First follow-up (month)6.67 ± 0.826.60 ± 0.796.97 ± 0.930.284
    Second follow-up (month)24.04 ± 5.1523.65 ± 4.6525.86 ± 7.230.465
Data are presented as means ± standard deviations or n (%) and stratified by unilateral or bilateral alveolar cleft with an independent t-test to compare means between two groups. Categorical data are examined using the chi-squared test or Fisher’s exact test.
Table 2. Outcomes of cone beam computed tomography.
VariablesMethodOverallUnilateralBilateralp-Value
BMDT1 (HU)
A293.88 ± 135.27292.63 ± 135.45299.78 ± 145.080.901
B299.50 ± 137.54298.70 ± 137.77303.25 ± 147.390.983
C295.84 ± 150.24295.79 ± 150.20296.08 ± 162.450.996
BMDT2 (HU)
A360.90 ± 175.46358.34 ± 184.54373.01 ± 135.140.844
B366.90 ± 178.55366.16 ± 186.93370.41 ± 144.320.955
C361.97 ± 185.96362.65 ± 195.78358.78 ± 142.620.961
BMDaT1 (%)
A99.70 ± 49.18100.01 ± 46.9898.24 ± 62.850.932
B101.90 ± 52.05102.47 ± 50.3399.19 ± 63.970.882
C101.78 ± 59.74102.78 ± 58.8397.06 ± 68.630.882
BMDaT2 (%)
A121.45 ± 53.98123.17 ± 56.38113.39 ± 43.530.669
B123.55 ± 55.52125.93 ± 57.82112.34 ± 45.000.563
C122.74 ± 58.81125.85 ± 61.62108.09 ± 43.880.475
Density enhancement rate (%)
A35.85 ± 51.9936.37 ± 54.5133.41 ± 41.410.893
B35.61 ± 51.7536.60 ± 53.4130.94 ± 46.470.796
C37.59 ± 56.4138.25 ± 58.3834.46 ± 49.910.874
Pogonion densityT1 (HU) 312.86 ± 81.68309.06 ± 84.55330.77 ± 69.170.530
Pogonion densityT2 (HU) 309.60 ± 88.60303.99 ± 93.26336.06 ± 60.400.391
VolumeT1 (mm3) 107.65 ± 97.6777.68 ± 47.57
VolumeT2 (mm3) 103.52 ± 94.3372.93 ± 31.62
Data are presented as means ± standard deviations. Differences between patients with unilateral and bilateral cleft were determined using an independent t-test. Difference in BMDa between T1 and T2 in unilateral cases determined by a paired t-test: p = 0.007, 0.007, and 0.012 for Method A, B, and C, respectively; difference in BMDa between T1 and T2 in bilateral cases determined by a Wilcoxon signed-rank test: p = 0.237, 0.237, and 0.237 for Method A, B, and C, respectively. BMD, bone mineral density; BMDa, adjusted BMD.
Table 3. The correlation between volumetric loss and density enhancement rate of the grafted tissue was calculated using Spearman’s correlation.
Density Enhancement Rate (%)
Method AMethod BMethod C
Unilateral cleft alveolus
     Volume loss (%) *
        Correlation coefficient®–0.0380.0190.008
        p-value0.8440.9210.966
Bilateral cleft alveolus
    Volume loss (%) *
       Correlation coefficient®0.4000.4000.700
       p-value0.5050.5050.188
* Volume loss (%) = [(volume of the grafted tissue at T2 − volume at T1)/volume at T1] × 100.
Table 4. Comparison of the positive and negative aspects from each method.
Method AMethod BMethod C
DefinitionCircular zone is located 1 mm from the adjacent teeth.The largest circular zone that exactly transects the two adjacent teeth or is tangent to the surrounding cortical bone.A circle is drawn with a diameter of 2 mm.
Positive aspectBMD measurements are not affected by the density of adjacent teeth.
  • The selected circle contains most of the grafted area.
  • Risk of including the surrounding cortical bone and air density is low, relative to Method A.
  • Selected circle is fixed in size.
  • BMD measurements are not affected by the density of adjacent teeth.
Negative aspectThe surrounding cortical bone density and air density are often included in examinations of patients with large alveolar gaps.Easily contains adjacent tooth density or surrounding cortical bone.Not representative of the overall density in cases with a larger alveolar gap.
Operating precautionsWhen measuring, care must be taken of to avoid including sections of the teeth.Ensure that the distance from the circle to the two adjacent teeth is equal when measuring.
Publisher’s Note: MDPI stays neutral with regard to jurisdictional claims in published maps and institutional affiliations.