Abstract
Background: Many epidemiological and experimental studies have established that myopia is caused by a complex interaction between common genetic and environmental factors. The objective of this study was to describe and compare the allelic and genotypic frequencies of the rs524952 (GJD2), rs8000973 (ZIC2), rs1881492 (CHRNG), rs1656404 (PRSS56), rs235770 (BMP2), and rs7744813 (KCNQ5) SNPs (single-nucleotide polymorphism) between responder and nonresponder patients who had undergone a two-year treatment with lenses for myopia control. Method: Twenty-eight participants from the MiSight Assessment Study Spain (MASS), who had received treatment for myopia control for two years with MiSight contact lenses, were examined. The criteria for better/worse treatment response was the change in the axial length (< / ≥ 0.22 mm two years after the treatment). The clinical procedure consisted of the extraction of a saliva sample, and the participants also underwent an optometric examination. Genetic data were analyzed using SNPStats software (Catalan Institute of Oncology, Barcelona, Spain), and statistical analysis was performed using SPSS v.25 (SPSS Inc., Chicago, IL, USA). Demographic variables were analyzed using the Student’s t-test. Results: The T allele, the one with the lowest frequency, of the “rs235770” SNP was associated with a better treatment response [AL/CR (axial length/corneal radius): OR = 3.37; CI = 1.079–10.886; SE (spherical equivalent): OR = 1.26; CI: = 0.519–57.169; p = 0.019). By performing haplotype analysis, significant differences were found between the rs235770…rs1881492 and rs235770–rs1656404 polymorphisms. The latter presented a strong linkage disequilibrium with each other (r2 ≥ 0.54). Conclusion: The result of lens therapies for myopia control could vary depending on genetic variants. Studies with a larger sample are needed to confirm the results presented in this pilot study.
1. Introduction
Myopia is the most common refractive error globally. It is considered a public health problem that results in significant visual loss and is associated with a wide variety of ocular pathologies [1].
Nowadays, pathological myopia is one of the leading causes of visual impairment in Asian and Occidental populations. As the prevalence of myopia and pathological myopia increases throughout the world, the need for the active prevention of myopia progression and the treatment of its potential complications increases [2].
Many epidemiological and experimental studies have analyzed the role of environmental and genetic factors in the development of myopia. Environmental risk factors can only explain a limited proportion of the overall variance, whereas the importance of genetic factors in the susceptibility to myopia is widely known [3]. In particular, since the appearance of the first genome-wide association studies (GWAS) in 2009, many common genetic variants that are associated with myopia and refractive error have been successfully identified [4].
As a result, in the last years, some consortia such as the International Consortium for Refractive Error and Myopia (CREAM), the 23andMe Research Team, and the UK Biobank Eye and Vision Consortium have tried to identify the genetic variants that are associated with different refractive errors, and in particular with myopia. In 2013, 39 SNPs (single-nucleotide polymorphism) associated with myopia were found [5,6]. In 2016, Tideman et al. [7], as members of the CREAM consortium, analyzed the influence of these SNPs on axial length (AL) and corneal radius (CR) depending on age. In those younger than 10 years old, three loci (GJD2, CHRNG, ZIC2) were linked with AL/CR (axial length/corneal radius). In the age group between 10 and 25 years old, there were four linked loci (BMP2, KCNQ5, A2BP1, CACNA1D). In adults, there were 20 linked loci. In 2018, using a meta-analysis that included 160,420 subjects, the number of genetic polymorphisms linked with refractive errors increased from 39 to 161 [8]. In the large-scale study published in 2020 in Nature Genetics, Hysi et al. [9] conducted a meta-analysis of GWAS, which involved 542,934 European participants, in which 336 new genetic loci, linked with the refractive error, were identified.
As such, all of these studies provide new potential knowledge regarding the evolution of myopia and perhaps promising leads for future therapies. However, the genetic architecture and its molecular mechanisms have not been made clear, and genetic risk prediction models are still improving. So, through a better understanding of the genetic influence, we will be able to establish foundations for the relationship between heredity and the appearance of myopia. Likewise, it will be possible to improve the efficacy of current treatment methods for myopia control (optical, pharmacological, environmental, and surgical). In 2019, Wildsoet et al. [10] concluded that the efficacy of these methods varies significantly depending on the individual and that no treatment is considered to be 100% effective in all patients. Therefore, more research is needed to understand the factors and mechanisms underlying the said variability.
Consequently, based on the study by Tideman et al. [7], the six SNPs with the highest association with the development of myopia have been selected. So, the objective of this study was to describe and compare the allelic and genotypic frequencies of the rs524952, rs8000973, rs1881492, rs1656404, rs235770, and rs7744813 SNPs of the GJD2, ZIC2, CHRNG, PRSS56, BMP2, and KCNQ5 genes, respectively, between responder and nonresponder patients who had undergone a two-year treatment with lenses for myopia control. Besides, associations between each SNP and several endophenotypes (spherical equivalent (SE), AL, and CR) were analyzed.
2. Experimental Section
2.1. Study Design and Approval of the Ethics Committee
A pilot, analytical, longitudinal, ambispective, and case-control study was performed. The study was positively evaluated by the CEIM–Regional Ethics Committee of the Department of Health of the Community in Madrid. Besides, the study was developed following the standards recognized by the Declaration of Helsinki by the World Medical Association (64th General Meeting, Fortaleza, Brazil, October 2013), as well as the Good Clinical Practice Guidelines, and it was also in line with the Spanish legislation for the treatment of samples of human origin (Law 14/2007) on biomedical research and the Royal Decree 1716/2011.
Likewise, all of the participants declared a clear understanding of the study objectives by signing the informed consent form.
2.2. Selection of SNPs
A total of six SNPs were included in this analysis. The SNPs were selected based on the study of Tideman et al. [7]. Tideman et al. included 18 cohorts from 8 different countries in Europe, Asia, and Oceania with 5490 children under the age of 10, 5000 subjects between the ages of 10 and 25, and 16,274 adults over the age of 25. The results showed an association with the AL/CR ratio in 9 of the 39 SNPs in children under 10 years old, remaining in 3 SNPs after Bonferroni correction; 10 SNPs remaining in 5 in the group aged between 10 and 25; and 31 SNPs that remained in 19 in the adult group.
Table 1 shows the characteristics of the nine SNPs associated with the AL/CR ratio.

Table 1.
Genes related to AL/CR ratio in children under 10 years old.
Considering the best values in the significance of the beta effect, the SNPs described in GJD2, ZIC2, PRSS56, BMP2, and KCNQ5 were chosen for this study.
2.3. Study Population and Inclusion Criteria
All the participants in the MiSight Assessment Study Spain (MASS) who had worn Misight (CooperVision, Pleasanton, CA, USA) for two years to control myopia, fitting in the Novovisión Ophthalmological Clinic and Universidad Europea de Madrid, between September 2013 and June 2016 (age at the start of treatment: 8–12 years, myopia level at the beginning of the treatment: −0.75 to –4.00 D) [11] were invited to participate in this study. So, 28 of the 41 participants were finally enrolled in this new study.
Following the MASS study, the value of 0.22 mm change in axial length was chosen as cut-off point to select the subjects in responders and nonresponders. Therefore, patients were classified according to their response to treatment as responders (axial length below 0.22 mm two years after the treatment) and nonresponders (patients with an axial length equal to or greater than 0.22 mm two years after treatment).
Furthermore, the MASS study showed that the samples were homogeneous in demographic, refractive, binocular, accommodative, and biometric baseline data.
2.4. Clinical Procedure
The protocol was divided into two parts: the extraction of a saliva sample and the performance of an optometric examination:
(a) Oral mucosa sample extraction: Genomic DNA was extracted from oral mucosa samples collected with a sterile swab using the commercial High Pure PCR Template Preparation Kit (Roche) once the treatment had finished. The extracted samples were kept in the UEM Biomedicine laboratory at −20 °C for analysis. The genetic variants were analyzed using a PCR-Q in Step One Plus equipment (Life Technologies, Foster City, CA, USA) with TaqMan probes predesigned by Life Technologies. The DNA samples were kept by the Biomedicine unit of the Universidad Europea de Madrid until the end of the study. Once the study concluded, the DNA samples were destroyed unless the patient or guardian had granted authorization, through the informed consent form, for the research team to incorporate his/her sample into a collection of biological samples that were registered in the Carlos III Institute of Health for subsequent studies within this line of research.
(b) Optometric examination: The standard procedure consisted of taking visual acuity without and with correction, objective refraction using the retinoscopy technique without cycloplegia, subjective refraction, accommodative and binocular tests (cover–uncover, alternating cover test, ocular motility, accommodative delay, amplitude of accommodation, and near point of convergence), ocular biometry (axial length) using the IOLMaster® (5.4.4.006; Carl Zeiss Jen GmbH, Jena, Germany), corneal topography (Wavelight Allegro Topolyzer, TX, USA). Finally, the front segment (eyelid, eyelashes, lid margin, cornea, conjunctiva, and crystalline) was evaluated using a slit lamp.
2.5. Statistical Analysis
The allelic and genotypic frequencies, as well as the Hardy–Weinberg equilibrium (HWE), linkage disequilibrium (LD), and odds ratio (OR), were analyzed with the SNPStats software (Catalan Institute of Oncology, Barcelona, Spain; http://bioinfo.iconcologia.net/SNPstats) [12] and the Haploview 4.1 software (Broad Institute, Cambridge, MA, USA) [13].
Statistical analysis was performed using the SPSS 25.0 program (SPSS Inc., Chicago, IL, USA). For the descriptive analysis, the absolute (n) and relative (%) frequencies were used to express the qualitative variables and the mean ± standard deviation (SD) (or the median and interquartile range, IQR) for the quantitative ones as a function of its parametric behavior. For this purpose, the Shapiro–Wilk test of normality was used.
The AL/CR relation was calculated by dividing the average AL of the right and left eye (in mm) by the average CR of the right and left eye (in mm). The value of the spherical equivalent (SE) and AL/CR used was that obtained after two years of treatment.
Differences between groups were analyzed by Chi-square test (qualitative variables) and Student’s t-test (quantitative variables). Levene’s test was performed to check the homogeneity between the variances, with the result that the variances were homogeneous (p > 0.05).
The OR value was used to analyze the association of multiple SNPs with the endophenotypes of myopia between the groups (responders and nonresponders) and the regressions between quantitative (SE, CR, and AL) variables were used to show the relationships. To evaluate the statistical significance, a cleavage site p > 0.05 was considered. The p values and the OR in the genotype models were adjusted for age and sex.
To analyze the differences in the genotype and allelic frequencies of the polymorphisms between responders and nonresponders, these were calculated based on the three heredity models: additive (R/R vs. R/nR vs. nR/nR), dominant (R/R + R/nR vs. nR/nR), and recessive (R/R vs. R/nR + nR/nR), where R was the risk allele and nR was the no-risk allele.
3. Results
3.1. Clinical and Demographic Characteristics
A total of 28 subjects aged between 14 and 20 years (mean age: 17.25 ± 1.48) participated in this study; 60.7% (n = 17) of the participants were women and 39.3% were men (n = 11).
With regards to gender, the mean value of the SE (RE+LE/2) in male participants was −2.42 ± 1.32D (range: −0.87D–−5.00D) and in female participants it was −3.80 ± 1.50D (range: −1D–−7.37D). The mean AL value in male participants was 24.60 ± 0.55 mm (range:23.56–25.43 mm) and in female participants, it was 25.01 ± 0.76 mm (range: 23.25–26.32 mm). Significant differences were found between gender and the SE value (p = 0.019; CI: 0.24–2.50); however, no significant differences were found between gender and AL (p > 0.05; CI: −0.96–0.13).
With regards to age, the value of SE (14 years: −3.12 ± 0.18D; 20 years: −5.03 ± 1.29D) and AL (14 years: 24.94 ± 0.28 mm; 20 years: 25.21 ± 1.25 mm) increased progressively over the years (p < 0.05).
Table 2 (responders: n = 15; nonresponders: n = 13) shows the clinical characteristics of the participants based on their response to treatment. Of all of the responder participants, 63.3% had low myopia (−0.5D < SE > −3D) and 36.7% had moderate myopia (−3D < SE > −6D). Of all of the nonresponders, 19.2% had low myopia (−0.5D < SE > −3D), 65.4% had moderate myopia (−3D < SE > −6D), and 15.4% had high myopia (SE > −6D). SE mean value was higher in responders than nonresponders (−2.62 ± 1.35 vs. −3.98 ± 1.50, respectively, p = 0.019; 95% CI of the difference: −2.46–0.24).
Table 2.
Clinical characteristics of the study population.
3.2. Allele and Genotypic Frequencies
The observed genotype frequencies for these six SNPs were all in HWE for the responder and nonresponder groups (p > 0.05).
3.2.1. AL/CR
Table 3 shows the results of the allelic association for the six SNPs (adjusted for age, gender, and AL/CR). The comparison of allele frequencies between the responder and nonresponder groups revealed a nominally significant difference for the rs235770 polymorphism (p = 0.049). In contrast, none of the five remaining SNPs showed a significant association with the axial length and keratometry (p > 0.05). Table 4 shows the results of the genotype association of the six SNPs, which were calculated for each of the three heredity models (additive, dominant, and recessive). There was no significant association for any of the six SNPs in the additive or dominant models. Furthermore, the rs235770 SNP showed significant differences between the responders and nonresponders in the recessive heredity model (p = 0.043).
Table 3.
Results of allelic association (adjusted for age, gender, and AL/CR).
Table 4.
Results of genotypic association (adjusted for age, gender, and AL/CR).
3.2.2. SE
Table 5 shows the results of the allelic and genotypic association for the six SNPs (adjusted for age, gender, and SE). The comparison of allele frequencies between the responder and nonresponder groups revealed a nominally significant difference for the rs235770 (p = 0.009). On the contrary, none of the five remaining SNPs showed a significant association with the SE (p > 0.05).
Table 5.
Results of allelic association (adjusted for age, gender, and SE).
Table 6 shows the results of the genotype association of the six SNPs, which has been calculated for each of the three heredity models (additive, dominant, and recessive). There was no significant association between responders and nonresponders in the three heredity models of the “rs235770” SNP.
Table 6.
Results of genotypic association (adjusted for age, gender, and SE).
3.3. Haplotype Analysis
Haplotype analysis was performed to help understand the effects of the rs235770 polymorphism of the BMP2 gene on the manifestation of response to treatment. Figure 1 shows the linkage disequilibrium patterns for the six SNPs. These six SNPs were not located in a haplotype block. However, two SNPs (rs235770 and rs1656404) had a strong linkage disequilibrium with each other (r2 ≥ 0.54).
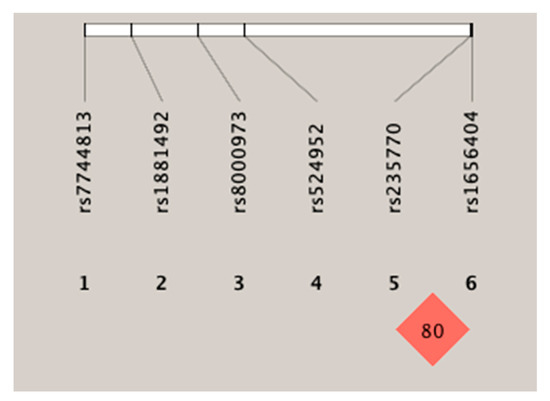
Figure 1.
Linkage disequilibrium of the six SNPs (single-nucleotide polymorphism).
Table 7 shows the linkage disequilibrium analysis for the six polymorphisms. A significant association was found between the rs235770–rs1881492 and rs235770–rs1656404 polymorphisms.
Table 7.
Linkage disequilibrium analysis.
Also, the haplotype analysis was performed with the most significant result from the linkage disequilibrium analysis. The most significant difference was observed in the association of the rs235770–rs1656404 polymorphisms (p = 0.0286). The GT haplotype was strongly associated with response to treatment (p = 0.008). The GT haplotype was more frequent in responders than in nonresponders (50% compared to 16.53%), suggesting a possible effect. In turn, an association was found for the AC haplotype, although it was not significant and this was present in 13.3% of the responders compared to just 5% of the nonresponders (Table 8). The GT and AC haplotype subjects had an OR of 22.99 and 5.06, respectively. That is to say, a greater risk of response to treatment.
Table 8.
Haplotype analysis.
4. Discussion
This study provides new evidence about how genetic variants influence the results of myopia control therapy with MiSight. Despite the considerable number of studies on myopia control, no treatment is 100% effective. This is probably due to the limited knowledge of the etiology of the complex and multifactorial condition that is myopia. As a result, most optical and pharmacological treatments are based on different causal theories [14]. For this reason, we designed this pilot study in which the rs524952, rs8000973, rs1881492, rs1656404, rs235770, and rs7744813 SNPs of the GJD2, ZIC2, CHRNG, PRSS56, BMP2, and KCNQ5 genes, respectively, were analyzed and compared between responder and nonresponder patients who had undergone a two-year treatment with lenses for myopia control. According to many GWAS, some genes involved along the retina-to-sclera signaling cascade have been discovered. Genetic changes in individual loci only cause small changes in the phenotype, but collectively these disturbances are responsible for more significant changes in the retina-to-sclera signaling cascade, therefore explaining the differences in the refractive error between one individual and another [6,15,16]. The changes in the synthesis of retinoic acid (RA) of the retina and choroid, as well as the RA effects on scleral growth, suggest that RA plays an important role in ocular growth regulation and, consequently, in the development of myopia. It seems to be part of the retina-to-sclera signaling cascade and possibly the effector of scleral extracellular change [17,18,19].
As such, in the first large-scale GWAS, which was conducted by members of the CREAM consortium, the inferred tracts included neurotransmission (GRIA4), ion transportation (KCNQ5), retinoic acid metabolism (RDH5), extracellular matrix remodeling (LAMA2, BMP2), and ocular development (SIX6, PRSS56) [6,15]. In another GWAS performed by the 23andMe consortium, a set of overlapped tracts was identified: neuronal development (KCNMA1, RBFOX1, LRRC4C, NGL-1, DLG2, TJP2), extracellular matrix remodeling (ANTXR2, LAMA2), visual cycle (RDH5, RGR, KCNQ5), corporal and ocular growth (PRSS56, BMP4, ZBTB38, DLX1), and retinal ganglion cells (ZIC2, SFRP1) [17]. The recent study by Tedja et al. [8] confirmed the previous findings and identified the functional contributions in the development of refractive errors in all of the cell types of the neurosensory retina: the retinal pigment epithelium, the vascular endothelium, and the extracellular matrix. Furthermore, novel mechanisms such as rod-and-cone bipolar synaptic neurotransmission, anterior segment morphology, and angiogenesis were present in the newly identified genes. Therefore, they concluded that refractive errors are caused by a light-dependent retina-to-sclera signaling cascade.
The present study has unveiled a possible association between rs235770 polymorphism in the BMP2 gene and the response to treatment that needs to be confirmed in a new study with a larger sample. In turn, it has been found that the T allele, the one with the lowest frequency, could present a greater risk of response to treatment. This result is in line with those recorded in the study by Tideman et al. [7], in which the risk allele of the BMP2 gene was associated with a lower AL/CR ratio in the group of children aged 10 years and lower. The study conducted by Li et al. [20] found that the BMP2 gene may be involved in the development of myopia, but it does not have a primary role in the retinal and choroidal signals regulating scleral remodeling. Curiously, BMP2 gene expression studies performed on chickens showed that the mRNA of this gene in the retinal pigment epithelium presents a positive or negative regulation depending on the dynamic image. This means that when the image is focused behind the retina, the mRNA is regulated negatively and the vitreous chamber is enlarged, therefore suggesting that the BMP2 gene plays a bidirectional role in modulating ocular growth and that the BMP2 gene could be used in therapeutic interventions for controlling myopia [21].
The BMP2 gene is one of the most widely studied growth factors in the BMP family and it is essential for the development of the retina, meaning, therefore, that it plays important roles in embryogenesis and osteogenesis [22]. Furthermore, BMP signaling is neuroprotective for retina ganglion cells after damage and it is involved in glial cell proliferation [23,24]. As such, BMP2 can act as a negative growth regulator in the retina and RPE. The study that was conducted by Mathura et al. [25] observed a decreased level of BMP2 in the retina during the development of myopia, but this level increased after recovery from myopia. In this way, as this alteration occurred following significant structural change, the retinal level of BMP2 is likely associated with ocular growth and the development of myopia.
Nonetheless, the effect of BMP2 alleles on controlling myopia is still unknown and to be able to explore its underlying mechanisms, further research will be required.
Besides, this study did not find an association between the rs524952 (GJD2 gene), rs8000973 (ZIC2 gene), rs1881492 (CHRNG gene), rs1656404 (PRSS56 gene), and rs7744813 (KCNQ5 gene) polymorphisms and the response to the myopia control treatment. The studies by Simpson et al. [26] and Verhoeven et al. [5] found that these genes were involved in the development of myopia.
Through haplotype analysis, an association between the rs1656404 and rs235770 polymorphisms was found. In this sense, the study by Paylaki et al. [27] identified the PRSS56 gene as a potential therapeutic target for modulating ocular growth aimed at preventing or slowing down myopia. This suggests a possible relationship between the PRSS56 gene and BMP2, although there is still no scientific evidence.
In turn, a significant association was observed for the GT haplotype, as this was present approximately two times more often in the responder group than in the nonresponder group. Therefore, the rs235770 T allele affected the response for the myopia control treatment. However, according to the study conducted by Yoshikawa et al. [28], the strength of association of a single SNP only reflects signals that include nearby SNPs with moderate LD and it is far from reflecting the genetic influences of the gene itself.
Consequently, a significant association was found in this study between the SNP “rs235770” with AL/CR. Nevertheless, and despite having obtained a significant p value (<0.05), it is not possible to confirm whether an association with SE exists, as the confidence interval crosses 1. The authors believe that this is due to the small size of the sample as well as to the CI calculations, which are usually very conservative, especially in the cases of small samples and exact estimates.
It should be noted, SNPs that originate in genes affect the gene product, but do not modify the protein product of genes. In this way, whether this change contributes to a disease phenotype is dependent on the specific consequence of the particular genetic variant and disease type [29].
One of the limitations of this study is the low sample size. Limited sample sizes can sometimes lead to false positive or false negative results in an association study. It would be interesting to carry out a study with a larger sample size and to confirm the association between the T allele of the polymorphism rs235770 of the BMP2 gene and the response to myopia control treatment with MiSight contact lenses, as well as studying its effect on different ethnic groups, ages, and gender.
Therefore, these findings will prove useful for future research in which detailed genetic mapping of the polymorphisms associated with myopia is performed to improve the strategies and interventions that are currently in place to slow the progression of myopia.
5. Conclusions
A pilot design study has been presented, which shows that the result of contact lens treatments for myopia control could vary depending on genetic variants.
The T allele, the one with the lowest frequency of the rs235770 polymorphism of the BMP2 gene, could have a significant effect on the response for the myopia control treatment.
Further studies with larger samples are needed to confirm the results of this pilot study.
Author Contributions
Conceptualization, C.A.-P., M.Á.S.-T., C.M.-P., C.S.-D., T.Y., C.A.-V., and C.V.-C.; methodology, C.A.-P., M.Á.S.-T., C.M.-P., and C.V.-C.; software, C.S.-D. and T.Y.; validation, C.A.-P., M.Á.S.-T., C.M.-P., and C.V.-C.; formal analysis, C.A.-P., M.Á.S.-T., C.M.-P., C.S.-D., T.Y., C.A.-V., and C.V.-C.; investigation, C.A.-P., M.Á.S.-T., C.M.-P., and C.V.-C.; resources, C.A.-P., M.Á.S.-T., C.M.-P., and C.V.-C.; data curation, C.A.-P., M.Á.S.-T., C.M.-P., and C.V.-C.; writing—original draft preparation, C.A.-P., M.Á.S.-T., C.M.-P., and C.V.-C.; writing—review and editing, C.A.-P., M.Á.S.-T., C.M.-P., and C.V.-C.; visualization, C.A.-P., M.Á.S.-T., C.M.-P., and C.V.-C.; supervision, C.A.-P., M.Á.S.-T., C.M.-P., and C.V.-C.; project administration, C.A.-P., M.Á.S.-T., and C.V.-C.; funding acquisition, C.A.-P., M.Á.S.-T., and C.V.-C. All authors have read and agreed to the published version of the manuscript.
Funding
This research received no external funding.
Institutional Review Board Statement
The study was conducted according to the guidelines of the Declaration of Helsinki, and approved by the Institutional Review Board of CEIM–Regional Ethics Committee of the Department of Health of the Community in Madrid (CIPI/19/102; April 25, 2019).
Informed Consent Statement
Informed consent was obtained from all subjects involved in the study.
Conflicts of Interest
The authors declare no conflict of interest.
References
- Morgan, I.G.; Ohno-Matsui, K.; Saw, S.M. Myopia. Lancet 2012, 379, 1739–1748. [Google Scholar] [CrossRef]
- Ang, M.; Wong, T.Y. Updates on Myopia, 1st ed.; Springer: Singapore, 2020. [Google Scholar]
- Liao, X.; Yap, M.K.H.; Leung, K.H.; Kao, P.Y.P.; Liu, L.Q.; Yip, S.P. Genetic Association Study of KCNQ5 Polymorphisms with High Myopia. BioMed Res. Int. 2017, 2017, 3024156. [Google Scholar] [CrossRef] [PubMed]
- Tedja, M.S.; Haarman, A.E.G.; Meester-Smoor, M.A.; Kaprio, J.; Mackey, D.A.; Guggenheim, J.A.; Hammond, C.J.; Verhoeven, V.J.M.; Klaver, C.C.W.; CREAM Consortium. IMI—Myopia Genetics Report. Investig. Opthalmol. Vis. Sci. 2019, 60, M89–M105. [Google Scholar] [CrossRef]
- Verhoeven, V.J.; Hysi, P.G.; Wojciechowski, R.; Fan, Q.; Guggenheim, J.A.; Höhn, R.; MacGregor, S.; Hewitt, A.W.; Nag, A.; Cheng, C.-Y.; et al. Genome-wide meta-analyses of multiancestry cohorts identify multiple new susceptibility loci for refractive error and myopia. Nat. Genet. 2013, 45, 314–318. [Google Scholar] [CrossRef] [PubMed]
- Kiefer, A.K.; Tung, J.Y.; Do, C.; Hinds, D.A.; Mountain, J.L.; Francke, U.; Eriksson, N. Genome-wide analysis points to roles for extracellular matrix remodeling, the visual cycle, and neuronal development in myopia. PLoS Genet. 2013, 9, e1003299. [Google Scholar] [CrossRef]
- Tideman, J.W.; Fan, Q.; Polling, J.R.; Guo, X.; Yazar, S.; Khawaja, A.; Höhn, R.; Lu, Y.; Jaddoe, V.W.; Yamashiro, K.; et al. When do myopia genes have their effect? Comparison of genetic risks between children and adults. Genet. Epidemiol. 2016, 40, 756–766. [Google Scholar] [CrossRef] [PubMed]
- Tedja, M.S.; Wojciechowski, R.; Hysi, P.G.; Eriksson, N.; Furlotte, N.A.; Verhoeven, V.J.M.; Iglesias, A.I.; Meester-Smoor, M.A.; Tompson, S.W.; Fan, Q.; et al. Genome-wide association meta-analysis highlights light-induced signaling as a driver for refractive error. Nat. Genet. 2018, 50, 834–848. [Google Scholar] [CrossRef]
- Hysi, P.G.; Choquet, H.; Khawaja, A.P.; Wojciechowski, R.; Tedja, M.S.; Yin, J.; Simcoe, M.J.; Patasova, K.; Mahroo, O.A.; Thai, K.K.; et al. Meta-analysis of 542,934 subjects of European ancestry identifies new genes and mechanisms predisposing to refractive error and myopia. Nat. Genet. 2020, 52, 401–407. [Google Scholar] [CrossRef]
- Wildsoet, C.F.; Chia, A.; Cho, P.; Guggenheim, J.A.; Polling, J.R.; Read, S.; Sankaridurg, P.; Saw, S.-M.; Trier, K.; Walline, J.J.; et al. IMI—Interventions Myopia Institute: Interventions for Controlling Myopia Onset and Progression Report. Investig. Opthalmol. Vis. Sci. 2019, 60, M106–M131. [Google Scholar] [CrossRef]
- Ruiz-Pomeda, A.; Pérez-Sánchez, B.; Valls, I.; Prieto-Garrido, F.L.; Gutiérrez-Ortega, R.; Villa-Collar, C. MiSight Assessment Study Spain (MASS). A 2-year randomized clinical trial. Graefe’s Arch. Clin. Exp. Ophthalmol. 2018, 256, 1011–1021. [Google Scholar] [CrossRef]
- Solé, X.; Guinó, E.; Valls, J.; Iniesta, R.; Moreno, V. SNPStats: A web tool for the analysis of association studies. Bioinformatics 2006, 22, 1928–1929. [Google Scholar] [CrossRef] [PubMed]
- Barrett, J.C.; Fry, B.; Maller, J.; Daly, M.J. Haploview: Analysis and visualization of LD and haplotype maps. Bioinformatics 2005, 21, 263–265. [Google Scholar] [CrossRef]
- Tideman, J.W.L.; Polling, J.R.; Vingerling, J.R.; Jaddoe, V.W.V.; Williams, C.; Guggenheim, J.A.; Klaver, C.C.W. Axial length growth and the risk of developing myopia in European children. Acta Ophthalmol. 2017, 96, 301–309. [Google Scholar] [CrossRef] [PubMed]
- Hysi, P.G.; Mahroo, O.A.; Cumberland, P.; Wojciechowski, R.; Williams, K.M.; Young, T.L.; Mackey, D.A.; Rahi, J.S.; Hammond, C.J. Common mechanisms underlying refractive error identified in functional analysis of gene lists from genome-wide association study results in 2 European British cohorts. JAMA Ophthalmol. 2014, 132, 50–56. [Google Scholar] [CrossRef]
- Chandra, A.; Mitry, D.; Wright, A.; Campbell, H.; Charteris, D.G. Genome-wide association studies: Applications and insights gained in Ophthalmology. Eye 2014, 28, 1066–1079. [Google Scholar] [CrossRef] [PubMed][Green Version]
- Troilo, D.; Smith, E.L., 3rd; Nickla, D.L.; Ashby, R.; Tkatchenko, A.V.; Ostrin, L.A.; Gawne, T.J.; Pardue, M.T.; Summers, J.A.; Kee, C.-S.; et al. IMI—Report on experimental models of emmetropization and myopia. Investig. Opthalmol. Vis. Sci. 2019, 60, M31–M88. [Google Scholar] [CrossRef] [PubMed]
- Harper, A.R.; Summers, J.A. The dynamic sclera: Extracellular matrix remodeling in normal ocular growth and myopia development. Exp. Eye Res. 2015, 133, 100–111. [Google Scholar] [CrossRef]
- Hung, G.K.; Mahadas, K.; Mohammad, F. Eye growth and myopia development: Unifying theory and Matlab model. Comput. Biol. Med. 2016, 70, 106–118. [Google Scholar] [CrossRef] [PubMed]
- Li, H.; Wu, J.; Cui, D.; Zeng, J. Retinal and choroidal expression of BMP-2 in lens-induced myopia and recovery from myopia in guinea pigs. Mol. Med. Rep. 2016, 13, 2671–2676. [Google Scholar] [CrossRef] [PubMed]
- Zhang, Y.; Liu, Y.; Wildsoet, C.F. Bidirectional, optical sign-dependent regulation of bmp2 gene expression in chick retinal pigment epithelium. Investig. Opthalmol. Vis. Sci. 2012, 53, 6072–6080. [Google Scholar] [CrossRef] [PubMed]
- Sakuta, H.; Takahashi, H.; Shintani, T.; Etani, K.; Aoshima, A.; Noda, M. Role of bone morphogenic protein 2 in retinal patterning and retinotectal projection. J. Neurosci. 2006, 26, 10868–10878. [Google Scholar] [CrossRef] [PubMed]
- Ueki, Y.; Reh, T.A. Activation of BMP-Smad1/5/8 signaling promotes survival of retinal ganglion cells after damage In Vivo. PLoS ONE 2012, 7, e38690. [Google Scholar] [CrossRef]
- Ueki, Y.; Reh, T.A. EGF stimulates müller glial proliferation via a BMP-dependent mechanism. Glia 2013, 61, 778–789. [Google Scholar] [CrossRef]
- Mathura, J.R., Jr.; Jafari, N.; Chang, J.T.; Hackett, S.F.; Wahlin, K.J.; Della, N.G.; Okamoto, N.; Zack, D.J.; Campochiaro, P.A. Bone morphogenetic proteins-2 and -4: Negative growth regulators in adult retinal pigmented epithelium. Investig. Ophthalmol. Vis. Sci. 2000, 41, 592–600. [Google Scholar]
- Simpson, C.L.; Wojciechowski, R.; Oexle, K.; Murgia, F.; Portas, L.; Li, X.; Verhoeven, V.J.M.; Vitart, V.; Schache, M.; Hosseini, S.M.; et al. Genome-wide meta-analysis of myopia and hyperopia provides evidence for replication of 11 loci. PLoS ONE 2014, 9, e107110. [Google Scholar] [CrossRef]
- Paylakhi, S.; Labelle-Dumais, C.; Tolman, N.G.; Sellarole, M.A.; Seymens, Y.; Saunders, J.; Lakosha, H.; Devries, W.N.; Orr, A.C.; Topilko, P.; et al. Müller glia-derived PRSS56 is required to sustain ocular axial growth and prevent refractive error. PLoS Genet. 2018, 14, e1007244. [Google Scholar] [CrossRef]
- Yoshikawa, M.; Yamashiro, K.; Miyake, M.; Oishi, M.; Akagi-Kurashige, Y.; Kumagai, K.; Nakata, I.; Nakanishi, H.; Oishi, A.; Gotoh, N.; et al. Comprehensive replication of the relationship between myopia-related genes and refractive errors in a large japanese cohort. Investig. Opthalmol. Vis. Sci. 2014, 55, 7343–7354. [Google Scholar] [CrossRef]
- Kinane, D.; Hart, T. Genes and gene polymorphisms associated with periodontal disease. Crit. Rev. Oral Biol. Med. 2003, 14, 430–449. [Google Scholar] [CrossRef] [PubMed]

Publisher’s Note: MDPI stays neutral with regard to jurisdictional claims in published maps and institutional affiliations. |
© 2021 by the authors. Licensee MDPI, Basel, Switzerland. This article is an open access article distributed under the terms and conditions of the Creative Commons Attribution (CC BY) license (http://creativecommons.org/licenses/by/4.0/).