Article

Impact of Integrated Genetic Information on Diagnosis and Prognostication for Myeloproliferative Neoplasms in the Next-Generation Sequencing Era

1
Department of Laboratory Medicine, College of Medicine, The Catholic University of Korea, Seoul 06591, Korea
2
Catholic Genetic Laboratory Center, Seoul St. Mary’s Hospital, College of Medicine, The Catholic University of Korea, Seoul 06591, Korea
3
Department of Hematology, Seoul St. Mary’s Hematology Hospital, College of Medicine, The Catholic University of Korea, Seoul 06591, Korea
*
Authors to whom correspondence should be addressed.
J. Clin. Med. 2021, 10(5), 1033; https://doi.org/10.3390/jcm10051033
Submission received: 17 December 2020 / Revised: 15 February 2021 / Accepted: 18 February 2021 / Published: 3 March 2021
(This article belongs to the Section Hematology)

Abstract

:
Since next-generation sequencing has been widely used in clinical laboratories, the diagnosis and risk stratification of hematologic malignancies are greatly dependent on genetic aberrations. In this study, we analyzed the genomic landscapes of 200 patients with myeloproliferative neoplasms (MPNs) and evaluated the impact of the genomic landscape on diagnosis and risk stratification. Mutations in JAK2, CALR and MPL were detected in 76.4% of MPNs. The proportion of patients with clonal genetic markers increased up to 86.4% when all detectable genetic aberrations were included. Significant co-occurring genetic aberrations potentially associated with phenotype and/or disease progression, including those in JAK2/SF3B1 and TP53/del(13q), del(5q), −7/del(7q) and complex karyotypes, were detected. We also identified genetic aberrations associated with patient outcomes: TP53 and −7/del(7q) were associated with an inferior chance of survival, RUNX1, TP53 and IDH1/2 were associated with leukemic transformation and SF3B1, IDH1/2, ASXL1 and del(20q) were associated with fibrotic progression. We compared risk stratification systems and found that mutation-enhanced prognostic scoring systems could identify lower risk polycythemia vera, essential thrombocythemia and higher risk primary myelofibrosis. Furthermore, the new risk stratification systems showed a better predictive capacity for patient outcome. These results collectively indicate that integrated genetic information can enhance diagnosis and prognostication in patients with myeloproliferative neoplasms.

1. Introduction

Myeloproliferative neoplasms (MPNs) are characterized by the clonal proliferation of hematopoietic cells that are fully differentiated and functional. MPNs are mainly classified into polycythemia vera (PV), essential thrombocythemia (ET) and primary myelofibrosis (PMF), according to disease manifestations. Some rare disease categories, such as chronic neutrophilic leukemia (CNL) and chronic eosinophilic leukemia, are also considered MPNs, in addition to those MPNs that are unclassified. The diagnosis of MPN and the distinction of its disease categories are based on blood cell counts, bone marrow (BM) morphology and molecular testing. In the 2016 WHO classification, the importance of molecular markers was increasing compared to that in the previous version. Mutations in three well-known driver genes (JAK2, CALR, and MPL) are used to diagnose PV, ET and PMF. Recently, CSF3R was identified as a driver gene in CNL [1,2]. JAK2 mutations have been detected in 90% to 95% of PV patients and 50% to 60% of ET and PMF patients [3,4,5]. CALR mutations are the second most common mutation in MPNs, and are found in 20% to 25% of ET and 25% to 30% of PMF patients [6,7,8,9]. MPL mutations are found in 3% of ET patients and 5% of PMF patients [10,11]. Patients without mutations in any of these driver genes can be diagnosed with ET or PMF when their clinical and hematologic features meet specific criteria, which includes clonal mutations in any of the following genes: ASXL1, EZH2, TET2, IDH1/2, SRSF2, and SF3B1 [1,9]. Knowledge of the mutational landscape not only facilitates the objective diagnosis of MPN, but also can potentially be used as a prognostic factor. This area of research has benefited from the application of next-generation sequencing (NGS) technology in clinical laboratories as well as research laboratories. Important gene mutations associated with patient outcomes, such as mutations in TP53 and ASXL1, have been identified using NGS approaches [12,13,14,15,16].
The risk stratification of MPNs is based on clinical and hematologic features. Advanced age, leukocytosis and venous thrombosis are considered to be risk factors for survival in PV [17] and ET [18]. PMF-specific risk models, such as the International Prognostic Scoring System (IPSS) [19], Dynamic IPSS (DIPSS) [20] and DIPSS-plus (which includes cytogenetic abnormalities in addition to DIPSS), have been developed [21]. The results of recent studies indicate that gene mutations are significant prognostic factors in MPN, and mutation-enhanced prognostic systems for MPNs have been introduced [22,23,24]. These systems can be used to determine the risk for survival as well as disease progression, including leukemic transformation and fibrotic progression [25,26]. Moreover, the integration of genetic information with clinical variables can enable the prediction of patient outcomes and allow for the development of personalized therapeutic plans based on the consideration of causal biologic mechanisms [27,28,29]. It is challenging (at least in the present moment) because data are too limited to make a consensus across ethnicities and countries under different clinical environments.
In this study, we analyzed genetic aberrations using cytogenetic and molecular genetic methods (including NGS) to reveal their impact on the diagnosis of MPNs in the current era. We also tried to evaluate their contributions to risk stratification for survival as well as disease progression.

2. Materials and Methods

2.1. Patients and Samples

Among patients diagnosed with MPN and treated at Seoul St. Mary’s Hematology Hospital, a total of 200 patients who requested an NGS study or available DNA samples for NGS analysis were included in this study. MPN diagnoses and their subtypes were strictly re-evaluated and classified based on the 2017 WHO classifications [1]. Demographics and clinical and hematologic features, including outcome data, were reviewed retrospectively from medical records. Most DNA samples were from BM aspirates taken at the time of diagnosis, but some were collected at the time of symptom aggregation during observation or over the course of treatment.

2.2. Molecular Analysis

DNA was extracted using the QIAamp DNA Mini Kit (Qiagen, Hilden, Germany). DNA concentration and purity were assessed using an ND-1000 spectrophotometer (Nanodrop Technologies, Wilmington, DE, USA). NGS was performed using a customized myeloid panel (the “SM panel”), as described in our previous report [30]. In short, the SM panel contains 87 genes frequently found mutated in patients with MPN (Supplementary Table S1). Target capturing sequencing was performed using a customized target kit (3039061, Agilent Technologies, Santa Clara, CA, USA) according to the manufacturer’s instructions. DNA libraries were constructed according to the protocol provided by the manufacturer and sequencing was performed on an Illumina HiSeq4000 platform (Illumina, Inc., San Diego, CA, USA).
Sequenced reads were mapped to the human reference genome (hg19, Genome Reference Consortium, February 2009) using the Burrows–Wheeler aligner. To call variants, we used VarScan v.2.3.9 with mpileup2snp and mpileup2indel. SnpEff v.4.2 was used to select variants located in coding sequences and predict their functional consequences. Annotated variants were further classified into four tiers according to the standards and guidelines of the Association for Molecular Pathology (AMP) [31]. All variants with a minor allele frequency >0.01 were filtered out based on the Exome Aggregation Consortium (ExAC, http://exac.broadinstitute.org/ (accessed on 23 April 2020)) and genome aggregation database (gnomAD, https://gnomad.broadinstitute.org/ (accessed on 23 April 2020)), as well as the ethnicity-specific Korean Variant Archive (KOVA, http://kobic.re.kr/kova/ (accessed on 23 April 2020)). Variants of synonymous, intronic or noncoding regions were further excluded. Among the remaining variants, variants with more than 20 reads and 5% variant allele frequencies (VAF) were considered to be mutations. Canonical mutations in JAK2, CALR, and MPL fewer than 5% VAF were considered to be present with a low allele burden. All mutations were manually verified using the Integrative Genomic Viewer.

2.3. Cytogenetic Study

A total of 169 BM karyotypes were available. Conventional BM karyotyping was performed on G-banded metaphase chromosomes using routine techniques. Karyotypes were interpreted according to ISCN 2016 [32]. The number of cytogenetic events was considered to be the sum of chromosome gains, losses, partial gains, partial losses and rearrangements.

2.4. Statistical Analyses

Group comparisons according to phenotype were performed using the Kruskal–Wallis test and Chi-square test. A Mann–Whitney test and Fisher’s exact test were also used for post-hoc analysis. The significance of the co-occurrences of mutations and chromosomal abnormalities was determined using Fisher’s exact test.
The Chi-square test was used to assess whether the distributions of risk scores from two systems were systematically different. We defined overall survival (OS) as the time from diagnosis to death from any cause, and event-free survival (EFS) as the time from diagnosis to leukemic transformation, myelofibrosis progression or death. Medical record tracking was done until February 2020. The Kaplan–Meier Log–rank test was used to estimate OS and EFS in each group. Cox proportional hazards regression was used for univariate and multivariate analyses. Statistical analyses were performed using MedCalc version 19.1.7 (MedCalc software, Mariakerke, Belgium).

3. Results

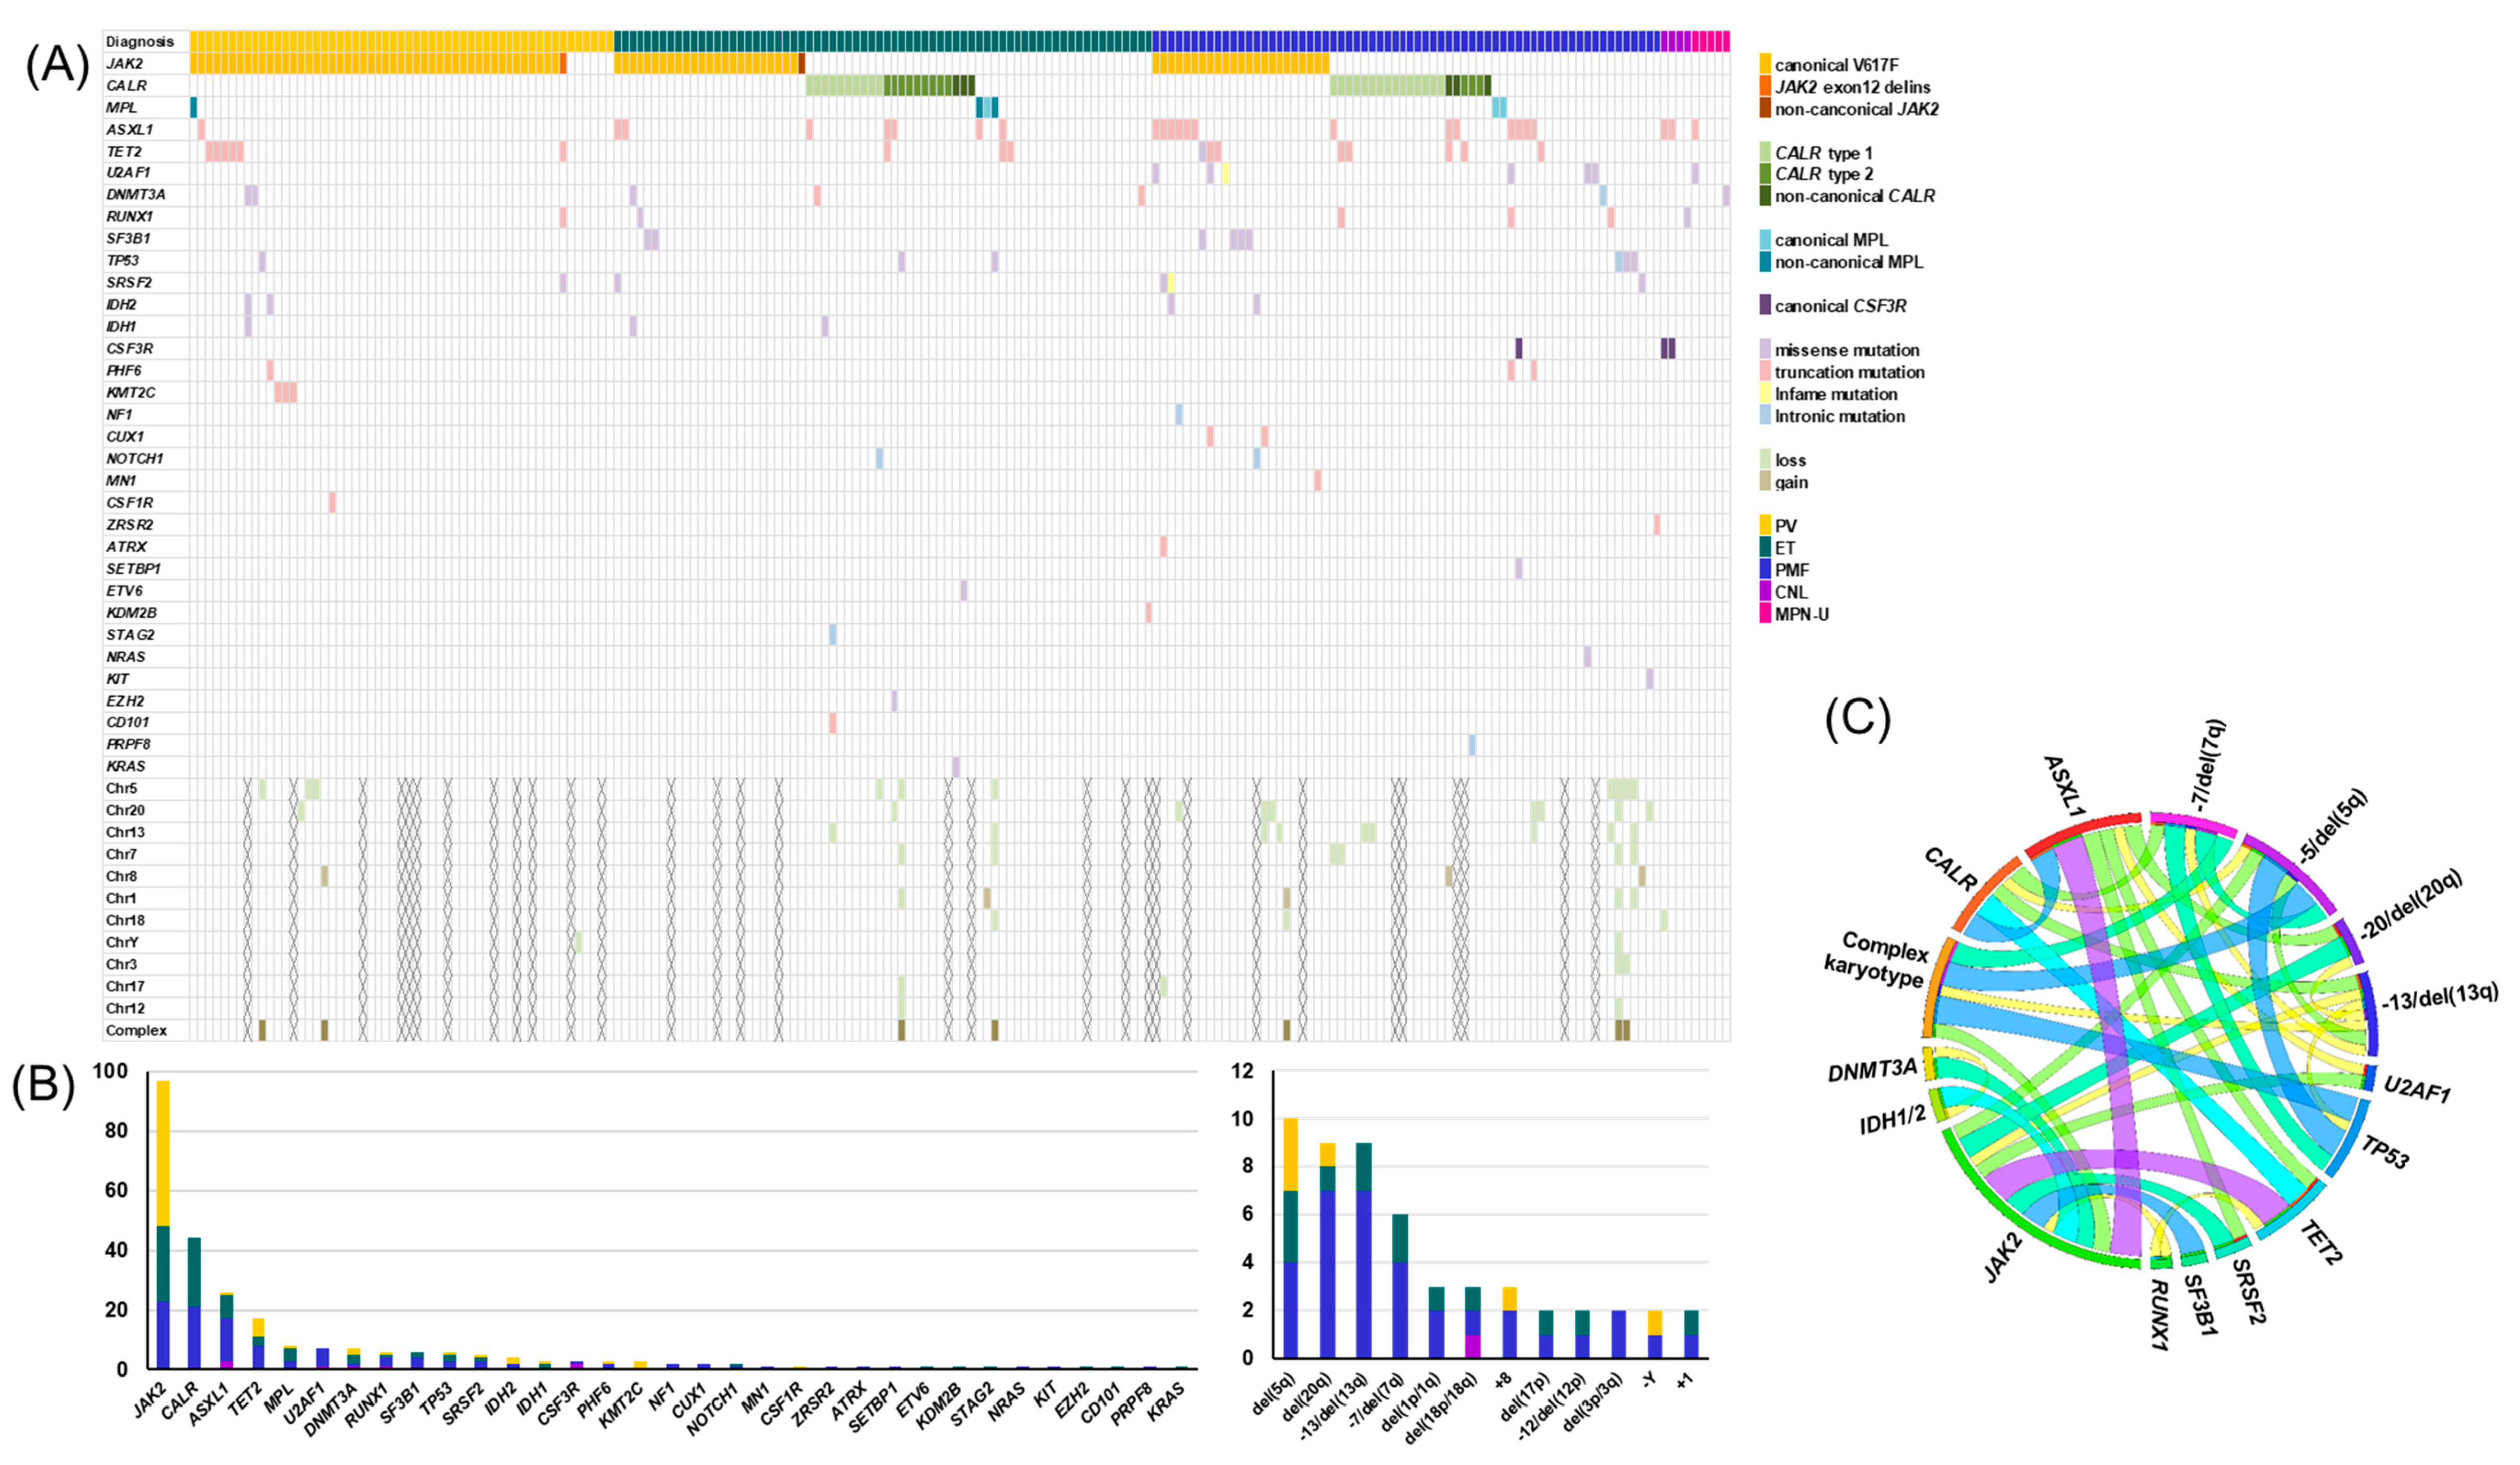
3.1. Genetic Landscape of MPNs

The patients’ clinical and hematologic characteristics are summarized in Table 1. According to the disease category of WHO classification, ET was the largest group (n = 70, 35.0%), followed by PMF (n = 66, 33.0%), PV (n = 55, 27.5%) and other MPNs (n = 9, 4.5%) (consisting of chronic neutrophilic leukemia (CNL, n = 4, 2.0%) and MPN-unclassifiable diseases (n = 5, 2.5%)). Age at diagnosis differed significantly according to the disease category. ET patients (43.2 ± 15.3 years) were younger than PV (50.3 ± 12.3 years), PMF (52.5 ± 13.6 years) and other MPN (61.4 ± 14.2 years) patients (p = 0.0034, p = 0.0002 and p = 0.0024, respectively). Clinical and genetic variables are described in Supplementary Figure S1 according to their respective disease category.
The genetic landscapes for all patients are shown in Figure 1A. Mutations were identified in 85.5% of patients (n = 171). The mean number of mutations was 1.3 ± 1.0, and ET patients harbored significantly fewer mutations than PMF patients (1.1 ± 0.9 vs. 1.6 ± 1.1, p = 0.024). JAK2 mutations (n = 98) were the most common, followed by CALR, ASXL1, TET2 and MPL mutations (n = 43, 24, 17 and 5, respectively). Abnormal karyotypes were identified in 22.5% of patients (38/169), and 4.7% (8/169) of individuals had a complex karyotype with three or more cytogenetic abnormalities. The proportion of abnormal karyotypes in PMF patients (37.5%, 21/56) was higher than that in PV (18.6%, 8/43) or ET (9.8%, 6/61) patients (p = 0.047 and p = 0.0004, respectively). −5/del(5q) (n = 10) was the most common cytogenetic abnormality, followed by del(20q) (n = 9), del(13q) (n = 9) and −7/del(7q) (n = 6) (Figure 1B). We also analyzed the co-occurrence of mutations and abnormal karyotypes. Multiple pairs of co-occurring mutations were found, including JAK2 with SF3B1, ASXL1 with SRSF2, and DNMT3A with IDH1/2 (p = 0.017, p = 0.01 and p = 0.012, respectively). TP53 mutations were significantly associated with del(13q), −5/del(5q), −7/del(7q) and complex karyotypes (p = 0.038, p < 0.001, p < 0.001 and p < 0.001, respectively) (Figure 1C) [33]. We reviewed the Prussian blue iron staining of the available BM samples with JAK2/SF3B1 co-mutations and found ring sideroblasts in all three samples. Based on the results of the genetic landscapes (including mutations and abnormal karyotypes), we further investigated the associations between genetic aberrations and diagnoses of MPNs.

3.2. Impact of Genetic Aberrations on Diagnosis

JAK2 (n = 98, 49.0%), CALR (n = 43, 21.5%) and MPL (n = 5, 2.5%) mutations were detected in 76.4% of PV, ET and PMF patients (n = 146). JAK2 mutations were detected in 49 PV patients (89.1%) while JAK2, CARL and MPL mutations were detected in 26 (37.1%), 22 (31.4%) and 3 (4.3%) ET patients, respectively. JAK2, CARL and MPL mutations were detected in 23 (34.8%), 21 (31.8%), and 2 (3.0%) PMF patients, respectively. Among 39 triple-negative ET and PMF patients, eight (two ET and six PMF) patients had myeloid neoplasm-associated mutations in ASXL1, EZH2, TET2, IDH1/2, SRSF2 or SF3B1. CSF3R T618I mutation was detected in two of four CNL patients. Thus, clonal genetic markers for diagnosis according the WHO classification were present in 89.1% of PV patients, 75.7% of ET patients, 78.8% of PMF patients and 50% of CNL patients, representing 80.6% (n = 154) of all MPN patients.
We considered all gene mutations, including those not mentioned above, in addition to an abnormal karyotype, as clonal genetic markers. Genetic aberrations were detected in 12 patients, including mutations of U2AF1, DNMT3A, RUNX1, TP53, ZRSR2, KDM2B, NRAS and KIT genes, as well as karyotype abnormalities such as del(20q) and -5/del(5q). The proportion of MPN patients with clonal genetic markers increased up to 86.4% (n = 165). When broken down according to MPN type, 90.9% of PV patients, 77.1% of ET patients and 92.4% of PMF patients had clonal genetic markers (Table 2). We found that implementing all detectable genetic aberrations strengthened diagnosis, especially for cases without mutations in the three main MPN drivers.

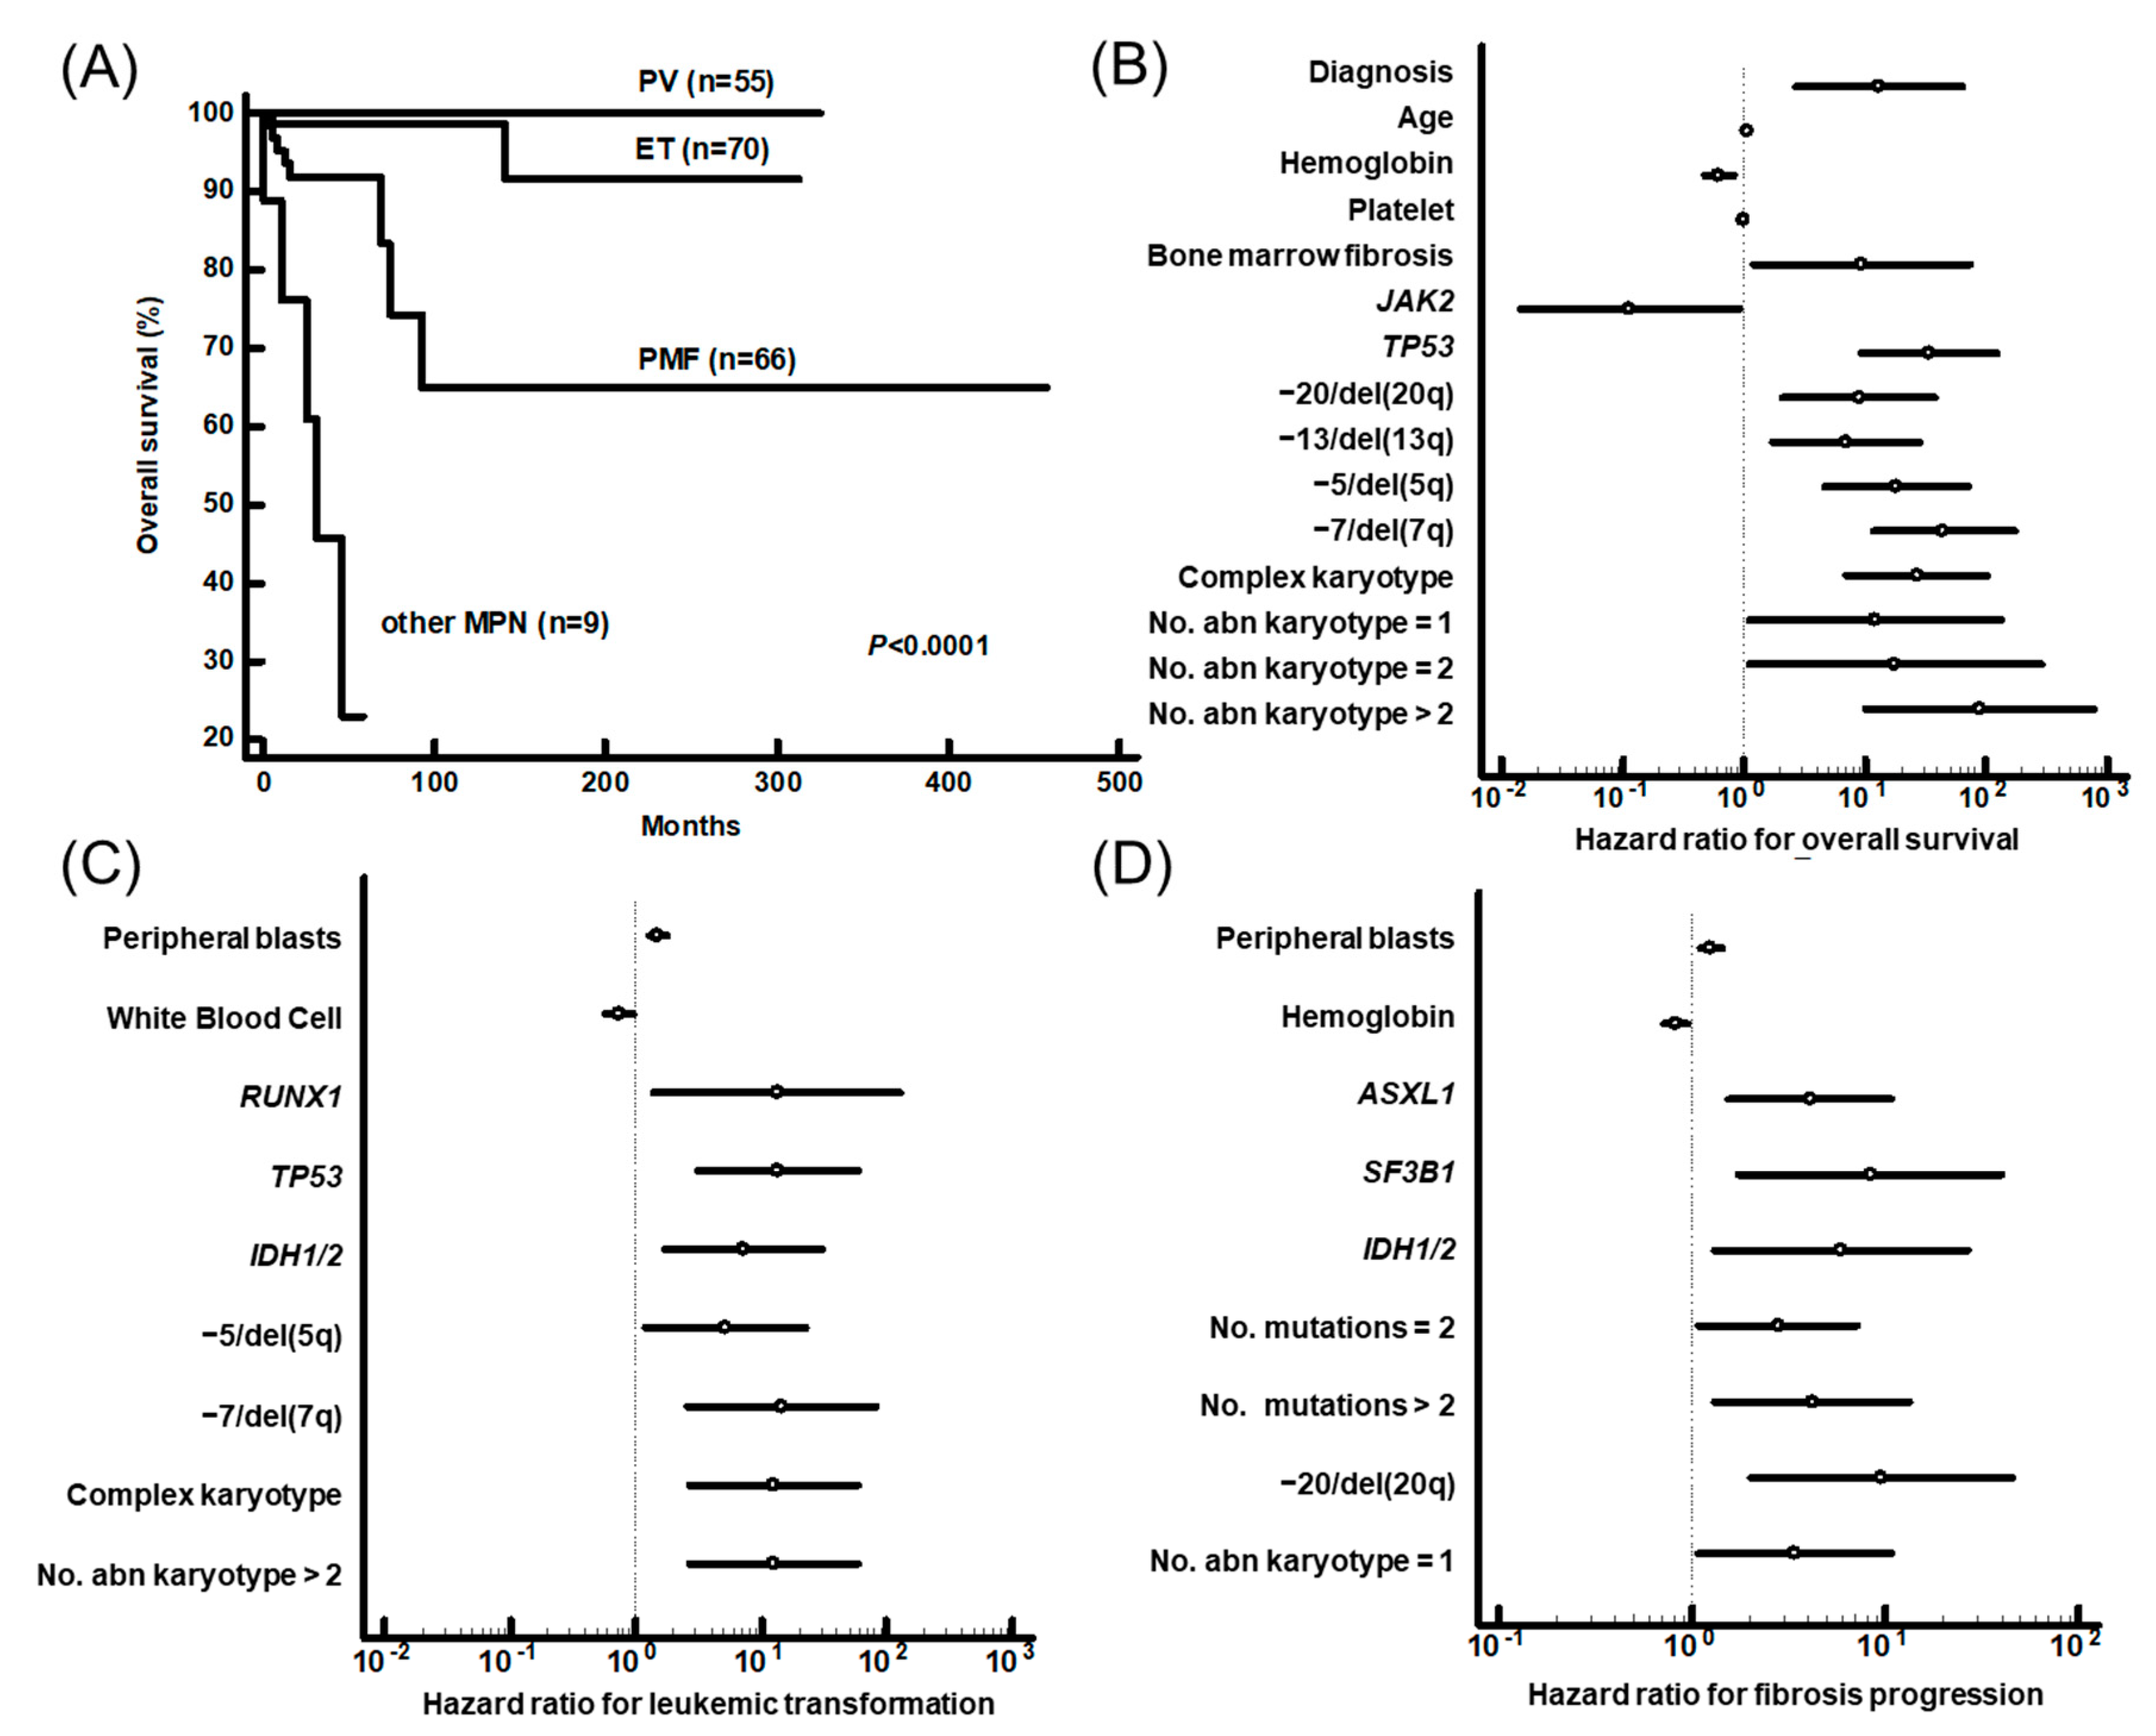
3.3. Prognostic Impact of Genetic Aberrations

We then evaluated the impact of genetic aberrations on prognosis. The mean overall survival of the study population was 400.5 months, with a 95% confidence interval (CI) of 367.0-434.1 months. Fifteen deaths were recorded in the whole series (2 ET, 8 PMF and 5 other MPN). The clinical outcome in terms of the shortest OS was significantly poorer in other MPN group (33.6 months, 95% CI, 19.7–47.5) than it was in the PV group (325.0 months, 95% CI, 325.0–325.0), ET group (296.4 months, 95% CI, 272.0–320.7) or PMF group (318.8 months, 95% CI, 218.8–418.7) (Figure 2A). Among nine patients in other MPN groups, five died during follow-up. Patients with more genetic aberrations (≥2) showed poorer outcomes (p = 0.041). Then, we analyzed the prognostic impact of genetic aberrations in patients with PV, ET and PMF. Univariate analysis showed that mutations in TP53, −5/del(5q), −7/del(7q), del(20q), del(13q), the number of abnormal karyotypes, and a complex karyotype were associated with poor outcomes. The diagnosis of PMF and the presence of bone marrow fibrosis were also associated with poor outcomes. Hemoglobin level and JAK2 mutation were associated with a favorable outcome (Figure 2B). Next, we investigated the impact of clinical and hematologic variables and genetic aberrations on disease progression, including leukemic transformation and fibrotic progression. Nine patients experienced leukemic transformation (two PV, three ET and four PMF patients), and there was no difference in frequency between the three disease groups. IDH1/2, RUNX1 and TP53 mutations, −5/del(5q), −7/del(7q), the number of abnormal karyotypes and a complex karyotype were significant risk factors for leukemic transformation (Figure 2C). Fibrotic progression occurred in 24 (8 PV and 16 ET) patients. ASXL1, IDH1/2, and SF3B1 mutations, the number of mutations and del(20q) were associated with fibrotic progression (Figure 2D). Details of the prognostic impact of each parameter are summarized in Supplementary Table S2.
In addition, we performed multivariate analysis. TP53 mutation, −7/del(7q) and a diagnosis of PMF were adverse survival factors. Peripheral blood blast counts, in addition to RUNX1, IDH1/2 and TP53 mutations, were identified as risk factors for leukemic transformation. ASXL1, SF3B1 and IDH1/2 mutations, the number of mutations and del(20q) were defined as risk factors for fibrotic progression (Table 3). We also investigated the prognostic impact of genetic aberrations in each disease category. Despite the limited numbers of patients in each disease category and duration, genetic aberrations identified as risk factors by multivariate analysis had statistical significance in log rank analysis (Supplementary Table S3). These results collectively highlighted genetic aberrations associated with outcome, such as inferior survival, leukemic transformation and fibrotic progression.

3.4. Impact of Genetic Aberrations on Risk Stratification

Recent updates have incorporated genetic aberrations in prognostic scoring systems. Because several genetic aberrations associated with prognosis were identified in this study, we tried to evaluate their contribution in refining risk stratification. To evaluate the impact of genetic aberrations on risk stratification, we compared the risk of each patient group before and after applying genetic aberrations. Although there were statistically significant relationships between risk groups (contingence coefficient 0.514–0.554), we found some interesting changes. Thirty-seven of the 55 PV patients had more than one risk factor, including advanced age, leukocytosis and a vascular event [17]. When adjusting for MIPSS-PV (which included SRSF2 mutation), 20 patients (54.1%) were reclassified into the low risk group. In ET, 28 patients had more than one risk factor, including advanced age, leukocytosis and a vascular event [18]. When applying MIPSS-ET (which included SF3B1, SRSF2, TP53 and U2AF1 mutations), the majority of patients (67.9%, 19/28) were reclassified as being low risk (Table 4). Among patients with PMF, 25 were classified as DIPSS low risk, 16 as intermediate risk, 21 as intermediate-2, and 4 as high risk (n = 4). It is notable that 10 patients and 6 patients in the low risk group were reclassified into intermediate and high risk groups based on MIPSS70 [22] and MIPSS70+ [34], respectively. MIPSS70 includes ASXL1, EZH2, SRSF2 and IDH1/2 mutations, while MIPSS70+ includes ASXL1, EZH2, SRSF2 and IDH1/2 mutations and cytogenetic risk categories. Three patients in the intermediate-1 risk group were reclassified into high and very high risk groups by MIPSS70 and MIPSS70+, respectively (Table 5). This meant that the newly developed risk stratification systems that include genetic aberrations discriminated more patients with low risk in PV and ET. On the other hand, the new systems selected PMF patients with higher risk among those with low or intermediate-1 risk.
Additionally, we analyzed the prediction capacity of mutation-enhanced prognostic scoring systems. In ET, MIPSS-ET revealed a significant prediction of OS (P = 0.003), while the previous risk factors did not (P = 0.922). In PMF, MIPSS70+ (P = 0.003) and MIPSS70 (P = 0.006) had a lower P value for the prediction of OS than DIPSS (P = 0.024). MIPSS70+ (P = 0.002) and MIPSS70 (P = 0.005) predicted EFS significantly better than did DIPSS (P = 0.201) (Supplementary Table S4). These findings indicated that the incorporation of NGS results improved prognostication, as the mutation-enhanced prognostic models predicted OS in a statistically significant manner.

4. Discussion

Continuous advances in genetic technology have resulted in great changes in clinical practice. As a consequence of these advances, current diagnoses and classifications of hematologic malignancies are largely based on genetic aberrations. The diagnosis of MPNs is made primarily based on clinical and hematologic features supported by mutations in JAK2, CALR and/or MPL genes. In the absence of mutations in any of these three genes, other myeloid neoplasm-associated mutations are recognized as other clonal markers for ET and PMF [1].
In the current study, we identified the driver mutations in 76.4% of MPN patients, with the highest frequency in PV patients (89.1%), followed by ET (72.8%) and PMF (69.7%) patients. There are no clear definitions of myeloid neoplasm-associated mutations other than those in seven genes in the WHO classification. We found that gene mutations other than the three driver genes and cytogenetic abnormalities accounted for a considerable proportion of cases. When applying seven myeloid neoplasm-associated genes proposed by WHO classification, eight patients began to possess clonal genetic markers. When including all detectable genetic aberrations, 12 patients were added to the list of patients with clonal genetic markers, and the proportion of patients with clonal genetic markers increased by 10.0%. The added mutations and karyotype abnormalities were commonly detected in myeloid neoplasms or other malignancies, such as U2AF1, DNMT3A, RUNX1, TP53, del(20q) and −5/del(5q). Therefore, it is necessary to define specific gene mutations and karyotype abnormalities and to clarify their roles in the diagnosis of MPN.
Overall genetic landscapes were similar to those reported in previous studies [35,36]. We found significant co-occurring mutations. JAK2/SF3B1 co-mutations, which are known to be associated with myelodysplastic/myeoproliferative neoplasms with ring sideroblasts and thrombocytosis (MDS/MPN-RS-T), were identified in six patients (two ET and four PMF) [37,38]. It is notable that ring sideroblasts (RSs) were detected in all available BM samples with JAK2/SF3B1 co-mutations. Even though the proportion of RS was far less than 5%, it was evident that the SF3B1 mutation affected the formation of RS. Further studies should determine an appropriate diagnostic strategy for this disease, which has a broad spectrum of phenotypes. TP53 mutation, co-occurring with del(13q), −5/del(5q), −7/del(7q) and a complex karyotype, was a significant adverse survival factor. Studies have shown that TP53 mutations occur at a low frequency in chronic-phase MPNs and increase significantly according to disease progression. TP53 mutations were positively correlated with poor survival outcomes, including early death [12,13,29], and −7/del(7q) was associated with poor survival in PMF patients [39]. Because all patients with TP53 mutations had a complex karyotype, we postulated that the presence of TP53 mutation resulted from the accumulation of genetic aberrations through disease progression.
In addition, we identified genetic aberrations associated with disease progression. Results from this and previous studies showed that IDH1/2 mutations are associated with a risk of leukemic transformation. IDH1/2 mutations occurred frequently in the blast phase of MPN compared to the chronic phase, suggesting a pathogenic contribution to leukemic transformation [40]. This is worth noting because IDH inhibitors may offer a therapeutic advantage for high risk MPN patients [41]. We also found that RUNX1 mutations were predictive of leukemic transformation. This finding is consistent with previous studies that demonstrated that RUNX1 mutations had adverse impacts on leukemia-free survival in PV and ET patients [24,25] and that RUNX1-mutated PMF patients had inferior overall survival and leukemia-free survival [42]. Another important gene was ASXL1; mutations in this gene are typically associated with fibrotic progression. ASXL1 was the most frequently mutated gene, with the exception of the three driver genes. Previous studies showed that ASXL1 mutations were enriched in patients with PMF [36], and ASXL1 mutations are considered to be high risk mutations along with mutations in epigenetic regulators, such as SRSF2 and EZH2 in patients with MPNs [16,25,35,43]. TET2 is an epigenetic regulator frequently mutated in all MPN subtypes. Although previous studies have demonstrated that TET2 mutations increase the self-renewal capacity of hematopoietic stem cells [44] and can lead to disease initiation and progression [14], the prognostic value of TET2 mutations is controversial [15,45]. Our study revealed that TET2 mutations were frequently detected in MPNs with little prognostic impact. Del(20q) was another significant factor associated with fibrosis progression. It is notable that most instances of del(20q) were identified in PMF patients or patients with PV or ET with fibrosis progression during follow-up.
Clinicians should stratify each patient’s risk on the basis of updated information. This is even more important in the current era due to the increased availability of therapeutic options. Recent updates included genetic abnormalities into risk stratification for MPNs; SRSF2 for PV, SF3B1, SRSF2, TP53 and U2AF1 for ET and ASXL1, EZH2, SRSF2, IDH1/2 and karyotype for PMF. It was expected that risk groups were correlated before and after applying genetic abnormalities; however, there were changes worth paying attention to. In PV and ET, mutation-enhanced risk stratification system appeared to select low risk patients among patients with clinical and laboratory risk variables. By contrast, in PMF, mutation and additional karyotype-enhanced risk stratification systems identified higher risk patients among low or intermediate-1 risk groups, as supported by a previous finding that demonstrated the significance of ASXL1 and SRSF2 mutations for treatment decision-making in low or intermediate-1 risk patients with PMF [46].
We used a customized myeloid panel, which included disease-associated mutations and prognostic factors. Various commercial and customized NGS assays have been introduced in clinic, and they cover most significant genes for diagnosis and risk stratification in this study [47,48]. Bioinformatics were also incorporated in commercial NGS assays and increase the liability of analyzed results. The implementation of the NGS assay in clinical laboratories has been accelerated by making guidelines for the validation of the assay including panel design, operating setup and bioinformatics pipeline [49,50]. MPNs highly benefitted from NGS with efficient recognition of the presence of clonal markers in triple-negative MPN patients as well as the driver mutations. Although running cost and turnaround time are still challenging, as NGS moves into clinic, it becomes closer to patients and it influences risk stratification and therapeutic planning. Because it could eventually decrease medical cost through optimizing precision medicine, public health insurance programs will expand their coverage for NGS [51].
Due to the restricted number and less tight enrollment criteria of patients in each disease category and the relatively short follow-up period, further studies should be performed in a larger cohort considering racial heterogeneity. However, this study highlights the diagnostic and potential prognostic usefulness of targeted sequencing in the NGS era. In addition, the results of our contemporary study can be used as a valuable source to tailor therapeutic plans. Integrated genetic information facilitates not only diagnosis and prognostic expectations, but also our understanding of the presentation and progression of MPNs.

5. Conclusions

The genetic landscape demonstrated that 86.4% of MPN patients harbored clonal markers, including 76.4% of MPN patients, who harbored triple driver mutations. Some genetic aberrations (such as TP53, IDH1/2, SF3B1, RUNX1, −7/del(7q) and del(20q)) were related to overall survival and/or disease progression, and mutation-enhanced scoring systems performed better than phenotype-based risk stratification. These findings support the conclusion that integrated genetic information has a significant impact on the diagnosis and prognostication of MPN patients.

Supplementary Materials

The following are available online at https://www.mdpi.com/2077-0383/10/5/1033/s1; Supplementary Table S1: List of target genes in the NGS panel, Supplementary Table S2: Univariate analysis of clinical and genetic factors for overall survival, leukemic transformation and fibrosis progression, Supplementary Table S3: P values from log rank tests for overall survival, leukemic transformation and fibrosis progression in each disease category, Supplementary Table S4: Comparison of the prediction power of conventional risk groups and mutation and/or karyotype enhanced systems and Supplementary Figure S1: Comparison of clinical and genetic variables among disease categories.

Author Contributions

M.K. and Y.K. designed the research; J.-M.L. and H.L. performed the research and analyzed and interpreted data; K.-S.E. and S.-E.L. performed validation and proofreading; J.-M.L., M.K. and Y.K. wrote the manuscript. All authors have read and agreed to the published version of the manuscript.

Funding

This research was supported by a Grant (18172MFDS182) from the Korean Ministry of Food and Drug Safety in 2021.

Institutional Review Board Statement

This study was carried out in accordance with the Declaration of Helsinki and approved by the Institutional Review Board (IRB) of Seoul St. Mary’s Hospital (KC20RISI0371). This retrospective study involves only minimal risk to the participants, so the IRB waived the requirement to obtain informed consent from patients.

Data Availability Statement

The data presented in this study are available on request from the corresponding author. The data are not publicly available due to ethical concern.

Conflicts of Interest

The authors declare no conflict of interest.

References

  1. Swerdlow, S.H.; Campo, E.; Harris, N.L.; Jaffe, E.S.; Pileri, S.A.; Stein, H.; Thiele, J. WHO Classification of Tumours of Haematopoietic and Lymphoid Tissues; WHO: Geneva, Switzerland, 2017; Volume 2, pp. 30–59. [Google Scholar]
  2. Pardanani, A.; Lasho, T.; Laborde, R.; Elliott, M.; Hanson, C.; Knudson, R.; Ketterling, R.; Maxson, J.; Tyner, J.; Tefferi, A. CSF3R T618I is a highly prevalent and specific mutation in chronic neutrophilic leukemia. Leukemia 2013, 27, 1870–1873. [Google Scholar] [CrossRef] [Green Version]
  3. Kralovics, R.; Passamonti, F.; Buser, A.S.; Teo, S.-S.; Tiedt, R.; Passweg, J.R.; Tichelli, A.; Cazzola, M.; Skoda, R.C. A gain-of-function mutation of JAK2 in myeloproliferative disorders. N. Engl. J. Med. 2005, 352, 1779–1790. [Google Scholar] [CrossRef] [Green Version]
  4. Baxter, E.J.; Scott, L.M.; Campbell, P.J.; East, C.; Fourouclas, N.; Swanton, S.; Vassiliou, G.S.; Bench, A.J.; Boyd, E.M.; Curtin, N. Acquired mutation of the tyrosine kinase JAK2 in human myeloproliferative disorders. Lancet 2005, 365, 1054–1061. [Google Scholar] [CrossRef]
  5. Levine, R.L.; Wadleigh, M.; Cools, J.; Ebert, B.L.; Wernig, G.; Huntly, B.J.; Boggon, T.J.; Wlodarska, I.; Clark, J.J.; Moore, S. Activating mutation in the tyrosine kinase JAK2 in polycythemia vera, essential thrombocythemia, and myeloid metaplasia with myelofibrosis. Cancer Cell 2005, 7, 387–397. [Google Scholar] [CrossRef] [PubMed] [Green Version]
  6. Rumi, E.; Cazzola, M. Diagnosis, risk stratification, and response evaluation in classical myeloproliferative neoplasms. Blood J. Am. Soc. Hematol. 2017, 129, 680–692. [Google Scholar] [CrossRef] [PubMed]
  7. Rumi, E.; Pietra, D.; Ferretti, V.; Klampfl, T.; Harutyunyan, A.S.; Milosevic, J.D.; Them, N.C.; Berg, T.; Elena, C.; Casetti, I.C. JAK2 or CALR mutation status defines subtypes of essential thrombocythemia with substantially different clinical course and outcomes. Blood 2014, 123, 1544–1551. [Google Scholar] [CrossRef]
  8. Rumi, E.; Pietra, D.; Pascutto, C.; Guglielmelli, P.; Martínez-Trillos, A.; Casetti, I.; Colomer, D.; Pieri, L.; Pratcorona, M.; Rotunno, G. Clinical effect of driver mutations of JAK2, CALR, or MPL in primary myelofibrosis. Blood J. Am. Soc. Hematol. 2014, 124, 1062–1069. [Google Scholar] [CrossRef] [PubMed] [Green Version]
  9. Tefferi, A.; Lasho, T.; Finke, C.; Knudson, R.; Ketterling, R.; Hanson, C.; Maffioli, M.; Caramazza, D.; Passamonti, F.; Pardanani, A. CALR vs JAK2 vs MPL-mutated or triple-negative myelofibrosis: Clinical, cytogenetic and molecular comparisons. Leukemia 2014, 28, 1472–1477. [Google Scholar] [CrossRef]
  10. Pikman, Y.; Lee, B.H.; Mercher, T.; McDowell, E.; Ebert, B.L.; Gozo, M.; Cuker, A.; Wernig, G.; Moore, S.; Galinsky, I. MPLW515L is a novel somatic activating mutation in myelofibrosis with myeloid metaplasia. PLoS Med. 2006, 3, e270. [Google Scholar] [CrossRef] [Green Version]
  11. Jang, M.-A.; Choi, C.W. Recent insights regarding the molecular basis of myeloproliferative neoplasms. Korean J. Intern. Med. 2020, 35, 1. [Google Scholar] [CrossRef] [Green Version]
  12. Marcellino, B.K.; Hoffman, R.; Tripodi, J.; Lu, M.; Kosiorek, H.; Mascarenhas, J.; Rampal, R.K.; Dueck, A.; Najfeld, V. Advanced forms of MPNs are accompanied by chromosomal abnormalities that lead to dysregulation of TP53. Blood Adv. 2018, 2, 3581–3589. [Google Scholar] [CrossRef] [PubMed] [Green Version]
  13. McNamara, C.J.; Panzarella, T.; Kennedy, J.A.; Arruda, A.; Claudio, J.O.; Daher-Reyes, G.; Ho, J.; Siddiq, N.; Devlin, R.; Tsui, H. The mutational landscape of accelerated-and blast-phase myeloproliferative neoplasms impacts patient outcomes. Blood Adv. 2018, 2, 2658–2671. [Google Scholar] [CrossRef] [Green Version]
  14. Kameda, T.; Shide, K.; Yamaji, T.; Kamiunten, A.; Sekine, M.; Taniguchi, Y.; Hidaka, T.; Kubuki, Y.; Shimoda, H.; Marutsuka, K.; et al. Loss of TET2 has dual roles in murine myeloproliferative neoplasms: Disease sustainer and disease accelerator. Blood 2015, 125, 304–315. [Google Scholar] [CrossRef] [PubMed]
  15. Abdel-Wahab, O.; Tefferi, A.; Levine, R.L. Role of TET2 and ASXL1 mutations in the pathogenesis of myeloproliferative neoplasms. Hematol. Oncol. Clin. 2012, 26, 1053–1064. [Google Scholar] [CrossRef] [PubMed] [Green Version]
  16. Guglielmelli, P.; Lasho, T.L.; Rotunno, G.; Score, J.; Mannarelli, C.; Pancrazzi, A.; Biamonte, F.; Pardanani, A.; Zoi, K.; Reiter, A. The number of prognostically detrimental mutations and prognosis in primary myelofibrosis: An international study of 797 patients. Leukemia 2014, 28, 1804–1810. [Google Scholar] [CrossRef]
  17. Tefferi, A.; Rumi, E.; Finazzi, G.; Gisslinger, H.; Vannucchi, A.; Rodeghiero, F.; Randi, M.; Vaidya, R.; Cazzola, M.; Rambaldi, A. Survival and prognosis among 1545 patients with contemporary polycythemia vera: An international study. Leukemia 2013, 27, 1874–1881. [Google Scholar] [CrossRef] [Green Version]
  18. Passamonti, F.; Thiele, J.; Girodon, F.; Rumi, E.; Carobbio, A.; Gisslinger, H.; Kvasnicka, H.M.; Ruggeri, M.; Randi, M.L.; Gangat, N. A prognostic model to predict survival in 867 World Health Organization–defined essential thrombocythemia at diagnosis: A study by the International Working Group on Myelofibrosis Research and Treatment. Blood 2012, 120, 1197–1201. [Google Scholar] [CrossRef]
  19. Cervantes, F.; Dupriez, B.; Pereira, A.; Passamonti, F.; Reilly, J.T.; Morra, E.; Vannucchi, A.M.; Mesa, R.A.; Demory, J.-L.; Barosi, G. New prognostic scoring system for primary myelofibrosis based on a study of the International Working Group for Myelofibrosis Research and Treatment. Blood J. Am. Soc. Hematol. 2009, 113, 2895–2901. [Google Scholar] [CrossRef]
  20. Passamonti, F.; Cervantes, F.; Vannucchi, A.M.; Morra, E.; Rumi, E.; Pereira, A.; Guglielmelli, P.; Pungolino, E.; Caramella, M.; Maffioli, M. A dynamic prognostic model to predict survival in primary myelofibrosis: A study by the IWG-MRT (International Working Group for Myeloproliferative Neoplasms Research and Treatment). Blood J. Am. Soc. Hematol. 2010, 115, 1703–1708. [Google Scholar] [CrossRef] [PubMed]
  21. Gangat, N.; Caramazza, D.; Vaidya, R.; George, G.; Begna, K.; Schwager, S.; Van Dyke, D.; Hanson, C.; Wu, W.; Pardanani, A. DIPSS plus: A refined Dynamic International Prognostic Scoring System for primary myelofibrosis that incorporates prognostic information from karyotype, platelet count, and transfusion status. J. Clin. Oncol. 2011, 29, 392–397. [Google Scholar] [CrossRef]
  22. Guglielmelli, P.; Lasho, T.L.; Rotunno, G.; Mudireddy, M.; Mannarelli, C.; Nicolosi, M.; Pacilli, A.; Pardanani, A.; Rumi, E.; Rosti, V. MIPSS70: Mutation-enhanced international prognostic score system for transplantation-age patients with primary myelofibrosis. J. Clin. Oncol. 2018, 36, 310–318. [Google Scholar] [CrossRef]
  23. Tefferi, A.; Guglielmelli, P.; Nicolosi, M.; Mannelli, F.; Mudireddy, M.; Bartalucci, N.; Finke, C.M.; Lasho, T.L.; Hanson, C.A.; Ketterling, R.P. GIPSS: Genetically inspired prognostic scoring system for primary myelofibrosis. Leukemia 2018, 32, 1631–1642. [Google Scholar] [CrossRef] [Green Version]
  24. Tefferi, A.; Guglielmelli, P.; Lasho, T.L.; Coltro, G.; Finke, C.M.; Loscocco, G.G.; Sordi, B.; Szuber, N.; Rotunno, G.; Pacilli, A. Mutation-enhanced international prognostic systems for essential thrombocythaemia and polycythaemia vera. Br. J. Haematol. 2020, 189, 291–302. [Google Scholar] [CrossRef]
  25. Tefferi, A.; Lasho, T.L.; Guglielmelli, P.; Finke, C.M.; Rotunno, G.; Elala, Y.; Pacilli, A.; Hanson, C.A.; Pancrazzi, A.; Ketterling, R.P. Targeted deep sequencing in polycythemia vera and essential thrombocythemia. Blood Adv. 2016, 1, 21–30. [Google Scholar] [CrossRef] [Green Version]
  26. Lasho, T.L.; Mudireddy, M.; Finke, C.M.; Hanson, C.A.; Ketterling, R.P.; Szuber, N.; Begna, K.H.; Patnaik, M.M.; Gangat, N.; Pardanani, A. Targeted next-generation sequencing in blast phase myeloproliferative neoplasms. Blood Adv. 2018, 2, 370–380. [Google Scholar] [CrossRef] [Green Version]
  27. Passamonti, F. Stem cell transplant in MF: It’s time to personalize. Blood J. Am. Soc. Hematol. 2019, 133, 2118–2120. [Google Scholar] [CrossRef] [Green Version]
  28. Barbui, T.; Thiele, J.; Ferrari, A.; Vannucchi, A.M.; Tefferi, A. The new WHO classification for essential thrombocythemia calls for revision of available evidences. Blood Cancer J. 2020, 10, 1–6. [Google Scholar] [CrossRef] [PubMed] [Green Version]
  29. Grinfeld, J.; Nangalia, J.; Baxter, E.J.; Wedge, D.C.; Angelopoulos, N.; Cantrill, R.; Godfrey, A.L.; Papaemmanuil, E.; Gundem, G.; MacLean, C. Classification and personalized prognosis in myeloproliferative neoplasms. N. Engl. J. Med. 2018, 379, 1416–1430. [Google Scholar] [CrossRef]
  30. Lee, J.-M.; Kim, Y.-J.; Park, S.-S.; Han, E.; Kim, M.; Kim, Y. Simultaneous Monitoring of Mutation and Chimerism Using Next-Generation Sequencing in Myelodysplastic Syndrome. J. Clin. Med. 2019, 8, 2077. [Google Scholar] [CrossRef] [PubMed] [Green Version]
  31. Li, M.M.; Datto, M.; Duncavage, E.J.; Kulkarni, S.; Lindeman, N.I.; Roy, S.; Tsimberidou, A.M.; Vnencak-Jones, C.L.; Wolff, D.J.; Younes, A. Standards and guidelines for the interpretation and reporting of sequence variants in cancer: A joint consensus recommendation of the Association for Molecular Pathology, American Society of Clinical Oncology, and College of American Pathologists. J. Mol. Diagn. 2017, 19, 4–23. [Google Scholar] [CrossRef] [PubMed] [Green Version]
  32. McGowan-Jordan, J.; Simons, A.; Schmid, M. (Eds.) ISCN: An International System for Human Cytogenomic Nomenclature (2016); Karger: Basel, Switzerland, 2016. [Google Scholar]
  33. Krzywinski, M.; Schein, J.; Birol, I.; Connors, J.; Gascoyne, R.; Horsman, D.; Jones, S.J.; Marra, M.A. Circos: An information aesthetic for comparative genomics. Genome Res. 2009, 19, 1639–1645. [Google Scholar] [CrossRef] [Green Version]
  34. Tefferi, A.; Guglielmelli, P.; Lasho, T.L.; Gangat, N.; Ketterling, R.P.; Pardanani, A.; Vannucchi, A.M. MIPSS70+ Version 2.0: Mutation and Karyotype-Enhanced International Prognostic Scoring System for Primary Myelofibrosis. J. Clin. Oncol. Off. J. Am. Soc. Clin. Oncol. 2018, 36, 1769. [Google Scholar] [CrossRef]
  35. Andréasson, B.; Pettersson, H.; Wasslavik, C.; Johansson, P.; Palmqvist, L.; Asp, J. ASXL1 mutations, previous vascular complications and age at diagnosis predict survival in 85 WHO-defined polycythaemia vera patients. Br. J. Haematol. 2020, 189, 913–919. [Google Scholar] [CrossRef] [PubMed]
  36. Tefferi, A.; Pardanani, A. Mutations and prognosis in myeloproliferative neoplasms. Leuk. Lymphoma 2019, 60, 1112–1113. [Google Scholar] [CrossRef]
  37. Jeromin, S.; Haferlach, T.; Grossmann, V.; Alpermann, T.; Kowarsch, A.; Haferlach, C.; Kern, W.; Schnittger, S. High frequencies of SF3B1 and JAK2 mutations in refractory anemia with ring sideroblasts associated with marked thrombocytosis strengthen the assignment to the category of myelodysplastic/myeloproliferative neoplasms. Haematologica 2013, 98, e15. [Google Scholar] [CrossRef] [PubMed] [Green Version]
  38. Broséus, J.; Alpermann, T.; Wulfert, M.; Brichs, L.F.; Jeromin, S.; Lippert, E.; Rozman, M.; Lifermann, F.; Grossmann, V.; Haferlach, T. Age, JAK2 V617F and SF3B1 mutations are the main predicting factors for survival in refractory anaemia with ring sideroblasts and marked thrombocytosis. Leukemia 2013, 27, 1826–1831. [Google Scholar] [CrossRef] [PubMed] [Green Version]
  39. Tefferi, A.; Nicolosi, M.; Mudireddy, M.; Lasho, T.L.; Gangat, N.; Begna, K.H.; Hanson, C.A.; Ketterling, R.P.; Pardanani, A. Revised cytogenetic risk stratification in primary myelofibrosis: Analysis based on 1002 informative patients. Leukemia 2018, 32, 1189–1199. [Google Scholar] [CrossRef] [PubMed]
  40. Tefferi, A.; Lasho, T.; Abdel-Wahab, O.; Guglielmelli, P.; Patel, J.; Caramazza, D.; Pieri, L.; Finke, C.; Kilpivaara, O.; Wadleigh, M. IDH1 and IDH2 mutation studies in 1473 patients with chronic-, fibrotic-or blast-phase essential thrombocythemia, polycythemia vera or myelofibrosis. Leukemia 2010, 24, 1302–1309. [Google Scholar] [CrossRef]
  41. McKenney, A.S.; Lau, A.N.; Somasundara, A.V.H.; Spitzer, B.; Intlekofer, A.M.; Ahn, J.; Shank, K.; Rapaport, F.T.; Patel, M.A.; Papalexi, E. JAK2/IDH-mutant–driven myeloproliferative neoplasm is sensitive to combined targeted inhibition. J. Clin. Investig. 2018, 128, 789–804. [Google Scholar] [CrossRef]
  42. Tefferi, A.; Lasho, T.L.; Finke, C.M.; Elala, Y.; Hanson, C.A.; Ketterling, R.P.; Gangat, N.; Pardanani, A. Targeted deep sequencing in primary myelofibrosis. Blood Adv. 2016, 1, 105–111. [Google Scholar] [CrossRef] [PubMed] [Green Version]
  43. Vannucchi, A.; Lasho, T.; Guglielmelli, P.; Biamonte, F.; Pardanani, A.; Pereira, A.; Finke, C.; Score, J.; Gangat, N.; Mannarelli, C. Mutations and prognosis in primary myelofibrosis. Leukemia 2013, 27, 1861–1869. [Google Scholar] [CrossRef]
  44. Moran-Crusio, K.; Reavie, L.; Shih, A.; Abdel-Wahab, O.; Ndiaye-Lobry, D.; Lobry, C.; Figueroa, M.E.; Vasanthakumar, A.; Patel, J.; Zhao, X.; et al. Tet2 loss leads to increased hematopoietic stem cell self-renewal and myeloid transformation. Cancer Cell 2011, 20, 11–24. [Google Scholar] [CrossRef] [PubMed] [Green Version]
  45. Lundberg, P.; Karow, A.; Nienhold, R.; Looser, R.; Hao-Shen, H.; Nissen, I.; Girsberger, S.; Lehmann, T.; Passweg, J.; Stern, M. Clonal evolution and clinical correlates of somatic mutations in myeloproliferative neoplasms. Blood J. Am. Soc. Hematol. 2014, 123, 2220–2228. [Google Scholar] [CrossRef] [PubMed] [Green Version]
  46. Tefferi, A.; Lasho, T.L.; Hanson, C.A.; Ketterling, R.P.; Gangat, N. Screening for ASXL1 and SRSF2 mutations is imperative for treatment decision-making in otherwise low or intermediate-1 risk patients with myelofibrosis. Br. J. Haematol. 2018, 183, 678–681. [Google Scholar] [CrossRef] [Green Version]
  47. Aguilera-Diaz, A.; Vazquez, I.; Ariceta, B.; Mañú, A.; Blasco-Iturri, Z.; Palomino-Echeverría, S.; Larrayoz, M.J.; García-Sanz, R.; Prieto-Conde, M.I.; del Carmen Chillón, M. Assessment of the clinical utility of four NGS panels in myeloid malignancies. Suggestions for NGS panel choice or design. PLoS ONE 2020, 15, e0227986. [Google Scholar] [CrossRef] [PubMed] [Green Version]
  48. Izevbaye, I.; Liang, L.Y.; Mather, C.; El-Hallani, S.; Maglantay, R., Jr.; Saini, L. Clinical validation of a myeloid next-generation sequencing panel for single-nucleotide variants, Insertions/deletions, and fusion genes. J. Mol. Diagn. 2020, 22, 208–219. [Google Scholar] [CrossRef] [PubMed]
  49. Kluk, M.J.; Lindsley, R.C.; Aster, J.C.; Lindeman, N.I.; Szeto, D.; Hall, D.; Kuo, F.C. Validation and implementation of a custom next-generation sequencing clinical assay for hematologic malignancies. J. Mol. Diagn. 2016, 18, 507–515. [Google Scholar] [CrossRef] [Green Version]
  50. Schneider, T.; Smith, G.H.; Rossi, M.R.; Hill, C.E.; Zhang, L. Validation of a customized bioinformatics pipeline for a clinical next-generation sequencing test targeting solid tumor–associated variants. J. Mol. Diagn. 2018, 20, 355–365. [Google Scholar] [CrossRef] [Green Version]
  51. Trosman, J.R.; Weldon, C.B.; Gradishar, W.J.; Benson, A.B., III; Cristofanilli, M.; Kurian, A.W.; Ford, J.M.; Balch, A.; Watkins, J.; Phillips, K.A. From the past to the present: Insurer coverage frameworks for next-generation tumor sequencing. Value Health 2018, 21, 1062–1068. [Google Scholar] [CrossRef] [Green Version]
Figure 1. Genomic landscapes of 200 MPN patients. (A) The mosaic plot (B) The bar-charts of mutations and chromosomal abnormalities (C) The circos plot indicating recurrent co-occurrences of genetic aberrations by ribbon widths. PV: Polycythemia vera, ET: essential thrombocythemia, PMF: primary myelofibrosis, CNL: chronic neutrophilic leukemia, MPN-U: MPN-unclassifiable and MPN: myeloproliferative neoplasm.
Jcm 10 01033 g001
Figure 2. (A) Overall survival curves of the patients according to disease category. (B) Hazard ratios of significant factors for overall survival and (C) leukemic transformation in PV, ET, PMF and (D) fibrosis progression in PV and ET patients. PV: Polycythemia vera, ET: essential thrombocythemia, PMF: primary myelofibrosis, MPN: myeloproliferative neoplasm, No: number and abn: abnormal.
Jcm 10 01033 g002
Table 1. Overall characteristics of patients in this study.
VariablesTotal
N = 200
PV
N = 55
ET
N = 70
PMF
N = 66
Other MPN a
N = 9
p
Age at diagnosis, mean ± SD 49.0 ± 14.750.3 ± 12.343.2 ± 15.352.5 ± 13.661.4 ± 14.2<0.001
Sex, male (%) 43.0 (86/200)52.7 (29/55)35.7 (25/70)39.4 (26/66)66.7 (6/9)0.109
Follow-up months, mean ± SD 64.7 ± 69.476.4 ± 67.778.5 ± 73.846.0 ± 64.823.6 ± 20.2<0.001
White blood cells (109/l), mean ± SD 12.9 ± 13.712.9 ± 7.49.5 ± 5.511.8 ± 11.947.8 ± 37.3<0.001
Hemoglobin (g/l), mean ± SD 129.3 ± 33.6164.7 ± 31.3126.2 ± 20.6107.7 ± 21.395.3 ± 18.7<0.001
Platelet (109/l), mean ± SD 560.5 ± 484.8542.2 ± 324.9803.7 ± 608.7367.5 ± 340.3197.2 ± 147.5<0.001
Bone marrow fibrosis, % 46.0 (92/200)16.4 (9/55)21.4 (15/70)100.0 (66/66)22.2 (2/9)0.064
Splenomegaly, % 31.5 (63/200)27.3 (15/55)11.4 (8/70)54.5 (36/66)44.4 (4/9)0.364
Vascular event b, % 20.0 (40/200)36.4 (20/55)20.0 (14/70)9.1 (6/66)0 (0/9)0.275
Abnormal karyotype c, % 22.5 (38/169)18.6 (8/43)9.8 (6/61)37.5 (21/56)33.3 (3/9)0.003
Complex karyotype c, % 4.7 (8/169)4.7 (2/43)3.3 (2/61)7.1 (4/56)0 (0/9)0.692
Number of mutations, mean ± SD 1.3 ± 1.01.4 ± 0.91.1 ± 0.91.6 ± 1.10.9 ± 0.90.024
PV: polycythemia vera, ET: essential thrombocythemia, PMF: primary myelofibrosis, MPN: myeloproliferative neoplasm, CNL: chronic neutrophilic leukemia and SD: standard deviation. Group comparisons were performed using the Kruskal–Wallis and Chi-square tests for continuous and categorical variables, respectively; a Other MPN include CNL (n = 4) and MPN-unclassifiable (n = 5); b Vascular events include a thrombosis history at diagnosis and related microcirculation symptoms such as headaches, lightheadedness, atypical chest pain, transient visual disturbances and acral paresthesia; c Total of 169 BM karyotypes were available.
Table 2. Proportion of patients possessing a clonal genetic marker after applying sequential criteria for genetic aberrations.
PVETPMF3 MPNs aOther MPN b
Case number5570661919
Triple mutations c49 (89.1%)51 (72.9%)46 (69.7%)146 (76.4%)2 (22.2%)
Any of the seven mutations d0 (0%)2 (2.9%)6 (9.1%)8 (4.2%)3 (33.3%)
Other mutations e and/or abnormal karyotypes1 (1.8%)1 (1.4%)9 (13.6%)11 (5.8%)4 (22.4%)
Any clonal genetic marker f50 (90.9%)54 (77.1%)61 (92.4%)165 (86.4%)7 (77.8%)
All negative5 (9.1%)16 (22.9%)5 (7.6%)26 (13.6%)2 (22.2%)
PV: polycythemia vera, ET: essential thrombocythemia, PMF: primary myelofibrosis, MPN: myeloproliferative neoplasm and CNL: chronic neutrophilic leukemia. a PV, ET and PMF, b CNL (n = 4) and MPN-unclassifiable (n = 5), c JAK2, CALR and MPL for three MPNs and CSF3R for CNL, d any mutations including ASXL1, EZH2, TET2, IDH1/2, SRSF2 and SF3B1 among triple-negative patients, e any mutation other than the above-mentioned mutations, f any mutation and/or abnormal karyotype.
Table 3. Multivariate analysis of clinical and genetic factors for overall survival, leukemic transformation and fibrosis progression.
VariablesOverall SurvivalLeukemic TransformationFibrotic Progression
PHR95% CIPHR95% CIPHR95% CI
Diagnosis a0.008778.23.0–2027.3
PB blasts (%) 0.04861.31.0-1.6
No. mutation 0.03522.01.1–4.0
ASXL1 0.03584.31.1–16.4
RUNX1 0.00568.13.6–1300.4
SF3B1 0.000931.54.1–243.3
TP530.004164.23.8–1096.50.036416.31.2–222.7
IDH1/2 0.005132.52.8–371.10.001121.23.4–132.2
−7/del(7q)0.021914.01.5–132.7
del(20q) 0.000244.56.1–323.0
HR: hazard ratio, CI: confidence interval, PB: peripheral blood and No.: number. Variables assigned to be significant prognostic factors in univariate analysis were included in multivariate analysis. The fibrosis progression was analyzed among patients with polycythemia vera and essential thrombocythemia, excluding primary myelofibrosis. a Diagnosis of primary myelofibrosis.
Table 4. Comparison of risk groups in patients with polycythemia vera (PV) and essential thrombocythemia (ET).
Risk GroupLowIntermediateHighP
(Contingency Coefficient)
MIPSS-PV182314<0.001 (0.514)
Low18146
Intermediate095
High003
MIPSS-ET42244<0.001 (0.554)
Low41190
Intermediate132
High022
MIPSS: Mutation-enhanced International Prognostic Scoring System, PV: polycythemia vera and ET: essential thrombocythemia. Risk factors for PV: advanced age (≥67 years, 5 points; 57–66 years, 2 points), leukocytosis (≥15 × 109/l, 1 point), and the presence of a vascular event (1 point); low risk (no risk factors), intermediate risk (1–2 points) and high risk (≥3 points). Risk factors for ET: advanced age (≥60 years, 2 points), leukocytosis (≥11 × 109/l, 1 point) and the presence of vascular event (1 point); low risk (no risk factors), intermediate risk (1–2 points) and high risk (3–4 points).
Table 5. Comparison of risk groups in primary myelofibrosis (PMF) patients.
DIPSSLowInt-1Int-2HighP
(Contingency Coefficient)
MIPSS702516214<0.001 (0.620)
Low15100
Intermediate812110
High23104
MIPSS70+2113193<0.001 (0.603)
Very low5100
Low10520
Intermediate4430
High2381
Very High0062
DIPSS: Dynamic International Prognostic Scoring System, Int: intermediate, MIPSS70: Mutation-enhanced International prognostic scoring system and MIPSS70+: Karyotype-enhanced MIPSS70.
Publisher’s Note: MDPI stays neutral with regard to jurisdictional claims in published maps and institutional affiliations.

