Article

Altered Blood Brain Barrier Permeability and Oxidative Stress in Cntnap2 Knockout Rat Model

1
Hearing Research and Communication Disorders Laboratory, Department of Otolaryngology, Neurotology Division, University of Miami Miller School of Medicine, Miami, FL 33136, USA
2
Department of Neurological Surgery, University of Miami Miller School of Medicine, Miami, FL 33136, USA
3
Department of Biomedical Engineering, University of Miami, Coral Gables, FL 33146, USA
4
Department of Pediatrics, University of Miami Miller School of Medicine, Miami, FL 33136, USA
*
Author to whom correspondence should be addressed.
These authors contributed equally to this work.
J. Clin. Med. 2022, 11(10), 2725; https://doi.org/10.3390/jcm11102725
Submission received: 9 March 2022 / Revised: 2 May 2022 / Accepted: 3 May 2022 / Published: 11 May 2022
(This article belongs to the Section Mental Health)

Abstract

:
Autism spectrum disorder (ASD) is a neurodevelopmental disorder characterized by three core symptoms, specifically impaired social behavior, stereotypic/repetitive behaviors, and sensory/communication deficits. Although the exact pathophysiology of ASD is still unknown, host genetics, oxidative stress, and compromised blood brain barrier (BBB) have been implicated in predisposition to ASD. With regards to genetics, mutations in the genes such as CNTNAP2 have been associated with increased susceptibility of developing ASD. Although some studies observed conflicting results suggesting no association of CNTNAP2 with ASD, other investigations correlated this gene with autism. In addition, CNTNAP2 mediated signaling is generally considered to play a role in neurological disorders due to its critical role in neurodevelopment, neurotransmission, and synaptic plasticity. In this investigation, we studied BBB integrity and oxidative stress in Cntnap2/ rats. We observed that the BBB permeability was significantly increased in Cntnap2/ rats compared to littermate wild-type (WT) animals as determined by FITC-dextran and Evans blue assay. High levels of thiobarbituric acid reactive substances and lower amounts of reduced glutathione were observed in brain homogenates of Cntnap2/ rats, suggesting oxidative stress. Brain sections from Cntnap2/ rats showed intense inducible nitric oxide synthase immunostaining, which was undetectable in WT animals. Quantification of nitric oxide in brain homogenates revealed significantly high levels in Cntnap2/ rats compared to the control group. As increased permeability of the BBB and oxidative stress have been observed in ASD individuals, our results suggest that Cntnap2/ rats have a high construct and face validity and can be explored to develop effective therapeutic modalities.

1. Introduction

Autism spectrum disorder (ASD) is a heterogenous group of complex neurodevelopmental disorders that begin early in childhood [1,2,3]. According to the US Centers of Disease Control and Prevention (CDC), the incidence of ASD is about 1 in 44 children and is steadily increasing [4]. The core features of ASD include persistent deficits in social communication and interaction as well as restricted, repetitive patterns of sensory-motor behavior, interests, or activities accompanied with speech-language delay [2,5]. Despite advances in the medical field, there are still no effective treatments available for ASD, which can be attributed to the incomplete understanding about the pathophysiology of this neurological disorder. A wide arsenal of factors such as epigenetic changes, immune system dysfunction, hormone imbalance, environmental toxins, gastrointestinal factors, and disturbance of brain energy metabolism are considered to contribute to the etiology of ASD [6,7,8,9,10].
The advent of transgenic technologies has revolutionized the field of ASD by providing genetic mouse models to understand the pathogenesis of neurological disorders including ASD [11,12]. Although mouse genetic models have been invaluable for studying underlying neurobiological mechanisms, mouse behavioral analyses have often been challenging. Rat models are more appropriate than mice for understanding ASD pathophysiology as they exhibit complex social behavior [13]. Normal young rats are playfully aggressive creatures, wrestling, boxing, and pinning their siblings down by the neck unlike mice. In addition, the metabolic physiology of rats is more closer to humans unlike in mice. Furthermore, rats have a larger brain volume to perform neurobiochemical, electrophysiological, and neuroanatomical studies This makes the rat a more suitable animal to understand the molecular processes involved in ASD etiology.
Besides a number of predisposing factors as mentioned before, genetics has been strongly implicated in the pathophysiology of ASD. In this regard, mutations in genes such as contactin associated protein like 2 gene (CNTNAP2) have been associated with ASD [14,15,16,17,18,19,20,21,22,23]. CNTNAP2, which codes for the neurexin CASPR2, plays a crucial role in the development of the nervous system, in synaptic functions, and neurotransmission [24,25,26]. Although studies have suggested association or predisposition to ASD in individuals with CNTNAP2 mutations [14,15,16,17,18,19,20,21,22,23], the role of CNTNAP2 in the pathophysiology of autism is still not clear. Studies have reported conflicting results regarding the association of CNTNAP2 with ASD [27,28,29]. A study suggested a limited or likely neutral role of CNTNAP2 in the susceptibility to develop psychiatric disorders including ASD using a large database set including 4,483 ASD subjects and 13,042 controls [27]. A family-based association study suggested that CNTNAP2 polymorphisms might not be associated with autism [28]. Another study suggested that there is no evidence for statistically significant association of rare heterozygous mutations in any of the CNTN or CNTNAP genes, including CNTNAP2 with ASD [29]. Considering conflicting results, further studies are needed to decipher the precise contribution of CNTNAP2 in ASD.
In addition to host genetics, oxidative stress is another important player in the etiology of ASD [8,30,31,32,33,34,35]. The imbalance between antioxidant defenses and the production of reactive oxygen species (ROS) as well as reactive nitrogen species (RNS) lead to oxidative stress, which can cause damage to cellular and neuronal structures in the brain [36]. ROS and RNS are products of cellular metabolism and primarily, they include superoxide radical (O2−), nitric oxide radical, hydroxyl radical, hydrogen peroxide (H2O2), and peroxynitrite radicals [36,37]. Postmortem brain tissues, urine, plasma, and serum samples from ASD individuals show markers for the production of ROS and RNS as well as impaired glutathione activity, which provides protection against oxidative stress [33,38,39,40,41,42,43]. In the genetically modified mouse models, which have a similar oxidant-antioxidant profile to individuals with ASD, it is also shown that a decrease in the glutathione causes an increase in repetitive autism-like behaviors [44].
Nitric oxide (NO) is one of the most important neurotransmitters in both the central nervous system (CNS) and the peripheral nervous systems (PNS). It is synthesized from L-arginine via nitric oxide synthase (NOS) in the presence of NADPH and oxygen. Three isoforms of NOS have been identified, namely neuronal NOS (nNOS), endothelial NOS (eNOS), and inducible NOS (iNOS) [45]. Under physiological conditions, NO levels are regulated by two of these NOS isoforms, nNOS and eNOS. nNOS is constitutively expressed in the cytosol of neurons, and eNOS is expressed in endothelial cells in the membrane [46,47]. Under pathological conditions such as infection, trauma, or ischemic insult, iNOS can be expressed in the brain and regulate the level of NO [45,48,49]. Elevated NO production has been observed in urine, saliva, plasma, and serum samples from individuals with ASD [50,51].
The brain is protected from the detrimental effects of ROS and RNS due to the presence of the blood brain barrier (BBB). The BBB is a continuous endothelial membrane which maintains CNS homeostasis by tightly controlling the passage of oxygen, carbon dioxide, nutrients, and ions [52,53,54,55,56,57]. The disruption of the BBB is a hallmark of ASD [58]. The BBB disruption allows immune components, neurotoxic debris, cells, and pathogens to access the brain. Studies have reported increased levels of pro-inflammatory cytokines such as tumor necrosis factor alpha (TNF-α), interleukin-6 (IL-6), interleukin-8 (IL-8), and macrophage chemoattractant protein-1 (MCP-1), accompanied with activation of microglia and astroglia in the postmortem brain tissue from ASD individuals [59,60,61]. These might potentially contribute to the clinical manifestations of ASD by hampering the normal function of the brain.
Studies have shown that deletion of Cntnap2 in animal models leads to behavioral, cognitive, neuronal, and sensory alterations similar to those seen in individuals with ASD [62,63,64,65,66]. The behavior profile of Cntnap2/ rats has already been extensively characterized in previous studies and it has been shown that these rats exhibit an ASD-like phenotype [66]. Cntnap2/ rats have been shown to demonstrate deficits in sociability and social novelty using a three-chamber behavior test. Enhanced acoustic startle responses, greater aversions to sound at moderate intensity and lack of rapid audiovisual temporal recalibration has been observed in Cntnap2−/− rats. These findings suggest sensory processing deficits in Cntnap2/ rats at both the pre-attentive and perceptual levels similar to the phenotype observed in individuals with ASD. In addition, altered auditory processing and behavioral reactivity have been observed in Cntnap2/ rats accompanied with deficits in sensorimotor gating. However, the molecular mechanisms such as oxidative stress that can lead to ASD-like phenotype have not been characterized in previous investigations. The objective of the present study was to determine whether Cntnap2 deletion affects the BBB permeability as well as determining if it leads to oxidative and nitrosative stress using a rat model.

2. Materials and Methods

2.1. Animals

Heterozygous breeders of Cntnap2/ rats on Sprague Dawley background were obtained from the Envigo company (Indianapolis, IN, USA). The model contains a five base pair deletion in exon six of the Cntnap2 gene, created using the zinc finger nuclease target site CAGCATTTCCGCACC|aatgga|GAGTTTGACTACCTG. All experimental animals were obtained from heterozygous crossings. Both male and female rats were used in each experiment. The study protocol was approved by the Animal Care and Use Committee of the University of Miami and is in full compliance with the NIH guidelines for the care and use of laboratory animals.

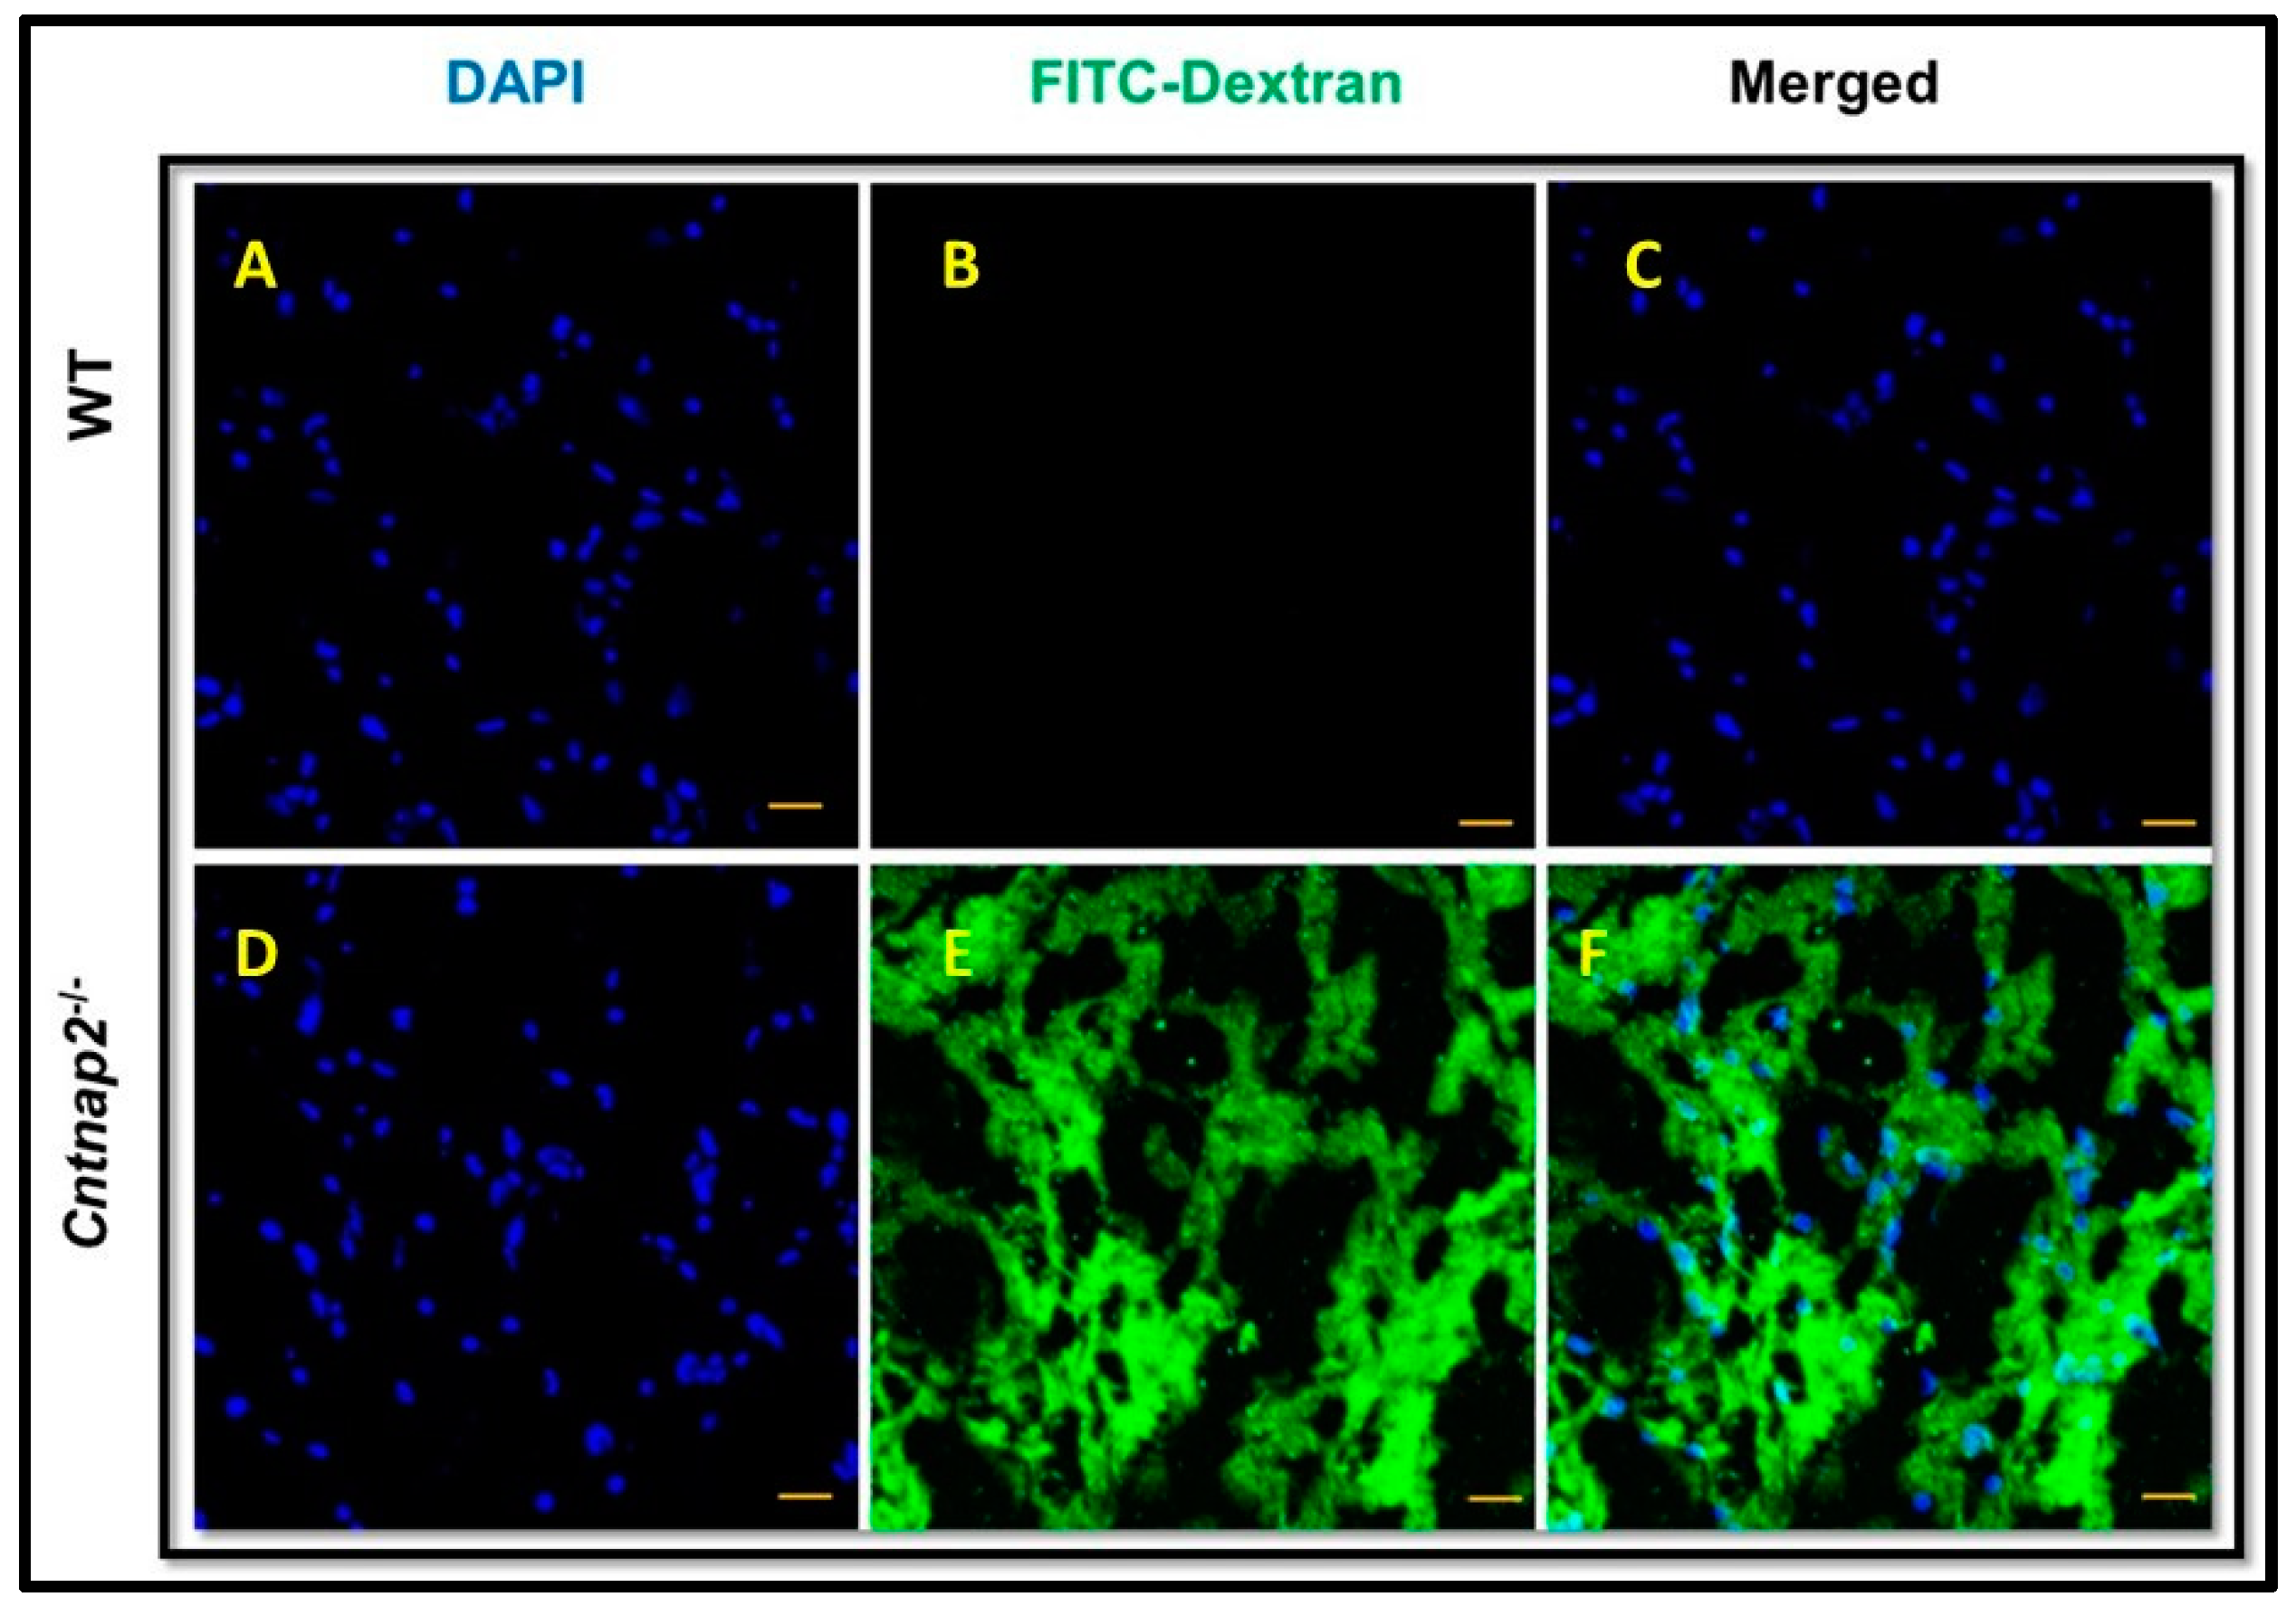
2.2. Fluorescein Isothiocyanate (FITC)-Dextran Assay

To determine the integrity of the BBB, we performed the FITC-dextran assay [67]. FITC-dextran (4 kDa; 500 mg/kg, Sigma, St. Louis, MO, USA) was administered intraperitoneally to the rats. The rat brains were then harvested 6 h post-administration after transcardial perfusion with PBS (Sigma, St. Louis, MO, USA) and fixed in 4% paraformaldehyde (Electron Microscopy Sciences, Hatfield, PA, USA) at 4 °C for 24 h. The brains were sectioned and subjected to confocal microscopy to determine FITC-dextran extravasation. Five fields per section and three sections per animal were analyzed. To determine the mean signal intensity for FITC-dextran, the mean green signal intensity was measured as the average of ten regions of interest (ROI) and normalized using the mean signal background intensity. The size and location of each ROI was consistent for all images. The mean signal intensity was measured and calculated using ImageJ version 1.52 k software (Bethesda, MD, USA) [68]. For quantification, the brain samples were weighted and homogenized. FITC intensity in the brain homogenates was determined using a fluorescent spectrometer with an excitation and emission spectrum of 485 nm and 520 nm, respectively. A standard curve was plotted using FITC-dextran and the results were expressed as µg/g brain tissue.

2.3. Evans Blue Assay

In addition to FITC-dextran, we used the Evans blue dye assay to determine the permeability of the BBB [69]. Briefly, rats received 4% of Evans blue (Sigma, St. Louis, MO, USA) through the intraperitoneal route (4 mL/kg). After 6 h post-administration, rats were perfused transcardially with PBS (Sigma, St. Louis, MO, USA) followed by the harvesting and weighing of brain tissues. Evans blue in brain tissue was extracted by homogenizing the samples in 0.1 mol/L PBS (pH 7.4), followed by protein precipitation using 60% trichloroacetic acid (Sigma, St. Louis, MO, USA). The samples were then vortexed and cooled. After 30 min, the samples were centrifuged and the concentration of Evans blue in the supernatant was determined at a wavelength of 610 nm using a spectrophotometer. A standard curve was plotted using Evans blue dye and the results were expressed as µg/g brain tissue.

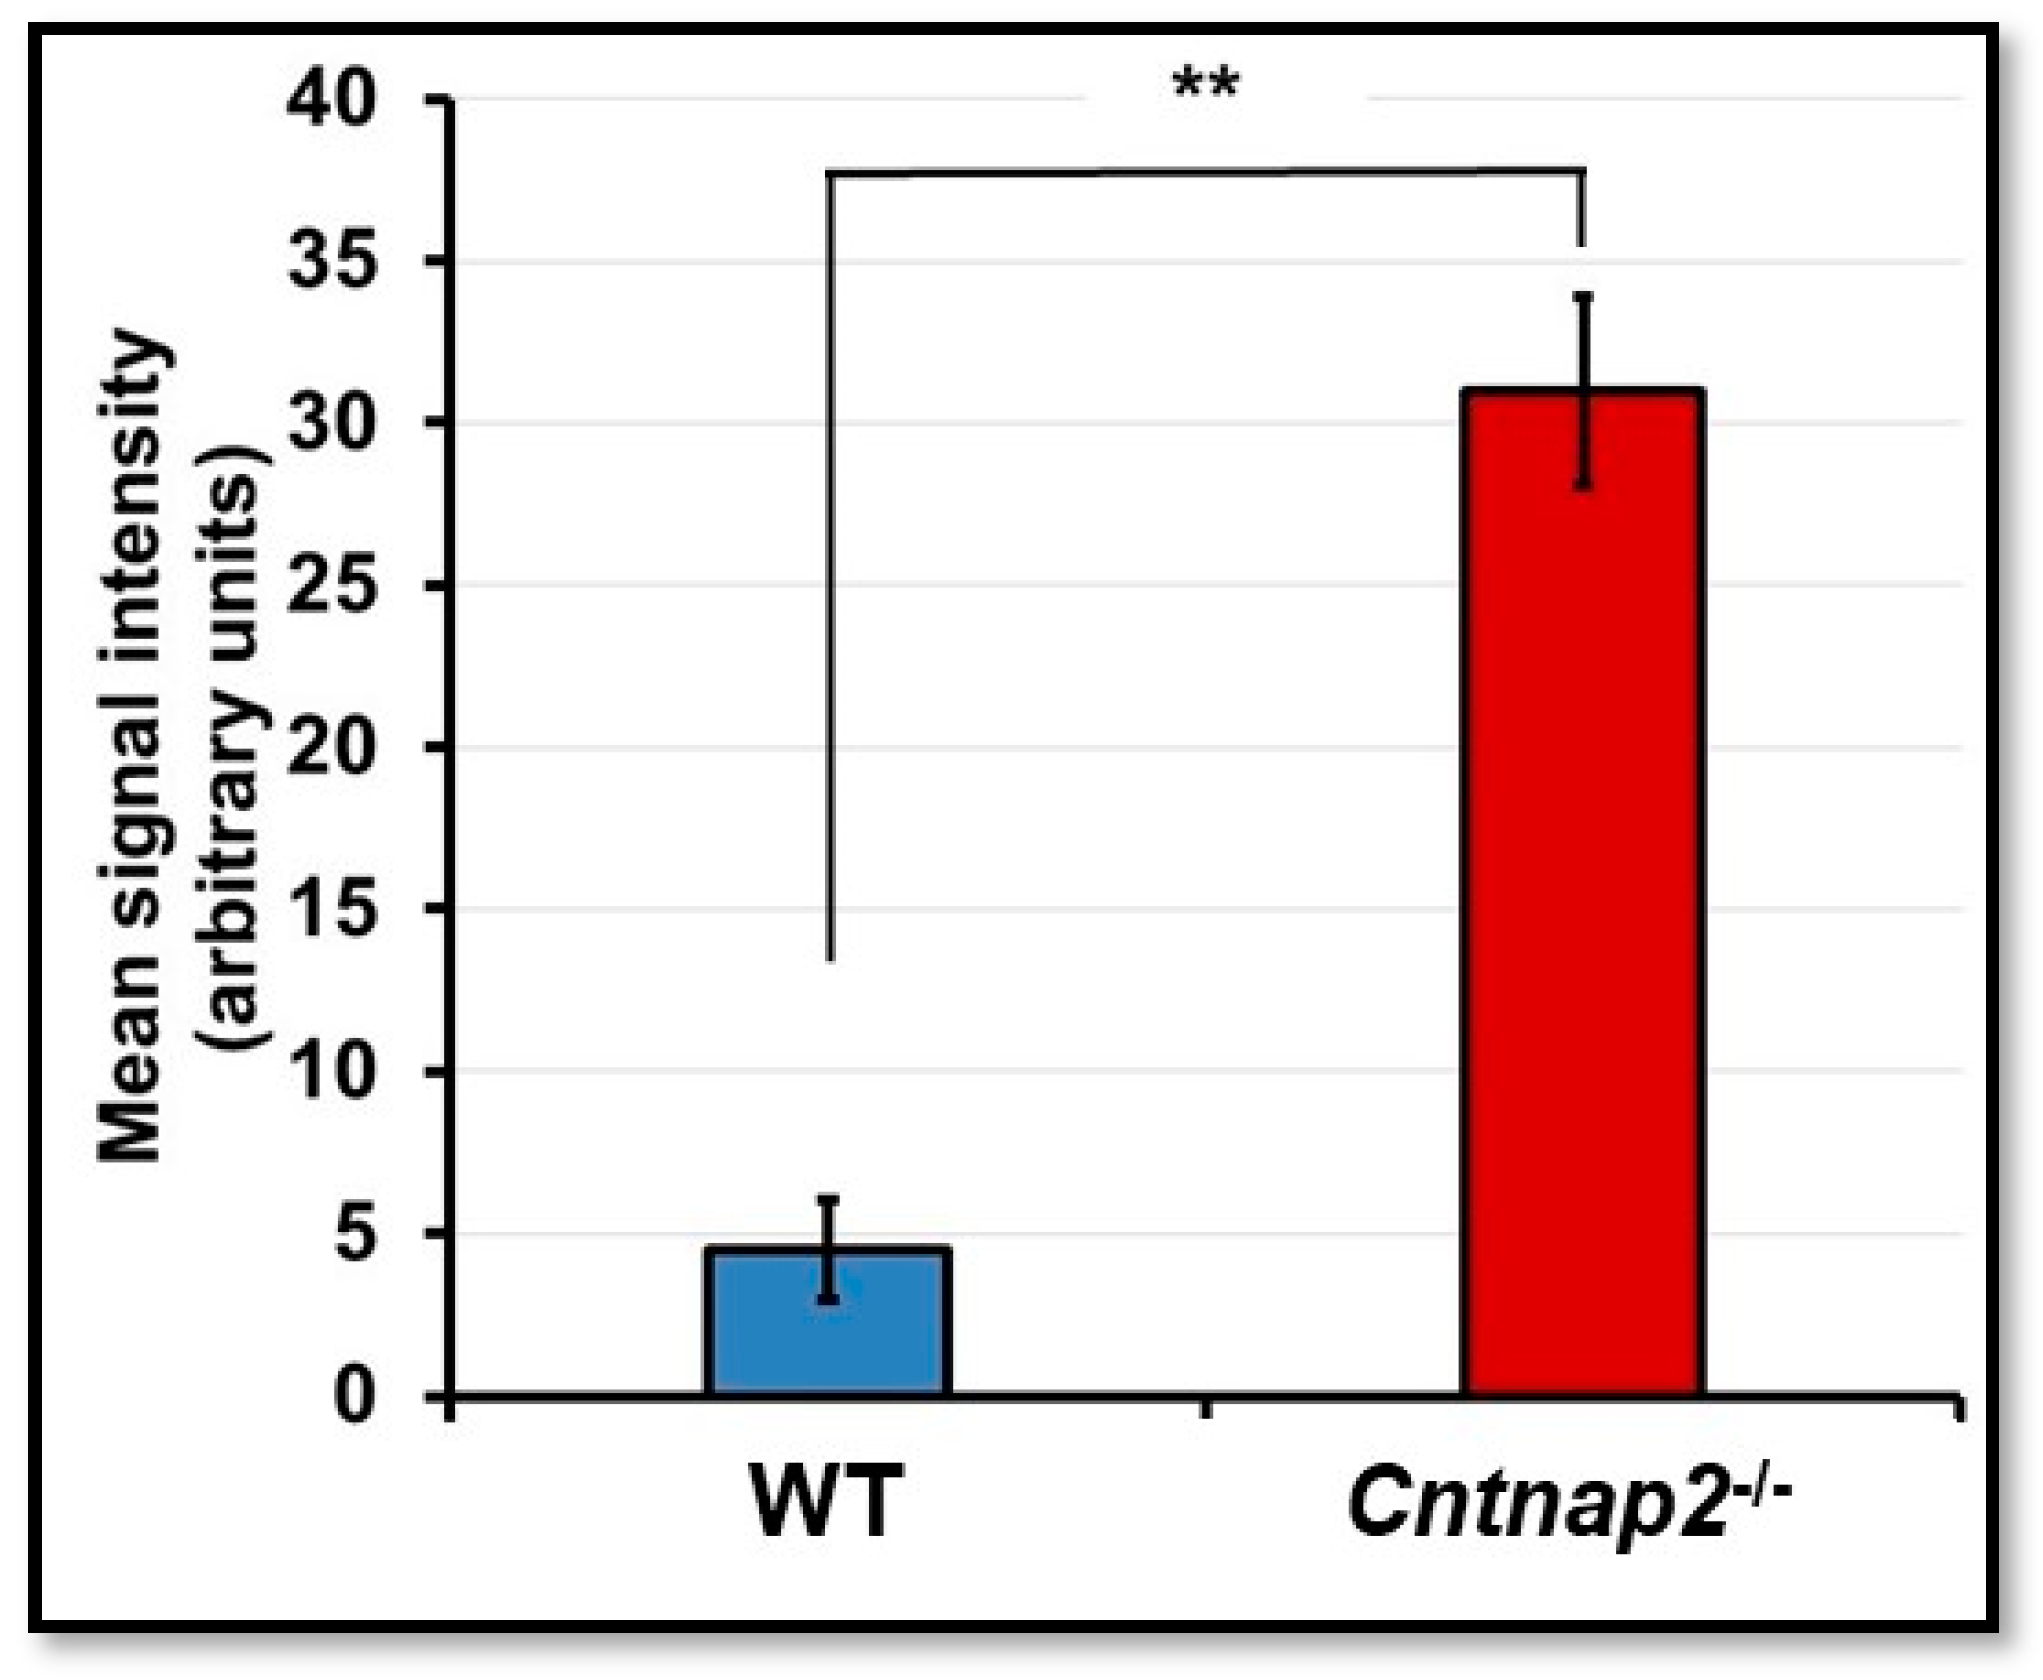
2.4. ZO-1 and iNOS Immunostaining

For immunostaining, rat brains were harvested and fixed using 4% paraformaldehyde (Electron Microscopy Sciences, Hatfield, PA, USA) at 4 °C overnight. The samples were then cryopreserved by passing them through the sucrose gradient (5–30%) followed by embedding them in OCT compound media (Tissue-Tek, Sakura Finetek USA, Inc., Torrance, CA, USA) and allowing them to freeze at −20 °C. Sections of 10 µm were cut, blocked with 10% normal goat serum/5% BSA/PBST (0.3% Triton X-100), and stained overnight at 4 °C with the following primary antibodies: ZO-1 (1:100, Abcam, Waltham, MA, USA) and iNOS (1:100, Abcam, Waltham, MA, USA). After incubation, the samples were stained with Alexa Fluor 568 conjugated secondary antibody (ThermoFisher Scientific, Waltham, MA, USA) for 90 min at room temperature followed by mounting with the mounting medium containing DAPI (Vector Laboratories, Burlingame, CA, USA). The images were acquired using a confocal Zeiss Axiovert 700 microscope (Carl Zeiss Microimaging, LLC; Thornwood, New York, NY, USA). ImageJ version 1.52 k software (Bethesda, MD, USA) was used for processing and analyzing the images as well as for calculating the mean signal intensity as described for the FITC-Dextran assay [68].

2.5. Brain Glutathione (GSH) Levels

The levels of reduced glutathione (GSH) in the brain homogenates were determined as described in previous studies [70]. Briefly, the brain homogenate supernatant was added to trichloroacetic acid (10% w/v) (Sigma, St. Louis, MO, USA) in a 1:1 ratio, followed by centrifugation at 1000× g for 10 min at 4 °C. Next, 0.3 M disodium hydrogen phosphate (Sigma, St. Louis, MO, USA) was added to the supernatant followed by mixing with 0.001 M DTNB [5,5′-dithiobis (2-nitrobenzoic acid)] (Sigma, St. Louis, MO, USA). The absorbance of the samples was read at 412 nm. Using the reduced form of glutathione (Sigma, St. Louis, MO, USA), a standard curve was plotted, and the results were expressed as micromoles of reduced glutathione per mg of protein.

2.6. Determination of Brain Lipid Peroxidation by Measurement of Thiobarbituric acid Reactive Substances

To determine lipid peroxidation, brain thiobarbituric acid reactive substances (TBARS) levels were measured. The brain tissue supernatant was treated with 8.1% sodium dodecyl sulfate, 30% acetic acid (pH 3.5), and 0.8% thiobarbituric acid (all from Sigma, St. Louis, MO, USA) followed by incubation at 95 °C for 1h. The samples were then cooled, followed by the addition of n-butanol-pyridine mixture (15:1 v/v) (Sigma, St. Louis, MO, USA). The samples were then centrifuged, and the absorbance of the supernatant was determined using a spectrophotometer at a wavelength of 532 nm. A standard curve was prepared using 1,1,3,3-tetra methoxypropane (Sigma, St. Louis, MO, USA) and results were expressed as nM/mg protein.

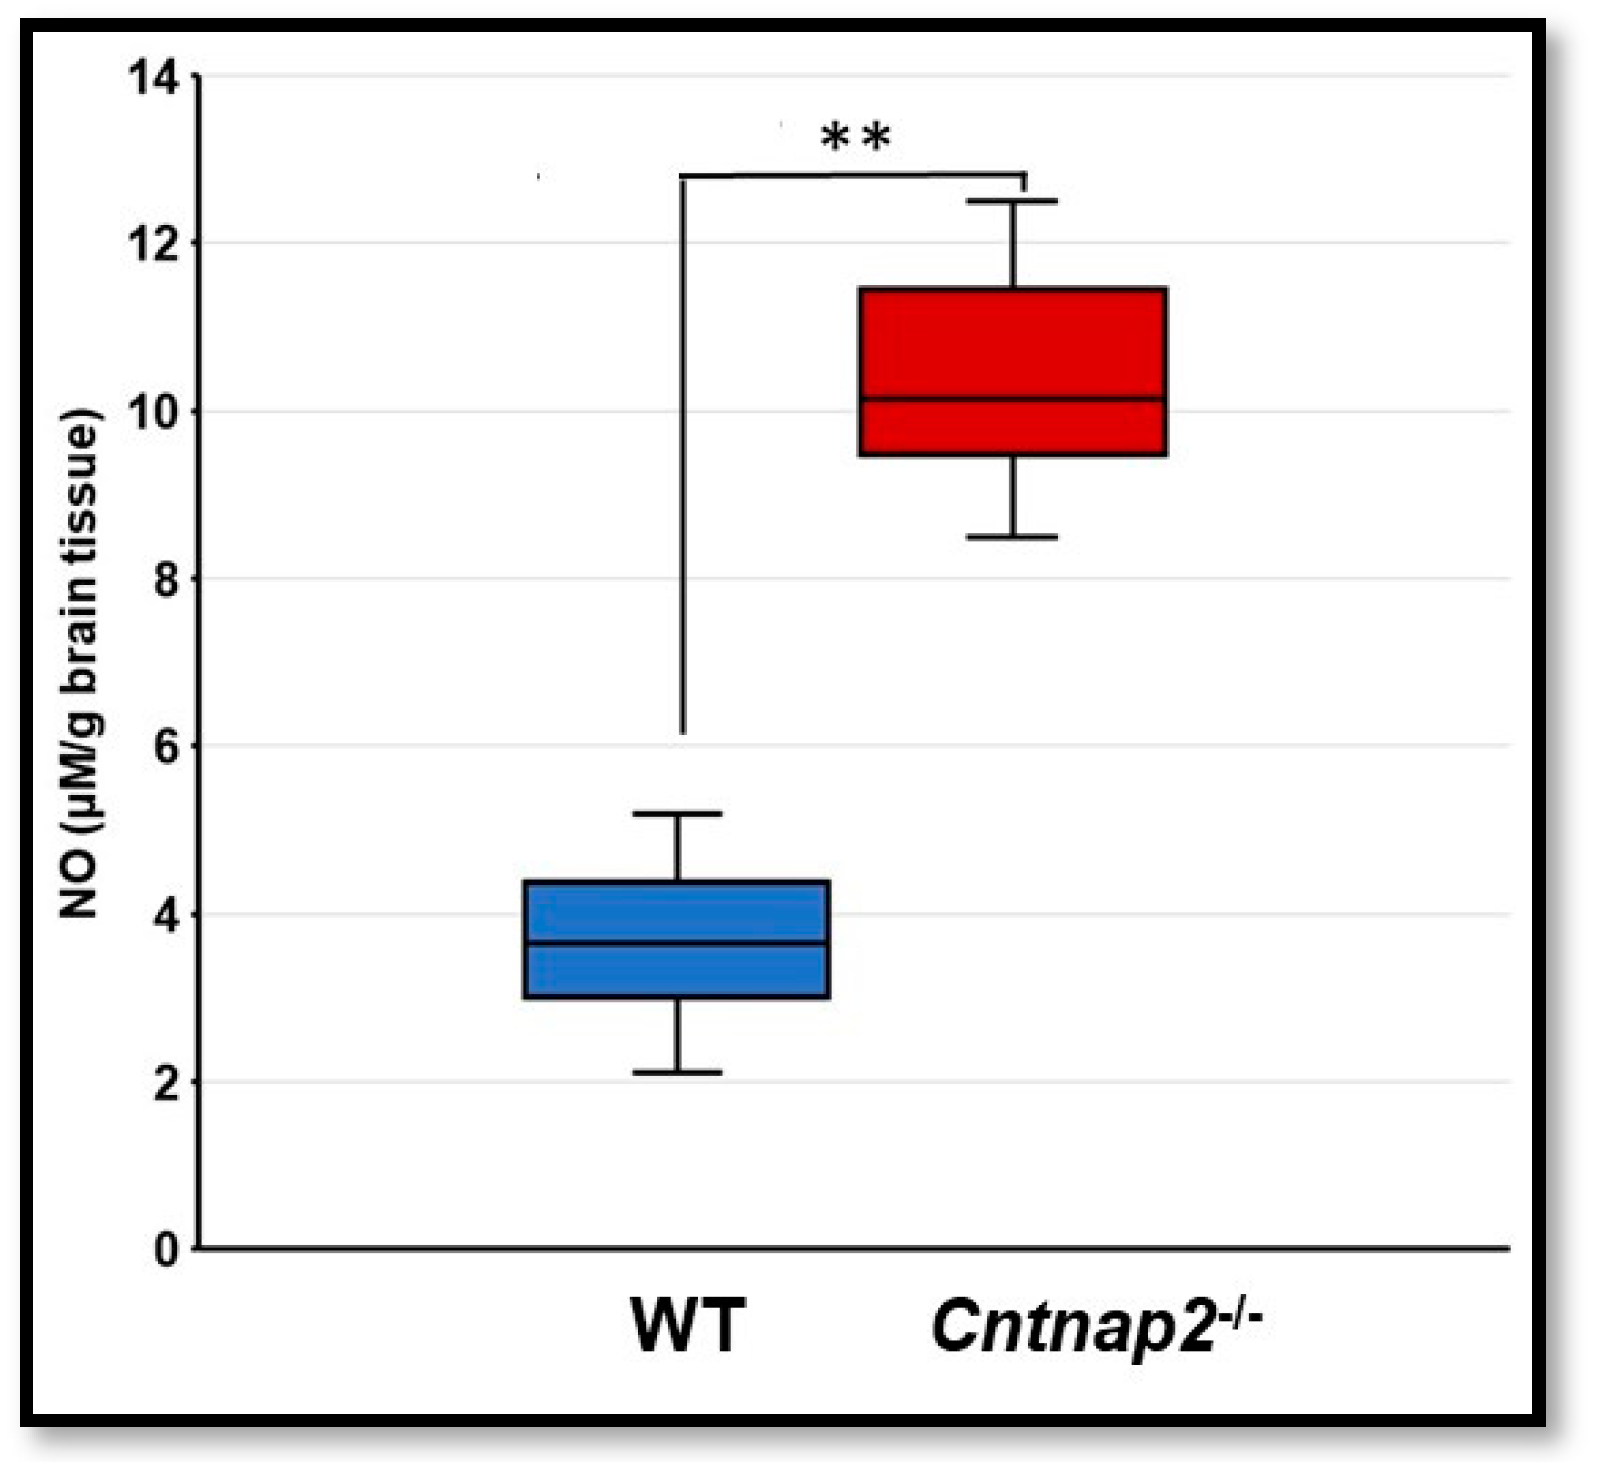
2.7. Nitrite Determination

The levels of NO were determined in the brain homogenates using the nitrite assay kit (Griess Reagent) (Sigma, St. Louis, MO, USA) as per the manufacturer’s instructions. A standard curve was plotted using sodium nitrite (Sigma, St. Louis, MO, USA) and the results were expressed as micromoles of reduced glutathione per mg of protein.

2.8. Statistical Analysis

All data was checked for the normal distribution through the Levene test using SPSS software version 28 (New York, NY, USA). If the samples were homogenous, the data analysis was performed using the student’s t test. In all other cases where samples were inhomogeneous, the statistical analysis of data was performed using the Mann Whitney test. p values < 0.05 were considered statistically significant.

3. Results

3.1. FITC-Dextran Assay

To determine the integrity of the BBB, animals received intraperitoneal injection of FITC-dextran followed by harvesting of the brain samples after euthanasia. Confocal microscopy revealed a significantly high intensity of FITC-dextran in the brain slices of Cntnap2/ rats compared to the WT littermate control group (Figure 1A–F). There was a significant difference in the mean fluorescent intensity of the FITC-dextran signal in Cntnap2/ and WT rats (p < 0.001) (Figure 2A). Quantitation of FITC-dextran in the brain homogenates using a fluorescent spectrophotometer confirmed the confocal microscopy data showing significantly higher levels in Cntnap2/ rats suggesting compromised BBB (Figure 2B) (p < 0.01).

3.2. BBB Permeability Using Evans Blue Assay

To further confirm the results of the FITC-dextran assay, animals received Evans blue intraperitoneally to determine BBB permeability. The quantitative determination of Evans blue revealed significantly higher levels in the brain tissues of Cntnap2/ rats compared to WT littermate controls (p < 0.01) (Figure 3). The mean Evans blue levels were 11.41 µg/g brain tissue compared to 2.72 µg/g brain tissue in WT littermate controls. These results suggest that the BBB is compromised in Cntnap2/ rats.

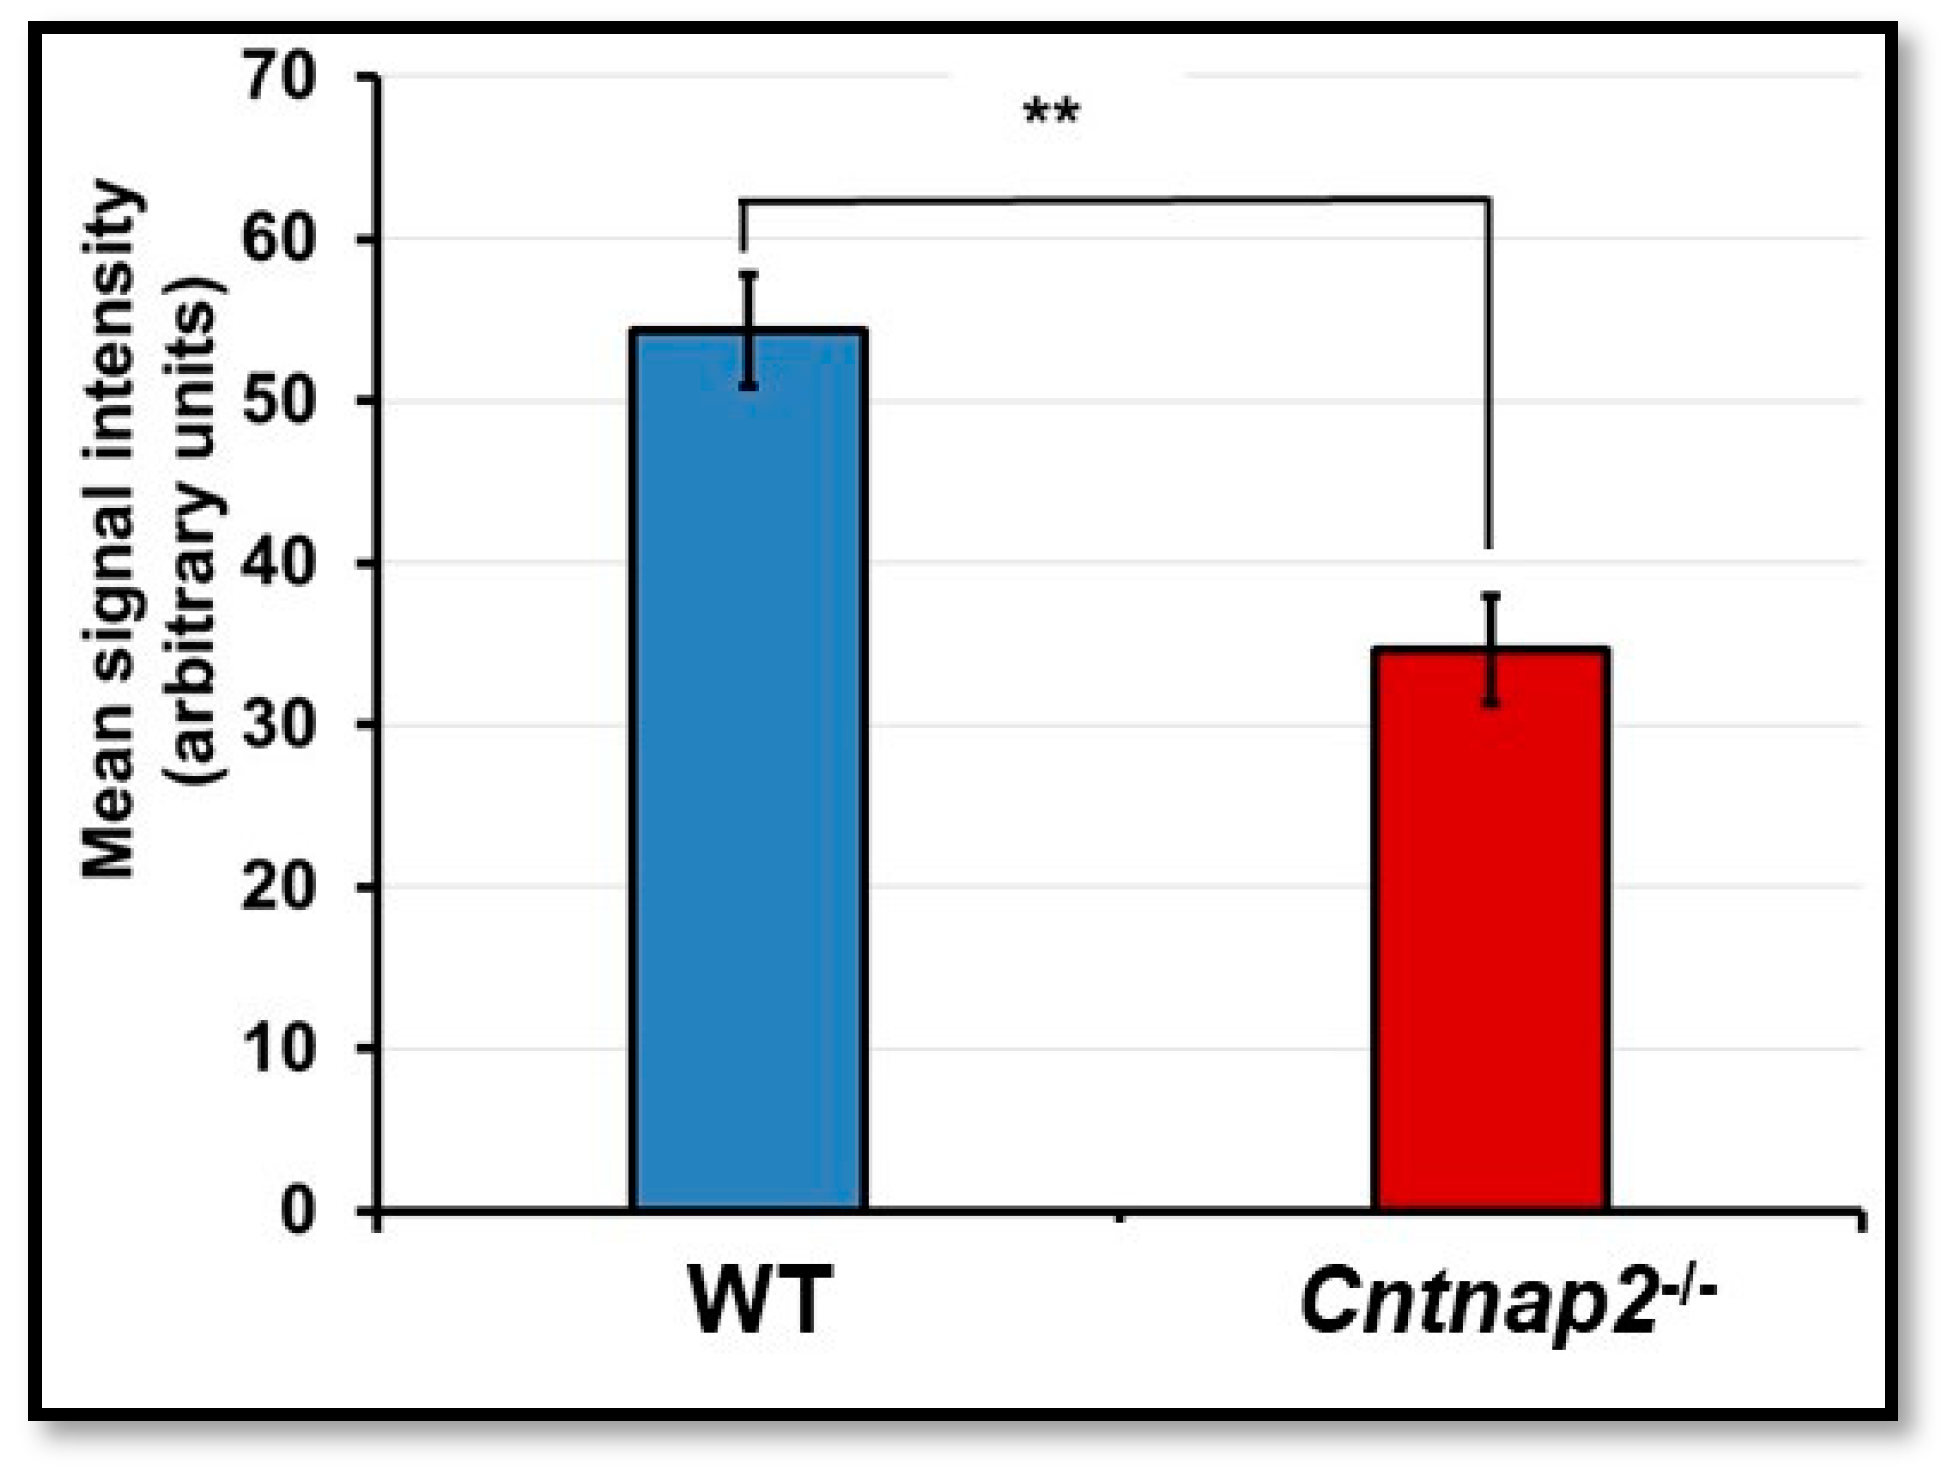
3.3. ZO-1 Immunostaining

ZO-1 is one of the major tight junction proteins and is an integral part of the BBB. The changes in levels of ZO-1 have been associated with BBB damage and increased permeability. Therefore, we determined ZO-1 protein expression in brain sections of Cntnap2/ and WT rats using immunostaining. Brain sections from WT rats showed intense ZO-1 staining with a continuous pattern along the cell margin (Figure 4A–C). On the other hand, there were gaps and disruptions in ZO-1 staining in brain sections from Cntnap2/ rats (Figure 4D–F). The mean fluorescent intensity data confirmed that ZO-1 expression was significantly reduced in the brain tissues of Cntnap2/ rats compared to WT animals (p < 0.01) (Figure 5). The mean signal intensity for ZO-1 immunostaining was 34.66 arbitrary units in Cntnap2/ animals compared to 54.33 arbitrary units in WT rats.

3.4. Oxidative Stress

The brain lipid peroxidation and glutathione levels were used as surrogate markers of oxidative stress. To determine lipid peroxidation, brain thiobarbituric acid reactive substances (TBARS) levels were measured. TBARS levels were significantly higher in brain homogenates of Cntnap2/ rats compared to the WT littermate controls (p < 0.001) (Figure 6A). On par with these findings, there was a significant difference in the reduced glutathione (GSH) content in the brain homogenates of Cntnap2/ and WT rats. The reduced glutathione level in Cntnap2/ rats was 12.9 µM/mg protein where it was 21.08 µM/mg protein in WT littermate controls (p < 0.01) (Figure 6B).

3.5. Nitrosative Stress in Cntnap2−/− Rats

To determine nitrosative stress, iNOS immunostaining was performed on brain cryosections. The brain sections from WT animals showed undetectable staining (Figure 7A–C), whereas intense iNOS staining was evident in the brain sections from Cntnap2/ rats (Figure 7D–F). iNOS immunostaining was seen in a few cells and not at all the cells as very high levels of nitrosative stress will become lethal and may lead to mortality in animals. Mean signal intensity for iNOS immunostaining was 31 arbitrary units in brain sections of Cntnap2/ rats compared to 4.5 arbitrary units in WT animals (Figure 8).
For quantitation, nitrite levels were determined in brain homogenates using Griess reagent. There was a significant increase in nitrite levels in the brain homogenates from Cntnap2/ rats compared to WT littermate controls (p < 0.001) (Figure 9). The mean NO levels in the brain homogenates of WT and Cntnap2/ rats were 3.66 and 10.36 µM/g brain tissue, respectively.

4. Discussion

The blood-brain barrier (BBB) is a selective and tightly regulated barrier that separates the vascular compartment from the central nervous system [71,72,73]. The main function of the BBB is to protect the brain from pathogens as well as maintaining homeostasis by regulating the entry of solutes and other foreign substances into the brain [74]. A number of neurological disorders have been associated with the disruption of the BBB, such as Alzheimer’s disease, and ASD [53,56,75,76,77,78]. It is interesting to note that BBB disruption can lead to different neurological disorders, depending on the inflammatory molecules and pathological proteins present in the milieu. For example, BBB disruption allows tau proteins to enter the brain which has been implicated in the pathology of Alzheimer’s disease [79,80]. On the other hand, enhanced BBB permeability leads to the entry of inflammatory molecules (such as TNF-α) and free radicals such as nitric oxide which may determine predisposition to ASD [81]. To gain a better understanding of BBB disruption and leakage, various tracers are currently used. One of the most popular tracers for assessing the permeability of the BBB is fluorescein isothiocyanate (FITC) labeled dextran [67,82,83]. Due to the fluorescein moiety that can be measured even in low concentrations, FITC-dextran serves as a sensitive and reliable marker to determine BBB permeability [67]. In this study, we observed that there was a strong FITC signal in the brains of Cntnap2/ rats compared to the WT littermate control group, suggesting BBB disruption. Quantitation of FITC in brain tissue homogenates confirmed these findings showing a significant amount in the brains of Cntnap2/ rats than the control group and thus indicating a compromised BBB. Another well-accepted technique to determine BBB integrity is penetration of Evans blue dye into the brain [84,85,86,87,88,89]. On par with our FITC permeability data, we observed significantly high amounts of Evans blue dye in the brain homogenates of Cntnap2/ rats, whereas very low levels were detectable in the brain tissues of the control group suggesting impaired BBB permeability. These findings are in agreement with previously published studies. The increased inflammatory milieu prevalent in ASD has been implicated in BBB disruption [61,81,90]. In addition, decreased expression of adhesion molecules that modulate the permeability and signaling at the blood–brain barrier as well as leukocyte infiltration into the CNS, such as platelet endothelial adhesion molecule-1 (PECAM-1), intercellular adhesion molecule-1 (ICAM-1), vascular adhesion molecule-1 (VCAM-1), P-selectin, and L-selectin can further affect the integrity of the BBB [91,92,93]. This BBB disruption has been demonstrated in preclinical animal models of ASD [94]. Furthermore, an altered expression of genes associated with BBB integrity along with increased neuroinflammation has been observed in postmortem brain samples from human ASD subjects [81]. The increased BBB permeability observed in this study along with previous studies suggests that Cntnap2/ rats have a high construct and face validity and may be useful to better understand the mechanisms involved in ASD.
Tight junction proteins are an integral component of the BBB [74,95]. Endothelial tight junction and adherens junction proteins contribute to the physical barrier of the BBB [96]. Tight junctions between brain microvascular endothelial cells are the first barrier to maintain cerebral homeostasis. These tight junctions are composed of occludins, claudins and zonula occludens 1,2, and 3 (ZO-1, ZO-2, and ZO-3) [96]. ZO-1 is one of the major tight junction proteins that facilitates in maintaining the BBB integrity. ZO-1 can help in predicting the healthy and pathological state of the BBB, making it a valuable marker of the endothelial barrier [97]. Decreased expression and disarrangement of ZO-1 has been associated with an increase in BBB permeability [98]. In the present study, we observed decreased expression and disruption in ZO-1 immunostaining in brain sections from Cntnap2/ rats. This decreased expression of ZO-1 may have contributed to the increase in BBB permeability observed in Cntnap2/ rats.
The term oxidative stress refers to the imbalance between the production of reactive oxygen species (ROS) and the antioxidant capacity of cells [99]. The antioxidant defense mechanisms neutralize the excess production of ROS providing protection against oxidative stress. Glutathione, catalase, and superoxide dismutase (SOD) are potent antioxidant defense mechanisms. ROS are the product of the cellular mechanism, however, an increase in free radical activity causes DNA and protein damage, as well as lipid peroxidation, which can lead to cell damage and cell death. Studies have demonstrated the pertinent role of oxidative stress in the pathophysiology of neurological disorders such as ASD [100]. In fact, associations between markers of increased oxidative stress and the severity of ASD have been observed [100,101]. Increased levels of lipid peroxidation in blood plasma have been seen among children with ASD when compared to their neurotypical siblings [34,35]. Specifically, markers of lipid peroxidation such as TBARS and aminoglycerophospholipids (AGPs) have been seen in significantly increased levels in the blood plasma among children with ASD compared to neurotypical control group [35,101,102]. On par with these findings, we observed significantly high levels of TBARS in the brain homogenates of Cntnap2/ rats compared to the WT littermate controls, suggesting significant lipid peroxidation.
Glutathione is vital in protecting cells from oxidant damage [103], however, glutathione redox imbalance is commonly seen in individuals with ASD. In ASD, decreased concentrations of reduced glutathione (GSH) and greater levels of oxidized glutathione (GSSG) have been observed, as well as a decreased GSH/GSSG redox ratio [101,104,105,106]. Additionally, decreased glutathione levels within red blood cells (RBCs) have been associated with ASD severity [107,108]. In the present study, we observed a significant decrease in GSH levels in the brain homogenates of Cntnap2/ rats compared to the control group, suggesting oxidative stress.
Nitric oxide (NO) is an important cellular signaling molecule generated by the nitric oxide synthase (NOS) enzyme through oxidation of L-arginine to L-citrulline. Of the three NOS isoforms, nNOS and eNOS are constitutively expressed in the brain while iNOS is expressed under pathological conditions. NO plays a vital role in the neurodevelopmental process in the CNS. However, excessive production of iNOS induces nitrosative stress and has been implicated in the pathophysiology of various neuropsychiatric disorders such as sepsis, multiple sclerosis and ASD [109,110,111,112]. In a study with the SHANK3 mutated mouse model showed that, involvement of NO-related molecular changes in the brain might affect the development of ASD [113]. Elevated levels of NO have been found in the blood plasma, saliva, urine, and cerebrospinal fluid of individuals with ASD [50,51,114]. Our results are in agreement with these findings showing high levels of iNOS and NO suggesting nitrosative stress in Cntnap2/ rats.
One of the limitations of our study is that we used rats, which have constitutive deletion of Cntnap2. Further studies using conditional knockout rats with deletion of Cntnap2 only in the brain can shed more light on the role of Cntnap2 signaling in the brain and predisposition to ASD.
Although CNTNAP2 has been proposed to be implicated in ASD [14,15,16,17,18,19,20,21,22,23], recent studies with large datasets suggest a neutral or less penetrant role for genetic variants of this gene in ASD [27,28,29].
Homozygous CNTNAP2 deletions have been shown to cause a monogenic disease called Pitt-Hopkins-Like Syndrome 1 (PTHLS1) [115,116,117]. PTHLS1 is a rare Mendelian condition characterized by severe intellectual disability, behavioral abnormalities, psychomotor delay along with other symptoms of facial dysmorphism, stereotypic movements, breathing difficulties, and seizures [116]. Some of these patients also present autism-like behaviors. Recapitulating PTHLS1 in rodent models can provide a great opportunity to understand this mendelian condition and some clinical manifestations resembling ASD.
Despite conflicting results of CNTNAP2 variants in predisposition to ASD, it is generally accepted that CNTNAP2 signaling is important for normal functioning of the brain by influencing synaptic plasticity and neurotransmission [24,25,26]. A study showed that CNTNAP2 heterozygous variants may contribute to the pathophysiology of ASD [118]. Using cortical neuronal cultures from wild-type, Cntnap2+/− and Cntnap2/ embryos at E14.5, it was observed that loss of one Cntnap2 allele is sufficient to elicit axonal growth alteration, which may hamper neurodevelopment and neurotransmission. The authors of this study suggested that these findings may recapitulate the clinical situations which may be relevant for CNTNAP2 heterozygosity in individuals with ASD [118].
In summary, our results suggest increased BBB permeability and oxidative stress in Cntnap2/ rats similar to the findings observed in individuals with ASD. The ASD-like phenotype as reported in previous studies correlated well with our molecular/histological alterations observed in this study. The Cntnap2/ rat model may be explored to decipher the role of BBB permeability and oxidative stress in the predisposition to ASD. The behavior deficits and auditory dysfunction observed in previous studies [62,63,64,65,66] as well as the oxidative stress and BBB permeability observed in this study make Cntnap2/ rats an appropriate model to determine the efficacy of novel effective preventive and therapeutic strategies for ASD. The availability of novel therapeutic modalities for ASD will lead to improved quality of life of affected individuals and their families.

Author Contributions

Conceptualization, A.A.E. and R.M.; methodology, I.M., R.M., E.F., I.W., R.S.E., J.M. and A.A.E.; formal analysis, I.M., R.M., E.F., I.W., R.S.E., J.M. and A.A.E.; investigation, I.M., R.M., E.F., I.W., R.S.E., J.M. and A.A.E.; resources, A.A.E.; writing—original draft preparation, I.M., R.M., E.F., I.W., R.S.E., J.M. and A.A.E.; writing—review and editing, I.M., R.M., E.F., I.W., R.S.E., J.M. and A.A.E.; visualization, I.M., R.M., E.F., I.W., R.S.E., J.M. and A.A.E.; supervision, A.A.E. and R.M.; project administration, A.A.E.; funding acquisition, A.A.E. All authors have read and agreed to the published version of the manuscript.

Funding

The research in Eshraghi’s Laboratory is supported by translational grant from HERA foundation.

Institutional Review Board Statement

The animal study protocol was approved by the Institutional Review Board of the University of Miami (Protocol number 19-198 and date of approval 7 November 2019).

Data Availability Statement

Not applicable.

Acknowledgments

We are grateful to Valerie Gramling for critical reading of manuscript.

Conflicts of Interest

The authors declare no conflict of interest.

References

  1. Thomas, R.P.; Milan, S.; Naigles, L.; Robins, D.L.; Barton, M.L.; Adamson, L.B.; Fein, D.A. Symptoms of autism spectrum disorder and developmental delay in children with low mental age. Clin. Neuropsychol. 2021, 1–21. [Google Scholar] [CrossRef] [PubMed]
  2. Lord, C.; Elsabbagh, M.; Baird, G.; Veenstra-Vanderweele, J. Autism spectrum disorder. Lancet 2018, 392, 508–520. [Google Scholar] [CrossRef]
  3. Lai, M.-C.; Lombardo, M.V.; Baron-Cohen, S. Autism. Lancet 2014, 383, 896–910. [Google Scholar] [CrossRef]
  4. Maenner, M.J.; Shaw, K.A.; Bakian, A.V.; Bilder, D.A.; Durkin, M.S.; Esler, A.; Furnier, S.M.; Hallas, L.; Hall-Lande, J.; Hudson, A.; et al. Prevalence and characteristics of autism spectrum disorder among children aged 8 years—Autism and developmental disabilities monitoring network, 11 sites, united states, 2018. MMWR Surveill. Summ. 2021, 70, 1–16. [Google Scholar] [CrossRef]
  5. American Psychiatric Association. Diagnostic and Statistical Manual of Mental Disorders, 5th ed.; American Psychiatric Association: Arlington, VA, USA, 2013. [Google Scholar]
  6. Whitely, A.; Shandley, K.; Huynh, M.; Brown, C.M.; Austin, D.W.; Bhowmik, J. Brief report: Pregnancy, birth and infant feeding practices: A survey-based investigation into risk factors for autism spectrum disorder. J. Autism Dev. Disord. 2021. [Google Scholar] [CrossRef]
  7. Ijomone, O.M.; Olung, N.F.; Akingbade, G.T.; Okoh, C.O.A.; Aschner, M. Environmental influence on neurodevelopmental disorders: Potential association of heavy metal exposure and autism. J. Trace Elem. Med. Biol. 2020, 62, 126638. [Google Scholar] [CrossRef]
  8. Pangrazzi, L.; Balasco, L.; Bozzi, Y. Oxidative stress and immune system dysfunction in autism spectrum disorders. Int. J. Mol. Sci. 2020, 21, 3293. [Google Scholar] [CrossRef]
  9. Eshraghi, A.A.; Liu, G.; Kay, S.-I.S.; Eshraghi, R.S.; Mittal, J.; Moshiree, B.; Mittal, R. Epigenetics and autism spectrum disorder: Is there a correlation? Front. Cell. Neurosci. 2018, 12, 78. [Google Scholar] [CrossRef] [Green Version]
  10. Menezo, Y.J.R.; Elder, K.; Dale, B. Link between increased prevalence of autism spectrum disorder syndromes and oxidative stress, DNA methylation, and imprinting. JAMA Pediatr. 2015, 169, 1066. [Google Scholar] [CrossRef] [Green Version]
  11. Brault, V.; Nguyen, T.L.; Flores-Gutiérrez, J.; Iacono, G.; Birling, M.-C.; Lalanne, V.; Meziane, H.; Manousopoulou, A.; Pavlovic, G.; Lindner, L.; et al. Dyrk1a gene dosage in glutamatergic neurons has key effects in cognitive deficits observed in mouse models of MRD7 and down syndrome. PLoS Genet. 2021, 17, e1009777. [Google Scholar] [CrossRef]
  12. Bukatova, S.; Renczes, E.; Reichova, A.; Filo, J.; Sadlonova, A.; Mravec, B.; Ostatnikova, D.; Bakos, J.; Bacova, Z. Shank3 deficiency is associated with altered profile of neurotransmission markers in pups and adult mice. Neurochem. Res. 2021, 46, 3342–3355. [Google Scholar] [CrossRef] [PubMed]
  13. Bryda, E.C. The mighty mouse: The impact of rodents on advances in biomedical research. Mo. Med. 2013, 110, 207–211. [Google Scholar] [PubMed]
  14. Agarwala, S.; Ramachandra, N.B. Role of CNTNAP2 in autism manifestation outlines the regulation of signaling between neurons at the synapse. Egypt J. Med. Hum. Genet. 2021, 22, 22. [Google Scholar] [CrossRef]
  15. Fang, F.; Ge, M.; Liu, J.; Zhang, Z.; Yu, H.; Zhu, S.; Xu, L.; Shao, L. Association between Genetic Variants in DUSP15, CNTNAP2, and PCDHA Genes and Risk of Childhood Autism Spectrum Disorder. Behav. Neurol. 2021, 2021, 4150926. [Google Scholar] [CrossRef] [PubMed]
  16. Uddin, M.S.; Azima, A.; Aziz, M.A.; Aka, T.D.; Jafrin, S.; Millat, M.S.; Siddiqui, S.A.; Uddin, M.G.; Hussain, M.S.; Islam, M.S. CNTNAP2 gene polymorphisms in autism spectrum disorder and language impairment among Bangladeshi children: A case-control study combined with a meta-analysis. Hum. Cell. 2021, 34, 1410–1423. [Google Scholar] [CrossRef]
  17. Zare, S.; Mashayekhi, F.; Bidabadi, E. The association of CNTNAP2 Rs7794745 gene polymorphism and autism in Iranian population. J. Clin. Neurosci. 2017, 39, 189–192. [Google Scholar] [CrossRef]
  18. Rodenas-Cuadrado, P.; Pietrafusa, N.; Francavilla, T.; La Neve, A.; Striano, P.; Vernes, S.C. Characterisation of CASPR2 deficiency disorder—A syndrome involving autism, epilepsy and language impairment. BMC Med. Genet. 2016, 17, 8. [Google Scholar] [CrossRef] [Green Version]
  19. Chiocchetti, A.G.; Kopp, M.; Waltes, R.; Haslinger, D.; Duketis, E.; Jarczok, T.A.; Poustka, F.; Voran, A.; Graab, U.; Meyer, J.; et al. Variants of the CNTNAP2 5′ Promoter as risk factors for autism spectrum disorders: A genetic and functional approach. Mol. Psychiatry 2014, 20, 839–849. [Google Scholar] [CrossRef]
  20. Rodenas-Cuadrado, P.; Ho, J.; Vernes, S.C. Shining a light on CNTNAP2: Complex functions to complex disorders. Eur. J. Hum. Genet. 2013, 22, 171–178. [Google Scholar] [CrossRef]
  21. Li, X.; Hu, Z.; He, Y.; Xiong, Z.; Long, Z.; Peng, Y.; Bu, F.; Ling, J.; Xun, G.; Mo, X.; et al. Association analysis of CNTNAP2 polymorphisms with autism in the Chinese Han population. Psychiatr. Genet. 2010, 20, 113–117. [Google Scholar] [CrossRef]
  22. Alarcón, M.; Abrahams, B.S.; Stone, J.L.; Duvall, J.A.; Perederiy, J.V.; Bomar, J.M.; Sebat, J.; Wigler, M.; Martin, C.L.; Ledbetter, D.H.; et al. Linkage, association, and gene-expression analyses identify CNTNAP2 as an autism-susceptibility gene. Am. J. Hum. Genet. 2008, 82, 150–159. [Google Scholar] [CrossRef] [PubMed] [Green Version]
  23. Arking, D.E.; Cutler, D.J.; Brune, C.W.; Teslovich, T.M.; West, K.; Ikeda, M.; Rea, A.; Guy, M.; Lin, S.; Cook, E.H.; et al. A common genetic variant in the neurexin superfamily member CNTNAP2 increases familial risk of autism. Am. J. Hum. Genet. 2008, 82, 160–164. [Google Scholar] [CrossRef] [PubMed] [Green Version]
  24. Poot, M. Connecting the CNTNAP2 Networks with Neurodevelopmental Disorders. Mol. Syndromol. 2015, 6, 7–22. [Google Scholar] [CrossRef] [PubMed] [Green Version]
  25. Peñagarikano, O.; Geschwind, D.H. What does CNTNAP2 reveal about autism spectrum disorder? Trends Mol. Med. 2012, 18, 156–163. [Google Scholar] [CrossRef] [PubMed] [Green Version]
  26. Saint-Martin, M.; Joubert, B.; Pellier-Monnin, V.; Pascual, O.; Noraz, N.; Honnorat, J. Contactin-Associated Protein-like 2, a Protein of the Neurexin Family Involved in Several Human Diseases. Eur. J. Neurosci. 2018, 48, 1906–1923. [Google Scholar] [CrossRef] [PubMed]
  27. Toma, C.; Pierce, K.D.; Shaw, A.D.; Heath, A.; Mitchell, P.B.; Schofield, P.R.; Fullerton, J.M. Comprehensive cross-disorder analyses of CNTNAP2 suggest it is unlikely to be a primary risk gene for psychiatric disorders. PLoS Genet. 2018, 14, e1007535. [Google Scholar] [CrossRef] [Green Version]
  28. Zhang, T.; Zhang, J.; Wang, Z.; Jia, M.; Lu, T.; Wang, H.; Yue, W.; Zhang, D.; Li, J.; Wang, L. Association between CNTNAP2 polymorphisms and autism: A family-based study in the chinese han population and a meta-analysis combined with GWAS data of psychiatric genomics consortium. Autism Res. 2019, 12, 553–561. [Google Scholar] [CrossRef]
  29. Murdoch, J.D.; Gupta, A.R.; Sanders, S.J.; Walker, M.F.; Keaney, J.; Fernandez, T.V.; Murtha, M.T.; Anyanwu, S.; Ober, G.T.; Raubeson, M.J.; et al. No evidence for association of autism with rare heterozygous point mutations in Contactin-Associated Protein-Like 2 (CNTNAP2), or in Other Contactin-Associated Proteins or Contactins. PLoS Genet. 2015, 11, e1004852. [Google Scholar] [CrossRef] [Green Version]
  30. Oshodi, Y.; Ojewunmi, O.; Oshodi, T.; Ijarogbe, G.; Ogun, O.; Aina, O.; Lesi, F. Oxidative stress markers and genetic polymorphisms of glutathione s-transferase T1, M1, and P1 in a subset of children with autism spectrum disorder in Lagos, Nigeria. Niger. J. Clin. Pract. 2017, 20, 1161. [Google Scholar] [CrossRef] [Green Version]
  31. Frye, R.E.; DeLaTorre, R.; Taylor, H.; Slattery, J.; Melnyk, S.; Chowdhury, N.; James, S.J. Redox metabolism abnormalities in autistic children associated with mitochondrial disease. Transl. Psychiatry 2013, 3, e273. [Google Scholar] [CrossRef]
  32. James, S.J.; Rose, S.; Melnyk, S.; Jernigan, S.; Blossom, S.; Pavliv, O.; Gaylor, D.W. Cellular and mitochondrial glutathione redox imbalance in lymphoblastoid cells derived from children with autism. FASEB J. 2009, 23, 2374–2383. [Google Scholar] [CrossRef]
  33. Yui, K.; Kawasaki, Y.; Yamada, H.; Ogawa, S. Oxidative stress and nitric oxide in autism spectrum disorder and other neuropsychiatric disorders. CNS Neurol. Disord. Drug Targets 2016, 15, 587–596. [Google Scholar] [CrossRef]
  34. Chauhan, A.; Chauhan, V. Oxidative stress in autism. Pathophysiology 2006, 13, 171–181. [Google Scholar] [CrossRef]
  35. Chauhan, A.; Chauhan, V.; Brown, W.T.; Cohen, I. Oxidative Stress in autism: Increased lipid peroxidation and reduced serum levels of ceruloplasmin and transferrin—The antioxidant proteins. Life Sci. 2004, 75, 2539–2549. [Google Scholar] [CrossRef]
  36. Valko, M.; Leibfritz, D.; Moncol, J.; Cronin, M.T.D.; Mazur, M.; Telser, J. Free radicals and antioxidants in normal physiological functions and human disease. Int. J. Biochem. Cell Biol. 2007, 39, 44–84. [Google Scholar] [CrossRef]
  37. Fransen, M.; Nordgren, M.; Wang, B.; Apanasets, O. Role of peroxisomes in ROS/RNS-metabolism: Implications for human disease. Biochim. Biophys. Acta 2012, 1822, 1363–1373. [Google Scholar] [CrossRef] [Green Version]
  38. Thorsen, M.; Bilenberg, N.; Thorsen, L.; Michel, T.M. Oxidative stress in adults with autism spectrum disorder: A case control study. J. Autism Dev. Disord. 2021, 52, 275–282. [Google Scholar] [CrossRef]
  39. Imataka, G.; Yui, K.; Shiko, Y.; Kawasaki, Y.; Sasaki, H.; Shiroki, R.; Yoshihara, S. Urinary and plasma antioxidants in behavioral symptoms of individuals with autism spectrum disorder. Front. Psychiatry 2021, 12, 68445. [Google Scholar] [CrossRef]
  40. Gu, F.; Chauhan, V.; Chauhan, A. Impaired synthesis and antioxidant defense of glutathione in the cerebellum of autistic subjects: Alterations in the activities and protein expression of glutathione-related enzymes. Free Radic. Biol. Med. 2013, 65, 488–496. [Google Scholar] [CrossRef]
  41. Chauhan, A.; Audhya, T.; Chauhan, V. Brain region-specific glutathione redox imbalance in autism. Neurochem. Res. 2012, 37, 1681–1689. [Google Scholar] [CrossRef]
  42. Rose, S.; Melnyk, S.; Pavliv, O.; Bai, S.; Nick, T.G.; Frye, R.E.; James, S.J. Evidence of oxidative damage and inflammation associated with low glutathione redox status in the autism brain. Transl. Psychiatry 2012, 2, e134. [Google Scholar] [CrossRef] [PubMed] [Green Version]
  43. Meguid, N.A.; Dardir, A.A.; Abdel-Raouf, E.R.; Hashish, A. Evaluation of oxidative stress in autism: Defective antioxidant enzymes and increased lipid peroxidation. Biol. Trace Elem. Res. 2010, 143, 58–65. [Google Scholar] [CrossRef] [PubMed]
  44. Nadeem, A.; Ahmad, S.F.; Al-Harbi, N.O.; Attia, S.M.; Alshammari, M.A.; Alzahrani, K.S.; Bakheet, S.A. Increased oxidative stress in the cerebellum and peripheral immune cells leads to exaggerated autism-like repetitive behavior due to deficiency of antioxidant response in BTBR T + tf/J mice. Prog. Neuropsychopharmacol. Biol. Psychiatry 2019, 89, 245–253. [Google Scholar] [CrossRef] [PubMed]
  45. Zhang, L.; Dawson, V.L.; Dawson, T.M. Role of nitric oxide in Parkinson’s disease. Pharmacol. Ther. 2006, 109, 33–41. [Google Scholar] [CrossRef]
  46. Förstermann, U.; Schmidt, H.H.H.W.; Pollock, J.S.; Sheng, H.; Mitchell, J.A.; Warner, T.D.; Nakane, M.; Murad, F. Isoforms of nitric oxide synthase characterization and purification from different cell types. Biochem. Pharmacol. 1991, 42, 1849–1857. [Google Scholar] [CrossRef]
  47. Tripathi, M.K.; Kartawy, M.; Amal, H. The role of nitric oxide in brain disorders: Autism spectrum disorder and other psychiatric, neurological, and neurodegenerative disorders. Redox Biol. 2020, 34, 101567. [Google Scholar] [CrossRef]
  48. Dawson, V.L.; Dawson, T.M. Chapter 15 nitric oxide in neurodegeneration. Prog. Brain Res. 1998, 118, 215–229. [Google Scholar] [CrossRef]
  49. Yoon, S.; Eom, G.H.; Kang, G. Nitrosative stress and human disease: Therapeutic potential of denitrosylation. Int. J. Mol. Sci. 2021, 22, 9794. [Google Scholar] [CrossRef]
  50. Zoroğlu, S.S.; Yürekli, M.; Meram, İ.; Söğüt, S.; Tutkun, H.; Yetkїn, Ö.; Sїvasli, E.; Savaş, H.A.; Yanik, M.; Herken, H.; et al. Pathophysiological role of nitric oxide and adrenomedullin in autism. Cell Biochem. Funct. 2003, 21, 55–60. [Google Scholar] [CrossRef]
  51. Yao, L.; Fu, H.; Bai, L.; Deng, W.; Xie, F.; Li, Y.; Zhang, R.; Xu, X.; Wang, T.; Lai, S.; et al. Saliva nitrite is higher in male children with autism spectrum disorder and positively correlated with serum nitrate. Redox Rep. 2021, 26, 124–133. [Google Scholar] [CrossRef]
  52. Wu, S.; Yin, Y.; Du, L. Blood–brain barrier dysfunction in the pathogenesis of major depressive disorder. Cell. Mol. Neurobiol. 2021, 1–21. [Google Scholar] [CrossRef] [PubMed]
  53. Eshraghi, R.S.; Davies, C.; Iyengar, R.; Perez, L.; Mittal, R.; Eshraghi, A.A. Gut-induced inflammation during development may compromise the blood-brain barrier and predispose to autism spectrum disorder. J. Clin. Med. 2020, 10, 27. [Google Scholar] [CrossRef] [PubMed]
  54. Pena, S.A.; Iyengar, R.; Eshraghi, R.S.; Bencie, N.; Mittal, J.; Aljohani, A.; Mittal, R.; Eshraghi, A.A. Gene therapy for neurological disorders: Challenges and recent advancements. J. Drug Target 2019, 28, 111–128. [Google Scholar] [CrossRef]
  55. Lochhead, J.J.; Yang, J.; Ronaldson, P.T.; Davis, T.P. Structure, function, and regulation of the blood-brain barrier tight junction in central nervous system disorders. Front. Physiol. 2020, 11, 914. [Google Scholar] [CrossRef]
  56. Sweeney, M.D.; Sagare, A.P.; Zlokovic, B.V. Blood–brain barrier breakdown in Alzheimer disease and other neurodegenerative disorders. Nat. Rev. Neurol. 2018, 14, 133–150. [Google Scholar] [CrossRef] [PubMed]
  57. Obermeier, B.; Daneman, R.; Ransohoff, R.M. Development, maintenance and disruption of the blood-brain barrier. Nat. Med. 2013, 19, 1584–1596. [Google Scholar] [CrossRef] [PubMed]
  58. Sweeney, M.D.; Zhao, Z.; Montagne, A.; Nelson, A.R.; Zlokovic, B.V. Blood-brain barrier: From physiology to disease and back. Physiol. Rev. 2019, 99, 21–78. [Google Scholar] [CrossRef]
  59. Goines, P.; Van de Water, J. The immune system’s role in the biology of autism. Curr. Opin. Neurol. 2010, 23, 111117. [Google Scholar] [CrossRef] [Green Version]
  60. Li, X.; Chauhan, A.; Sheikh, A.M.; Patil, S.; Chauhan, V.; Li, X.-M.; Ji, L.; Brown, T.; Malik, M. Elevated immune response in the brain of autistic patients. J. Neuroimmunol. 2009, 207, 111–116. [Google Scholar] [CrossRef] [Green Version]
  61. Vargas, D.L.; Nascimbene, C.; Krishnan, C.; Zimmerman, A.W.; Pardo, C.A. Neuroglial activation and neuroinflammation in the brain of patients with autism. Ann. Neurol. 2005, 57, 67–81. [Google Scholar] [CrossRef]
  62. Möhrle, D.; Wang, W.; Whitehead, S.N.; Schmid, S. GABAB receptor agonist r-baclofen reverses altered auditory reactivity and filtering in the cntnap2 knock-out rat. Front. Integr. Neurosci. 2021, 15, 93. [Google Scholar] [CrossRef] [PubMed]
  63. Peñagarikano, O.; Abrahams, B.S.; Herman, E.I.; Winden, K.D.; Gdalyahu, A.; Dong, H.; Sonnenblick, L.I.; Gruver, R.; Almajano, J.; Bragin, A.; et al. Absence of CNTNAP2 leads to epilepsy, neuronal migration abnormalities, and core autism-related deficits. Cell 2011, 147, 235–246. [Google Scholar] [CrossRef] [PubMed] [Green Version]
  64. Brunner, D.; Kabitzke, P.; He, D.; Cox, K.; Thiede, L.; Hanania, T.; Sabath, E.; Alexandrov, V.; Saxe, M.; Peles, E.; et al. Comprehensive analysis of the 16p11.2 deletion and null Cntnap2 mouse models of autism spectrum disorder. PLoS ONE 2015, 10, e0134572. [Google Scholar] [CrossRef] [PubMed] [Green Version]
  65. Scott, K.E.; Kazazian, K.; Mann, R.S.; Möhrle, D.; Schormans, A.L.; Schmid, S.; Allman, B.L. Loss of Cntnap2 in the rat causes autism-related alterations in social interactions, stereotypic behavior, and sensory processing. Autism Res. 2020, 13, 1698–1717. [Google Scholar] [CrossRef]
  66. Dawes, J.M.; Weir, G.A.; Middleton, S.J.; Patel, R.; Chisholm, K.I.; Pettingill, P.; Peck, L.J.; Sheridan, J.; Shakir, A.; Jacobson, L.; et al. Immune or genetic-mediated disruption of CASPR2 causes pain hypersensitivity due to enhanced primary afferent excitability. Neuron 2018, 97, 806–822.e10. [Google Scholar] [CrossRef] [Green Version]
  67. Natarajan, R.; Northrop, N.; Yamamoto, B. Fluorescein isothiocyanate (FITC)-dextran extravasation as a measure of blood-brain barrier permeability. Curr. Protoc. Neurosci. 2017, 79, 9–58. [Google Scholar] [CrossRef] [Green Version]
  68. Shah, V.; Mittal, R.; Shahal, D.; Sinha, P.; Bulut, E.; Mittal, J.; Eshraghi, A.A. Evaluating the Efficacy of taurodeoxycholic acid in providing otoprotection using an in vitro model of electrode insertion trauma. Front. Mol. Neurosci. 2020, 13, 113. [Google Scholar] [CrossRef]
  69. Manaenko, A.; Chen, H.; Kammer, J.; Zhang, J.H.; Tang, J. Comparison evans blue injection routes: Intravenous versus intraperitoneal, for measurement of blood–brain barrier in a mice hemorrhage model. J. Neurosci. Methods 2011, 195, 206–210. [Google Scholar] [CrossRef] [Green Version]
  70. Singh, P.; Gupta, S.; Sharma, B. Melatonin receptor and KATP channel modulation in experimental vascular dementia. Physiol. Behav. 2015, 142, 66–78. [Google Scholar] [CrossRef]
  71. Kadry, H.; Noorani, B.; Cucullo, L. A Blood–brain barrier overview on structure, function, impairment, and biomarkers of integrity. Fluids Barriers CNS 2020, 17. [Google Scholar] [CrossRef]
  72. Profaci, C.P.; Munji, R.N.; Pulido, R.S.; Daneman, R. The blood–brain barrier in health and disease: Important unanswered questions. J. Exp. Med. 2020, 217. [Google Scholar] [CrossRef] [PubMed]
  73. Daneman, R.; Prat, A. The blood–brain barrier. Cold Spring Harb. Perspect. Biol. 2015, 7, a020412. [Google Scholar] [CrossRef] [Green Version]
  74. Keaney, J.; Campbell, M. The dynamic blood-brain barrier. FEBS J. 2015, 282, 4067–4079. [Google Scholar] [CrossRef] [PubMed]
  75. van de Haar, H.J.; Burgmans, S.; Hofman, P.A.M.; Verhey, F.R.J.; Jansen, J.F.A.; Backes, W.H. Blood–brain barrier impairment in dementia: Current and future in vivo assessments. Neurosci. Biobehav. Rev. 2015, 49, 71–81. [Google Scholar] [CrossRef] [PubMed]
  76. Blanchette, M.; Daneman, R. Formation and maintenance of the BBB. Mech. Dev. 2015, 138, 8–16. [Google Scholar] [CrossRef] [PubMed]
  77. Prakash, R.; Carmichael, S.T. Blood−brain barrier breakdown and neovascularization processes after stroke and traumatic brain injury. Curr. Opin. Neurol. 2015, 28, 556–564. [Google Scholar] [CrossRef] [Green Version]
  78. Beaumont, A.; Marmarou, A.; Hayasaki, K.; Barzo, P.; Fatouros, P.; Corwin, F.; Marmarou, C.; Dunbar, J. The permissive nature of blood brain barrier (BBB) opening in edema formation following traumatic brain injury. In Brain Edema XI; Springer: Berlin/Heidelberg, Germany, 2000; pp. 125–129. [Google Scholar]
  79. Banks, W.A.; Kovac, A.; Majerova, P.; Bullock, K.M.; Shi, M.; Zhang, J. Tau proteins cross the blood-brain barrier. J. Alzheimers Dis. 2017, 55, 411–419. [Google Scholar] [CrossRef]
  80. Pluta, R.; Czuczwar, S.J.; Januszewski, S.; Jabłoński, M. The many faces of post-ischemic tau protein in brain neurodegeneration of the Alzheimer’s disease type. Cells 2021, 10, 2213. [Google Scholar] [CrossRef]
  81. Fiorentino, M.; Sapone, A.; Senger, S.; Camhi, S.S.; Kadzielski, S.M.; Buie, T.M.; Kelly, D.L.; Cascella, N.; Fasano, A. Blood–brain barrier and intestinal epithelial barrier alterations in autism spectrum disorders. Mol. Autism 2016, 7. [Google Scholar] [CrossRef] [Green Version]
  82. Liu, Y.; Wang, L.; Du, N.; Yin, X.; Shao, H.; Yang, L. Ramelteon ameliorates LPS-induced hyperpermeability of the blood-brain barrier (BBB) by activating Nrf2. Inflammation 2021, 44, 1750–1761. [Google Scholar] [CrossRef]
  83. Jin, Z.; Liang, J.; Kolattukudy, P.E. Tetramethylpyrazine preserves the integrity of blood-brain barrier associated with upregulation of MCPIP1 in a murine model of focal ischemic stroke. Front. Pharmacol. 2021, 12. [Google Scholar] [CrossRef] [PubMed]
  84. Yang, J.; Yang, C.; Yang, Y.; Jia, N.; Sun, Q. Protection of vasoactive intestinal peptide on the blood-brain barrier dysfunction induced by focal cerebral ischemia in rats. J. Stroke Cerebrovasc. Dis. 2022, 31, 106160. [Google Scholar] [CrossRef] [PubMed]
  85. Yang, W.; Han, Y.-H.; Wang, H.-C.; Lu, C.-T.; Yu, X.-C.; Zhao, Y.-Z. Intradermal Injection of Icariin-HP-β-cyclodextrin improved traumatic brain injury via the trigeminal epineurium-brain dura pathway. J. Drug Target 2022, 30, 557–566. [Google Scholar] [CrossRef] [PubMed]
  86. Liu, L.; Zhang, X.; Wang, C.; Wu, X.; Long, B. Hypercholesterolemia aggravates sevoflurane induced cognitive impairment in aged rats by inducing neurological inflammation and apoptosis. J. Biochem. Mol. Toxicol. 2022, e23009. [Google Scholar] [CrossRef] [PubMed]
  87. Jia, X.; Xie, L.; Liu, Y.; Liu, T.; Yang, P.; Hu, J.; Peng, Z.; Luo, K.; Du, M.; Chen, C. Astragalus polysaccharide (APS) exerts protective effect against acute ischemic stroke (AIS) through enhancing M2 micoglia polarization by regulating adenosine triphosphate (ATP)/purinergic receptor (P2X7R) axis. Bioengineered 2022, 13, 4468–4480. [Google Scholar] [CrossRef]
  88. Zhang, Z.; Wang, L.; Li, F.; Qian, X.; Hong, Z.; Wu, L.; Jiang, Y.; Hu, H. Therapeutic effects of human umbilical cord mesenchymal stem cell on sepsis-associated encephalopathy in mice by regulating PI3K/AKT Pathway. J. Integr. Neurosci. 2022, 21, 38. [Google Scholar] [CrossRef]
  89. Wang, Z.; Du, X.; Yu, D.; Yang, Y.; Ma, G.; Jia, X.; Cheng, L. Sufentanil alleviates cerebral ischemia-reperfusion injury by inhibiting inflammation and protecting the blood-brain barrier in rats. Eur. J. Histochem. 2022, 66. [Google Scholar] [CrossRef]
  90. Young, A.M.H.; Campbell, E.; Lynch, S.; Suckling, J.; Powis, S.J. Aberrant NF-KappaB expression in autism spectrum condition: A mechanism for neuroinflammation. Front. Psychiatry 2011, 2, 27. [Google Scholar] [CrossRef] [Green Version]
  91. Kameno, Y.; Iwata, K.; Matsuzaki, H.; Miyachi, T.; Tsuchiya, K.J.; Matsumoto, K.; Iwata, Y.; Suzuki, K.; Nakamura, K.; Maekawa, M.; et al. Serum levels of soluble platelet endothelial cell adhesion molecule-1 and vascular cell adhesion molecule-1 are decreased in subjects with autism spectrum disorder. Mol. Autism 2013, 4, 19. [Google Scholar] [CrossRef] [Green Version]
  92. Onore, C.E.; Nordahl, C.W.; Young, G.S.; Van de Water, J.A.; Rogers, S.J.; Ashwood, P. Levels of soluble platelet endothelial cell adhesion molecule-1 and p-selectin are decreased in children with autism spectrum disorder. Biol. Psychiatry 2012, 72, 1020–1025. [Google Scholar] [CrossRef] [Green Version]
  93. Tsuchiya, K.J.; Hashimoto, K.; Iwata, Y.; Tsujii, M.; Sekine, Y.; Sugihara, G.; Matsuzaki, H.; Suda, S.; Kawai, M.; Nakamura, K.; et al. Decreased serum levels of platelet-endothelial adhesion molecule (PECAM-1) in subjects with high-functioning autism: A negative correlation with head circumference at birth. Biol. Psychiatry 2007, 62, 1056–1058. [Google Scholar] [CrossRef] [PubMed]
  94. Kumar, H.; Sharma, B. Minocycline ameliorates prenatal valproic acid induced autistic behaviour, biochemistry and blood brain barrier impairments in rats. Brain Res. 2016, 1630, 83–97. [Google Scholar] [CrossRef] [PubMed]
  95. Abbott, N.J.; Patabendige, A.A.K.; Dolman, D.E.M.; Yusof, S.R.; Begley, D.J. Structure and function of the blood–brain barrier. Neurobiol. Dis. 2010, 37, 13–25. [Google Scholar] [CrossRef] [PubMed]
  96. Hashimoto, Y.; Campbell, M. Tight junction modulation at the blood-brain barrier: Current and future perspectives. Biochim. Biophys. Acta Biomembr. 2020, 1862, 183298. [Google Scholar] [CrossRef]
  97. Nusrat, A.; Parkos, C.A.; Verkade, P.; Foley, C.S.; Liang, T.W.; Innis-Whitehouse, W.; Eastburn, K.K.; Madara, J.L. Tight junctions are membrane microdomains. J. Cell Sci. 2000, 113, 1771–1781. [Google Scholar] [CrossRef]
  98. Krafft, P.R.; Caner, B.; Klebe, D.; Rolland, W.B.; Tang, J.; Zhang, J.H. PHA-543613 preserves blood–brain barrier integrity after intracerebral hemorrhage in mice. Stroke 2013, 44, 1743–1747. [Google Scholar] [CrossRef] [Green Version]
  99. James, S.J.; Melnyk, S.; Jernigan, S.; Cleves, M.A.; Halsted, C.H.; Wong, D.H.; Cutler, P.; Bock, K.; Boris, M.; Bradstreet, J.J.; et al. Metabolic endophenotype and related genotypes are associated with oxidative stress in children with autism. Am. J. Med. Genet. B Neuropsychiatr. Genet. 2006, 141B, 947–956. [Google Scholar] [CrossRef] [Green Version]
  100. Bjørklund, G.; Meguid, N.A.; El-Bana, M.A.; Tinkov, A.A.; Saad, K.; Dadar, M.; Hemimi, M.; Skalny, A.V.; Hosnedlová, B.; Kizek, R.; et al. Oxidative stress in autism spectrum disorder. Mol. Neurobiol. 2020, 57, 2314–2332. [Google Scholar] [CrossRef]
  101. Ghezzo, A.; Visconti, P.; Abruzzo, P.M.; Bolotta, A.; Ferreri, C.; Gobbi, G.; Malisardi, G.; Manfredini, S.; Marini, M.; Nanetti, L.; et al. Oxidative stress and erythrocyte membrane alterations in children with autism: Correlation with clinical features. PLoS ONE 2013, 8, e66418. [Google Scholar] [CrossRef] [Green Version]
  102. Zoroglu, S.S.; Armutcu, F.; Ozen, S.; Gurel, A.; Sivasli, E.; Yetkin, O.; Meram, I. Increased oxidative stress and altered activities of erythrocyte free radical scavenging enzymes in autism. Eur. Arch. Psychiatry Clin. Neurosci. 2004, 254, 143–147. [Google Scholar] [CrossRef]
  103. Cadenas, E. Mitochondrial free radical production and cell signaling. Mol. Aspects Med. 2004, 25, 17–26. [Google Scholar] [CrossRef] [PubMed]
  104. James, S.J.; Cutler, P.; Melnyk, S.; Jernigan, S.; Janak, L.; Gaylor, D.W.; Neubrander, J.A. Metabolic biomarkers of increased oxidative stress and impaired methylation capacity in children with autism. Am. J. Clin. Nutr. 2004, 80, 1611–1617. [Google Scholar] [CrossRef] [PubMed] [Green Version]
  105. Morimoto, M.; Hashimoto, T.; Tsuda, Y.; Nakatsu, T.; Kitaoka, T.; Kyotani, S. Assessment of oxidative stress in autism spectrum disorder using reactive oxygen metabolites and biological antioxidant potential. PLoS ONE 2020, 15, e0233550. [Google Scholar] [CrossRef] [PubMed]
  106. Liu, X.; Lin, J.; Zhang, H.; Khan, N.U.; Zhang, J.; Tang, X.; Cao, X.; Shen, L. Oxidative Stress in Autism Spectrum Disorder-Current Progress of Mechanisms and Biomarkers. Front. Psychiatry 2022, 13, 813304. [Google Scholar] [CrossRef]
  107. Adams, J.B.; Baral, M.; Geis, E.; Mitchell, J.; Ingram, J.; Hensley, A.; Zappia, I.; Newmark, S.; Gehn, E.; Rubin, R.A.; et al. The severity of autism is associated with toxic metal body burden and red blood cell glutathione levels. J. Toxicol. 2009, 2009, 532640. [Google Scholar] [CrossRef] [Green Version]
  108. Ghanizadeh, A.; Akhondzadeh, S.; Hormozi, M.; Makarem, A.; Abotorabi-Zarchi, M.; Firoozabadi, A. Glutathione-related factors and oxidative stress in autism, a review. Curr. Med. Chem. 2012, 19, 4000–4005. [Google Scholar] [CrossRef]
  109. Lechner, M.; Lirk, P.; Rieder, J. Inducible nitric oxide synthase (INOS) in tumor biology: The two sides of the same coin. Semin. Cancer Biol. 2005, 15, 277–289. [Google Scholar] [CrossRef]
  110. Tsukahara, Y.; Morisaki, T.; Kojima, M.; Uchiyama, A.; Tanaka, M. INOS expression by activated neutrophils from patients with sepsis. ANZ J. Surg. 2001, 71, 15–20. [Google Scholar] [CrossRef]
  111. Danilov, A.I.; Andersson, M.; Bavand, N.; Wiklund, N.P.; Olsson, T.; Brundin, L. Nitric oxide metabolite determinations reveal continuous inflammation in multiple sclerosis. J. Neuroimmunol. 2003, 136, 112–118. [Google Scholar] [CrossRef]
  112. Smith, K.J.; Lassmann, H. The role of nitric oxide in multiple sclerosis. Lancet Neurol. 2002, 1, 232–241. [Google Scholar] [CrossRef]
  113. Amal, H.; Barak, B.; Bhat, V.; Gong, G.; Joughin, B.A.; Wang, X.; Wishnok, J.S.; Feng, G.; Tannenbaum, S.R. Shank3 mutation in a mouse model of autism leads to changes in the s-nitroso-proteome and affects key proteins involved in vesicle release and synaptic function. Mol. Psychiatry 2018, 25, 1835–1848. [Google Scholar] [CrossRef] [PubMed]
  114. Tostes, M.H.F.; Teixeira, H.; Gattaz, W.; Brandão, M.A.; Raposo, N.R. Altered neurotrophin, neuropeptide, cytokines and nitric oxide levels in autism. Pharmacopsychiatry 2012, 45, 241–243. [Google Scholar] [CrossRef] [PubMed]
  115. Mittal, R.; Kumar, A.; Ladda, R.; Mainali, G.; Aliu, E. Pitt hopkins-like syndrome 1 with novel CNTNAP2 mutation in siblings. Child Neurol Open. 2021, 8, 2329048X211055330. [Google Scholar] [CrossRef] [PubMed]
  116. Dilmore, A.H.; McDonald, D.; Nguyen, T.T.; Adams, J.B.; Krajmalnik-Brown, R.; Elijah, E.; Dorrestein, P.C.; Knight, R. The Fecal Microbiome and Metabolome of Pitt Hopkins Syndrome, a Severe Autism Spectrum Disorder. mSystems. 2021, 6, e0100621. [Google Scholar] [CrossRef] [PubMed]
  117. AlBaazi, S.; Shareef, H. Case report: Pitt-Hopkins like syndrome with CNTNAP2 mutation. Egypt. J. Med. Hum. Genet. 2020, 21, 70. [Google Scholar] [CrossRef]
  118. Canali, G.; Garcia, M.; Hivert, B.; Pinatel, D.; Goullancourt, A.; Oguievetskaia, K.; Saint-Martin, M.; Girault, J.-A.; Faivre-Sarrailh, C.; Goutebroze, L. Genetic Variants in Autism-Related CNTNAP2 Impair Axonal Growth of Cortical Neurons. Hum. Mol. Genet. 2018, 27, 1941–1954. [Google Scholar] [CrossRef] [PubMed] [Green Version]
Figure 1. FITC-Dextran Assay: Representative photomicrographs of brain sections showing extravasation of the FITC-dextran as evident by green fluorescence staining. Intense green staining was observable in brain sections from Cntnap2/ rats (DF) suggesting compromised BBB permeability compared to the littermate control WT group (AC). Blue color indicates DAPI staining for cell nuclei. Scale Bars: 20 µM.
Jcm 11 02725 g001
Figure 2. Quantification of FITC signal intensity: (A) Mean signal intensity for FITC staining was calculated using ImageJ software. (B) The FITC-dextran levels in brain homogenates were determined using fluorescent spectrophotometer. Data are expressed as mean values ± SD (N = 6 animals per group), * p < 0.01 or ** p < 0.001 Cntnap2/ compared to WT group.
Jcm 11 02725 g002
Figure 3. Evans blue assay: BBB integrity was determined using Evans blue assay. Quantification of Evans blue dye in brain homogenates revealed significantly high levels in Cntnap2/ rats compared to littermate control WT animals. Data are expressed as mean values ± SD (N = 6 animals per group). ** p < 0.01 Cntnap2/ compared to WT group.
Jcm 11 02725 g003
Figure 4. ZO-1 immunostaining: Representative photomicrographs of brain sections showing ZO-1 immunostaining. The brain sections from WT animals exhibited profound ZO-1 immunostaining with a pattern around the cell margins (AC). On the contrary, there were gaps and disruptions in ZO-1 immunostaining in brain sections from Cntnap2/ rats (DF) (indicated by yellow arrows). Scale Bars: 20 µM.
Jcm 11 02725 g004
Figure 5. Mean signal intensity for ZO-1 immunostaining: ImageJ software was used to determine mean signal intensity for ZO-1. ** p < 0.01 Cntnap2/ compared to WT group.
Jcm 11 02725 g005
Figure 6. Oxidative stress determination: The lipid peroxidation (A) and levels of glutathione (B) were determined in brain homogenates of WT and Cntnap2/ rats as markers of oxidative stress. Data are expressed as mean values ± SD (N = 6 animals per group). * p < 0.01 or ** p < 0.001 Cntnap2/ compared to WT group.
Jcm 11 02725 g006
Figure 7. iNOS immunostaining: Representative photomicrographs of brain sections showing iNOS immunostaining. The brain sections from WT rats showed undetectable levels of iNOS immunostaining (AC). On the other hand, intense iNOS immunostaining was evident in brain sections from Cntnap2/ rats (DF) (indicated by yellow arrows). Red color: iNOS immunostaining; Blue color: DAPI staining for cell nuclei. Scale Bars: 20 µM.
Jcm 11 02725 g007
Figure 8. Mean signal intensity for iNOS immunostaining: ImageJ software was used to determine mean signal intensity for iNOS. ** p < 0.001 Cntnap2/ compared to WT group.
Jcm 11 02725 g008
Figure 9. Nitric oxide (NO) determination: The levels of NO were determined in brain homogenates using Griess reagent. Data are expressed as mean values ± SD (N = 6 animals per group). ** p < 0.001 Cntnap2/ compared to WT group.
Jcm 11 02725 g009
Publisher’s Note: MDPI stays neutral with regard to jurisdictional claims in published maps and institutional affiliations.

