
Assessment of Renal Allograft Stiffness and Viscosity Using 2D SWE PLUS and Vi PLUS Measures—A Pilot Study

 , , , , , ,
Abstract
:1. Introduction
2. Materials and Methods
2.1. Study Population
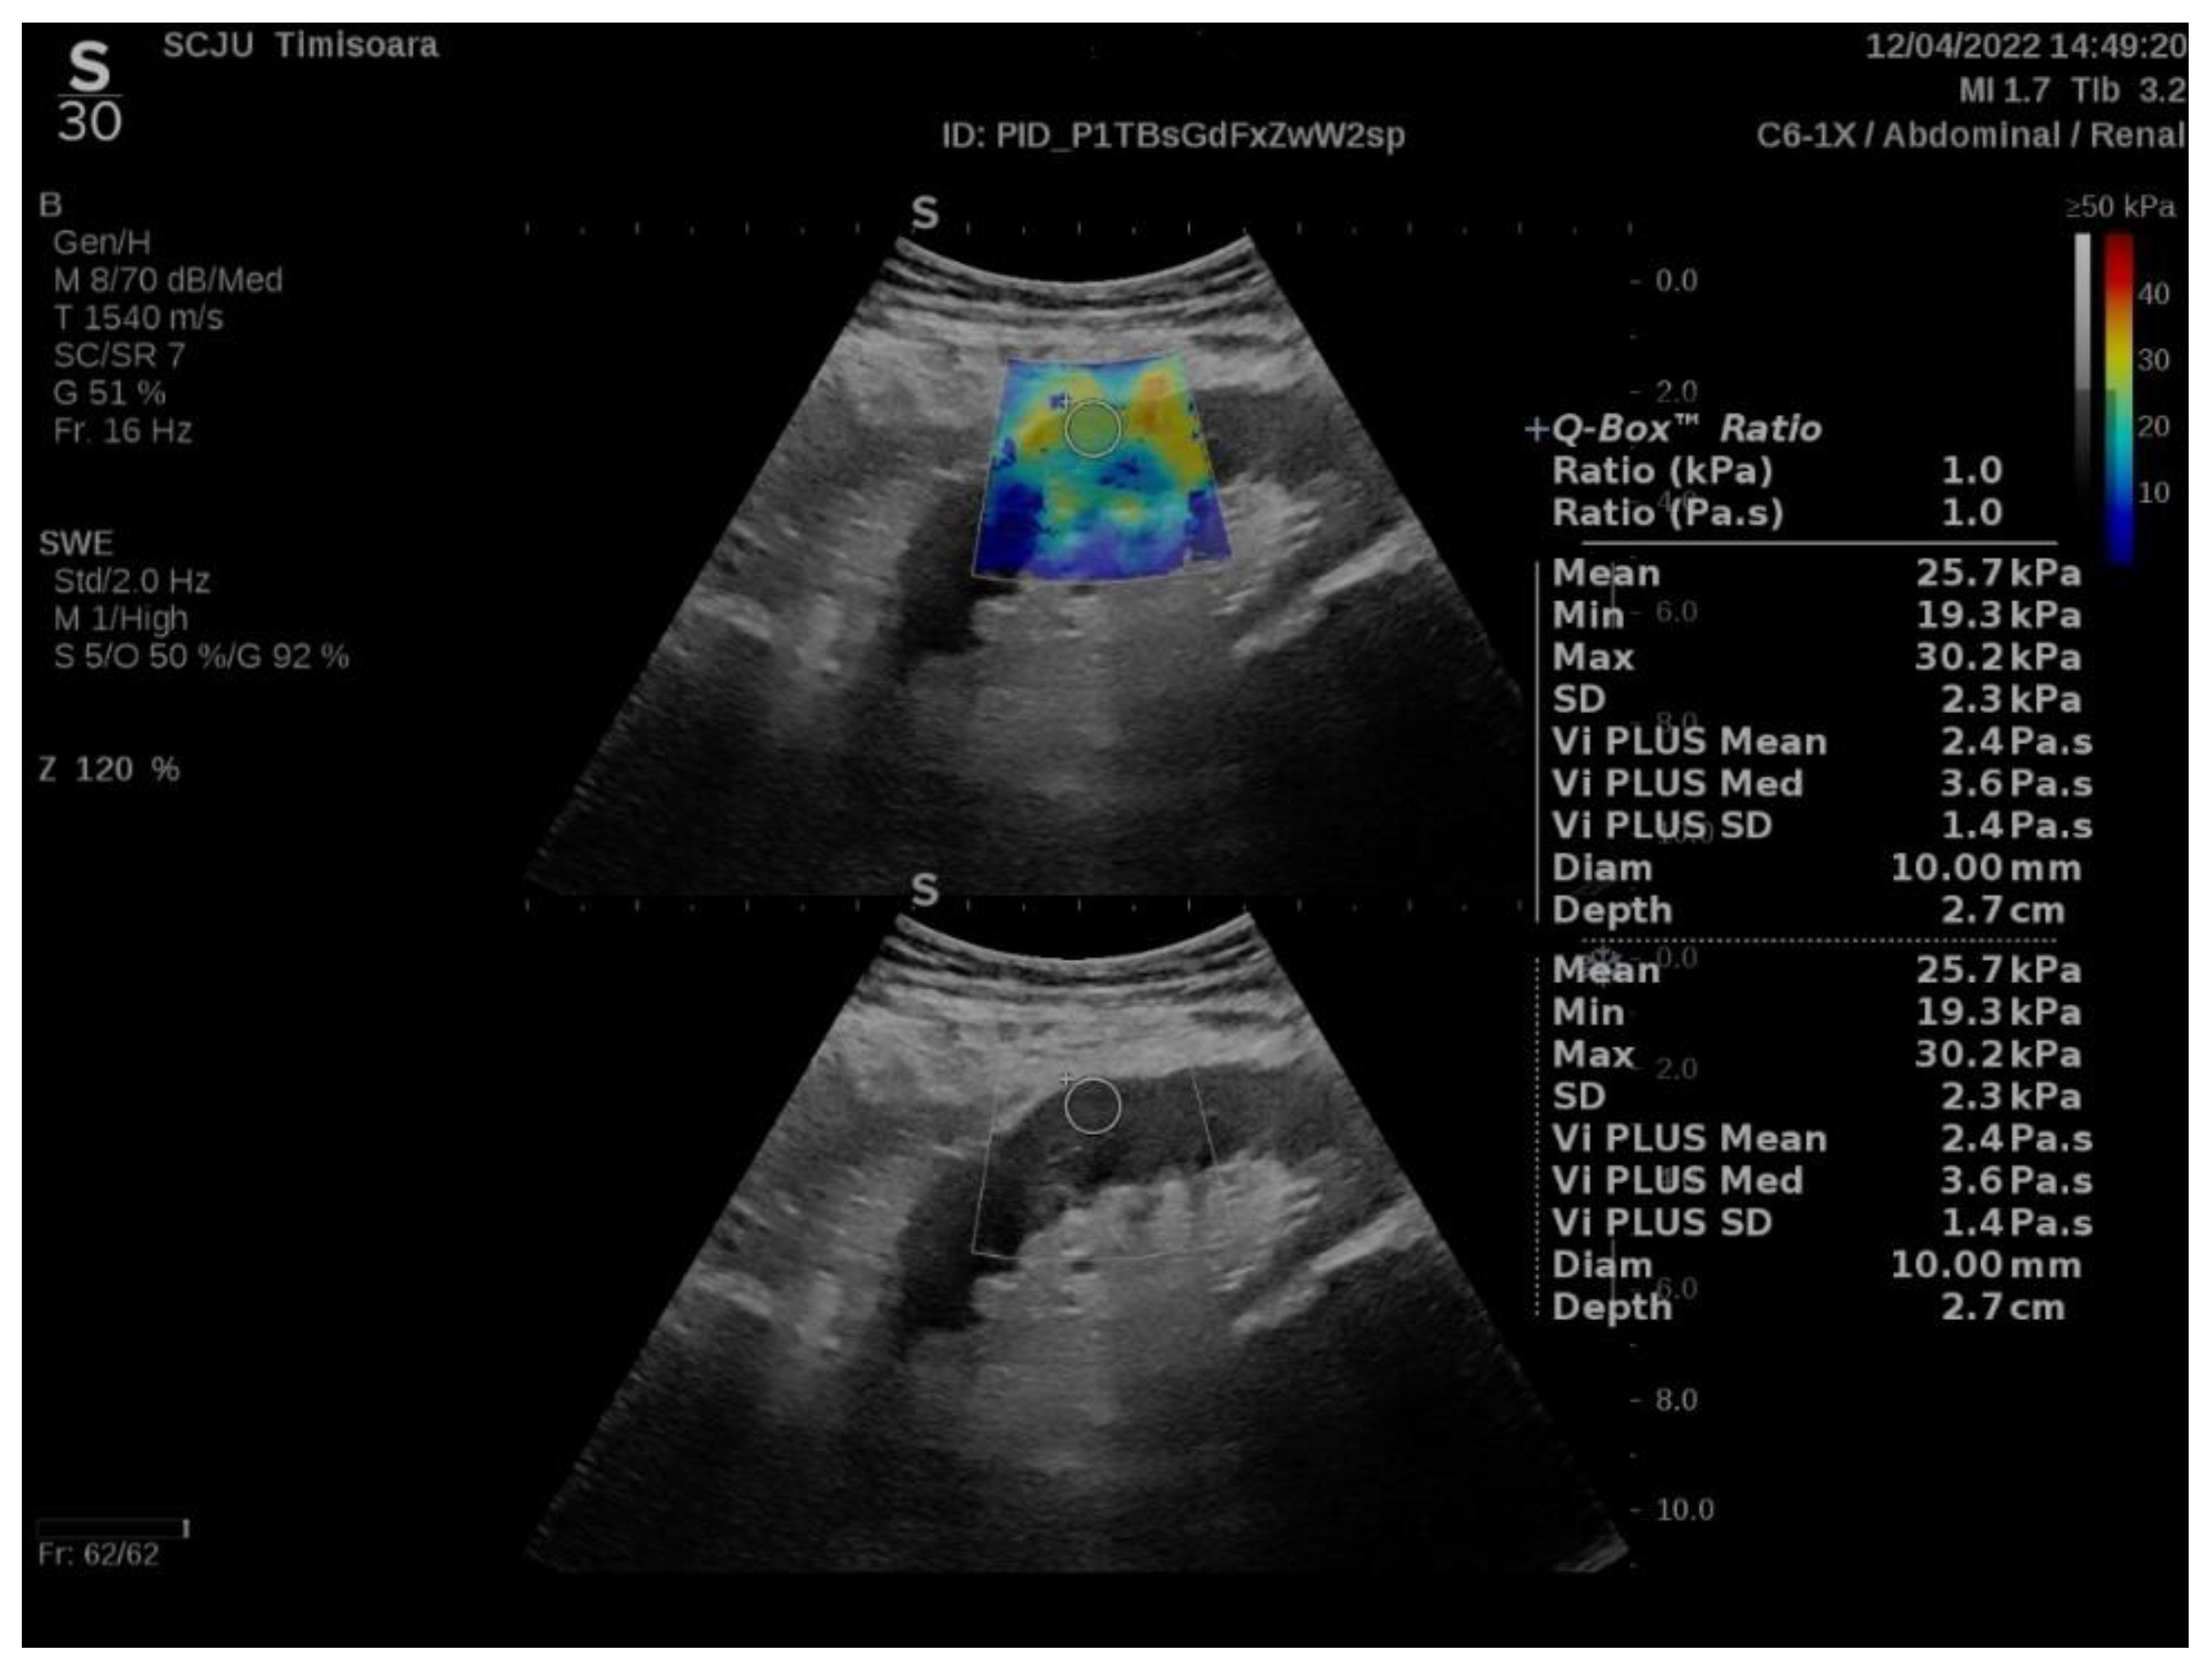
2.2. ShearWave PLUS Elastography
2.3. Statistical Analysis
3. Results
4. Discussion
5. Conclusions
Author Contributions
Funding
Institutional Review Board Statement
Informed Consent Statement
Data Availability Statement
Conflicts of Interest
References
- Langewisch, E.; Mannon, R.B. Chronic allograft injury. Clin. J. Am. Soc. Nephrol. 2021, 16, 1723–1729. [Google Scholar] [CrossRef]
- Hu, Q.; Zhang, W.-J.; Lin, Z.-Q.; Wang, X.-Y.; Zheng, H.-Y.; Wei, H.-M.; He, H.-G. Combined acoustic radiation force impulse and conventional ultrasound in the quantitative assessment of immunoglobulin a nephropathy. Ultrasound Med. Biol. 2019, 45, 2309–2316. [Google Scholar] [CrossRef]
- Săftoiu, A.; Gilja, O.H.; Sidhu, P.S.; Dietrich, C.F.; Cantisani, V.; Amy, D.; Bachmann-Nielsen, M.; Bob, F.; Bojunga, J.; Brock, M.; et al. The EFSUMB guidelines and recommendations for the clinical practice of elastography in non-hepatic applications: Update 2018. Ultraschall Med. 2019, 40, 425–453. [Google Scholar] [CrossRef] [PubMed] [Green Version]
- Stoian, D.; Borcan, F.; Petre, I.; Mozos, I.; Varcus, F.; Ivan, V.; Cioca, A.; Apostol, A.; Dehelean, C.A. Strain elastography as a valuable diagnosis tool in intermediate cytology (Bethesda III) thyroid nodules. Diagnostics 2019, 9, 119. [Google Scholar] [CrossRef] [Green Version]
- Bende, F.; Sporea, I.; Șirli, R.; Bâldea, V.; Lazăr, A.; Lupușoru, R.; Fofiu, R.; Popescu, A. Ultrasound-Guided Attenuation Parameter (UGAP) for the quantification of liver steatosis using the Controlled Attenuation Parameter (CAP) as the reference method. Med. Ultrason. 2021, 23, 7–14. [Google Scholar] [CrossRef] [PubMed]
- Arndt, R.; Schmidt, S.; Loddenkemper, C.; Grünbaum, M.; Zidek, W.; van der Giet, M.; Westhoff, T.H. Noninvasive evaluation of renal allograft fibrosis by transient elastography—A pilot study. Transpl. Int. 2010, 23, 871–877. [Google Scholar] [CrossRef]
- Lukenda, V.; Mikolasevic, I.; Racki, S.; Jelic, I.; Stimac, D.; Orlic, L. Transient elastography: A new noninvasive diagnostic tool for assessment of chronic allograft nephropathy. Int. Urol. Nephrol. 2014, 46, 1435–1440. [Google Scholar] [CrossRef]
- Nakao, T.; Ushigome, H.; Nakamura, T.; Harada, S.; Koshino, K.; Suzuki, T.; Ito, T.; Nobori, S.; Yoshimura, N. Evaluation of renal allograft fibrosis by transient elastography (Fibro Scan). Transplant. Proc. 2015, 47, 640–643. [Google Scholar] [CrossRef]
- Sommerer, C.; Scharf, M.; Seitz, C.; Millonig, G.; Seitz, H.K.; Zeier, M.; Mueller, S. Assessment of renal allograft fibrosis by transient elastography. Transpl. Int. 2013, 26, 545–551. [Google Scholar] [CrossRef]
- Stock, K.; Klein, B.; Cong, M.V.; Regenbogen, C.; Kemmner, S.; Büttner, M.; Wagenpfeil, S.; Matevossian, E.; Renders, L.; Heemann, U.; et al. ARFI-based tissue elasticity quantification and kidney graft dysfunction: First clinical experiences. Clin. Hemorheol. Microcirc. 2011, 49, 527–535. [Google Scholar] [CrossRef]
- Syversveen, T.; Brabrand, K.; Midtvedt, K.; Strøm, E.H.; Hartmann, A.; Jakobsen, J.A.; Berstad, A.E. Assessment of renal allograft fibrosis by acoustic radiation force impulse quantification—A pilot study. Transpl. Int. 2011, 24, 100–105. [Google Scholar] [CrossRef] [PubMed]
- Grenier, N.; Poulain, S.; Lepreux, S.; Gennisson, J.-L.; Dallaudière, B.; Lebras, Y.; Bavu, E.; Servais, A.; Meas-Yedid, V.; Piccoli, M.; et al. Quantitative elastography of renal transplants using supersonic shear imaging: A pilot study. Eur. Radiol. 2012, 22, 2138–2146. [Google Scholar] [CrossRef] [PubMed]
- Ferraioli, G.; Wong, V.W.-S.; Castera, L.; Berzigotti, A.; Sporea, I.; Dietrich, C.F.; Choi, B.I.; Wilson, S.R.; Kudo, M.; Barr, R.G. Liver ultrasound elastography: An update to the world federation for ultrasound in medicine and biology guidelines and recommendations. Ultrasound Med. Biol. 2018, 44, 2419–2440. [Google Scholar] [CrossRef] [Green Version]
- Hudson, J.M.; Milot, L.; Parry, C.; Williams, R.; Burns, P.N. Inter- and intra-operator reliability and repeatability of shear wave elastography in the liver: A study in healthy volunteers. Ultrasound Med. Biol. 2013, 39, 950–955. [Google Scholar] [CrossRef] [PubMed]
- Cassinotto, C.; Lapuyade, B.; Mouries, A.; Hiriart, J.-B.; Vergniol, J.; Gaye, D.; Castain, C.; Le Bail, B.; Chermak, F.; Foucher, J.; et al. Non-invasive assessment of liver fibrosis with impulse elastography: Comparison of Supersonic Shear Imaging with ARFI and FibroScan®. J. Hepatol. 2014, 61, 550–557. [Google Scholar] [CrossRef]
- Herrmann, E.; De Lédinghen, V.; Cassinotto, C.; Chu, W.C.W.; Leung, V.Y.-F.; Ferraioli, G.; Filice, C.; Castera, L.; Vilgrain, V.; Ronot, M.; et al. Assessment of biopsy-proven liver fibrosis by two-dimensional shear wave elastography: An individual patient data-based meta-analysis. Hepatology 2018, 67, 260–272. [Google Scholar] [CrossRef]
- Nowicki, A.; Dobruch-Sobczak, K. Wprowadzenie do ultradźwiękowej elastografii. J. Ultrason. 2016, 16, 113–124. [Google Scholar] [CrossRef]
- Bercoff, J.; Tanter, M.; Fink, M. Supersonic shear imaging: A new technique for soft tissue elasticity mapping. IEEE Trans. Ultrason. Ferroelectr. Freq. Control 2004, 51, 396–409. [Google Scholar] [CrossRef]
- Barr, R.G. Can accurate shear wave velocities be obtained in kidneys? J. Ultrasound Med. 2020, 39, 1097–1105. [Google Scholar] [CrossRef]
- Popa, A.; Bende, F.; Șirli, R.; Popescu, A.; Bâldea, V.; Lupușoru, R.; Cotrău, R.; Fofiu, R.; Foncea, C.; Sporea, I. Quantification of liver fibrosis, steatosis, and viscosity using multiparametric ultrasound in patients with non-alcoholic liver disease: A “real-life” cohort study. Diagnostics 2021, 11, 783. [Google Scholar] [CrossRef]
- Radulescu, D.; Peride, I.; Petcu, L.C.; Niculae, A.; Checherita, I.A. Supersonic shear wave ultrasonography for assessing tissue stiffness in native kidney. Ultrasound Med. Biol. 2018, 44, 2556–2568. [Google Scholar] [CrossRef] [Green Version]
- Samir, A.E.; Allegretti, A.S.; Zhu, Q.; Dhyani, M.; Anvari, A.; Sullivan, D.A.; Trottier, C.A.; Dougherty, S.; Williams, W.W.; Babitt, J.L.; et al. Shear wave elastography in chronic kidney disease: A pilot experience in native kidneys. BMC Nephrol. 2015, 16, 119. [Google Scholar] [CrossRef] [Green Version]
- Alan, B.; Göya, C.; Aktan, A.; Alan, S. Renal acoustic radiation force impulse elastography in the evaluation of coronary artery disease. Acta Radiol. 2017, 58, 156–163. [Google Scholar] [CrossRef]
- Guo, L.-H.; Xu, H.-X.; Fu, H.-J.; Peng, A.; Zhang, Y.-F.; Liu, L.-N. Acoustic radiation force impulse imaging for noninvasive evaluation of renal parenchyma elasticity: Preliminary findings. PLoS ONE 2013, 8, e68925. [Google Scholar] [CrossRef] [Green Version]
- Bob, F.; Bota, S.; Sporea, I.; Sirli, R.; Petrica, L.; Schiller, A. Kidney shear wave speed values in subjects with and without renal pathology and inter-operator reproducibility of acoustic radiation force impulse elastography (ARFI)—Preliminary results. PLoS ONE 2014, 9, e113761. [Google Scholar] [CrossRef] [Green Version]
- Takata, T.; Koda, M.; Sugihara, T.; Sugihara, S.; Okamoto, T.; Miyoshi, K.; Matono, T.; Hosho, K.; Mae, Y.; Iyama, T.; et al. Renal shear wave velocity by acoustic radiation force impulse did not reflect advanced renal impairment. Nephrology 2016, 21, 1056–1062. [Google Scholar] [CrossRef]
- Wang, L. New insights on the role of anisotropy in renal ultrasonic elastography: From trash to treasure. Med. Hypothes. 2020, 143, 110146. [Google Scholar] [CrossRef] [PubMed]
- Hwang, J.; Kim, H.W.; Kim, P.H.; Suh, C.H.; Yoon, H.M. Technical performance of acoustic radiation force impulse imaging for measuring renal parenchymal stiffness: A systematic review and meta-analysis. J. Ultrasound Med. 2021, 40, 2639–2653. [Google Scholar] [CrossRef] [PubMed]
- Yu, N.; Zhang, Y.; Xu, Y. Value of virtual touch tissue quantification in stages of diabetic kidney disease. J. Ultrasound Med. 2014, 33, 787–792. [Google Scholar] [CrossRef] [PubMed]
- Bob, F.; Bota, S.; Sporea, I.; Sirli, R.; Popescu, A.; Schiller, A. Relationship between the estimated glomerular filtration rate and kidney shear wave speed values assessed by acoustic radiation force impulse elastography: A pilot study. J. Ultrasound Med. 2015, 34, 649–654. [Google Scholar] [CrossRef] [PubMed]
- Bota, S.; Herkner, H.; Sporea, I.; Salzl, P.; Sirli, R.; Neghina, A.M.; Peck-Radosavljevic, M. Meta-analysis: ARFI elastography versus transient elastography for the evaluation of liver fibrosis. Liver Int. 2013, 33, 1138–1147. [Google Scholar] [CrossRef] [PubMed]
- Maralescu, F.-M.; Chiodan, M.; Sircuta, A.; Schiller, A.; Petrica, L.; Bob, F. Are the currently available elastography methods useful in the assessment of chronic kidney disease? A systematic review and a meta-analysis. Appl. Sci. 2022, 12, 2359. [Google Scholar] [CrossRef]
- Bob, F.; Grosu, I.; Sporea, I.; Timar, R.; Lighezan, D.; Popescu, A.; Sirli, R.; Buzas, R.; Petrica, L.; Munteanu, M.; et al. Is kidney stiffness measured using elastography influenced mainly by vascular factors in patients with diabetic kidney disease? Ultrason. Imaging 2018, 40, 300–309. [Google Scholar] [CrossRef] [PubMed]
- Czaja, A.J. Hepatic inflammation and progressive liver fibrosis in chronic liver disease. World J. Gastroenterol. 2014, 20, 2515–2532. [Google Scholar] [CrossRef] [PubMed]
- Sugimoto, K.; Moriyasu, F.; Oshiro, H.; Takeuchi, H.; Yoshimasu, Y.; Kasai, Y.; Furuichi, Y.; Itoi, T. Viscoelasticity measurement in rat livers using shear-wave US elastography. Ultrasound Med. Biol. 2018, 44, 2018–2024. [Google Scholar] [CrossRef] [PubMed]
- Deffieux, T.; Gennisson, J.-L.; Bousquet, L.; Corouge, M.; Cosconea, S.; Amroun, D.; Tripon, S.; Terris, B.; Mallet, V.; Sogni, P.; et al. Investigating liver stiffness and viscosity for fibrosis, steatosis and activity staging using shear wave elastography. J. Hepatol. 2015, 62, 317–324. [Google Scholar] [CrossRef] [PubMed]
- Schwarz, A.; Gwinner, W.; Hiss, M.; Radermacher, J.; Mengel, M.; Haller, H. Safety and adequacy of renal transplant protocol biopsies. Am. J. Transplant. 2005, 5, 1992–1996. [Google Scholar] [CrossRef] [PubMed]


| CKD Stage | Number of Subjects | Mean2D SWE PLUS Measures ± Standard Deviation |
|---|---|---|
| 2T | 18 | 30.18 ± 6.21 kPa |
| 3aT | 9 | 26.73 ± 5.64 kPa |
| 3bT | 13 | 24.03 ± 4.83 kPa |
| 4T | 7 | 17.95 ± 4.3 kPa |
| Gender | 34 Men (68%) 16 Women (32%) | Correlation Coefficient with 2D SWE PLUS r | Significance Level p |
|---|---|---|---|
| Height (meters) | 1.70 ± 0.08 | 0.2679 | p = 0.0599 |
| Weight (kilograms) | 81.3 ± 18.2 | −0.01267 | p = 0.9304 |
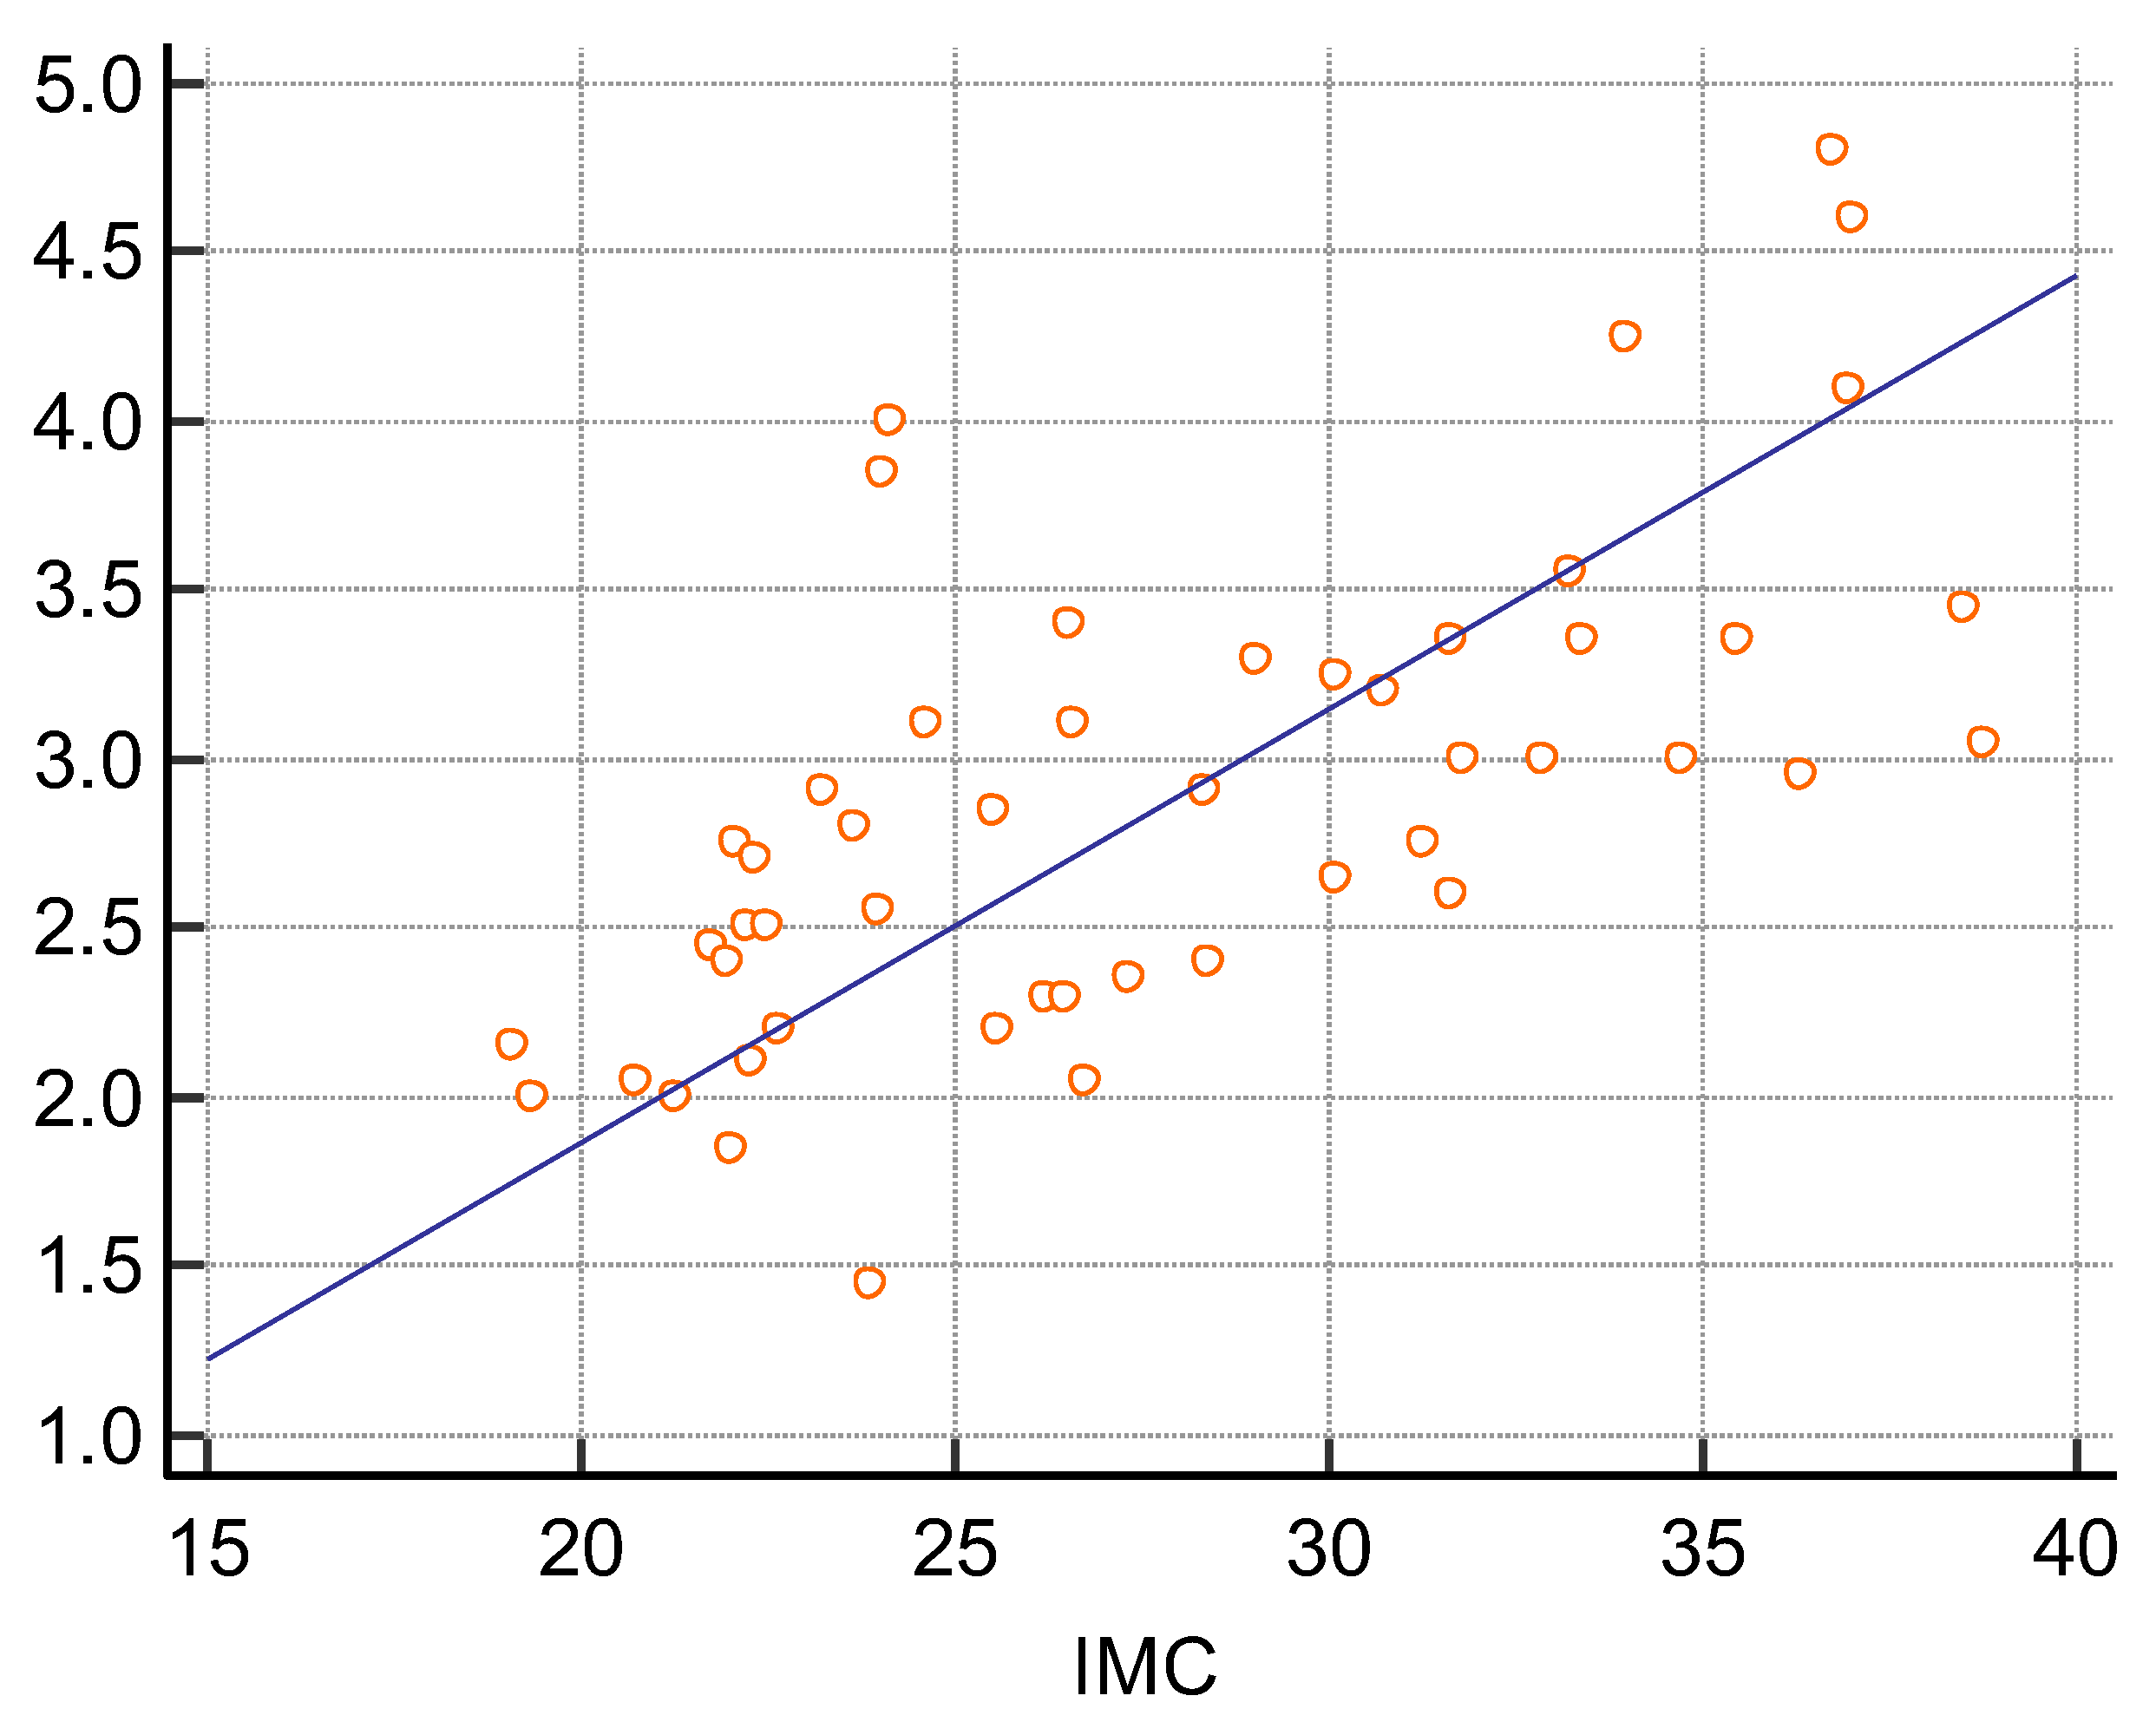
| BMI | 27.8 ± 5.5 | −0.1738 | p = 0.2274 |
| Time from transplant (years) | 10.5 ± 5 | 0.09945 | p = 0.4920 |
| Attained from a living related/deceased donor | 20 living related 30 deceased donor | - | - |
| Kidney length (millimeters) | 116.04 ± 14.3 | 0.1659 | p = 0.2496 |
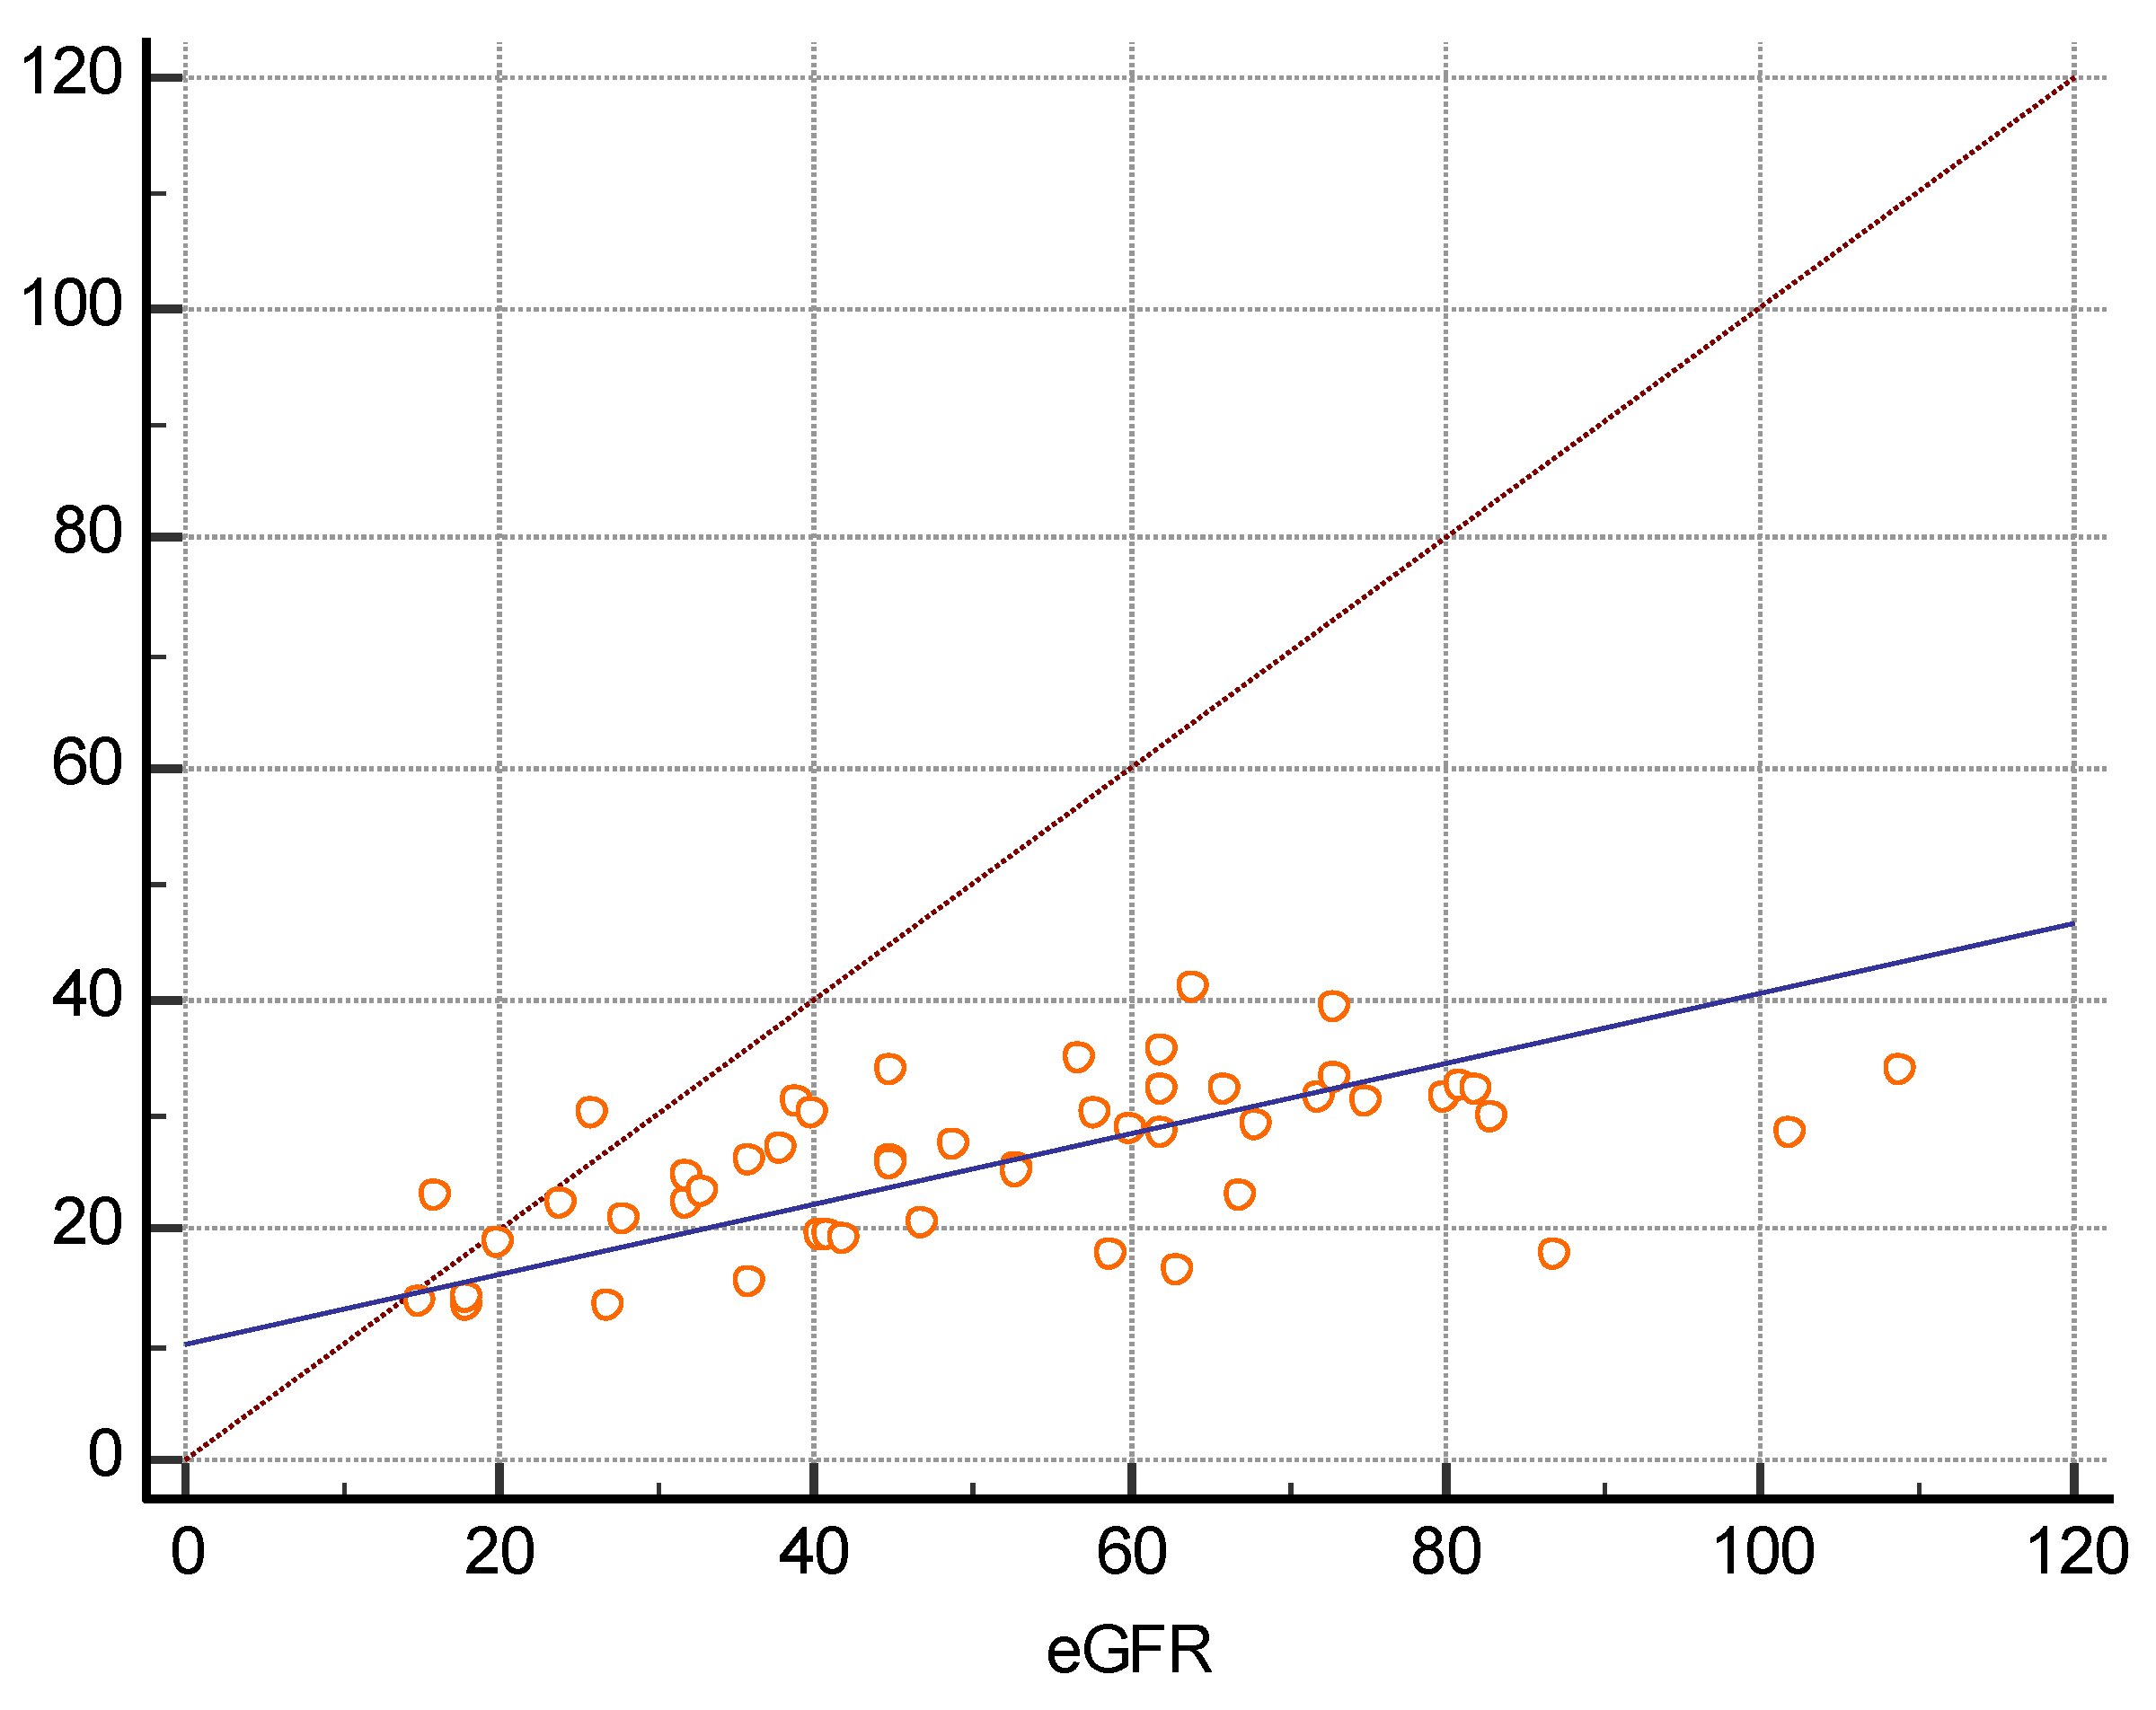
| eGFR (mL/min/1.73m2) | 52 ± 22.6 | 0.5699 | p < 0.0001 |
| Hemoglobin (g/dL) | 13.3 ± 1.5 | 0.2487 | p = 0.0816 |
| Hematocrit (%) | 41.2 ± 5 | 0.1078 | p = 0.4563 |
| Urea (mg/dL) | 50 ± 20.9 | −0.3766 | p = 0.0070 |
| Uric Acid (mg/dL) | 6.94 ± 1.5 | 0.1078 | p = 0.4563 |
| Cholesterol (mg/dL) | 202.8 ± 61 | −0.1028 | p = 0.5821 |
| Triglycerides (mg/dL) | 177.8 ± 80.4 | −0.05210 | p = 0.7845 |
| ALT (U/L) | 23.3 ± 15.4 | 0.3041 | p = 0.0963 |
| AST (U/L) | 23.9 ± 12.8 | 0.1794 | p = 0.3343 |
| Total Bilirubin (mg/dL) | 0.66 ± 0.2 | −0.04079 | p = 0.8534 |
| Sodium (mg/dL) | 135.97 ± 20.9 | 0.01393 | p = 0.9348 |
| Potassium (mg/dL) | 4.37 ± 0.5 | −0.2071 | p = 0.2187 |
| C reactive protein | 14.9 ± 35.2 | −0.2390 | p = 0.1375 |
| History of- hypertension -diabetes -previous glomerular disease | 37 8 19 |
Publisher’s Note: MDPI stays neutral with regard to jurisdictional claims in published maps and institutional affiliations. |
© 2022 by the authors. Licensee MDPI, Basel, Switzerland. This article is an open access article distributed under the terms and conditions of the Creative Commons Attribution (CC BY) license (https://creativecommons.org/licenses/by/4.0/).
Share and Cite
Maralescu, F.-M.; Bende, F.; Sporea, I.; Popescu, A.; Șirli, R.; Schiller, A.; Petrica, L.; Moga, T.V.; Mare, R.; Grosu, I.; et al. Assessment of Renal Allograft Stiffness and Viscosity Using 2D SWE PLUS and Vi PLUS Measures—A Pilot Study. J. Clin. Med. 2022, 11, 4370. https://doi.org/10.3390/jcm11154370
Maralescu F-M, Bende F, Sporea I, Popescu A, Șirli R, Schiller A, Petrica L, Moga TV, Mare R, Grosu I, et al. Assessment of Renal Allograft Stiffness and Viscosity Using 2D SWE PLUS and Vi PLUS Measures—A Pilot Study. Journal of Clinical Medicine. 2022; 11(15):4370. https://doi.org/10.3390/jcm11154370
Chicago/Turabian StyleMaralescu, Felix-Mihai, Felix Bende, Ioan Sporea, Alina Popescu, Roxana Șirli, Adalbert Schiller, Ligia Petrica, Tudor Voicu Moga, Ruxandra Mare, Iulia Grosu, and et al. 2022. "Assessment of Renal Allograft Stiffness and Viscosity Using 2D SWE PLUS and Vi PLUS Measures—A Pilot Study" Journal of Clinical Medicine 11, no. 15: 4370. https://doi.org/10.3390/jcm11154370