
Children in Tokyo Have a Long Sustained Axial Length from Age 3 Years: The Tokyo Myopia Study

 ,
,  , ,
, ,  , and
, and
Abstract
:1. Introduction
2. Materials and Methods
3. Results
4. Discussion
5. Conclusions
Supplementary Materials
Author Contributions
Funding
Institutional Review Board Statement
Informed Consent Statement
Data Availability Statement
Acknowledgments
Conflicts of Interest
References
- Holden, B.A.; Fricke, T.R.; Wilson, D.A.; Jong, M.; Naidoo, K.S.; Sankaridurg, P.; Wong, T.Y.; Naduvilath, T.; Resnikoff, S. Global prevalence of myopia and high myopia and temporal trends from 2000 through 2050. Ophthalmology 2016, 123, 1036–1042. [Google Scholar] [CrossRef] [PubMed] [Green Version]
- Rudnicka, A.R.; Kapetanakis, V.V.; Wathern, A.K.; Logan, N.S.; Gilmartin, B.; Whincup, P.H.; Cook, D.G.; Owen, C.G. Global variations and time trends in the prevalence of childhood myopia, a systematic review and quantitative meta-analysis: Implications for aetiology and early prevention. Br. J. Ophthalmol. 2016, 100, 882–890. [Google Scholar] [CrossRef] [Green Version]
- Yotsukura, E.; Torii, H.; Inokuchi, M.; Tokumura, M.; Uchino, M.; Nakamura, K.; Hyodo, M.; Mori, K.; Jiang, X.; Ikeda, S.-I.; et al. Current prevalence of myopia and association of myopia with environmental factors among schoolchildren in Japan. JAMA Ophthalmol. 2019, 137, 1233–1239. [Google Scholar] [CrossRef] [PubMed]
- Baird, P.N.; Saw, S.M.; Lanca, C.; Guggenheim, J.A.; Smith, E.L., III; Zhou, X.; Matsui, k.-O.; Wu, P.-C.; Sankaridurg, P.; Chia, A.; et al. Myopia. Nat. Rev. Dis. Prim. 2020, 6, 99. [Google Scholar] [CrossRef]
- Morgan, I.G.; Ohno-Matsui, K.; Saw, S.-M. Myopia. Lancet 2012, 379, 1739–1748. [Google Scholar] [CrossRef]
- Weale, R.A. Epidemiology of refractive errors and presbyopia. Surv. Ophthalmol. 2003, 48, 515–543. [Google Scholar] [CrossRef]
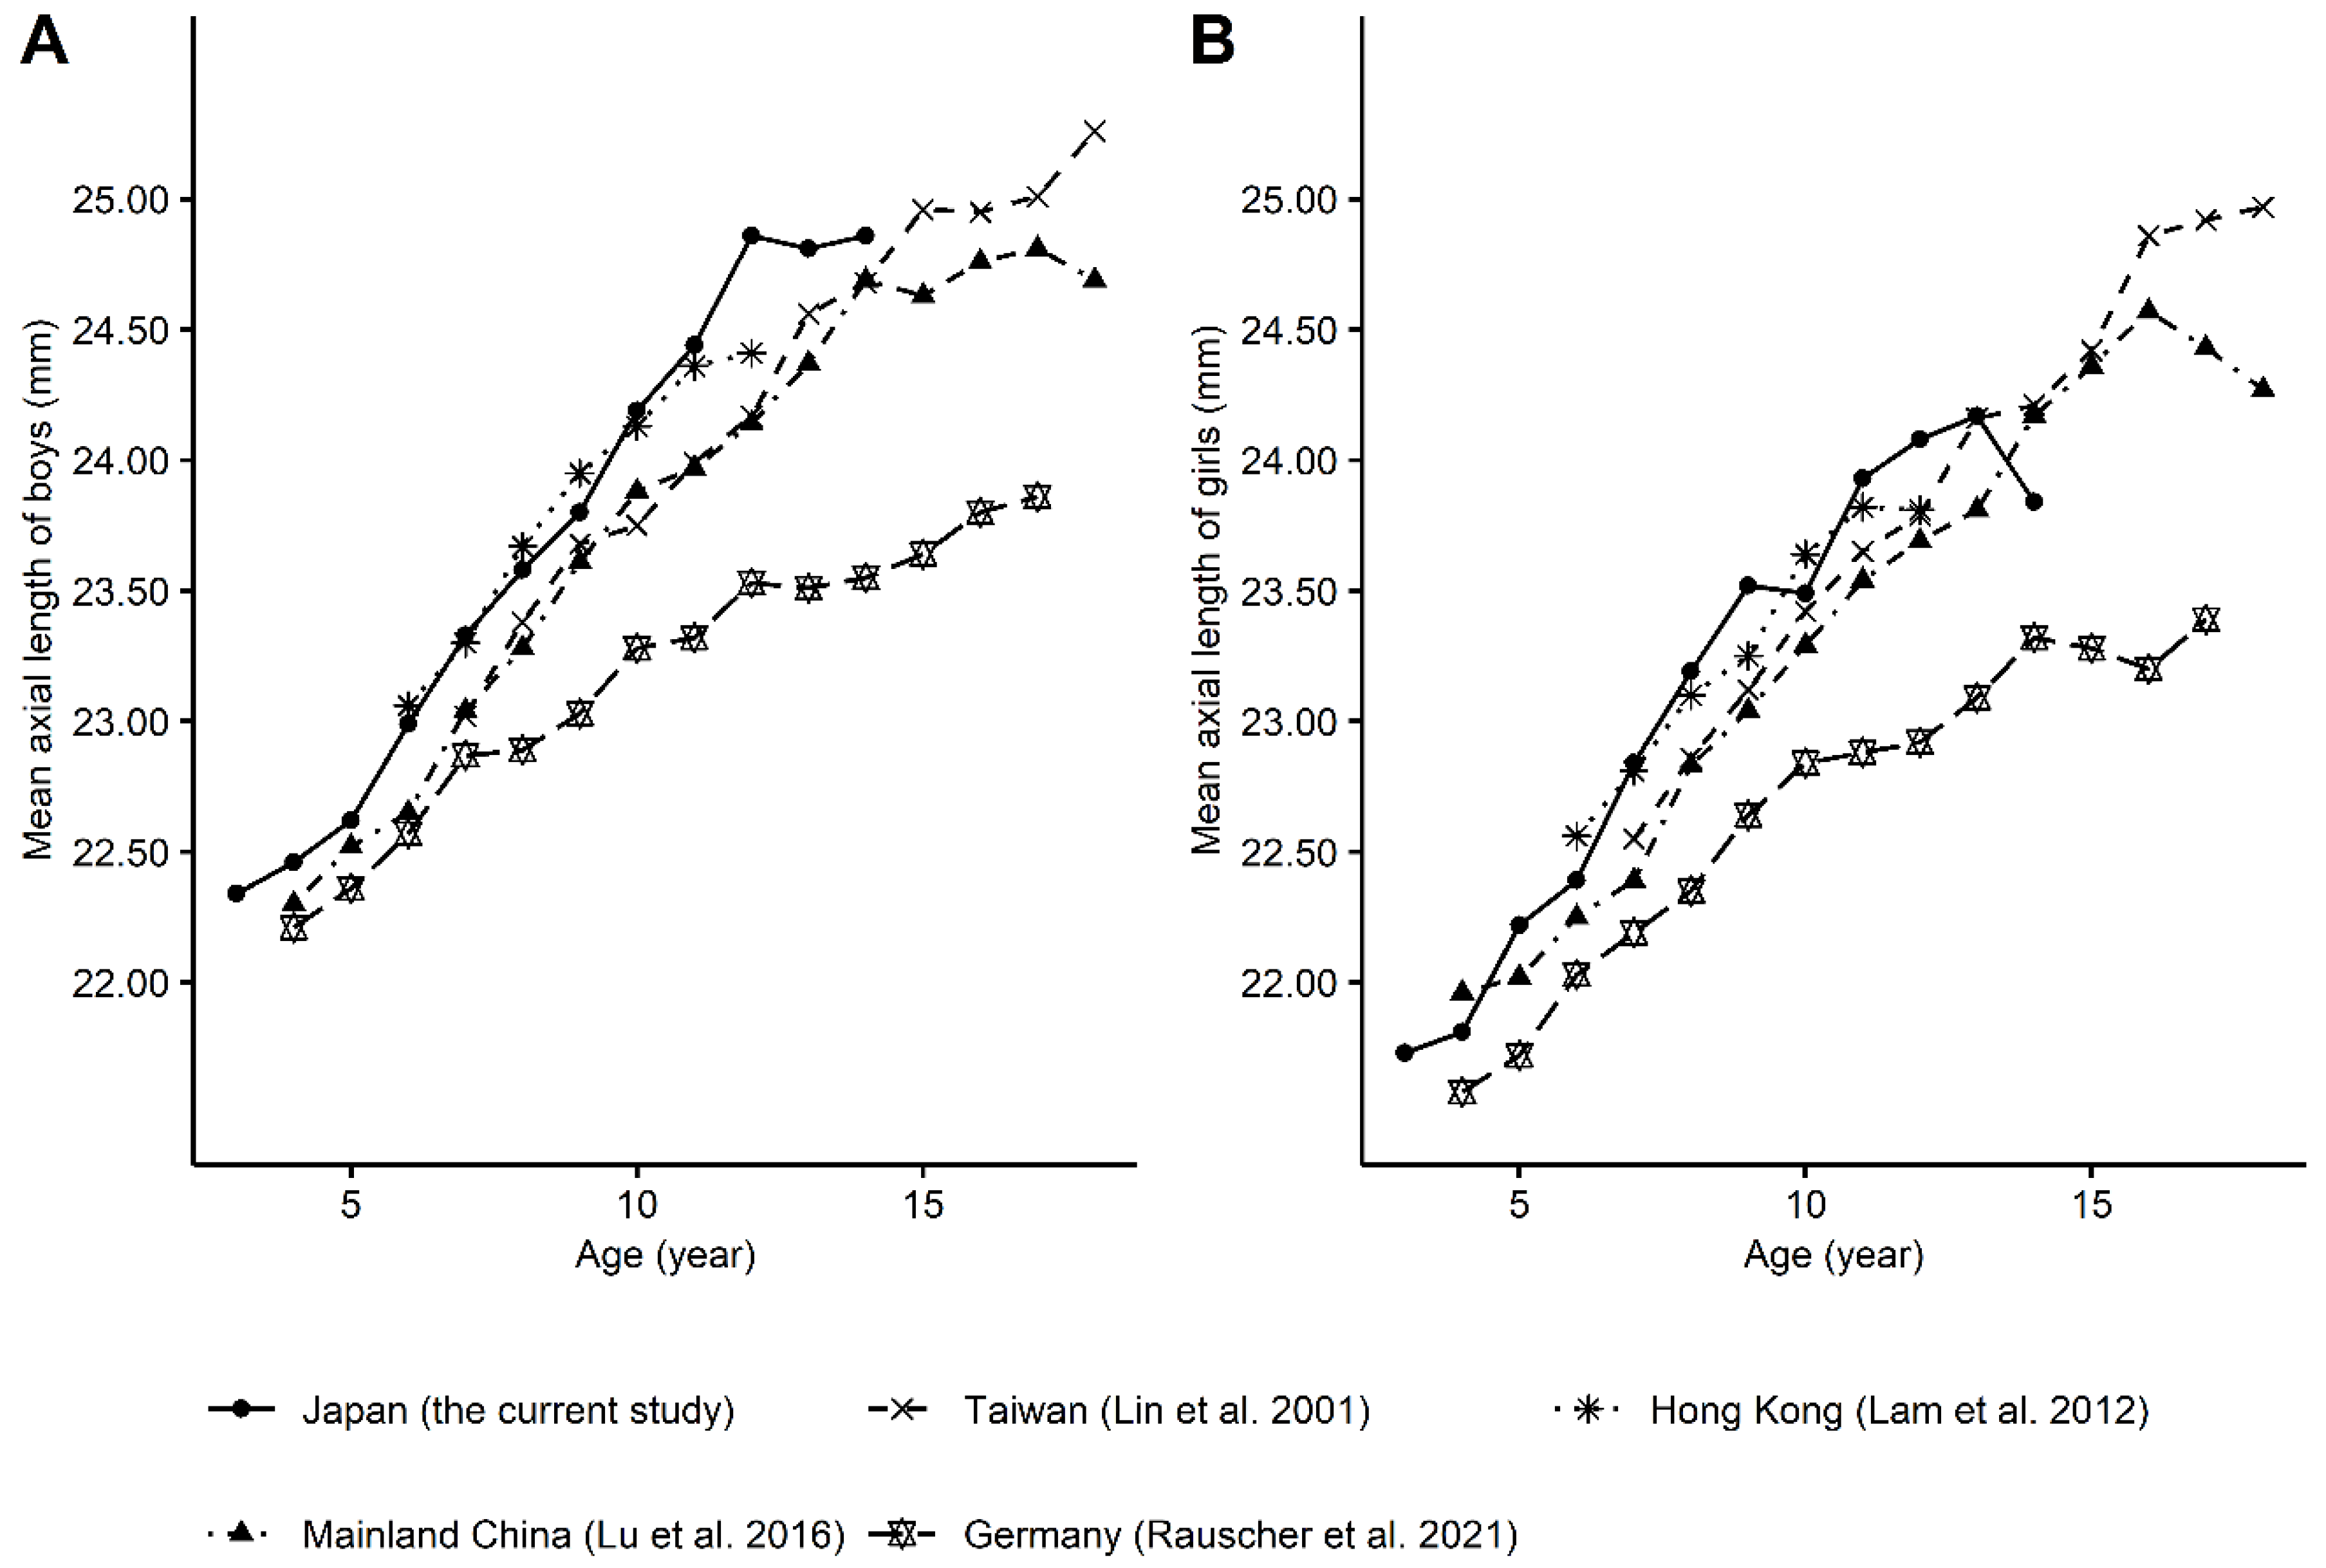
- Lin, L.L.; Shih, Y.F.; Hsiao, C.K.; Chen, C.J.; Lee, L.A.; Hung, P.T. Epidemiologic study of the prevalence and severity of myopia among schoolchildren in Taiwan in 2000. J. Formos. Med. Assoc. 2001, 100, 684–691. [Google Scholar]
- Lam, C.S.Y.; Lam, C.H.; Cheng, S.C.K.; Chan, L.Y.L. Prevalence of myopia among Hong Kong Chinese schoolchildren: Changes over two decades. Ophthalmic Physiol. Opt. 2012, 32, 17–24. [Google Scholar] [CrossRef] [PubMed]
- Lu, T.L.; Wu, J.F.; Ye, X.; Hu, Y.Y.; Wu, H.; Sun, W.; Guo, D.D.; Wang, X.R.; Bi, H.S.; Jonas, J.B. Axial length and associated factors in children: The Shandong Children Eye Study. Ophthalmologica 2016, 235, 78–86. [Google Scholar] [CrossRef]
- Rauscher, F.G.; Francke, M.; Hiemisch, A.; Kiess, W.; Michael, R. Ocular biometry in children and adolescents from 4 to 17 years: A cross-sectional study in central Germany. Ophthalmic Physiol. Opt. 2021, 41, 496–511. [Google Scholar] [CrossRef]
- Xiong, S.; Sankaridurg, P.; Naduvilath, T.; Zang, J.; Zou, H.; Zhu, J.; Lv, M.; He, X.; Xu, X. Time spent in outdoor activities in relation to myopia prevention and control: A meta-analysis and systematic review. Acta Ophthalmol. 2017, 95, 551–566. [Google Scholar] [CrossRef] [PubMed] [Green Version]
- Wong, C.W.; Tsai, A.; Jonas, J.B.; Ohno-Matsui, K.; Chen, J.; Ang, M.; Ting, D.S.W. Digital screen time during the COVID-19 pandemic: Risk for a further myopia boom? Am. J. Ophthalmol. 2021, 223, 333–337. [Google Scholar] [CrossRef] [PubMed]
- Huang, H.-M.; Chang, D.S.-T.; Wu, P.-C. The association between near work activities and myopia in children—A systematic review and meta-analysis. PLoS ONE 2015, 10, e0140419. [Google Scholar] [CrossRef] [PubMed] [Green Version]
- Xie, Z.; Long, Y.; Wang, J.; Li, Q.; Zhang, Q. Prevalence of myopia and associated risk factors among primary students in Chongqing: Multilevel modeling. BMC Ophthalmol. 2020, 20, 146. [Google Scholar] [CrossRef] [Green Version]
- You, Q.S.; Wu, L.J.; Duan, J.L.; Luo, Y.X.; Liu, L.J.; Li, X.; Gao, Q.; Wang, W.; Xu, L.; Jonas, J.B.; et al. Factors associated with myopia in school children in China: The Beijing Childhood Eye Study. PLoS ONE 2012, 7, e52668. [Google Scholar]
- Wong, L.; Coggon, D.; Cruddas, M.; Hwang, C.H. Education, reading, and familial tendency as risk factors for myopia in Hong Kong fishermen. J. Epidemiol. Community Health 1993, 47, 50–53. [Google Scholar] [CrossRef] [Green Version]
- Zadnik, K.; Mutti, D.O.; Fusaro, R.E.; Adams, A.J. Longitudinal evidence of crystalline lens thinning in children. Investig. Ophthalmol. Vis. Sci. 1995, 36, 1581–1587. [Google Scholar]
- Mutti, D.O.; Zadnik, K.; Fusaro, R.E.; Friedman, N.E.; Sholtz, R.I.; Adams, A.J. Optical and structural development of the crystalline lens in childhood. Investig. Ophthalmol. Vis. Sci. 1998, 39, 120–133. [Google Scholar]
- Smith, E.L., 3rd; Hung, L.F.; Huang, J. Relative peripheral hyperopic defocus alters central refractive development in infant monkeys. Vis. Res. 2009, 49, 2386–2392. [Google Scholar] [CrossRef] [Green Version]
- Rucker, F.J. The role of luminance and chromatic cues in emmetropisation. Ophthalmic Physiol. Opt. 2013, 33, 196–214. [Google Scholar] [CrossRef] [PubMed]
- Niu, Z.; Li, J.; Zhong, H.; Yuan, Z.; Zhou, H.; Zhang, Y.; Yuan, Y.; Chen, Q.; Pan, C.-W. Large variations in ocular dimensions in a multiethnic population with similar genetic background. Sci. Rep. 2016, 6, 22931. [Google Scholar] [CrossRef] [Green Version]
- Saw, S.-M.; Carkeet, A.; Chia, K.-S.; Stone, R.A.; Tan, D.T. Component dependent risk factors for ocular parameters in Singapore Chinese children. Ophthalmology 2002, 109, 2065–2071. [Google Scholar] [CrossRef]
- Liu, S.; Ye, S.; Xi, W.; Zhang, X. Electronic devices and myopic refraction among children aged 6–14 years in urban areas of Tianjin, China. Ophthalmic Physiol. Opt. 2019, 39, 282–293. [Google Scholar] [CrossRef] [PubMed]
- Flitcroft, D.I.; He, M.; Jonas, J.B.; Jong, M.; Naidoo, K.; Ohno-Matsui, K.; Jugnoo, R.; Resnikoff, S.; Vitale, S.; Yannuzzi, L. IMI—defining and classifying myopia: A proposed set of standards for clinical and epidemiologic studies. Investig. Ophthalmol. Vis. Sci. 2019, 60, M20–M30. [Google Scholar] [CrossRef] [PubMed] [Green Version]
- Twelker, J.D.; Mitchell, G.L.; Messer, D.H.; Bhakta, R.; Jones, L.A.; Mutti, D.O.; Cotter, S.A.; Kleinstein, R.N.; Manny, R.E.; Zadnik, K.; et al. Children’s ocular components and age, gender, and ethnicity. Optom. Vis. Sci. 2009, 86, 918–935. [Google Scholar] [CrossRef] [Green Version]
- Gordon, R.A.; Donzis, P.B. Refractive development of the human eye. Arch. Ophthalmol. 1985, 103, 785–789. [Google Scholar] [CrossRef] [PubMed]
- Goss, D.A.; Cox, V.D.; Herrin-Lawson, G.A.; Nielsen, E.D.; Dolton, W.A. Refractive error, axial length, and height as a function of age in young myopes. Optom. Vis. Sci. 1990, 67, 332–338. [Google Scholar] [CrossRef] [PubMed]
- Fledelius, H.C.; Christensen, A.S.; Fledelius, C. Juvenile eye growth, when completed? An evaluation based on IOL-Master axial length data, cross-sectional and longitudinal. Acta Ophthalmol. 2014, 92, 259–264. [Google Scholar] [CrossRef]
- 2016 Population By-Census. 2018. Available online: https://www.censtatd.gov.hk/en/scode459.html (accessed on 3 August 2021).
- Wang, J.; Li, M.; Zhu, D.; Cao, Y. Smartphone Overuse and Visual Impairment in Children and Young Adults: Systematic Review and Meta-Analysis. J. Med. Internet Res. 2020, 22, e21923. [Google Scholar] [CrossRef] [PubMed]
- Lanca, C.; Saw, S.M. The association between digital screen time and myopia: A systematic review. Ophthalmic Physiol. Opt. 2020, 40, 216–229. [Google Scholar] [CrossRef] [Green Version]


| Preschool (Ages 3 to 6 Years) | Elementary School (Ages 6 to 11 Years) | Junior High School (Ages 12 to 14 Years) | |
|---|---|---|---|
| Number | 596 | 663 | 579 |
| Male | 53.0% | 49.3% | 65.6% |
| Spherical equivalent (diopters) | −1.02 ± 1.53 | −1.77 ± 1.72 | −2.86 ± 2.12 |
| ≥0.5 diopter (hyperopia) | 7.1% | 2.6% | 1.2% |
| −0.5 to 0.5 diopter (emmetropia) | 32.7% | 15.2% | 6.0% |
| ≤−0.5 diopter (myopia) | 60.2% | 82.2% | 92.8% |
| ≤−0.75 diopter | 49.7% | 72.4% | 87.7% |
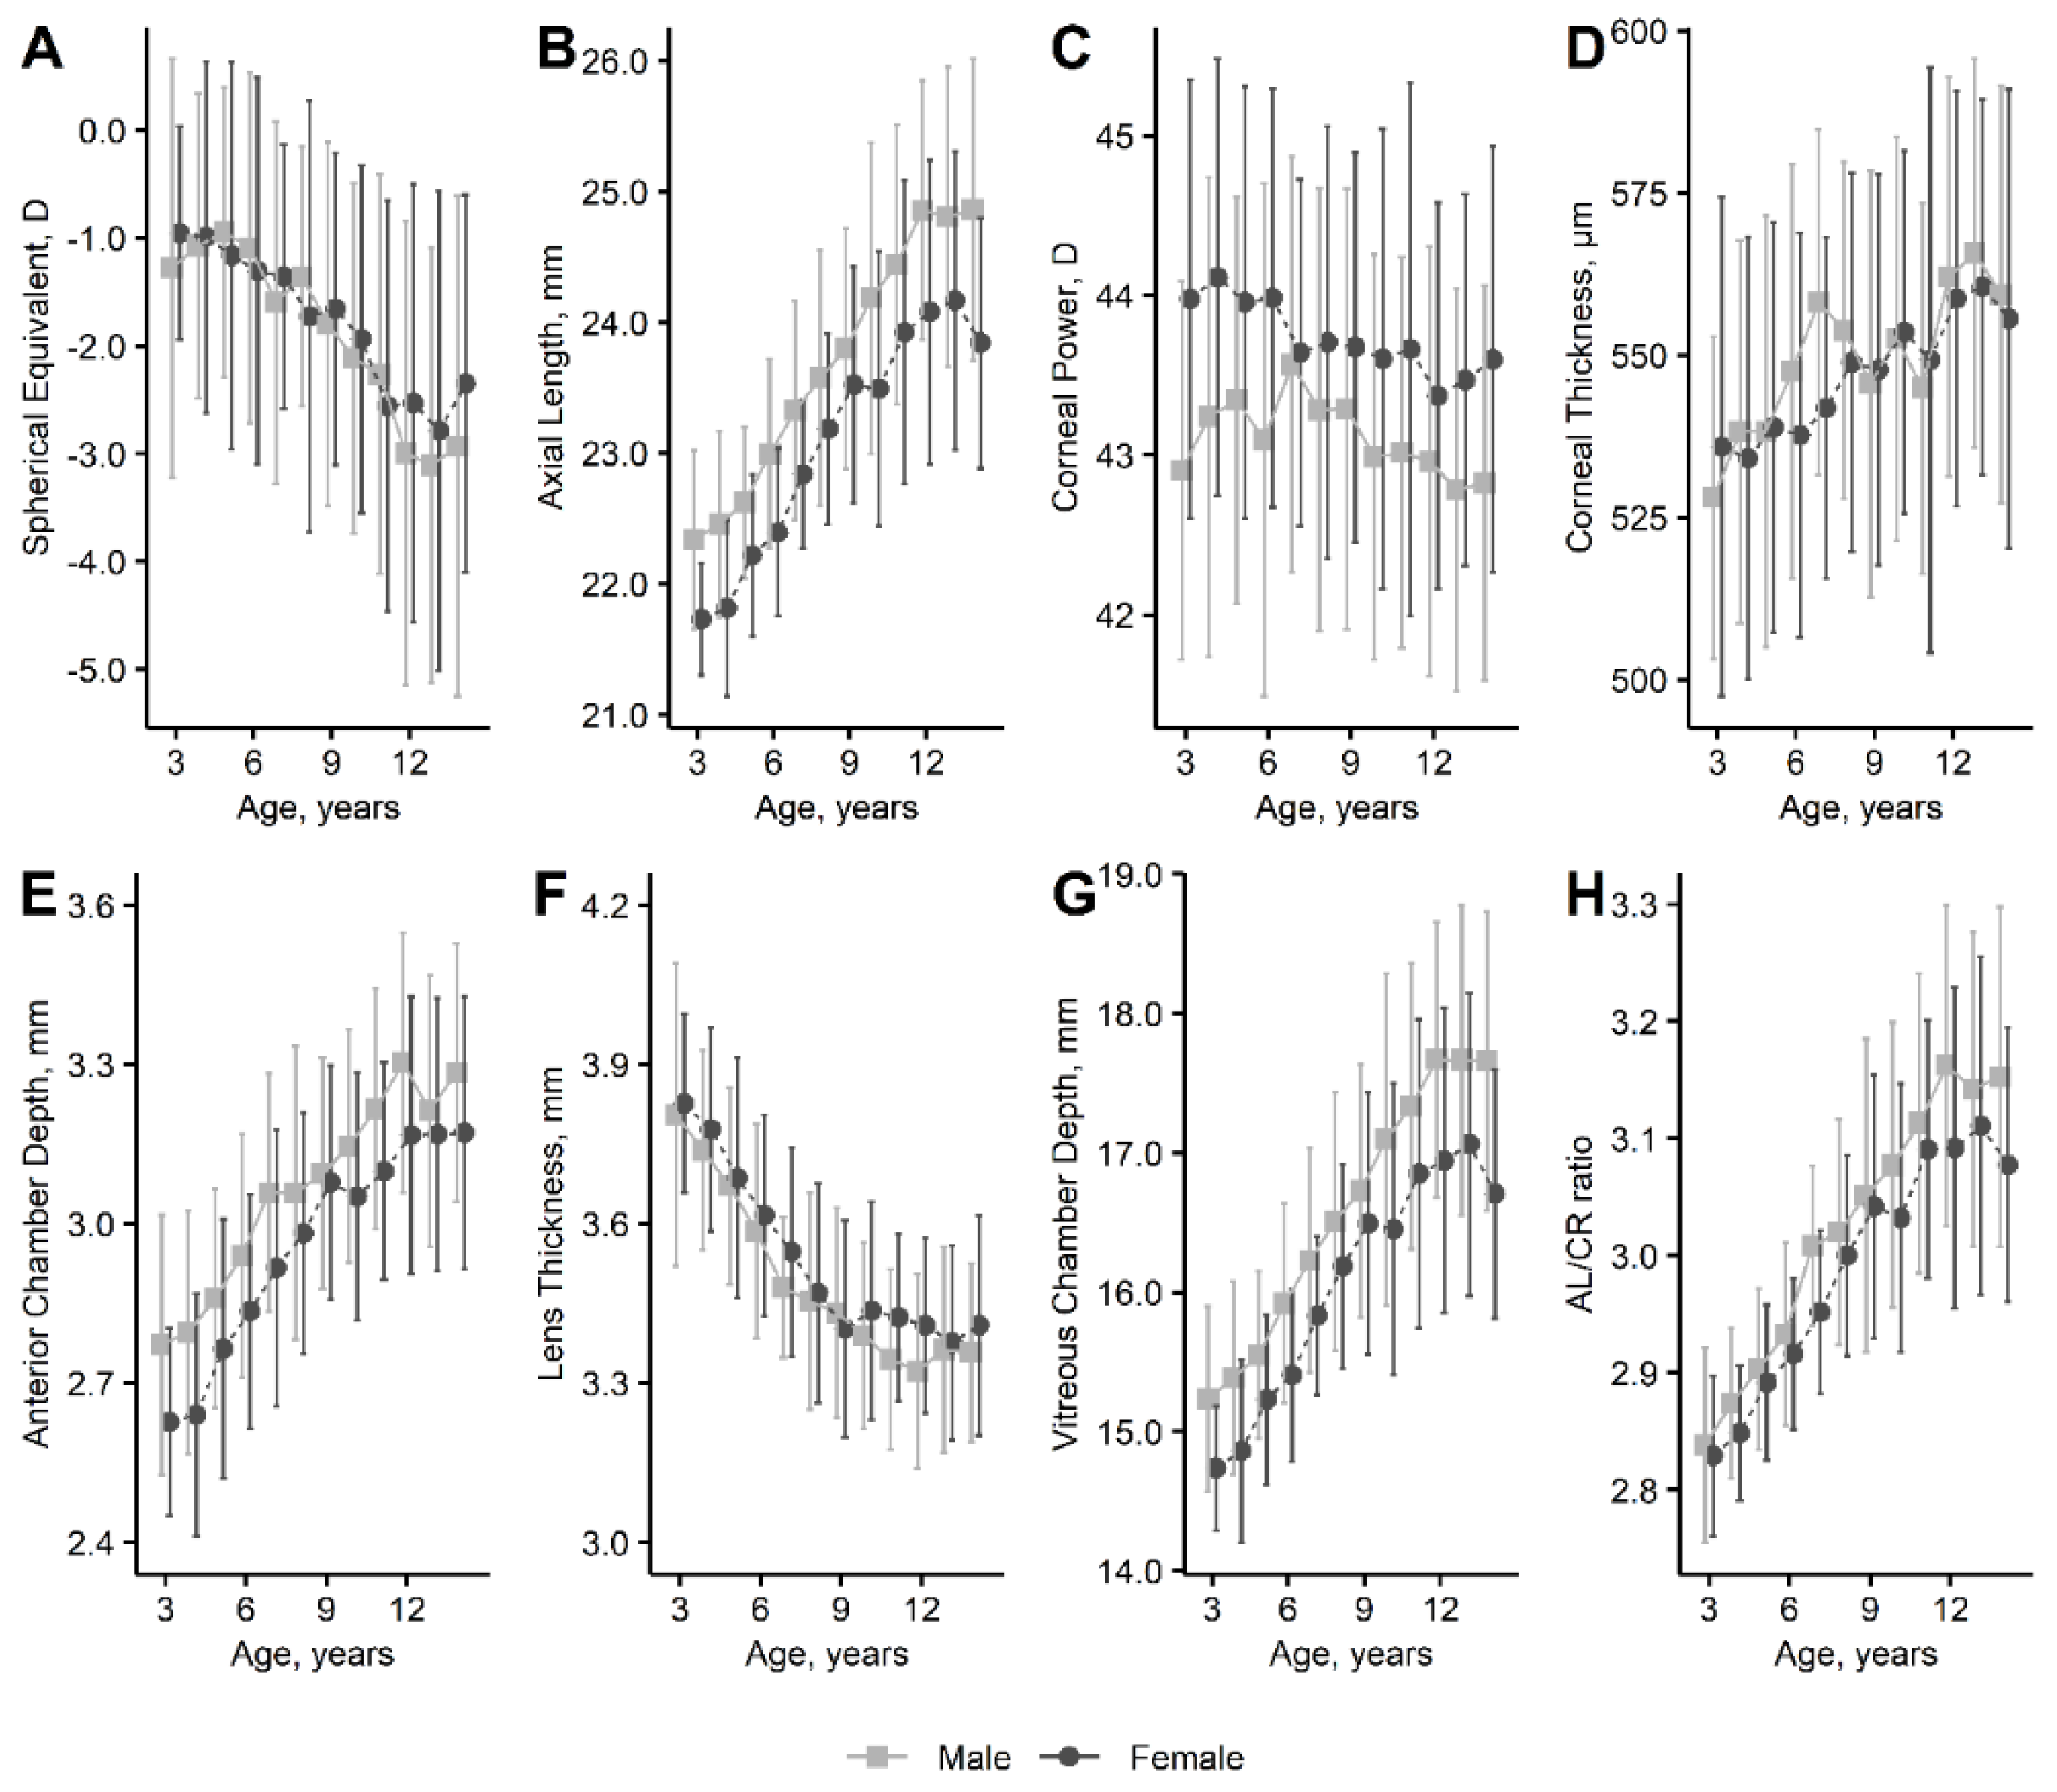
| Axial length (mm) | 22.39 ± 0.73 | 23.46 ± 1.07 | 24.57 ± 1.16 |
| Corneal power (diopter) | 43.57 ± 1.47 | 43.48 ± 1.37 | 43.07 ± 1.29 |
| Corneal thickness (µm) | 538 ± 32 | 549 ± 31 | 561 ± 31 |
| Anterior chamber depth (mm) | 2.80 ± 0.25 | 3.04 ± 0.25 | 3.23 ± 0.26 |
| Lens thickness (mm) | 3.69 ± 0.21 | 3.47 ± 0.20 | 3.36 ± 0.18 |
| Vitreous chamber depth (mm) | 15.36 ± 0.70 | 16.41 ± 1.05 | 17.41 ± 1.11 |
| Axial length–corneal radius ratio | 2.89 ± 0.07 | 3.02 ± 0.12 | 3.13 ± 0.14 |
| Preschool (Ages 3 to 6 Years) | Elementary School (Ages 6 to 11 Years) | Junior High School (Ages 12 to 14 Years) | |
|---|---|---|---|
| Number | 526 | 543 | 556 |
| Age, years | 4.8 ± 0.9 | 8.4 ± 1.7 | 12.9 ± 0.8 |
| Male | 54.4% | 49.5% | 65.6% |
| Body mass index, kg/m2 | 15.8 ± 1.5 | 16.4 ± 2.1 | 18.7 ± 2.4 |
| Time spent, min/day | |||
| Outdoors | 73.7 ± 43.7 | 71.5 ± 45.7 | 72.2 ± 56.1 |
| Watching television | 92.3 ± 61.8 | 85.2 ± 58.1 | 80.7 ± 60.9 |
| Use of digital devices | 25.3 ± 37.9 | 40.5 ± 47.9 | 115.4 ± 88.5 |
| Reading | 30.8 ± 23.3 | 68.4 ± 65.6 | 74.7 ± 60.0 |
| Number of myopic parents | |||
| 0 (none) | 24.1% | 15.5% | 13.0% |
| 1 (either) | 35.2% | 33.7% | 45.1% |
| 2 (both) | 40.7% | 50.8% | 41.9% |
| Spherical Equivalent, D | Axial Length, mm | Lens Thickness, mm | Vitreous Chamber Depth, mm | |
|---|---|---|---|---|
| Age (years) | −0.224 *** (−0.249 to −0.198) | 0.268 *** (0.255 to 0.281) | −0.039 *** (−0.042 to −0.036) | 0.254 *** (0.241 to 0.267) |
| Sex; male, 1; female, 0 | −0.297 ** (−0.492 to −0.101) | 0.791 *** (0.664 to 0.918) | −0.058 *** (−0.082 to −0.035) | 0.705 *** (0.583 to 0.827) |
| Body mass index (kg/m2) | −0.158 *** (−0.197 to −0.118) | 0.209 *** (0.184 to 0.235) | −0.026 *** (−0.031 to −0.022) | 0.190 *** (0.165 to 0.214) |
| Time spent (h/day) | ||||
| Outdoors | 0.164 ** (0.045 to 0.283) | −0.052 (−0.132 to 0.029) | −0.005 (−0.019 to 0.009) | −0.055 (−0.132 to 0.023) |
| Watching television | 0.104 * (0.008 to 0.201) | −0.075 * (−0.141 to −0.010) | 0.012 * (0.001 to 0.024) | −0.073 * (−0.136 to −0.011) |
| Use of digital devices | −0.351 *** (−0.428 to −0.274) | 0.410 *** (0.360 to 0.459) | −0.052 *** (−0.061 to −0.042) | 0.382 *** (0.334 to 0.429) |
| Reading | −0.436 *** (−0.537 to −0.335) | 0.447 *** (0.381 to 0.513) | −0.064 *** (−0.076 to −0.052) | 0.430 *** (0.367 to 0.493) |
| Number of myopic parents | −0.377 *** (−0.507 to −0.247) | 0.317 *** (0.230 to 0.405) | −0.028 *** (−0.043 to −0.012) | 0.293 *** (0.209 to 0.377) |
| Spherical Equivalent, D | Axial Length, mm | Lens Thickness, mm | Vitreous Chamber Depth, mm | |
|---|---|---|---|---|
| Age (years) | −0.208 *** (−0.244 to −0.172) | 0.254 *** (0.236 to 0.271) | −0.042 *** (−0.046 to −0.038) | 0.245 *** (0.228 to 0.262) |
| Sex; male, 1; female, 0 | −0.172 (−0.354 to 0.010) | 0.622 *** (0.531 to 0.712) | −0.032 ** (−0.052 to −0.013) | 0.550 *** (0.462 to 0.638) |
| Body mass index (kg/m2) | 0.036 (−0.009 to 0.080) | −0.018 (−0.040 to 0.004) | 0.007 ** (0.002 to 0.012) | −0.028 * (−0.050 to −0.006) |
| Time spent (h/day) | ||||
| Outdoors | 0.131 * (0.021 to 0.241) | −0.058 * (−0.113 to −0.003) | −0.007 (−0.019 to 0.004) | −0.058 * (−0.111 to −0.005) |
| Watching television | 0.034 (−0.055 to 0.122) | −0.007 (−0.051 to 0.037) | 0.002 (−0.008 to 0.011) | −0.006 (−0.049 to 0.037) |
| Use of digital devices | −0.037 (−0.126 to 0.051) | −0.010 (−0.054 to 0.034) | 0.010 * (0.001 to 0.020) | −0.013 (−0.056 to 0.030) |
| Reading | −0.152 ** (−0.254 to −0.049) | 0.110 *** (0.059 to 0.161) | −0.012 * (−0.023 to −0.001) | 0.110 *** (0.061 to 0.160) |
| Number of myopic parents | −0.305 *** (−0.425 to −0.185) | 0.233 *** (0.174 to 0.293) | −0.016 * (−0.029 to −0.003) | 0.212 *** (0.154 to 0.270) |
| R-squared | 0.179 | 0.559 | 0.345 | 0.541 |
Publisher’s Note: MDPI stays neutral with regard to jurisdictional claims in published maps and institutional affiliations. |
© 2022 by the authors. Licensee MDPI, Basel, Switzerland. This article is an open access article distributed under the terms and conditions of the Creative Commons Attribution (CC BY) license (https://creativecommons.org/licenses/by/4.0/).
Share and Cite
Maruyama, T.; Yotsukura, E.; Torii, H.; Mori, K.; Inokuchi, M.; Tokumura, M.; Hazra, D.; Ogawa, M.; Hanyuda, A.; Tsubota, K.; et al. Children in Tokyo Have a Long Sustained Axial Length from Age 3 Years: The Tokyo Myopia Study. J. Clin. Med. 2022, 11, 4413. https://doi.org/10.3390/jcm11154413
Maruyama T, Yotsukura E, Torii H, Mori K, Inokuchi M, Tokumura M, Hazra D, Ogawa M, Hanyuda A, Tsubota K, et al. Children in Tokyo Have a Long Sustained Axial Length from Age 3 Years: The Tokyo Myopia Study. Journal of Clinical Medicine. 2022; 11(15):4413. https://doi.org/10.3390/jcm11154413
Chicago/Turabian StyleMaruyama, Tomoki, Erisa Yotsukura, Hidemasa Torii, Kiwako Mori, Mikako Inokuchi, Mitsuaki Tokumura, Debabrata Hazra, Mamoru Ogawa, Akiko Hanyuda, Kazuo Tsubota, and et al. 2022. "Children in Tokyo Have a Long Sustained Axial Length from Age 3 Years: The Tokyo Myopia Study" Journal of Clinical Medicine 11, no. 15: 4413. https://doi.org/10.3390/jcm11154413