
Association between Lower-to-Upper Ratio of Appendicular Skeletal Muscle and Metabolic Syndrome

Abstract
:1. Introduction
2. Materials and Methods
2.1. Study Population
2.2. Definition of Metabolic Syndrome (MetS)
2.3. Measurement of Body Composition
2.4. Measurements of Variables
2.5. Statistics
3. Results
4. Discussion
5. Conclusions
Author Contributions
Funding
Institutional Review Board Statement
Informed Consent Statement
Data Availability Statement
Conflicts of Interest
References
- Rochlani, Y.; Pothineni, N.V.; Kovelamudi, S.; Mehta, J.L. Metabolic syndrome: Pathophysiology, management, and modulation by natural compounds. Ther. Adv. Cardiovasc. Dis. 2017, 11, 215–225. [Google Scholar] [CrossRef] [PubMed] [Green Version]
- Alberti, K.G.M.M.; Eckel, R.H.; Grundy, S.M.; Zimmet, P.Z.; Cleeman, J.I.; Donato, K.A.; Fruchart, J.C.; James, W.P.T.; Loria, C.M.; Smith, S.C., Jr. Harmonizing the metabolic syndrome: A joint interim statement of the international diabetes federation task force on epidemiology and prevention; National heart, lung, and blood institute; American heart association; World heart federation; International Atherosclerosis Society; and International Association for the Study of Obesity. Circulation 2009, 120, 1640–1645. [Google Scholar] [CrossRef] [PubMed] [Green Version]
- Lakka, H.-M.; Laaksonen, D.E.; Lakka, T.; Niskanen, L.K.; Kumpusalo, E.; Tuomilehto, J.; Salonen, J.T. The Metabolic Syndrome and Total and Cardiovascular Disease Mortality in Middle-Aged Men. JAMA 2002, 288, 2709–2716. [Google Scholar] [CrossRef] [PubMed] [Green Version]
- Cho, A.-R.; Kwon, Y.-J.; Kim, J.-K. Pre-Metabolic Syndrome and Incidence of Type 2 Diabetes and Hypertension: From the Korean Genome and Epidemiology Study. J. Pers. Med. 2021, 11, 700. [Google Scholar] [CrossRef] [PubMed]
- DeFronzo, R.A.; Tripathy, D. Skeletal Muscle Insulin Resistance Is the Primary Defect in Type 2 Diabetes. Diabetes Care 2009, 32 (Suppl. S2), S157–S163. [Google Scholar] [CrossRef] [Green Version]
- Kim, T.N.; Choi, K.M. The Implications of Sarcopenia and Sarcopenic Obesity on Cardiometabolic Disease. J. Cell. Biochem. 2015, 116, 1171–1178. [Google Scholar] [CrossRef]
- Marzetti, E.; Calvani, R.; Cesari, M.; Buford, T.W.; Lorenzi, M.; Behnke, B.J.; Leeuwenburgh, C. Mitochondrial dysfunction and sarcopenia of aging: From signaling pathways to clinical trials. Int. J. Biochem. Cell Biol. 2013, 45, 2288–2301. [Google Scholar] [CrossRef] [Green Version]
- Tibuakuu, M.; Zhao, D.; Saxena, A.; Brown, T.T.; Jacobson, L.P.; Palella, F.J.; Witt, M.D.; Koletar, S.L.; Margolick, J.B.; Guallar, E.; et al. Low thigh muscle mass is associated with coronary artery stenosis among HIV-infected and HIV-uninfected men: The Multicenter AIDS Cohort Study (MACS). J. Cardiovasc. Comput. Tomogr. 2018, 12, 131–138. [Google Scholar] [CrossRef]
- Hamasaki, H. Lower Extremity Skeletal Muscle Mass, but Not Upper Extremity Skeletal Muscle Mass, Is Inversely Associated with Hospitalization in Patients with Type 2 Diabetes. J. Diabetes Res. 2017, 2017, 2303467. [Google Scholar] [CrossRef] [Green Version]
- Tajiri, Y.; Kato, T.; Nakayama, H.; Yamada, K. Reduction of Skeletal Muscle, Especially in Lower Limbs, in Japanese Type 2 Diabetic Patients with Insulin Resistance and Cardiovascular Risk Factors. Metab. Syndr. Relat. Disord. 2010, 8, 137–142. [Google Scholar] [CrossRef]
- Jung, S.; Park, J.; Seo, Y.-G. Relationship between arm-to-leg and limbs-to-trunk body composition ratio and cardiovascular disease risk factors. Sci. Rep. 2021, 11, 17414. [Google Scholar] [CrossRef]
- Drescher, C.; Konishi, M.; Ebner, N.; Springer, J. Loss of muscle mass: Current developments in cachexia and sarcopenia focused on biomarkers and treat-ment. J. Cachexia Sarcopenia Muscle 2015, 6, 303–311. [Google Scholar] [CrossRef] [Green Version]
- Kim, B.Y.; Kang, S.M.; Kang, J.H.; Kang, S.Y.; Kim, K.K.; Kim, K.B.; Kim, B.; Kim, S.J.; Kim, Y.H.; Kim, J.H.; et al. 2020 Korean Society for the Study of Obesity Guidelines for the Management of Obesity in Korea. J. Obes. Metab. Syndr. 2021, 30, 81–92. [Google Scholar] [CrossRef]
- Lim, Y.; Chun, S.; Lee, J.H.; Baek, K.H.; Lee, W.K.; Yim, H.-W.; Kang, M.-I. Association of bone mineral density and diabetic retinopathy in diabetic subjects: The 2008–2011 Korea National Health and Nutrition Examination Survey. Osteoporos. Int. 2016, 27, 2249–2257. [Google Scholar] [CrossRef]
- Cameron, A.J.; Magliano, D.; Shaw, J.E.; Zimmet, P.; Carstensen, B.; Alberti, K.G.M.; Tuomilehto, J.; Barr, E.L.M.; Pauvaday, V.K.; Kowlessur, S.; et al. The influence of hip circumference on the relationship between abdominal obesity and mortality. Int. J. Epidemiol. 2012, 41, 484–494. [Google Scholar] [CrossRef] [Green Version]
- Londoño, F.J.; Calderón, J.C.; Gallo, J. Association between Thigh Muscle Development and the Metabolic Syndrome in Adults. Ann. Nutr. Metab. 2012, 61, 41–46. [Google Scholar] [CrossRef]
- Moon, J.H.; Choo, S.R.; Kim, J.S. Relationship between Low Muscle Mass and Metabolic Syndrome in Elderly People with Normal Body Mass Index. J. Bone Metab. 2015, 22, 99–106. [Google Scholar] [CrossRef] [Green Version]
- Heo, J.E.; Shim, J.-S.; Lee, H.; Kim, H.C. Association between the Thigh Muscle and Insulin Resistance According to Body Mass Index in Middle-Aged Korean Adults. Diabetes Metab. J. 2020, 44, 446–457. [Google Scholar] [CrossRef]
- Roberts, C.K.; Hevener, A.L.; Barnard, R.J. Metabolic Syndrome and Insulin Resistance: Underlying Causes and Modification by Exercise Training. Compr. Physiol. 2013, 3, 158. [Google Scholar] [CrossRef] [Green Version]
- Jung, C.-H.; Lee, W.-Y.; Kim, B.-Y.; Park, S.E.; Rhee, E.-J.; Park, C.-Y.; Oh, K.-W.; Mok, J.-O.; Kim, C.-H.; Park, S.-W.; et al. The Risk of Metabolic Syndrome According to the White Blood Cell Count in Apparently Healthy Korean Adults. Yonsei Med. J. 2013, 54, 615–620. [Google Scholar] [CrossRef]
- Welsh, C.; Welsh, P.; Mark, P.B.; Celis-Morales, C.A.; Lewsey, J.; Gray, S.R.; Lyall, D.M.; Iliodromiti, S.; Gill, J.M.; Pell, J.; et al. Association of Total and Differential Leukocyte Counts with Cardiovascular Disease and Mortality in the UK Biobank. Arter. Thromb. Vasc. Biol. 2018, 38, 1415–1423. [Google Scholar] [CrossRef] [PubMed] [Green Version]
- Dalle, S.; Rossmeislova, L.; Koppo, K. The Role of Inflammation in Age-Related Sarcopenia. Front. Physiol. 2017, 8, 1045. [Google Scholar] [CrossRef] [PubMed] [Green Version]
- Chung, T.-H.; Shim, J.-Y.; Lee, Y.-J. Association between leukocyte count and sarcopenia in postmenopausal women: The Korean National Health and Nutrition Examination Survey. Maturitas 2015, 84, 89–93. [Google Scholar] [CrossRef] [PubMed]
- Bonaldo, P.; Sandri, M. Cellular and molecular mechanisms of muscle atrophy. Dis. Model. Mech. 2013, 6, 25–39. [Google Scholar] [CrossRef] [PubMed] [Green Version]
- Walsh, K. Adipokines, Myokines and Cardiovascular Disease. Circ. J. 2009, 73, 13–18. [Google Scholar] [CrossRef] [Green Version]
- Yoon, J.W.; Ha, Y.-C.; Kim, K.M.; Moon, J.H.; Choi, S.H.; Lim, S.; Park, Y.J.; Lim, J.-Y.; Kim, K.W.; Park, K.S.; et al. Hyperglycemia is associated with impaired muscle quality in older men with diabetes: The korean longitudinal study on health and aging. Diabetes Metab. J. 2016, 40, 140–146. [Google Scholar] [CrossRef]
- Nishikawa, H.; Asai, A.; Fukunishi, S.; Nishiguchi, S.; Higuchi, K. Metabolic Syndrome and Sarcopenia. Nutrients 2021, 13, 3519. [Google Scholar] [CrossRef]
- Kim, T.N.; Park, M.S.; Yang, S.J.; Yoo, H.J.; Kang, H.J.; Song, W.; Seo, J.A.; Kim, S.G.; Kim, N.H.; Baik, S.H.; et al. Prevalence and determinant factors of sarcopenia in patients with type 2 diabetes: The Korean Sarcopenic Obesity Study (KSOS). Diabetes Care 2010, 33, 1497–1499. [Google Scholar] [CrossRef] [Green Version]
- Wang, J.; Li, X.; Han, X.; Yang, K.; Liu, B.; Li, Y.; Wu, P.; Liu, X.; Yu, K.; Dai, X.; et al. Serum creatinine levels and risk of metabolic syndrome in a middle-aged and older Chinese population. Clin. Chim. Acta 2015, 440, 177–182. [Google Scholar] [CrossRef]
- Gupte, A.A.; Pownall, H.J.; Hamilton, D.J. Estrogen: An Emerging Regulator of Insulin Action and Mitochondrial Function. J. Diabetes Res. 2015, 2015, 916585. [Google Scholar] [CrossRef]
- White, R.E.; Gerrity, R.; Barman, S.A.; Han, G. Estrogen and oxidative stress: A novel mechanism that may increase the risk for cardiovascular disease in women. Steroids 2010, 75, 788–793. [Google Scholar] [CrossRef] [Green Version]
- Kasai, T.; Ishiguro, N.; Matsui, Y.; Harada, A.; Takemura, M.; Yuki, A.; Kato, Y.; Otsuka, R.; Ando, F.; Shimokata, H. Sex- and age-related differences in mid-thigh composition and muscle quality determined by computed to-mography in middle-aged and elderly Japanese. Geriatr. Gerontol. Int. 2015, 15, 700–706. [Google Scholar] [CrossRef]

| LUR Quintile in Men | p for Trend b | |||||
|---|---|---|---|---|---|---|
| Q1 (≤2.65) | Q2 (2.66–2.80) | Q3 (2.81–2.94) | Q4 (2.95–3.11) | Q5 (≥3.12) | ||
| n | 918 | 918 | 918 | 918 | 919 | |
| Age, year | 55.2 ± 0.34 | 56.9 ± 0.37 | 56.9 ± 0.37 | 57.2 ± 0.38 | 57.2 ± 0.38 | <0.001 |
| ASM, g | 21,334.6 ± 108.69 | 21,335.7 ± 105.78 | 21,495.5 ± 103.16 | 21,490.3 ± 103.57 | 21,854.8 ± 102.56 | <0.001 |
| Upper ASM, g | 6081.3 ± 31.31 | 5713.4 ± 28.42 | 5541.1 ± 26.67 | 5333.2 ± 25.69 | 5089.1 ± 24.56 | <0.001 |
| Lower ASM, g | 15,253.3 ± 78.73 | 15,622.3 ± 77.5 | 15,954.4 ± 76.59 | 16,157.1 ± 78 | 16,765.7 ± 79.06 | <0.001 |
| LUR | 2.5115 ± 0.0044 | 2.7348 ± 0.0016 | 2.8797 ± 0.0013 | 3.0298 ± 0.0016 | 3.3003 ± 0.0055 | <0.001 |
| MetS, n | 313 (34.1) | 340 (37) | 331 (36.1) | 348 (37.9) | 375 (40.8) | 0.047 |
| Smoking, n | 633 (69) | 600 (65.4) | 582 (63.4) | 555 (60.5) | 524 (57) | <0.001 |
| Alcohol consumption, n | 328 (35.7) | 329 (35.8) | 323 (35.2) | 297 (32.4) | 299 (32.5) | 0.295 |
| Exercise, n | 352 (38.3) | 313 (34.1) | 321 (35) | 295 (32.1) | 324 (35.3) | 0.085 |
| BMI, kg/m2 | 23.5 ± 0.1 | 23.8 ± 0.1 | 23.9 ± 0.09 | 24.1 ± 0.1 | 24.6 ± 0.09 | <0.001 |
| WC, cm | 82.8 ± 0.31 | 84.7 ± 0.28 | 85.3 ± 0.26 | 85.9 ± 0.27 | 87.2 ± 0.26 | <0.001 |
| Systolic BP, mmHg | 125.3 ± 0.57 | 125.3 ± 0.56 | 125 ± 0.54 | 124.6 ± 0.54 | 124.8 ± 0.56 | 0.313 |
| Diastolic BP, mmHg | 81.4 ± 0.36 | 80.6 ± 0.37 | 80.4 ± 0.35 | 80.3 ± 0.35 | 80.8 ± 0.35 | 0.187 |
| Fasting glucose, mg/dL | 102 ± 0.83 | 102.7 ± 0.9 | 103.4 ± 0.81 | 104.6 ± 0.99 | 104.2 ± 0.86 | 0.029 |
| HDL, mg/dL | 46.6 ± 0.39 | 45.7 ± 0.36 | 45.8 ± 0.37 | 44.6 ± 0.35 | 45.1 ± 0.37 | 0.001 |
| TG, mg/dL | 161.6 ± 5.35 | 172 ± 4.91 | 165.3 ± 4.54 | 168.1 ± 4.1 | 167.5 ± 4.67 | 0.555 |
| Cr, mg/dL | 0.939 ± 0.0063 | 0.9464 ± 0.0052 | 0.9441 ± 0.0066 | 0.9561 ± 0.0054 | 0.9742 ± 0.0052 | <0.001 |
| WBC count, n/μL | 6535 ± 60.5 | 6500 ± 56.5 | 6438 ± 58.7 | 6413 ± 56.4 | 6484 ± 55.7 | 0.364 |
| LUR Quintile in Women | p for Trend b | |||||
|---|---|---|---|---|---|---|
| Q1 (≤3.00) | Q2 (3.01–3.18) | Q3 (3.19–3.36) | Q4 (3.37–3.60) | Q5 (≥3.61) | ||
| n | 1212 | 1212 | 1212 | 1212 | 1213 | |
| Age, year | 61.9 ± 0.33 | 59.3 ± 0.33 | 57 ± 0.32 | 54.9 ± 0.31 | 52.7 ± 0.29 | <0.001 |
| ASM, g | 13,786.2 ± 59.08 | 14,224.7 ± 59.45 | 14,379.2 ± 58.55 | 14,553.6 ± 59.9 | 14,648.8 ± 57.4 | <0.001 |
| Upper ASM, g | 3612.5 ± 15.36 | 3474 ± 14.58 | 3361.8 ± 13.69 | 3247.1 ± 13.41 | 3028.3 ± 12.27 | <0.001 |
| Lower ASM, g | 10,173.7 ± 44.49 | 10,750.7 ± 44.94 | 11,017.4 ± 44.93 | 11,306.5 ± 46.58 | 11,620.5 ± 45.8 | <0.001 |
| LUR | 2.8189 ± 0.0043 | 3.0954 ± 0.0015 | 3.2776 ± 0.0015 | 3.4828 ± 0.0019 | 3.8447 ± 0.0059 | <0.001 |
| MetS, n | 464 (38.3) | 467 (38.5) | 433 (35.7) | 377 (31.1) | 341 (28.1) | <0.001 |
| Smoking, n | 94 (7.8) | 97 (8) | 82 (6.8) | 69 (5.7) | 71 (5.9) | 0.073 |
| Alcohol consumption, n | 64 (5.3) | 99 (8.2) | 83 (6.8) | 79 (6.5) | 85 (7) | 0.082 |
| Exercise, n | 354 (29.2) | 399 (32.9) | 375 (30.9) | 439 (36.2) | 422 (34.8) | 0.001 |
| Menopause, n | 888 (73.3) | 803 (66.3) | 737 (60.8) | 641 (52.9) | 585 (48.2) | <0.001 |
| BMI, kg/m2 | 23.4 ± 0.1 | 23.9 ± 0.09 | 24 ± 0.09 | 24.2 ± 0.09 | 24.3 ± 0.09 | <0.001 |
| WC, cm | 79.6 ± 0.28 | 81 ± 0.26 | 81.1 ± 0.26 | 81.4 ± 0.26 | 81.1 ± 0.27 | <0.001 |
| Systolic BP, mmHg | 127.5 ± 0.54 | 125.9 ± 0.54 | 122.7 ± 0.5 | 120.6 ± 0.52 | 117.4 ± 0.48 | <0.001 |
| Diastolic BP, mmHg | 77.5 ± 0.3 | 77.4 ± 0.29 | 77 ± 0.29 | 76.2 ± 0.3 | 75.8 ± 0.29 | <0.001 |
| Fasting glucose, mg/dL | 99.3 ± 0.64 | 100.3 ± 0.71 | 99.4 ± 0.7 | 98.9 ± 0.67 | 96.3 ± 0.52 | <0.001 |
| HDL, mg/dL | 48.7 ± 0.31 | 48.7 ± 0.33 | 49 ± 0.31 | 49.4 ± 0.32 | 50.2 ± 0.32 | <0.001 |
| TG, mg/dL | 135.4 ± 2.74 | 131.2 ± 2.38 | 128.4 ± 2.49 | 122.2 ± 2.25 | 122.1 ± 2.21 | <0.001 |
| Cr, mg/dL | 0.7028 ± 0.0035 | 0.714 ± 0.004 | 0.7136 ± 0.0034 | 0.7104 ± 0.0034 | 0.7093 ± 0.0034 | 0.413 |
| WBC count, n/μL | 5838 ± 45 | 5781 ± 46.1 | 5730 ± 44.8 | 5619 ± 46 | 5593 ± 43.9 | <0.001 |
| Men | Q1 (<2.65) | Q2 (2.66–2.80) | Q3 (2.81–2.94) | Q4 (2.95–3.11) | Q5 (≥3.12) |
|---|---|---|---|---|---|
| Model 1 a | 1 (reference) | 1.063 (1.016–1.112) | 0.917 (0.877–0.96) | 0.991 (0.947–1.037) | 1.266 (1.213–1.321) |
| Model 2 b | 1 (reference) | 1.046 (1.002–1.091) | 0.978 (0.937–1.021) | 1.028 (0.985–1.073) | 1.282 (1.229–1.338) |
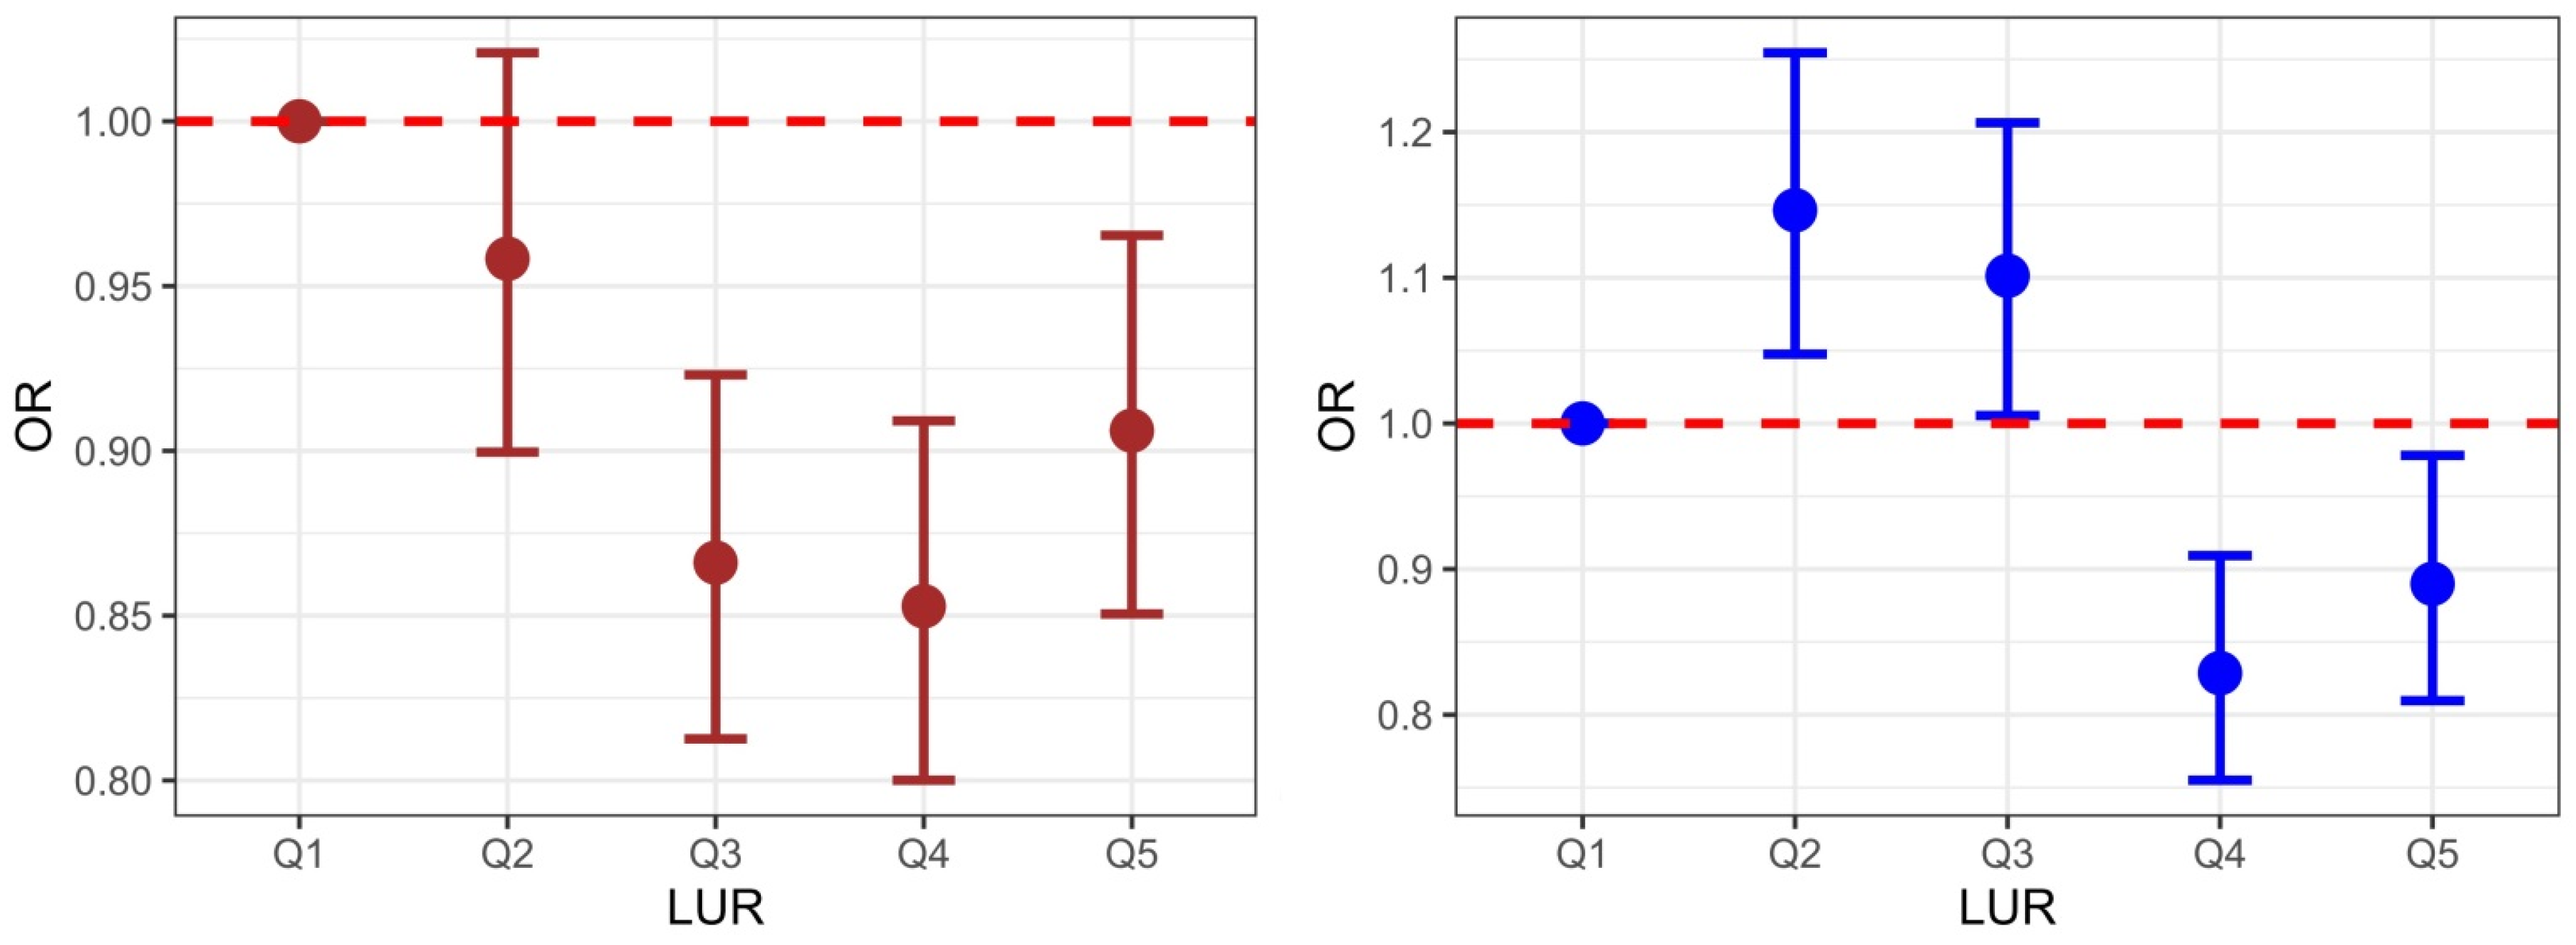
| Model 3 c | 1 (reference) | 0.958 (0.899–1.021) | 0.866 (0.813–0.923) | 0.853 (0.800–0.909) | 0.906 (0.850–0.965) |
| Women | Q1 (<3.00) | Q2 (3.01–3.18) | Q3 (3.19–3.36) | Q4 (3.37–3.60) | Q5 (≥3.61) |
| Model 1 a | 1 (reference) | 1.278 (1.220–1.339) | 1.386 (1.323–1.452) | 1.155 (1.101–1.211) | 1.248 (1.189–1.309) |
| Model 2 b | 1 (reference) | 1.285 (1.226–1.346) | 1.389 (1.326–1.456) | 1.158 (1.104–1.214) | 1.253 (1.194–1.314) |
| Model 3 d | 1 (reference) | 1.146 (1.048–1.254) | 1.101 (1.005–1.206) | 0.829 (0.755–0.909) | 0.890 (0.810–0.978) |
Publisher’s Note: MDPI stays neutral with regard to jurisdictional claims in published maps and institutional affiliations. |
© 2022 by the authors. Licensee MDPI, Basel, Switzerland. This article is an open access article distributed under the terms and conditions of the Creative Commons Attribution (CC BY) license (https://creativecommons.org/licenses/by/4.0/).
Share and Cite
Moon, H.E.; Lee, T.S.; Chung, T.-H. Association between Lower-to-Upper Ratio of Appendicular Skeletal Muscle and Metabolic Syndrome. J. Clin. Med. 2022, 11, 6309. https://doi.org/10.3390/jcm11216309
Moon HE, Lee TS, Chung T-H. Association between Lower-to-Upper Ratio of Appendicular Skeletal Muscle and Metabolic Syndrome. Journal of Clinical Medicine. 2022; 11(21):6309. https://doi.org/10.3390/jcm11216309
Chicago/Turabian StyleMoon, Hyun Eui, Tae Sic Lee, and Tae-Ha Chung. 2022. "Association between Lower-to-Upper Ratio of Appendicular Skeletal Muscle and Metabolic Syndrome" Journal of Clinical Medicine 11, no. 21: 6309. https://doi.org/10.3390/jcm11216309