
The Perfusion Index of the Ear as a Predictor of Hypotension Following the Induction of Anesthesia in Patients with Hypertension: A Prospective Observational Study
Abstract
:1. Introduction
2. Materials and Methods
2.1. Study Population
2.2. Anesthesia and Hemodynamic Monitoring
2.3. Data Collection
2.4. Statistical Analyses
3. Results
3.1. Patient Demographics
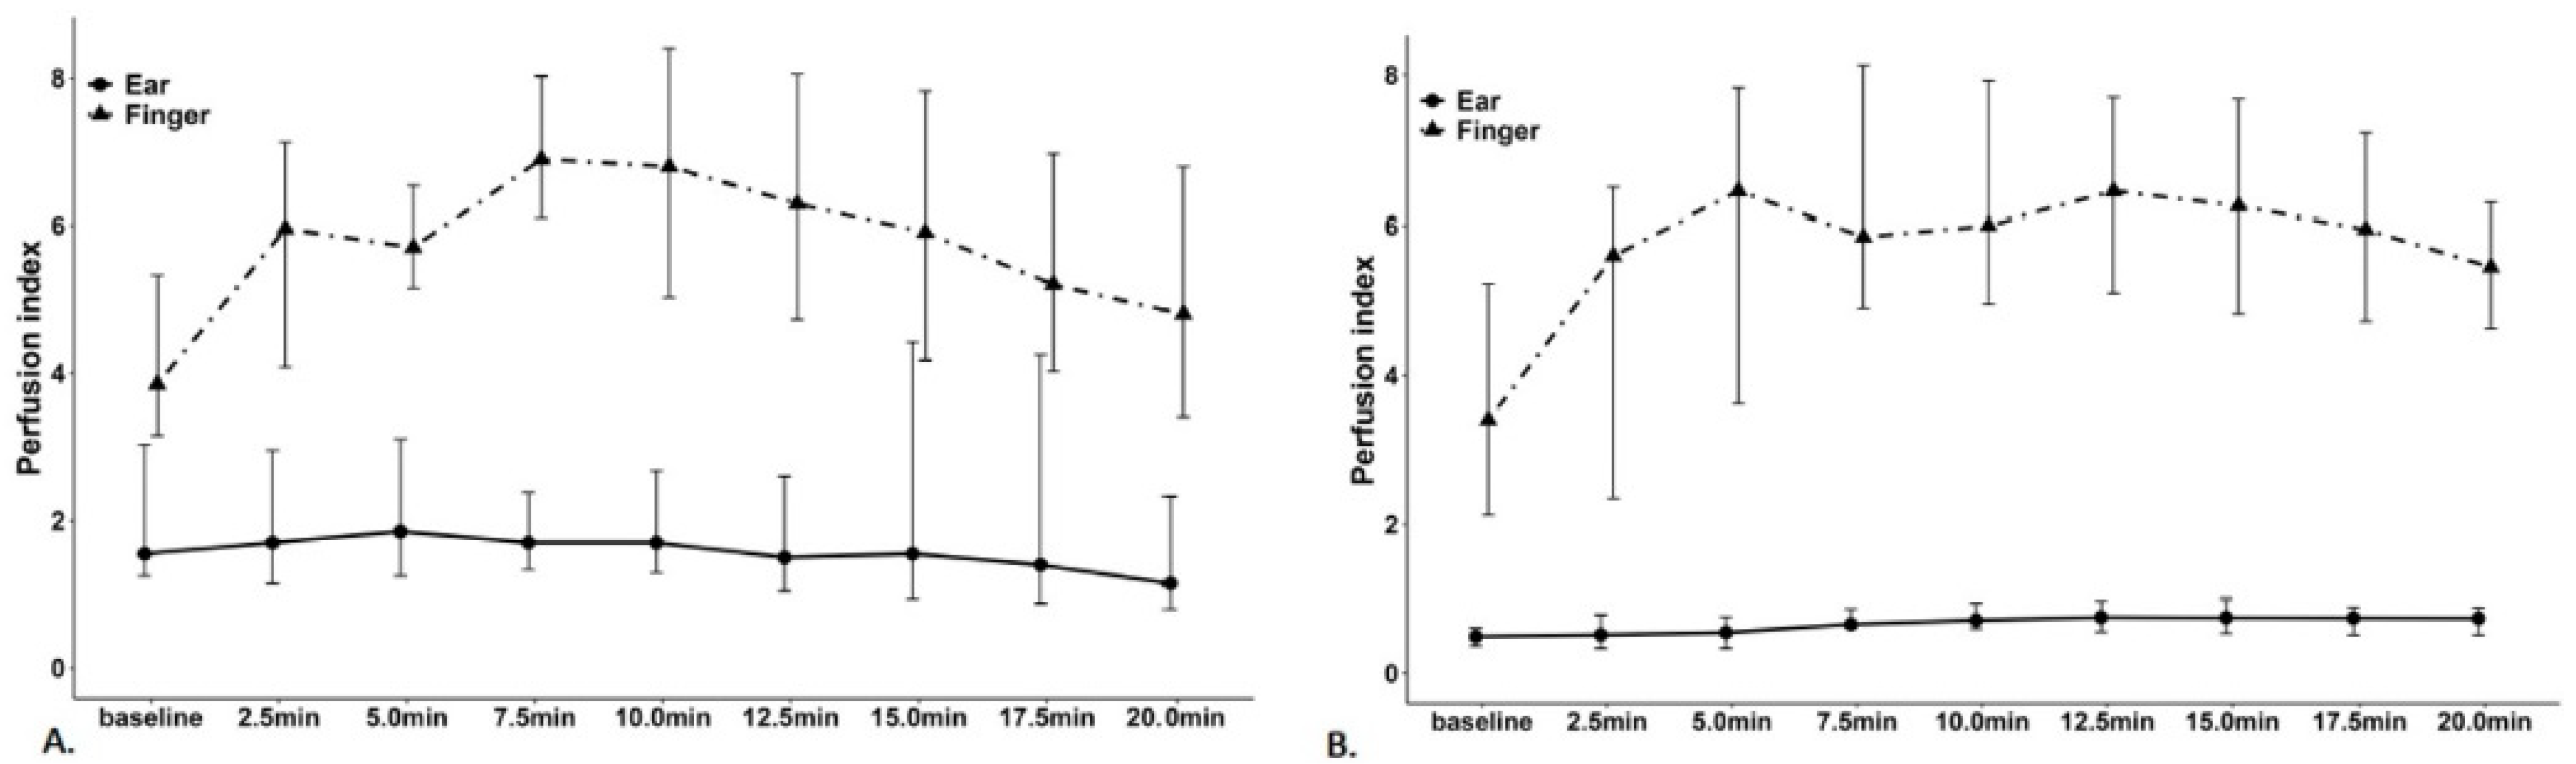
3.2. Hemodynamic Variables
3.3. Prediction of the Post-Induction Hypotension
4. Discussion
5. Conclusions
Supplementary Materials
Author Contributions
Funding
Institutional Review Board Statement
Informed Consent Statement
Data Availability Statement
Conflicts of Interest
References
- Wachtendorf, L.J.; Azimaraghi, O.; Santer, P.; Linhardt, F.C.; Blank, M.; Suleiman, A.; Ahn, C.; Low, Y.H.; Teja, B.; Kendale, S.M.; et al. Association Between Intraoperative Arterial Hypotension and Postoperative Delirium After Noncardiac Surgery: A Retrospective Multicenter Cohort Study. Anesth. Analg. 2022, 134, 822–833. [Google Scholar] [CrossRef] [PubMed]
- Rangasamy, V.; de Guerre, L.; Xu, X.; Schermerhorn, M.L.; Novack, V.; Subramaniam, B. Association Between Intraoperative Hypotension and Postoperative Adverse Outcomes in Patients Undergoing Vascular Surgery-A Retrospective Observational Study. J. Cardiothorac. Vasc. Anesth. 2021, 35, 1431–1438. [Google Scholar] [CrossRef] [PubMed]
- Liao, P.; Zhao, S.; Lyu, L.; Yi, X.; Ji, X.; Sun, J.; Jia, Y.; Zhou, Z. Association of intraoperative hypotension with acute kidney injury after liver resection surgery: An observational cohort study. BMC Nephrol. 2020, 21, 456. [Google Scholar] [CrossRef] [PubMed]
- Levin, M.A.; Fischer, G.W.; Lin, H.M.; McCormick, P.J.; Krol, M.; Reich, D.L. Intraoperative arterial blood pressure lability is associated with improved 30 day survival. Br. J. Anaesth. 2015, 115, 716–726. [Google Scholar] [CrossRef] [PubMed] [Green Version]
- Reich, D.L.; Hossain, S.; Krol, M.; Baez, B.; Patel, P.; Bernstein, A.; Bodian, C.A. Predictors of hypotension after induction of general anesthesia. Anesth. Analg. 2005, 101, 622–628. [Google Scholar] [CrossRef] [PubMed]
- Südfeld, S.; Brechnitz, S.; Wagner, J.; Reese, P.; Pinnschmidt, H.; Reuter, D.; Saugel, B. Post-induction hypotension and early intraoperative hypotension associated with general anaesthesia. Br. J. Anaesth. 2017, 119, 57–64. [Google Scholar] [CrossRef] [Green Version]
- Saugel, B.; Bebert, E.-J.; Briesenick, L.; Hoppe, P.; Greiwe, G.; Yang, D.; Ma, C.; Mascha, E.J.; Sessler, D.I.; Rogge, D.E. Mechanisms contributing to hypotension after anesthetic induction with sufentanil, propofol, and rocuronium: A prospective observational study. J. Clin. Monit. Comput. 2022, 36, 341–347. [Google Scholar] [CrossRef]
- Charlson, M.E.; MacKenzie, C.R.; Gold, J.P.; Ales, K.L.; Topkins, M.; Shires, G.T. Preoperative characteristics predicting intraoperative hypotension and hypertension among hypertensives and diabetics undergoing noncardiac surgery. Ann. Surg. 1990, 212, 66. [Google Scholar]
- Crowther, M.; Van Der Spuy, K.; Roodt, F.; Nejthardt, M.; Davids, J.; Roos, J.; Cloete, E.; Pretorius, T.; Davies, G.; van der Walt, J. The relationship between pre-operative hypertension and intra-operative haemodynamic changes known to be associated with postoperative morbidity. Anaesthesia 2018, 73, 812–818. [Google Scholar] [CrossRef] [Green Version]
- Dabu-Bondoc, S.; Shelley, K.H. Management of comorbidities in ambulatory anesthesia: A review. Ambul. Anesth. 2015, 2, 39–51. [Google Scholar]
- Yancey, R. Anesthetic management of the hypertensive patient: Part II. Anesth. Prog. 2018, 65, 206–213. [Google Scholar] [CrossRef]
- Prys-Roberts, C.; Meloche, R.; Foex, P.; Ryder, A. Studies of anaesthesia in relation to hypertension I: Cardiovascular responses of treated and untreated patients. BJA Br. J. Anaesth. 1971, 43, 122–137. [Google Scholar] [CrossRef]
- Hashimoto, J. Central hemodynamics and target organ damage in hypertension. Tohoku J. Exp. Med. 2014, 233, 1–8. [Google Scholar] [CrossRef] [Green Version]
- Falotico, J.M.; Shinozaki, K.; Saeki, K.; Becker, L.B. Advances in the approaches using peripheral perfusion for monitoring hemodynamic status. Front. Med. 2020, 7, 614326. [Google Scholar] [CrossRef]
- Cho, S.U.; Han, K.H.; Ryu, S.; Yoo, I.S. Availability of the peripheral perfusion index for monitoring of hemodynamic stability in the Emergency Department. J. Korean Soc. Emerg. Med. 2011, 22, 59–64. [Google Scholar]
- Wilson, B.J.; Cowan, H.J.; Lord, J.A.; Zuege, D.J.; Zygun, D.A. The accuracy of pulse oximetry in emergency department patients with severe sepsis and septic shock: A retrospective cohort study. BMC Emerg. Med. 2010, 10, 9. [Google Scholar] [CrossRef] [PubMed] [Green Version]
- Venema, B.; Schiefer, J.; Blazek, V.; Blanik, N.; Leonhardt, S. Evaluating innovative in-ear pulse oximetry for unobtrusive cardiovascular and pulmonary monitoring during sleep. IEEE J. Transl. Eng. Health Med. 2013, 1, 2700208. [Google Scholar] [CrossRef] [PubMed]
- Cable, J.A. Evaluation of ear oximetry in the measurement of arterial oxygen saturation. J. Am. Osteopath. Assoc. 1981, 81, 87–96. [Google Scholar] [CrossRef]
- Tokuda, K.; Hayamizu, K.; Ogawa, K.; Hirai, T.; Irita, K. A comparison of finger, ear and forehead SpO2 on detecting oxygen desaturation in healthy volunteers. Anesthesiology 2007, 107, A1544. [Google Scholar]
- Haynes, J.M. The ear as an alternative site for a pulse oximeter finger clip sensor. Respir. Care 2007, 52, 727–729. [Google Scholar]
- Seifi, S.; Khatony, A.; Moradi, G.; Abdi, A.; Najafi, F. Accuracy of pulse oximetry in detection of oxygen saturation in patients admitted to the intensive care unit of heart surgery: Comparison of finger, toe, forehead and earlobe probes. BMC Nurs. 2018, 17, 1–7. [Google Scholar] [CrossRef] [PubMed]
- Mehandale, S.G.; Rajasekhar, P. Perfusion index as a predictor of hypotension following propofol induction-A prospective observational study. Indian J. Anaesth. 2017, 61, 990–995. [Google Scholar] [CrossRef] [PubMed]
- Jablonka, D.H.; Awad, A.A.; Stout, R.G.; Silverman, D.G.; Shelley, K.H. Comparing the effect of arginine vasopressin on ear and finger photoplethysmography. J. Clin. Anesth. 2008, 20, 90–93. [Google Scholar] [CrossRef]
- Awad, A.A.; Stout, R.G.; Ghobashy, M.A.M.; Rezkanna, H.A.; Silverman, D.G.; Shelley, K.H. Analysis of the ear pulse oximeter waveform. J. Clin. Monit. Comput. 2006, 20, 175–184. [Google Scholar] [CrossRef]
- Budidha, K.; Kyriacou, P. The human ear canal: Investigation of its suitability for monitoring photoplethysmographs and arterial oxygen saturation. Physiol. Meas. 2014, 35, 111. [Google Scholar] [CrossRef]
- Budidha, K.; Kyriacou, P. In vivo investigation of ear canal pulse oximetry during hypothermia. J. Clin. Monit. Comput. 2018, 32, 97–107. [Google Scholar] [CrossRef] [Green Version]
- Venema, B.; Blanik, N.; Blazek, V.; Gehring, H.; Opp, A.; Leonhardt, S. Advances in reflective oxygen saturation monitoring with a novel in-ear sensor system: Results of a human hypoxia study. IEEE Trans. Biomed. Eng. 2012, 59, 2003–2010. [Google Scholar] [CrossRef]
- Lima, A.P.; Beelen, P.; Bakker, J. Use of a peripheral perfusion index derived from the pulse oximetry signal as a noninvasive indicator of perfusion. Crit. Care Med. 2002, 30, 1210–1213. [Google Scholar] [CrossRef]
- Lima, A.; Bakker, J. Noninvasive monitoring of peripheral perfusion. Appl. Physiol. Intensive Care Med. 2006, 31, 131–141. [Google Scholar]
- Tapar, H.; Karaman, S.; Dogru, S.; Karaman, T.; Sahin, A.; Tapar, G.G.; Altiparmak, F.; Suren, M. The effect of patient positions on perfusion index. BMC Anesthesiol. 2018, 18, 111. [Google Scholar] [CrossRef] [PubMed]
- Beurton, A.; Teboul, J.-L.; Gavelli, F.; Gonzalez, F.A.; Girotto, V.; Galarza, L.; Anguel, N.; Richard, C.; Monnet, X. The effects of passive leg raising may be detected by the plethysmographic oxygen saturation signal in critically ill patients. Crit. Care 2019, 23, 19. [Google Scholar] [CrossRef] [PubMed] [Green Version]
- Lian, H.; Wang, X.; Zhang, Q.; Zhang, H.; Liu, D. Changes in perfusion can detect changes in the cardiac index in patients with septic shock. J. Int. Med. Res. 2020, 48, 0300060520931675. [Google Scholar] [CrossRef] [PubMed]
- van Genderen, M.E.; Bartels, S.A.; Lima, A.; Bezemer, R.; Ince, C.; Bakker, J.; van Bommel, J. Peripheral perfusion index as an early predictor for central hypovolemia in awake healthy volunteers. Anesth. Analg. 2013, 116, 351–356. [Google Scholar] [CrossRef] [PubMed] [Green Version]
- Jorge, D.B.; Shane, V.; Raza, A.; Berthold, B. A clinical review of inhalation anesthesia with sevoflurane: From early research to emerging topics. J. Anesth. Jpn. Soc. Anesthesiol. 2017, 31, 764–778. [Google Scholar]
- Larach, D.R.; Schuler, H.G. Direct vasodilation by sevoflurane, isoflurane, and halothane alters coronary flow reserve in the isolated rat heart. Anesthesiology 1991, 75, 268–278. [Google Scholar] [CrossRef]
- Ryu, K.-H.; Hwang, S.-H.; Shim, J.-G.; Ahn, J.-H.; Cho, E.-A.; Lee, S.-H.; Byun, J.-H. Comparison of vasodilatory properties between desflurane and sevoflurane using perfusion index: A randomised controlled trial. Br. J. Anaesth. 2020, 125, 935–942. [Google Scholar] [CrossRef]
- Martinez-Quinones, P.; McCarthy, C.G.; Watts, S.W.; Klee, N.S.; Komic, A.; Calmasini, F.B.; Priviero, F.; Warner, A.; Chenghao, Y.; Wenceslau, C.F. Hypertension induced morphological and physiological changes in cells of the arterial wall. Am. J. Hypertens. 2018, 31, 1067–1078. [Google Scholar] [CrossRef]
- Mayet, J.; Hughes, A. Cardiac and vascular pathophysiology in hypertension. Heart 2003, 89, 1104–1109. [Google Scholar] [CrossRef]
- Michas, F.; Manios, E.; Stamatelopoulos, K.; Koroboki, E.; Toumanidis, S.; Panerai, R.B.; Zakopoulos, N. Baroreceptor reflex sensitivity is associated with arterial stiffness in a population of normotensive and hypertensive patients. Blood Press. Monit. 2012, 17, 155–159. [Google Scholar] [CrossRef]
- Heusser, K.; Tank, J.; Luft, F.C.; Jordan, J. Baroreflex failure. Hypertension 2005, 45, 834–839. [Google Scholar] [CrossRef] [Green Version]
- Garson, L.M. Pocket Anesthesia. Anesth. Analg. 2017, 124, 2081. [Google Scholar] [CrossRef]
- Koren, M.J.; Devereux, R.B.; Casale, P.N.; Savage, D.D.; Laragh, J.H. Relation of left ventricular mass and geometry to morbidity and mortality in uncomplicated essential hypertension. Ann. Intern. Med. 1991, 114, 345–352. [Google Scholar] [CrossRef] [PubMed]
- Yildiz, M.; Oktay, A.A.; Stewart, M.H.; Milani, R.V.; Ventura, H.O.; Lavie, C.J. Left ventricular hypertrophy and hypertension. Prog. Cardiovasc. Dis. 2020, 63, 10–21. [Google Scholar] [CrossRef] [PubMed]
- Højlund, J.; Agerskov, M.; Clemmesen, C.; Hvolris, L.E.; Foss, N. The Peripheral Perfusion Index tracks systemic haemodynamics during general anaesthesia. J. Clin. Monit. Comput. 2020, 34, 1177–1184. [Google Scholar] [CrossRef] [PubMed]
- Oyetunji, T.A.; Chang, D.C.; Crompton, J.G.; Greene, W.R.; Efron, D.T.; Haut, E.R.; Cornwell, E.E.; Haider, A.H. Redefining hypotension in the elderly: Normotension is not reassuring. Arch. Surg. 2011, 146, 865–869. [Google Scholar] [CrossRef] [PubMed]

| Variable | Subgroup | Non-Hypotension Group (n = 10) | Hypotension Group (n = 20) | p-Value |
|---|---|---|---|---|
| Sex | 0.440 | |||
| Male | 7 (70) | 10 (50) | ||
| Female | 3 (30) | 10 (50) | ||
| Age (years) | 68 (66.75–73.25) | 65.5 (58.75–71.75) | 0.074 | |
| Height (cm) | 166.5 (162.75–170) | 159.5 (151–166.5) | 0.058 | |
| Weight (kg) | 66 (61.5–75.25) | 64.5 (59.25–71.5) | 0.441 | |
| BMI (kg/m2) | 24.74 (22.27–27.89) | 24.72 (22.86–28.74) | 0.914 | |
| Underlying disease | 0.690 | |||
| HTN | 6 (60) | 14 (70) | ||
| HTN/DM | 4 (40) | 6 (30) | ||
| Propofol dose (mg) | 70.85 (65.35–79.23) | 70.25 (62.43–80.15) | 0.509 |
| Variable | Non-Hypotension Group (n = 10) | Hypotension Group (n = 20) | p-Value |
|---|---|---|---|
| SBP (mmHg) | 142.5 (135.5–165.25) | 142.5 (131.5–156) | 0.403 |
| DBP (mmHg) | 79.0 (76–88.5) | 76.5 (70–88.75) | 0.692 |
| MBP (mmHg) | 96.5 (92.75–109) | 97.0 (91.5–103.75) | 0.843 |
| HR (beats/min) | 63.5 (58–76) | 67.5 (59.75–73) | 0.377 |
| Finger | |||
| PVI | 11.0 (6.75–22.75) | 10.0 (8–14.75) | 0.566 |
| PI | 3.85 (3.15–5.33) | 3.4 (2.12–5.22) | 0.355 |
| Ear | |||
| PVI | 15.0 (11.75–20.75) | 18.0 (14–21) | 0.354 |
| PI | 1.55 (1.25–3.03) | 0.49 (0.36–0.6) | <0.001 * |
| Variable | Rho (95% CIs) | p-Value |
|---|---|---|
| SBP (mmHg) | 0.062 (−0.306–0.413) | 0.745 |
| DBP (mmHg) | 0.211 (−0.165–0.534) | 0.262 |
| MBP (mmHg) | 0.108 (−0.264–0.451) | 0.571 |
| HR (beats/min) | −0.071 (−0.421–0.297) | 0.710 |
| Finger | ||
| PVI | 0.231 (−0.146–0.549) | 0.219 |
| PI | 0.331 (−0.043–0.624) | 0.074 |
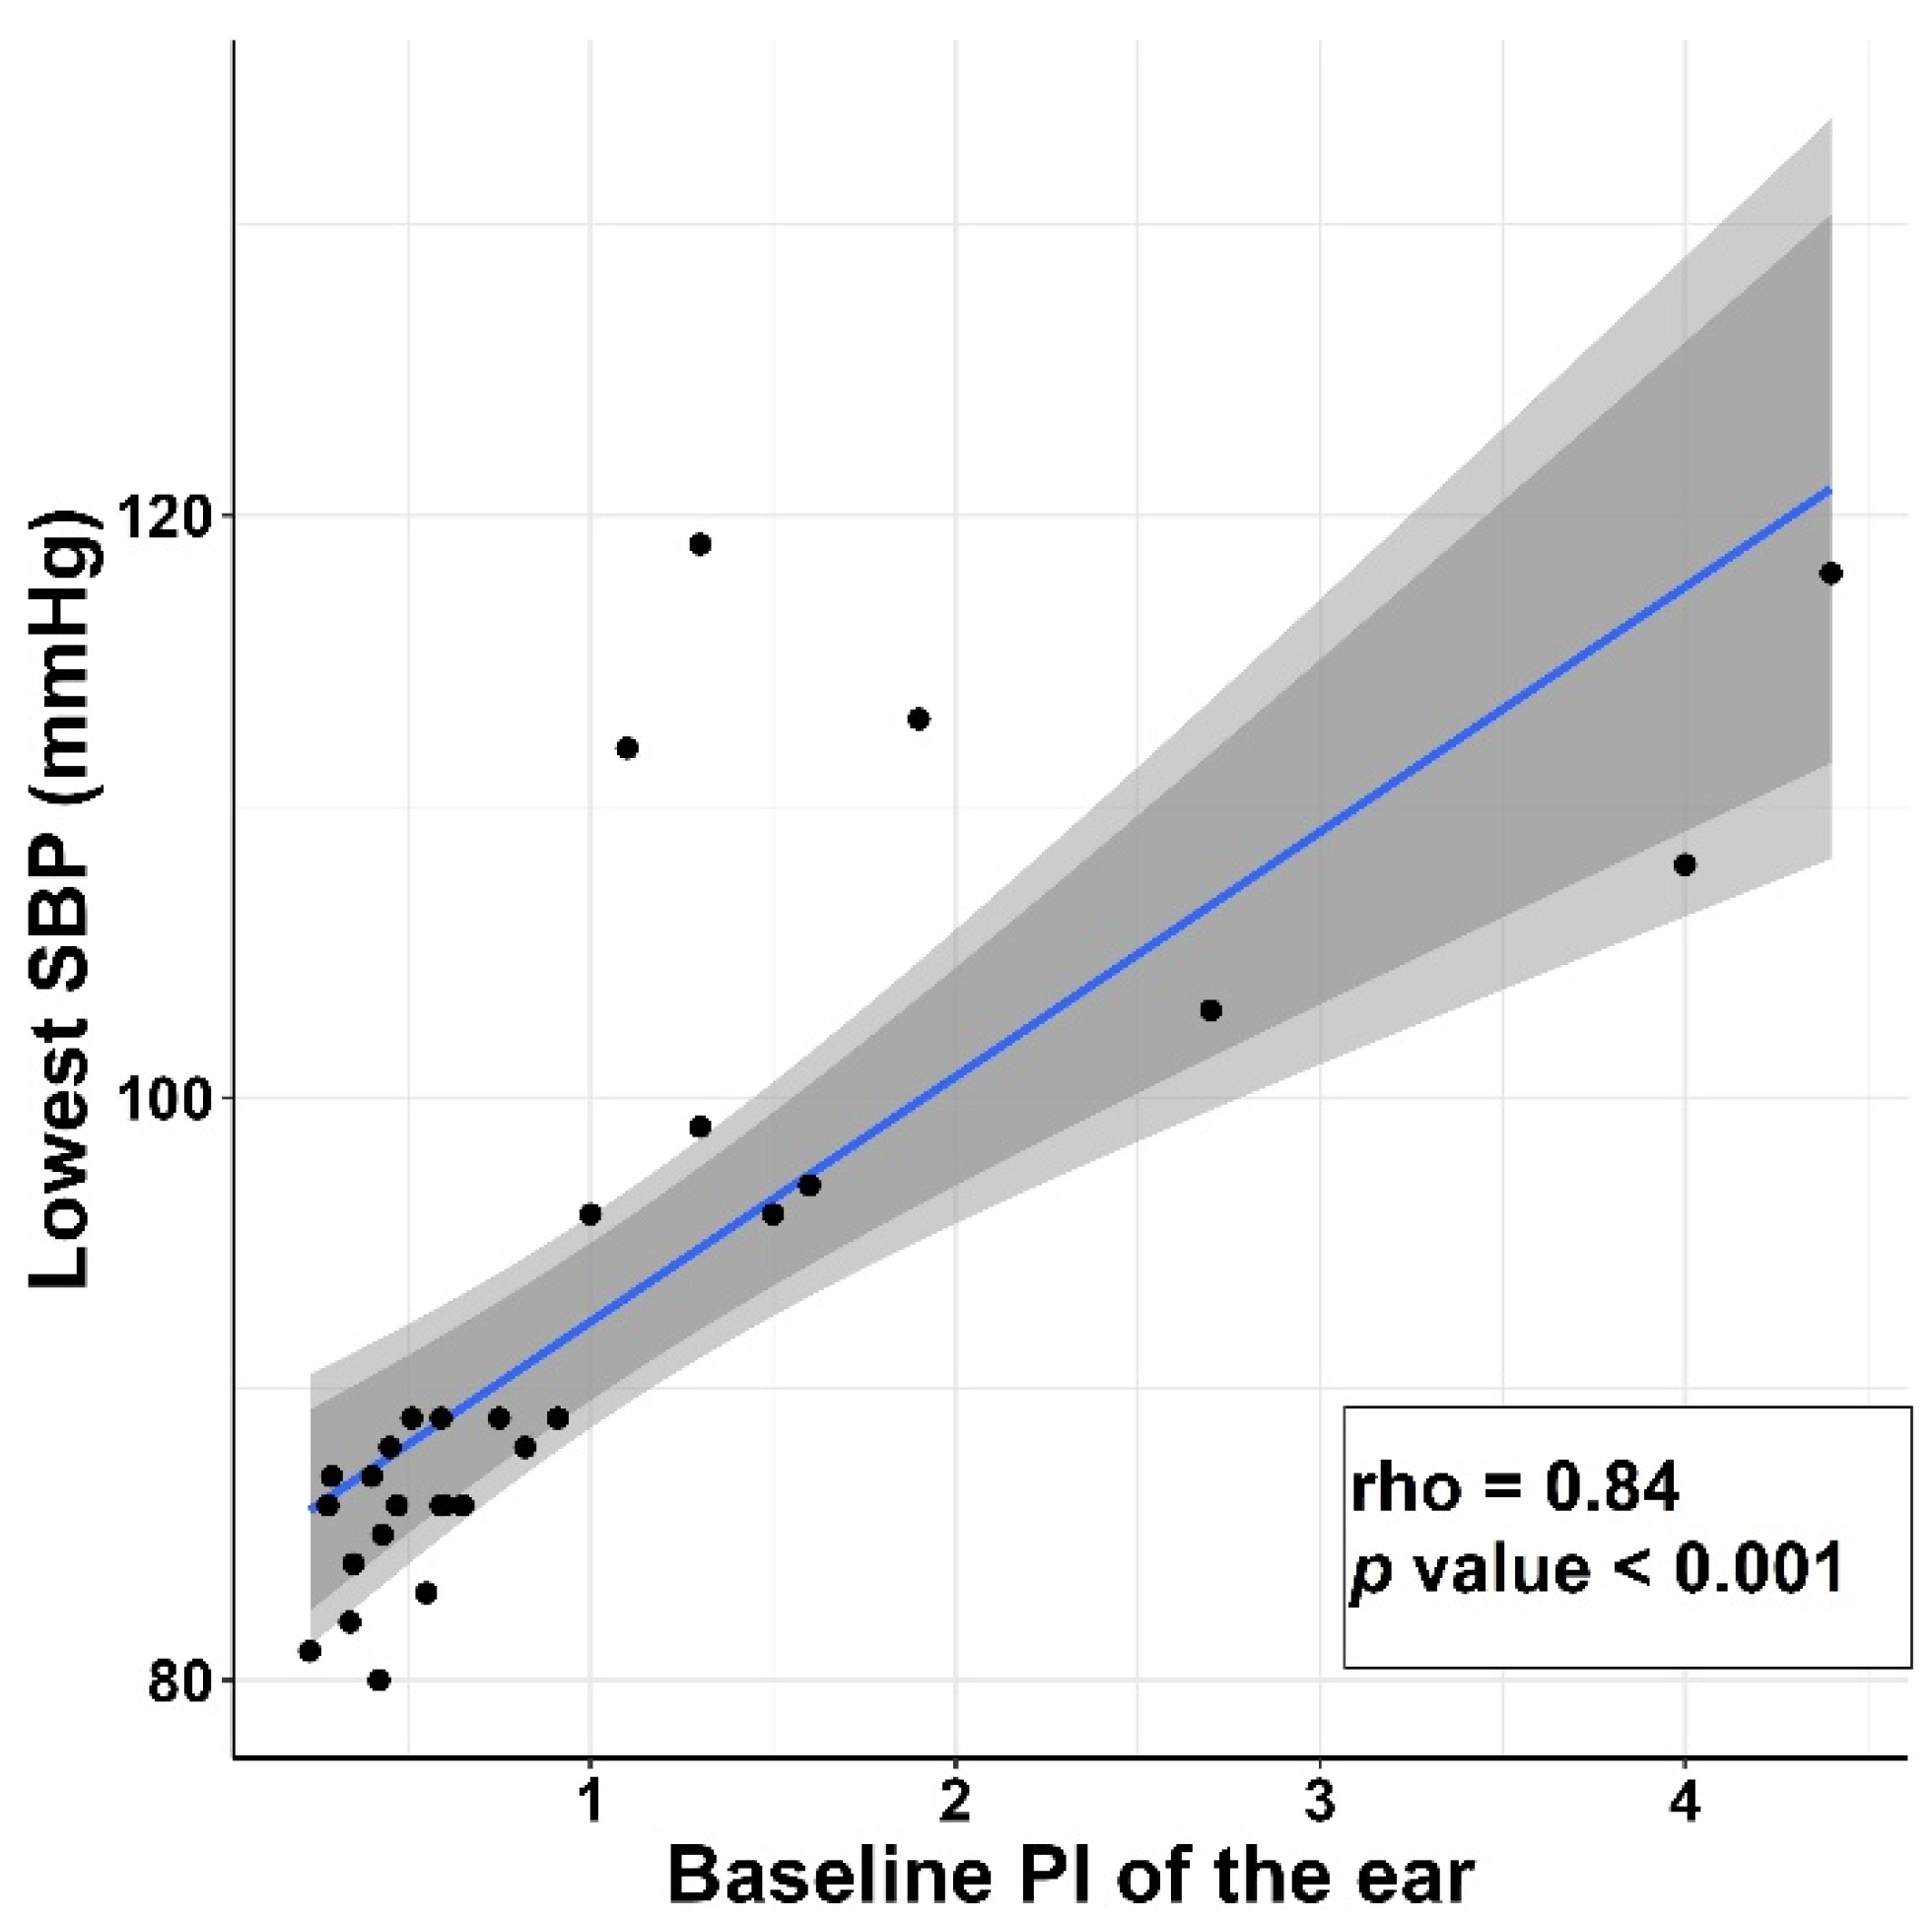
| Ear | ||
| PVI | −0.243 (−0.558–0.134) | 0.196 |
| PI | 0.839 (0.652–0.930) | <0.001 * |
| Variable | AUC (95% CIs) | p-Value | Sensitivity | Specificity | Cutoff |
|---|---|---|---|---|---|
| SBP (mmHg) | 0.597 (0.376–0.819) | 0.391 | 0.35 | 0.9 | ≤133.5 |
| DBP (mmHg) | 0.548 (0.330–0.765) | 0.676 | 0.50 | 0.8 | ≤76 |
| MBP (mmHg) | 0.525 (0.293–0.757) | 0.826 | 0.90 | 0.3 | ≤106.5 |
| HR (beat/min) | 0.602 (0.362–0.843) | 0.367 | 0.95 | 0.3 | ≥58.5 |
| Finger | |||||
| PVI | 0.568 (0.318–0.817) | 0.553 | 0.95 | 0.3 | ≤20 |
| PI | 0.608 (0.396–0.819) | 0.344 | 0.40 | 0.9 | ≤2.75 |
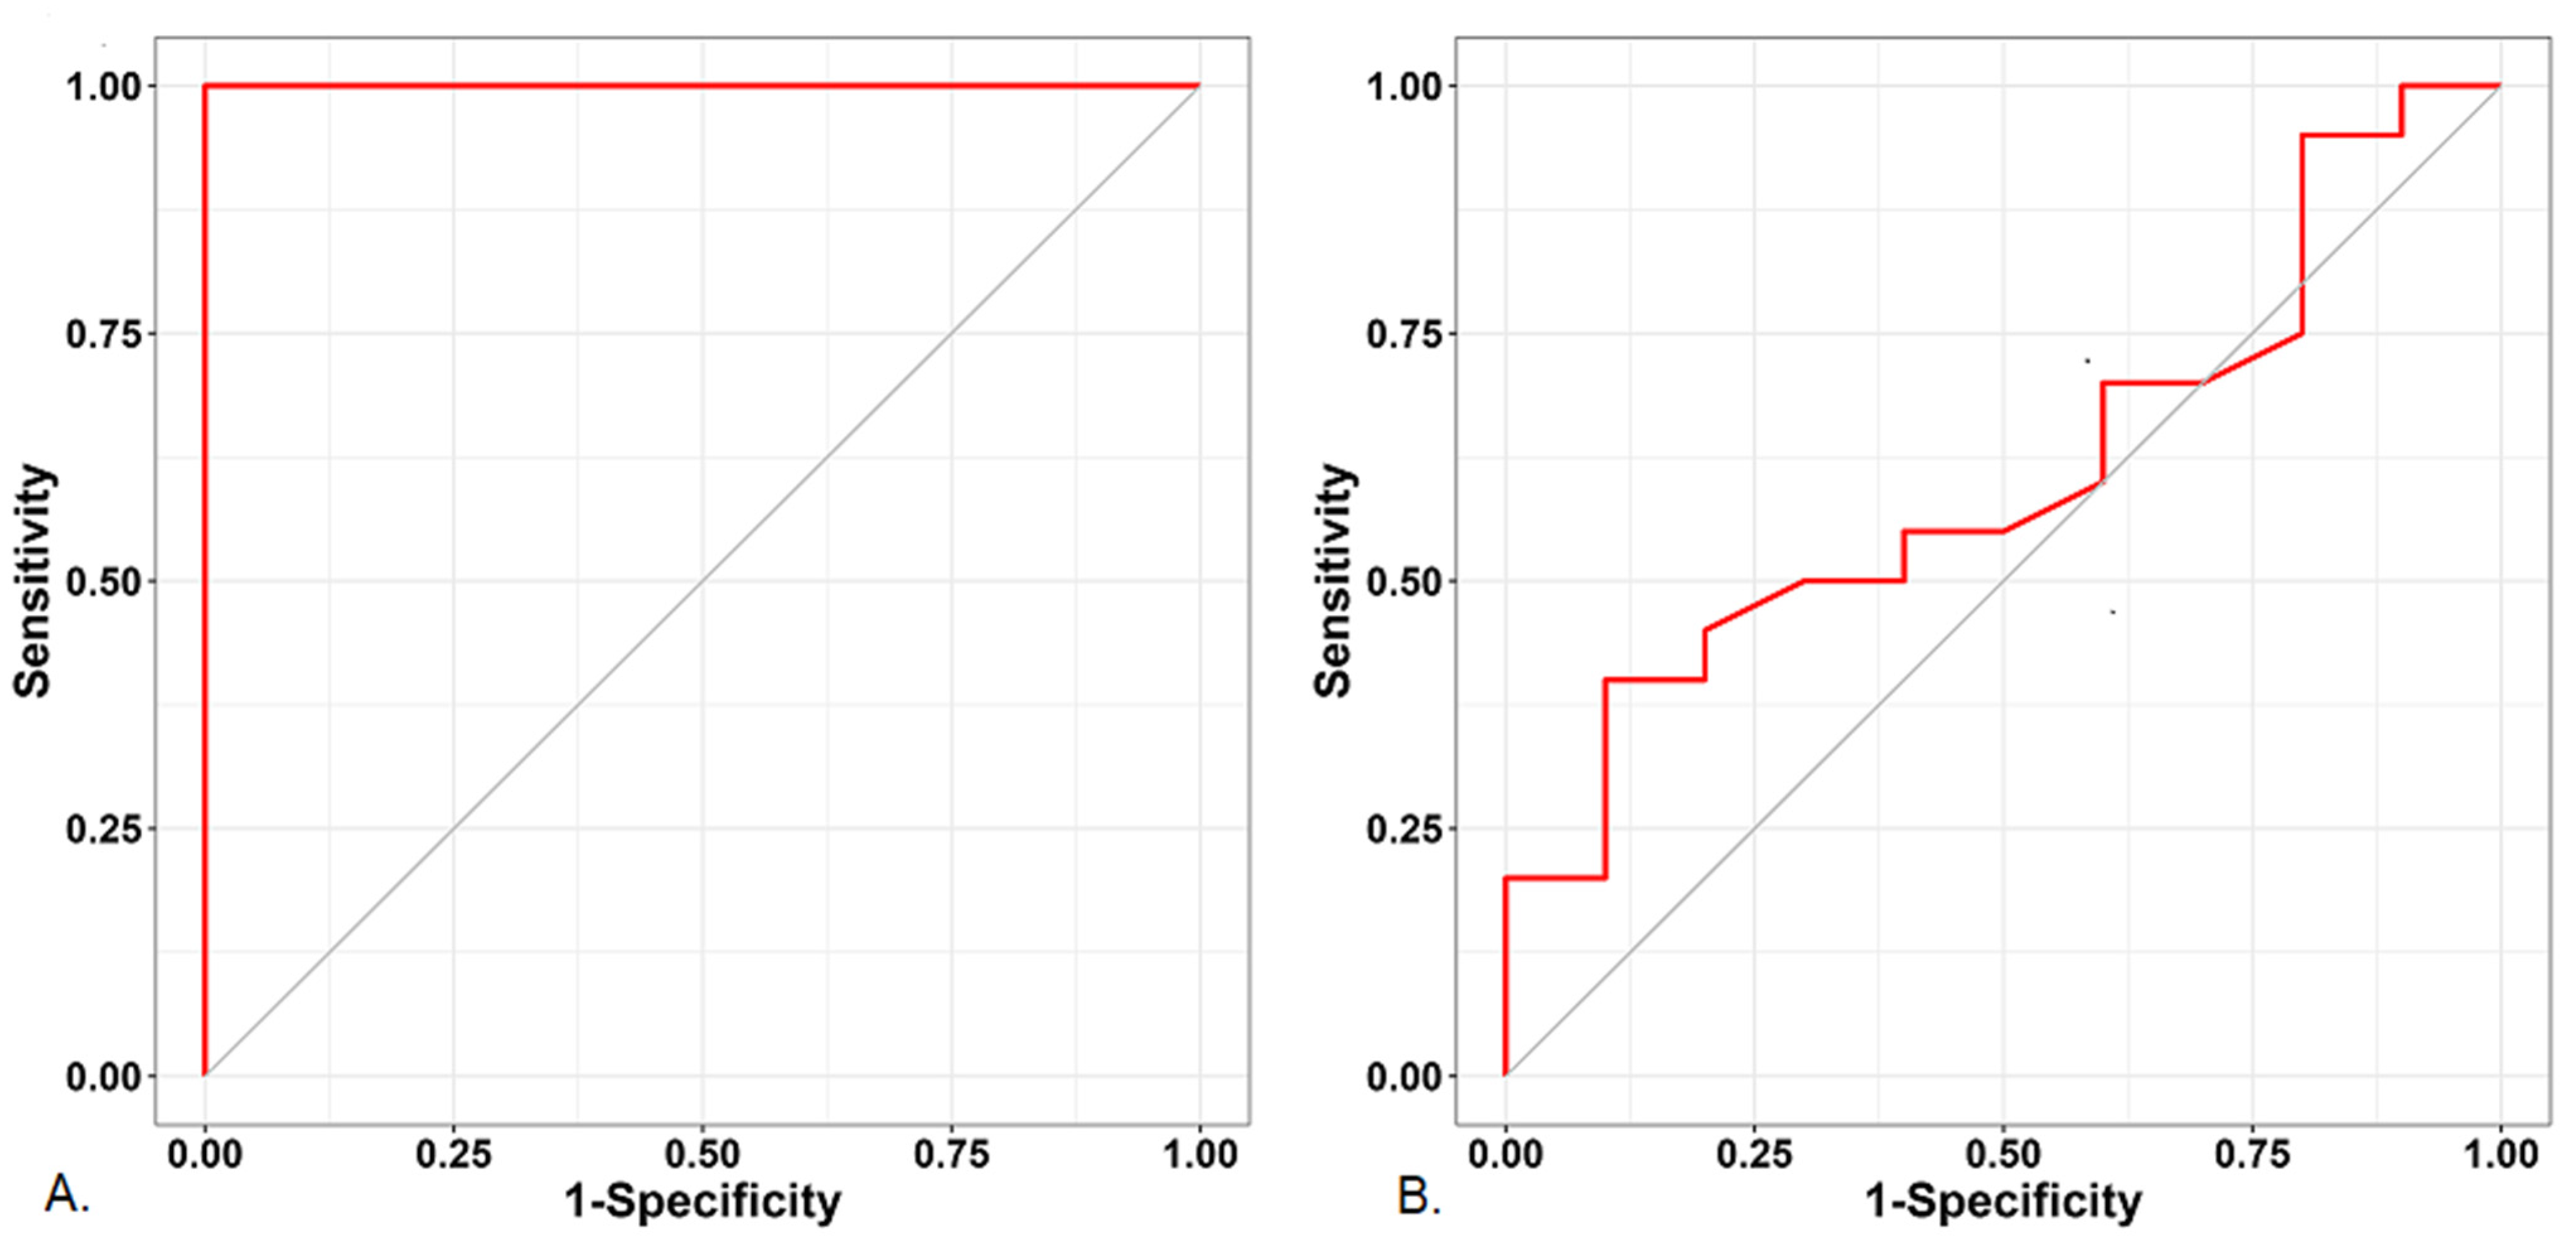
| Ear | |||||
| PVI | 0.608 (0.368–0.847) | 0.344 | 0.95 | 0.3 | ≥12.5 |
| PI | 1.000 (1.000–1.000) | <0.001 | 1.00 | 1.0 | ≤0.96 |
Publisher’s Note: MDPI stays neutral with regard to jurisdictional claims in published maps and institutional affiliations. |
© 2022 by the authors. Licensee MDPI, Basel, Switzerland. This article is an open access article distributed under the terms and conditions of the Creative Commons Attribution (CC BY) license (https://creativecommons.org/licenses/by/4.0/).
Share and Cite
Min, J.Y.; Chang, H.J.; Chu, S.J.; Chung, M.Y. The Perfusion Index of the Ear as a Predictor of Hypotension Following the Induction of Anesthesia in Patients with Hypertension: A Prospective Observational Study. J. Clin. Med. 2022, 11, 6342. https://doi.org/10.3390/jcm11216342
Min JY, Chang HJ, Chu SJ, Chung MY. The Perfusion Index of the Ear as a Predictor of Hypotension Following the Induction of Anesthesia in Patients with Hypertension: A Prospective Observational Study. Journal of Clinical Medicine. 2022; 11(21):6342. https://doi.org/10.3390/jcm11216342
Chicago/Turabian StyleMin, Ji Young, Hyun Jae Chang, Su Jung Chu, and Mee Young Chung. 2022. "The Perfusion Index of the Ear as a Predictor of Hypotension Following the Induction of Anesthesia in Patients with Hypertension: A Prospective Observational Study" Journal of Clinical Medicine 11, no. 21: 6342. https://doi.org/10.3390/jcm11216342