
The Usefulness of Vanin-1 and Periostin as Markers of an Active Autoimmune Process or Renal Fibrosis in Children with IgA Nephropathy and IgA Vasculitis with Nephritis—A Pilot Study

 ,
,
Abstract
:1. Introduction
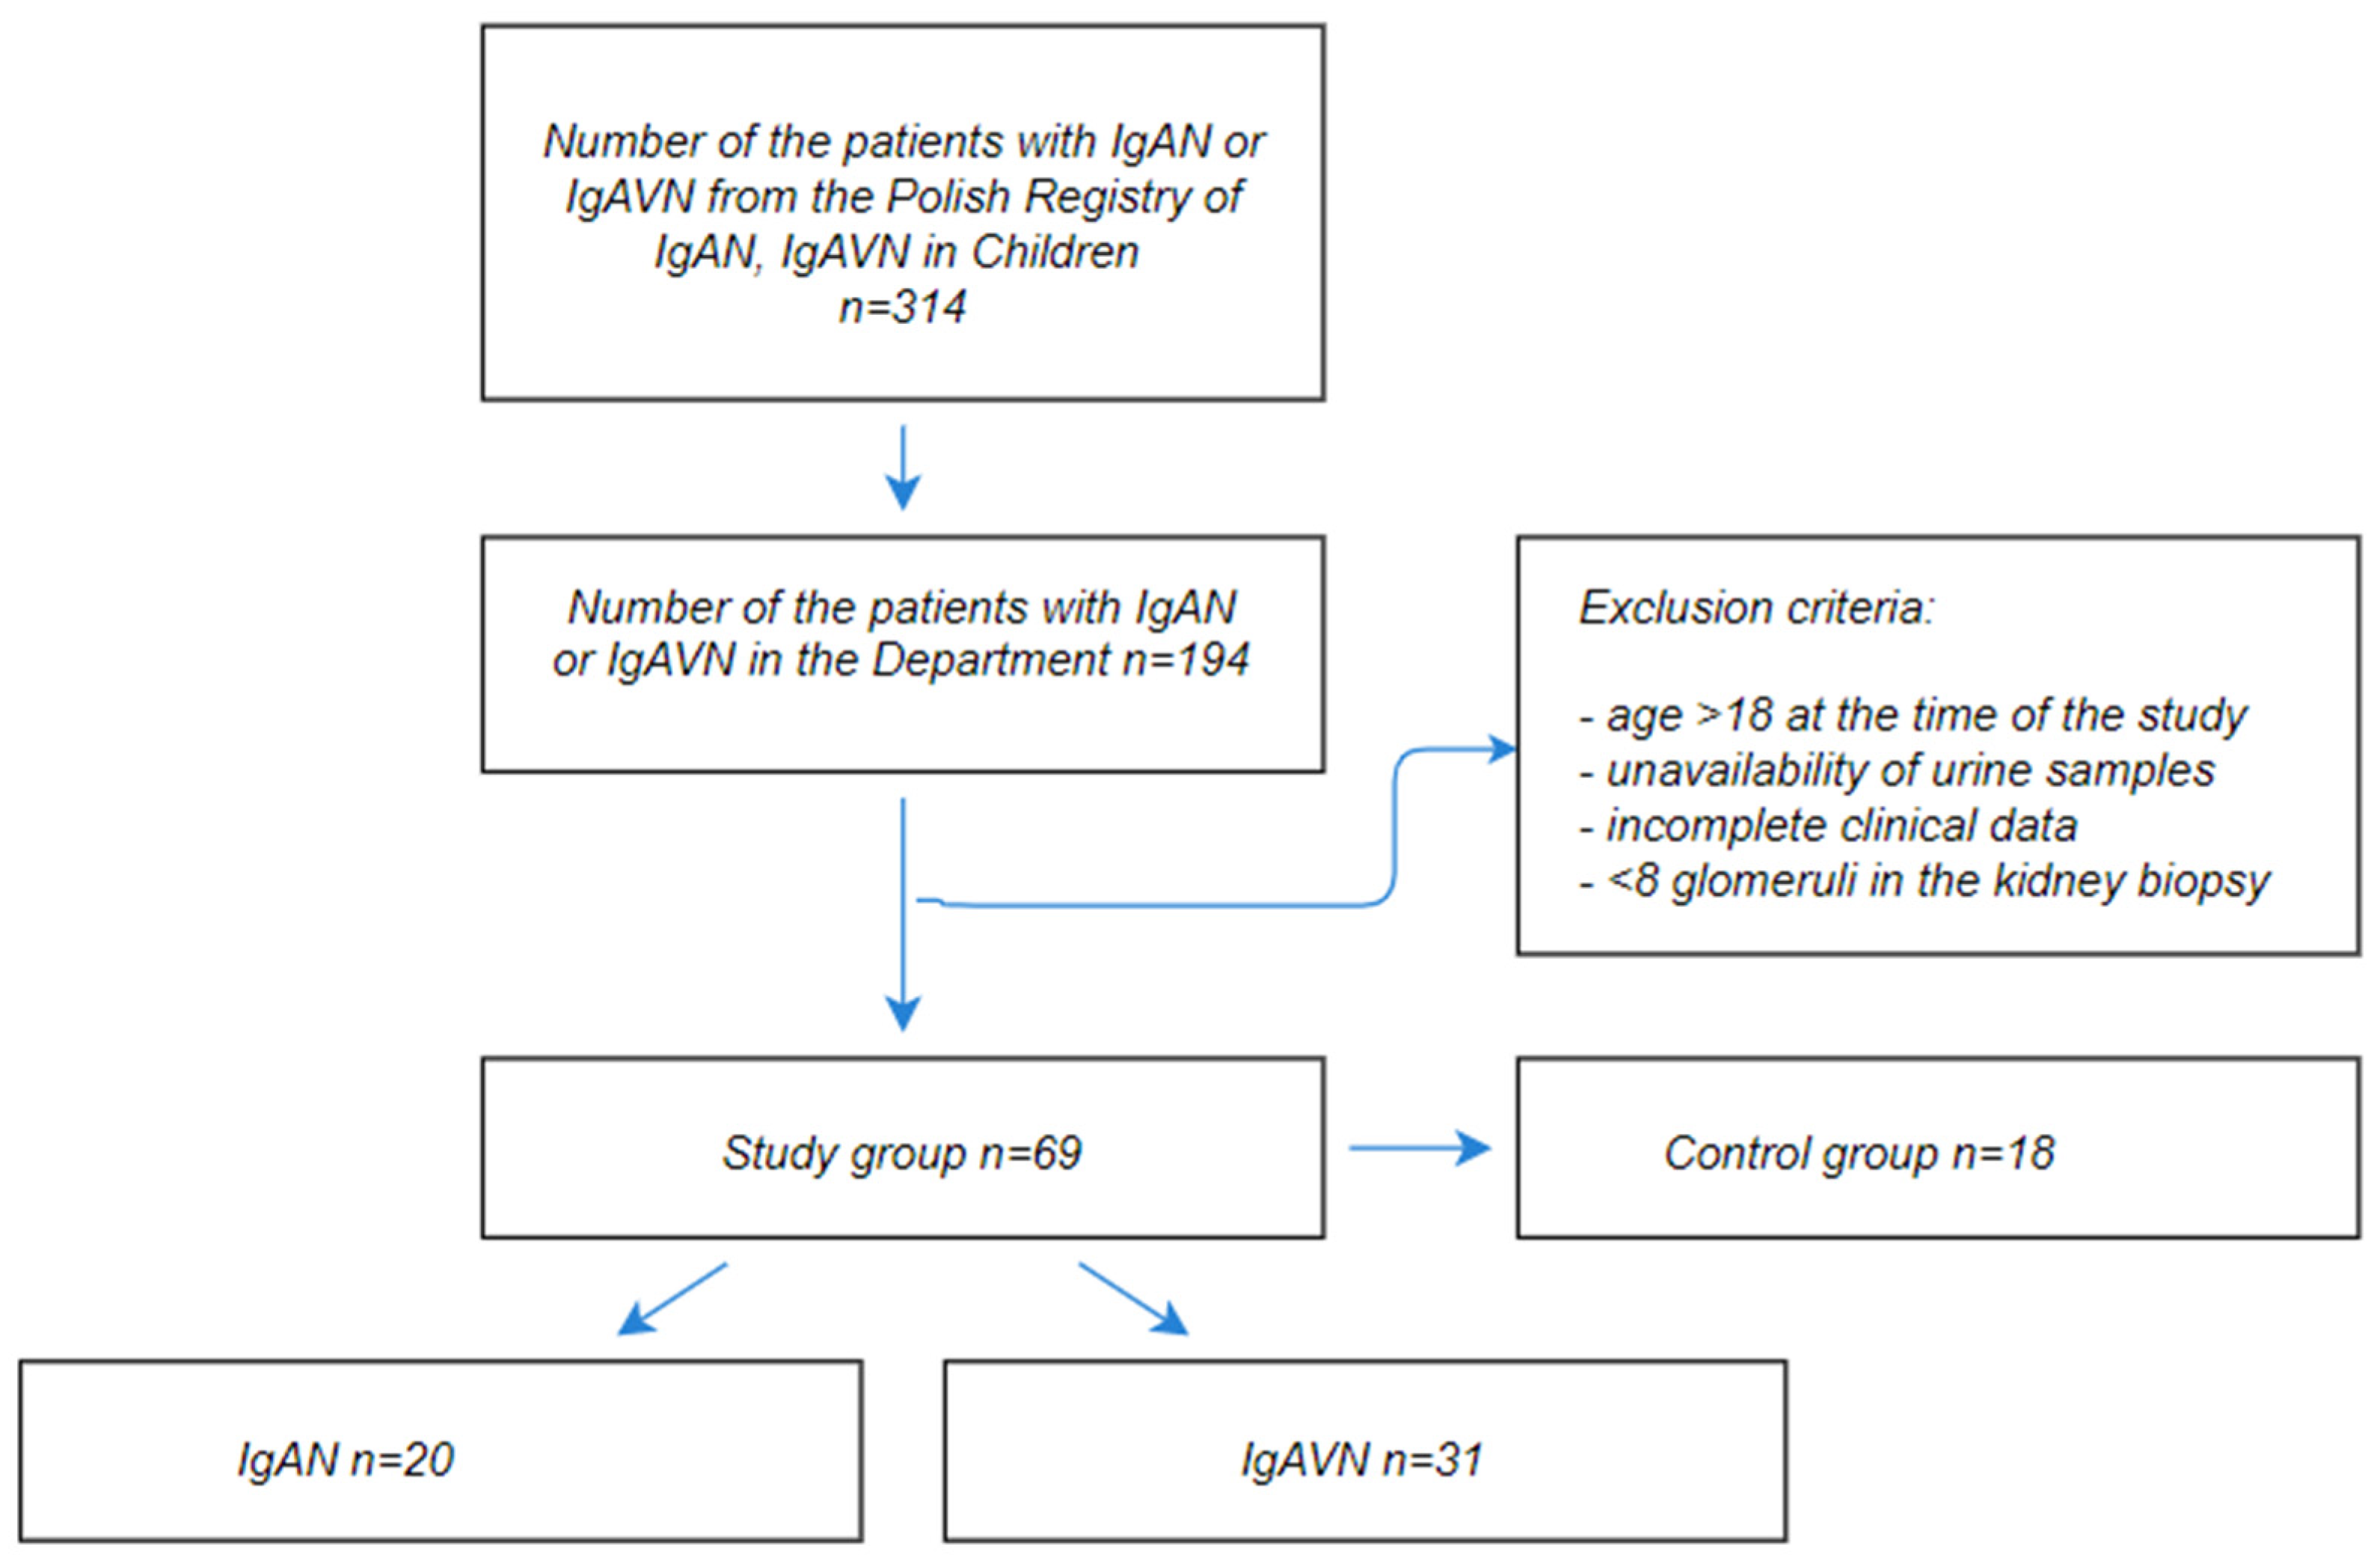
2. Materials and Methods
2.1. Clinical and Biological Features
2.2. Renal Biopsy
2.3. Treatment
2.4. Monitoring and Follow-Up
3. Results
4. Discussion
Limitations
5. Conclusions
Author Contributions
Funding
Institutional Review Board Statement
Informed Consent Statement
Data Availability Statement
Conflicts of Interest
References
- Saha, M.K.; Julian, B.A.; Novak, J.; Rizk, D.V. Secondary IgA nephropathy. Kidney Int. 2018, 94, 674–681. [Google Scholar] [CrossRef] [PubMed]
- Habib, R.; Murcia, I.; Beaufils, H.; Niaudet, P. Primary IgA nephropathies in children. Biomed. Pharmacother. 1990, 44, 159–162. [Google Scholar] [CrossRef]
- Suzuki, H.; Yasutake, J.; Makita, Y.; Tanbo, Y.; Yamasaki, K.; Sofue, T.; Kano, T.; Suzuki, Y. IgA nephropathy and IgA vasculitis with nephritis have a shared feature involving galactose-deficient IgA1-oriented pathogenesis. Kidney Int. 2018, 93, 700–705. [Google Scholar] [CrossRef] [PubMed] [Green Version]
- Kawasaki, Y.; Maeda, R.; Ohara, S.; Suyama, K.; Hosoya, M. Serum IgA/C3 and glomerular C3 staining predict severity of IgA nephropathy. Pediatr. Int. 2018, 60, 162–167. [Google Scholar] [CrossRef]
- Schena, F.P.; Nistor, I. Epidemiology of IgA Nephropathy: A Global Perspective. Semin. Nephrol. 2018, 38, 435–442. [Google Scholar] [CrossRef]
- Sehic, A.M.; Gaber, L.W.; Iii, S.R.; Miller, P.M.; Kritchevsky, S.B.; Wyatt, R. Increased recognition of IgA nephropathy in African-American children. Pediatr. Nephrol. 1997, 11, 435–437. [Google Scholar] [CrossRef]
- Utsunomiya, Y.; Koda, T.; Kado, T.; Okada, S.; Hayashi, A.; Kanzaki, S.; Kasagi, T.; Hayashibara, H.; Okasora, T. Incidence of pediatric IgA nephropathy. Pediatr. Nephrol. 2003, 18, 511–515. [Google Scholar] [CrossRef]
- Oni, L.; Sampath, S. Childhood IgA Vasculitis (Henoch Schonlein Purpura)—Advances and Knowledge Gaps. Front. Pediatr. 2019, 7, 257. [Google Scholar] [CrossRef]
- Dyga, K.; Szczepanska, M. IgA vasculitis with nephritis in children. Adv. Clin. Exp. Med. 2020, 29, 513–519. [Google Scholar] [CrossRef]
- González-Gay, M.A.; López-Mejias, R.; Pina, T.; Blanco, R.; Castañeda, S. IgA Vasculitis: Genetics and Clinical and Therapeutic Management. Curr. Rheumatol. Rep. 2018, 20, 24. [Google Scholar] [CrossRef]
- Demir, S.; Kaplan, O.; Celebier, M.; Sag, E.; Bilginer, Y.; Lay, I.; Ozen, S. Predictive biomarkers of IgA vasculitis with nephritis by metabolomic analysis. Semin. Arthritis Rheum. 2020, 50, 1238–1244. [Google Scholar] [CrossRef] [PubMed]
- Wyatt, R.J.; Julian, B.A. IgA nephropathy. N. Engl. J. Med. 2013, 368, 2402–2414. [Google Scholar] [CrossRef] [Green Version]
- Novak, J.; Barratt, J.; Julian, B.A.; Renfrow, M.B. Aberrant Glycosylation of the IgA1 Molecule in IgA Nephropathy. Semin. Nephrol. 2018, 38, 461–476. [Google Scholar] [CrossRef] [PubMed]
- Magistroni, R.; D’Agati, V.D.; Appel, G.B.; Kiryluk, K. New developments in the genetics, pathogenesis, and therapy of IgA nephropathy. Kidney Int. 2015, 88, 974–989. [Google Scholar] [CrossRef] [PubMed] [Green Version]
- Rodrigues, J.C.; Haas, M.; Reich, H.N. Reich, IgA Nephropathy. Clin. J. Am. Soc. Nephrol. 2017, 12, 677–686. [Google Scholar] [CrossRef]
- Zhang, L.; Li, J.; Yang, S.; Huang, N.; Zhou, Q.; Yang, Q.; Yu, X. Clinicopathological features and risk factors analysis of IgA nephropathy associated with acute kidney injury. Ren. Fail. 2016, 38, 799–805. [Google Scholar] [CrossRef] [Green Version]
- Zhang, L.; Zhuang, X.; Liao, X. A proposed Oxford classification-based clinicopathological nomogram for predicting short-term renal outcomes in IgA nephropathy after acute kidney injury. Eur. J. Intern. Med. 2018, 52, 60–66. [Google Scholar] [CrossRef]
- Coppo, R. Treatment of IgA nephropathy: Recent advances and prospects. Nephrol. Ther. 2018, 14 (Suppl. S1), S13–S21. [Google Scholar] [CrossRef]
- Trimarchi, H.; Barratt, J.; Cattran, D.C.; Cook, H.T.; Coppo, R.; Haas, M.; Liu, Z.-H.; Roberts, I.S.; Yuzawa, Y.; Zhang, H.; et al. Oxford Classification of IgA nephropathy 2016: An update from the IgA Nephropathy Classification Working Group. Kidney Int. 2017, 91, 1014–1021. [Google Scholar] [CrossRef] [Green Version]
- Coppo, R.; Cattran, D.; Ian, S.D.R.; Troyanov, S.; Camilla, R.; Cook, T.; Feehally, J. The new Oxford Clinico-Pathological Classification of IgA nephropathy. Prilozi 2010, 31, 241–248. [Google Scholar]
- Hetland, L.; Susrud, K.; Lindahl, K.; Bygum, A. Henoch-Schönlein Purpura: A Literature Review. Acta Derm. Venereol. 2017, 97, 1160–1166. [Google Scholar] [CrossRef] [PubMed] [Green Version]
- Audemard-Verger, A.; Pillebout, E.; Guillevin, L.; Thervet, E.; Terrier, B. IgA vasculitis (Henoch–Shönlein purpura) in adults: Diagnostic and therapeutic aspects. Autoimmun. Rev. 2015, 14, 579–585. [Google Scholar] [CrossRef]
- Chen, J.Y.; Mao, J.H. Henoch-Schönlein purpura nephritis in children: Incidence, pathogenesis and management. World J. Pediatr. 2015, 11, 29–34. [Google Scholar] [CrossRef]
- Davin, J.C.; Ten Berge, I.J.; Weening, J.J. What is the difference between IgA nephropathy and Henoch-Schönlein purpura nephritis? Kidney Int. 2001, 59, 823–834. [Google Scholar] [CrossRef] [PubMed] [Green Version]
- Ozen, S.; Marks, S.D.; Brogan, P.; Groot, N.; de Graeff, N.; Avcin, T.; Bader-Meunier, B.; Dolezalova, P.; Feldman, B.M.; Kone-Paut, I.; et al. European consensus-based recommendations for diagnosis and treatment of immunoglobulin A vasculitis—The SHARE initiative. Rheumatology 2019, 58, 1607–1616. [Google Scholar] [CrossRef] [PubMed]
- Bartucci, R.; Salvati, A.; Olinga, P.; Boersma, Y.L. Vanin 1: Its Physiological Function and Role in Diseases. Int. J. Mol. Sci. 2019, 20, 3891. [Google Scholar] [CrossRef] [Green Version]
- Theodoulou, F.L.; Sibon, O.C.; Jackowski, S.; Gout, I. Coenzyme A and its derivatives: Renaissance of a textbook classic. Biochem. Soc. Trans. 2014, 42, 1025–1032. [Google Scholar] [CrossRef]
- Schalkwijk, J.; Jansen, P. Chemical biology tools to study pantetheinases of the vanin family. Biochem. Soc. Trans. 2014, 42, 1052–1055. [Google Scholar] [CrossRef]
- Rommelaere, S.; Millet, V.; Gensollen, T.; Bourges, C.; Eeckhoute, J.; Hennuyer, N.; Baugé, E.; Chasson, L.; Cacciatore, I.; Staels, B.; et al. PPARalpha regulates the production of serum Vanin-1 by liver. FEBS Lett. 2013, 587, 3742–3748. [Google Scholar] [CrossRef] [Green Version]
- Hosohata, K.; Matsuoka, H.; Kumagai, E. Association of urinary vanin-1 with kidney function decline in hypertensive patients. J. Clin. Hypertens. 2021, 23, 1316–1321. [Google Scholar] [CrossRef]
- Hosohata, K.; Ando, H.; Fujimura, A. Urinary Vanin-1 As a Novel Biomarker for Early Detection of Drug-Induced Acute Kidney Injury. J. Pharmacol. Exp. Ther. 2012, 341, 656–662. [Google Scholar] [CrossRef]
- Washino, S.; Hosohata, K.; Oshima, M.; Okochi, T.; Konishi, T.; Nakamura, Y.; Saito, K.; Miyagawa, T. A Novel Biomarker for Acute Kidney Injury, Vanin-1, for Obstructive Nephropathy: A Prospective Cohort Pilot Study. Int. J. Mol. Sci. 2019, 20, 899. [Google Scholar] [CrossRef] [PubMed] [Green Version]
- Roisin-Bouffay, C.; Castellano, R.; Valéro, R.; Chasson, L.; Galland, F.; Naquet, P. Mouse vanin-1 is cytoprotective for islet beta cells and regulates the development of type 1 diabetes. Diabetologia 2008, 51, 1192–1201. [Google Scholar] [CrossRef] [PubMed] [Green Version]
- Kavian, N.; Mehlal, S.; Marut, W.; Servettaz, A.; Giessner, C.; Bourges, C.; Nicco, C.; Chéreau, C.; Lemaréchal, H.; Dutilh, M.-F.; et al. Imbalance of the Vanin-1 Pathway in Systemic Sclerosis. J. Immunol. 2016, 197, 3326–3335. [Google Scholar] [CrossRef] [PubMed] [Green Version]
- Kii, I. Practical Application of Periostin as a Biomarker for Pathological Conditions. Single Mol. Single Cell Seq. 2019, 1132, 195–204. [Google Scholar]
- Guerrot, D.; Dussaule, J.-C.; Mael-Ainin, M.; Xu-Dubois, Y.-C.; Rondeau, E.; Chatziantoniou, C.; Placier, S. Identification of Periostin as a Critical Marker of Progression/Reversal of Hypertensive Nephropathy. PLoS ONE 2012, 7, e31974. [Google Scholar] [CrossRef] [Green Version]
- Wallace, D.P. Periostin in the Kidney. Adv. Exp. Med. Biol. 2019, 1132, 99–112. [Google Scholar]
- Prakoura, N.; Chatziantoniou, C. Periostin in kidney diseases. Cell. Mol. Life Sci. 2017, 74, 4315–4320. [Google Scholar] [CrossRef]
- An, J.N.; Yang, S.H.; Kim, Y.C.; Hwang, J.H.; Park, J.Y.; Kim, D.K.; Kim, J.H.; Kim, D.W.; Hur, D.G.; Oh, Y.K.; et al. Periostin induces kidney fibrosis after acute kidney injury via the p38 MAPK pathway. Am. J. Physiol. Physiol. 2019, 316, F426–F437. [Google Scholar] [CrossRef]
- François, H.; Chatziantoniou, C. Renal fibrosis: Recent translational aspects. Matrix Biol. 2018, 68-69, 318–332. [Google Scholar] [CrossRef]
- Hwang, J.H.; Yang, S.H.; Kim, Y.C.; Kim, J.H.; An, J.N.; Moon, K.C.; Oh, Y.K.; Park, J.Y.; Kim, D.K.; Kim, Y.S.; et al. Experimental Inhibition of Periostin Attenuates Kidney Fibrosis. Am. J. Nephrol. 2017, 46, 501–517. [Google Scholar] [CrossRef] [PubMed]
- Sen, K.; Lindenmeyer, M.T.; Gaspert, A.; Eichinger, F.; Neusser, M.A.; Kretzler, M.; Segerer, S.; Cohen, C.D. Periostin is induced in glomerular injury and expressed de novo in interstitial renal fibrosis. Am. J. Pathol. 2011, 179, 1756–1767. [Google Scholar] [CrossRef] [PubMed]
- Wantanasiri, P.; Satirapoj, B.; Charoenpitakchai, M.; Aramwit, P. Periostin: A novel tissue biomarker correlates with chronicity index and renal function in lupus nephritis patients. Lupus 2015, 24, 835–845. [Google Scholar] [CrossRef] [PubMed]
- Satirapoj, B.; Tassanasorn, S.; Charoenpitakchai, M.; Supasyndh, O. Periostin as a Tissue and Urinary Biomarker of Renal Injury in Type 2 Diabetes Mellitus. PLoS ONE 2015, 10, e0124055. [Google Scholar] [CrossRef] [PubMed]
- Hwang, J.H.; Lee, J.P.; Kim, C.T.; Yang, S.H.; Kim, J.H.; An, J.N.; Moon, K.C.; Lee, H.; Oh, Y.K.; Joo, K.W.; et al. Urinary Periostin Excretion Predicts Renal Outcome in IgA Nephropathy. Am. J. Nephrol. 2016, 44, 481–492. [Google Scholar] [CrossRef]
- Ono, J.; Takai, M.; Kamei, A.; Nunomura, S.; Nanri, Y.; Yoshihara, T.; Ohta, S.; Yasuda, K.; Conway, S.J.; Yokosaki, Y.; et al. Periostin forms a functional complex with IgA in human serum. Allergol. Int. 2020, 69, 111–120. [Google Scholar] [CrossRef]
- Mizerska-Wasiak, M.; Such-Gruchot, A.; Cichoń-Kawa, K.; Turczyn, A.; Małdyk, J.; Miklaszewska, M.; Drożdż, D.; Firszt-Adamczyk, A.; Stankiewicz, R.; Rybi-Szumińska, A.; et al. The Role of Complement Component C3 Activation in the Clinical Presentation and Prognosis of IgA Nephropathy—A National Study in Children. J. Clin. Med. 2021, 10, 4405. [Google Scholar] [CrossRef]
- Jia, Y.Y.; Yu, Y.; Li, H.J. The research status and prospect of Periostin in chronic kidney disease. Ren. Fail. 2020, 42, 1166–1172. [Google Scholar] [CrossRef]
- Turczyn, A.; Pańczyk-Tomaszewska, M.; Krzemień, G.; Górska, E.; Demkow, U. The Usefulness of Urinary Periostin, Cytokeratin-18, and Endoglin for Diagnosing Renal Fibrosis in Children with Congenital Obstructive Nephropathy. J. Clin. Med. 2021, 10, 4899. [Google Scholar] [CrossRef]

| Parameter | IgAN (n = 20) | IgAVN (n = 31) | p |
|---|---|---|---|
| Age at the disease onset (years) | 11 ± 4.1 | 7.5 ± 3.1 | 0.001 |
| Height (cm) | 150.2 ± 26.6 | 129.2 ± 20.2 | 0.002 |
| Weight (kg) | 45.8 ± 20.8 | 31.8 ± 14.6 | 0.007 |
| SDS to weight | 0.6 ± 1.4 | 0.3 ± 0.9 | NS |
| GFR (mL/min/1.73 m2) | 101.8 ± 30 | 113.5 ± 30.6 | NS |
| Proteinuria at baseline (mg/kg/d) | 19 (0–226) | 34 (0–742) | NS |
| Erythrocyturia (RBC/HPF) | 65.5 (0–250) | 80 (0–250) | NS |
| Urea (mg/dL) | 228 (18–43) | 27 (15–159) | NS |
| Creatinine (mg/dL) | 0.6 (0.3–1.3) | 0.4 (0.3–2.1) | 0.005 |
| Albumin (g/dL) | 3.7 ± 0.8 | 3.6 ± 0.7 | NS |
| IgA (mg/dL) | 302 (57.8–494) | 213.4 (68.7–1070) | 0.032 |
| C3 (mg/dL) | 106.6 ± 22.9 | 111.6 ± 32.5 | NS |
| C4 (mg/dL) | 24.8 ± 8 | 23.4 ± 7.9 | NS |
| MEST-C score (sum) | 2.2 ± 1.4 | 2.5 ± 1.2 | NS |
| Time to biopsy (months) | 3 (0–68.4) | 1 (0–26) | 0.03 |
| Outcome (years) | 2.9 ± 2.6 | 3.6 ± 2.9 | NS |
| Age at FU (years) | 14.1 ± 3.7 | 10.8 ± 3.6 | 0.004 |
| Height at FU (cm) | 154.4 ± 27.4 | 144.7 ± 18.6 | NS |
| Weight at FU (kg) | 53.6 ± 20.9 | 45.8 ± 19.8 | NS |
| SDS to weight at FU | 0 ± 1.5 | 0.7 ± 1.3 | NS |
| GFR at FU (mL/min/1.73 m2) | 111 ± 14.6 | 113.4 ± 19.6 | NS |
| Proteinuria at FU (mg/kg/d) | 0 (0–76) | 0 (0–190) | NS |
| Erythrocyturia at FU (RBC/HPF) | 6 (0–200) | 0 (0–35) | 0.002 |
| Creatinine at FU (mg/dL) | 0.6 ± 0.2 | 0.6 ± 0.1 | NS |
| Albumin at FU (g/dL) | 4.2 ± 0.6 | 4.4 ± 0.2 | NS |
| IgA at FU (mg/dL) | 253 (51–439) | 173.2 (49.1–396) | 0.033 |
| C3 at FU (mg/dL) | 91.3 ± 13.6 | 95 ± 15.5 | NS |
| C4 at FU (mg/dL) | 18 ± 7.1 | 18.2 ± 6.9 | NS |
| Parameter | Control Group (n = 18) | IgAN (n = 20) | IgAVN (n = 31) | p |
|---|---|---|---|---|
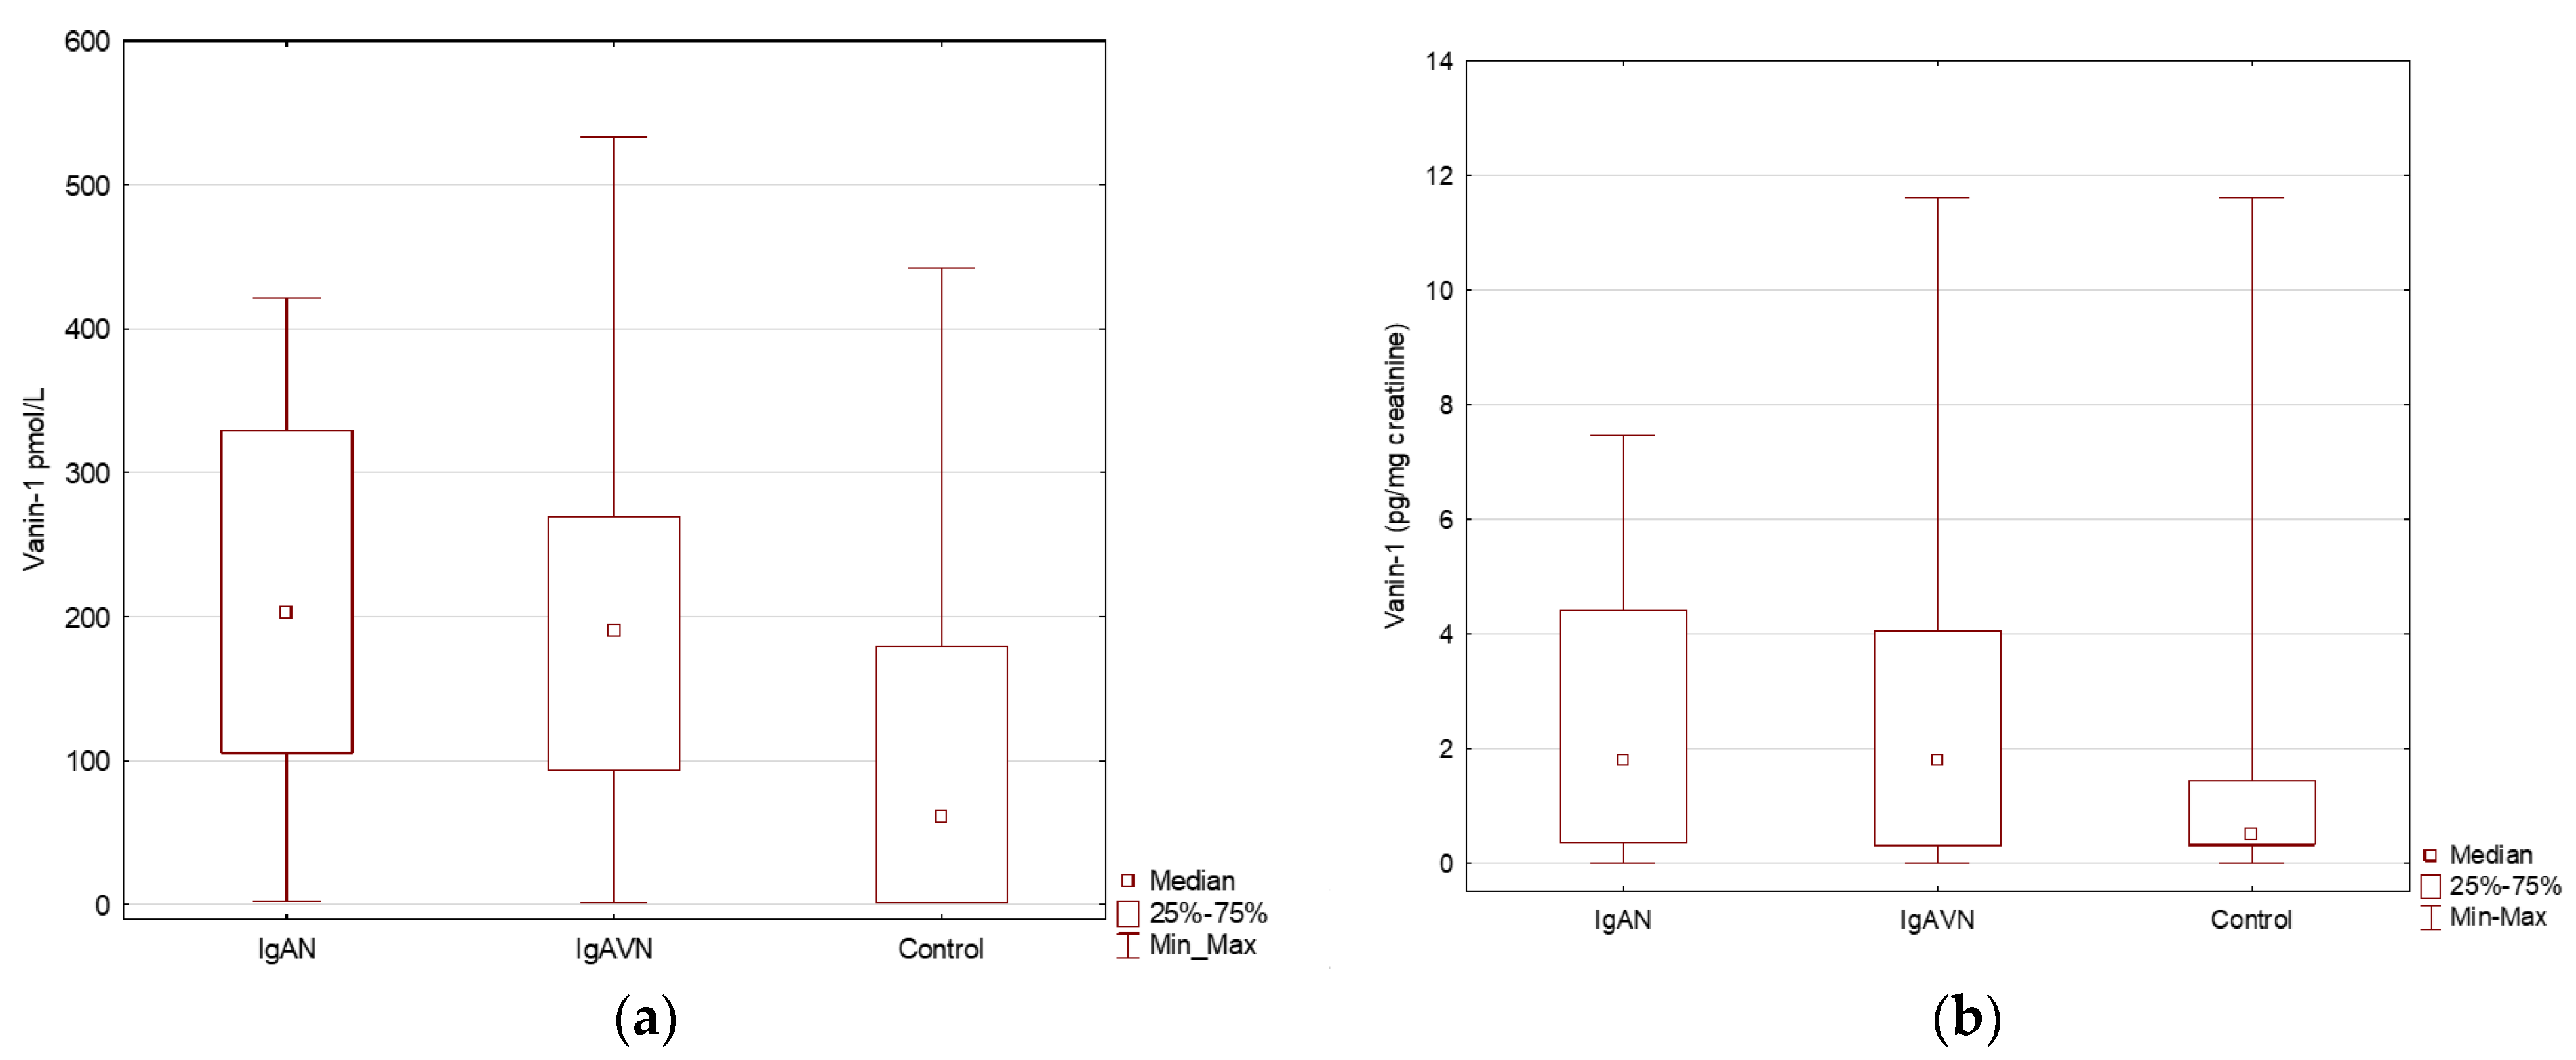
| Vanin (pmol/L) | 61.1 (1–442.1) | 203.4 (2.5–421.6) | 190.4 (1.1–533) | 0.016 |
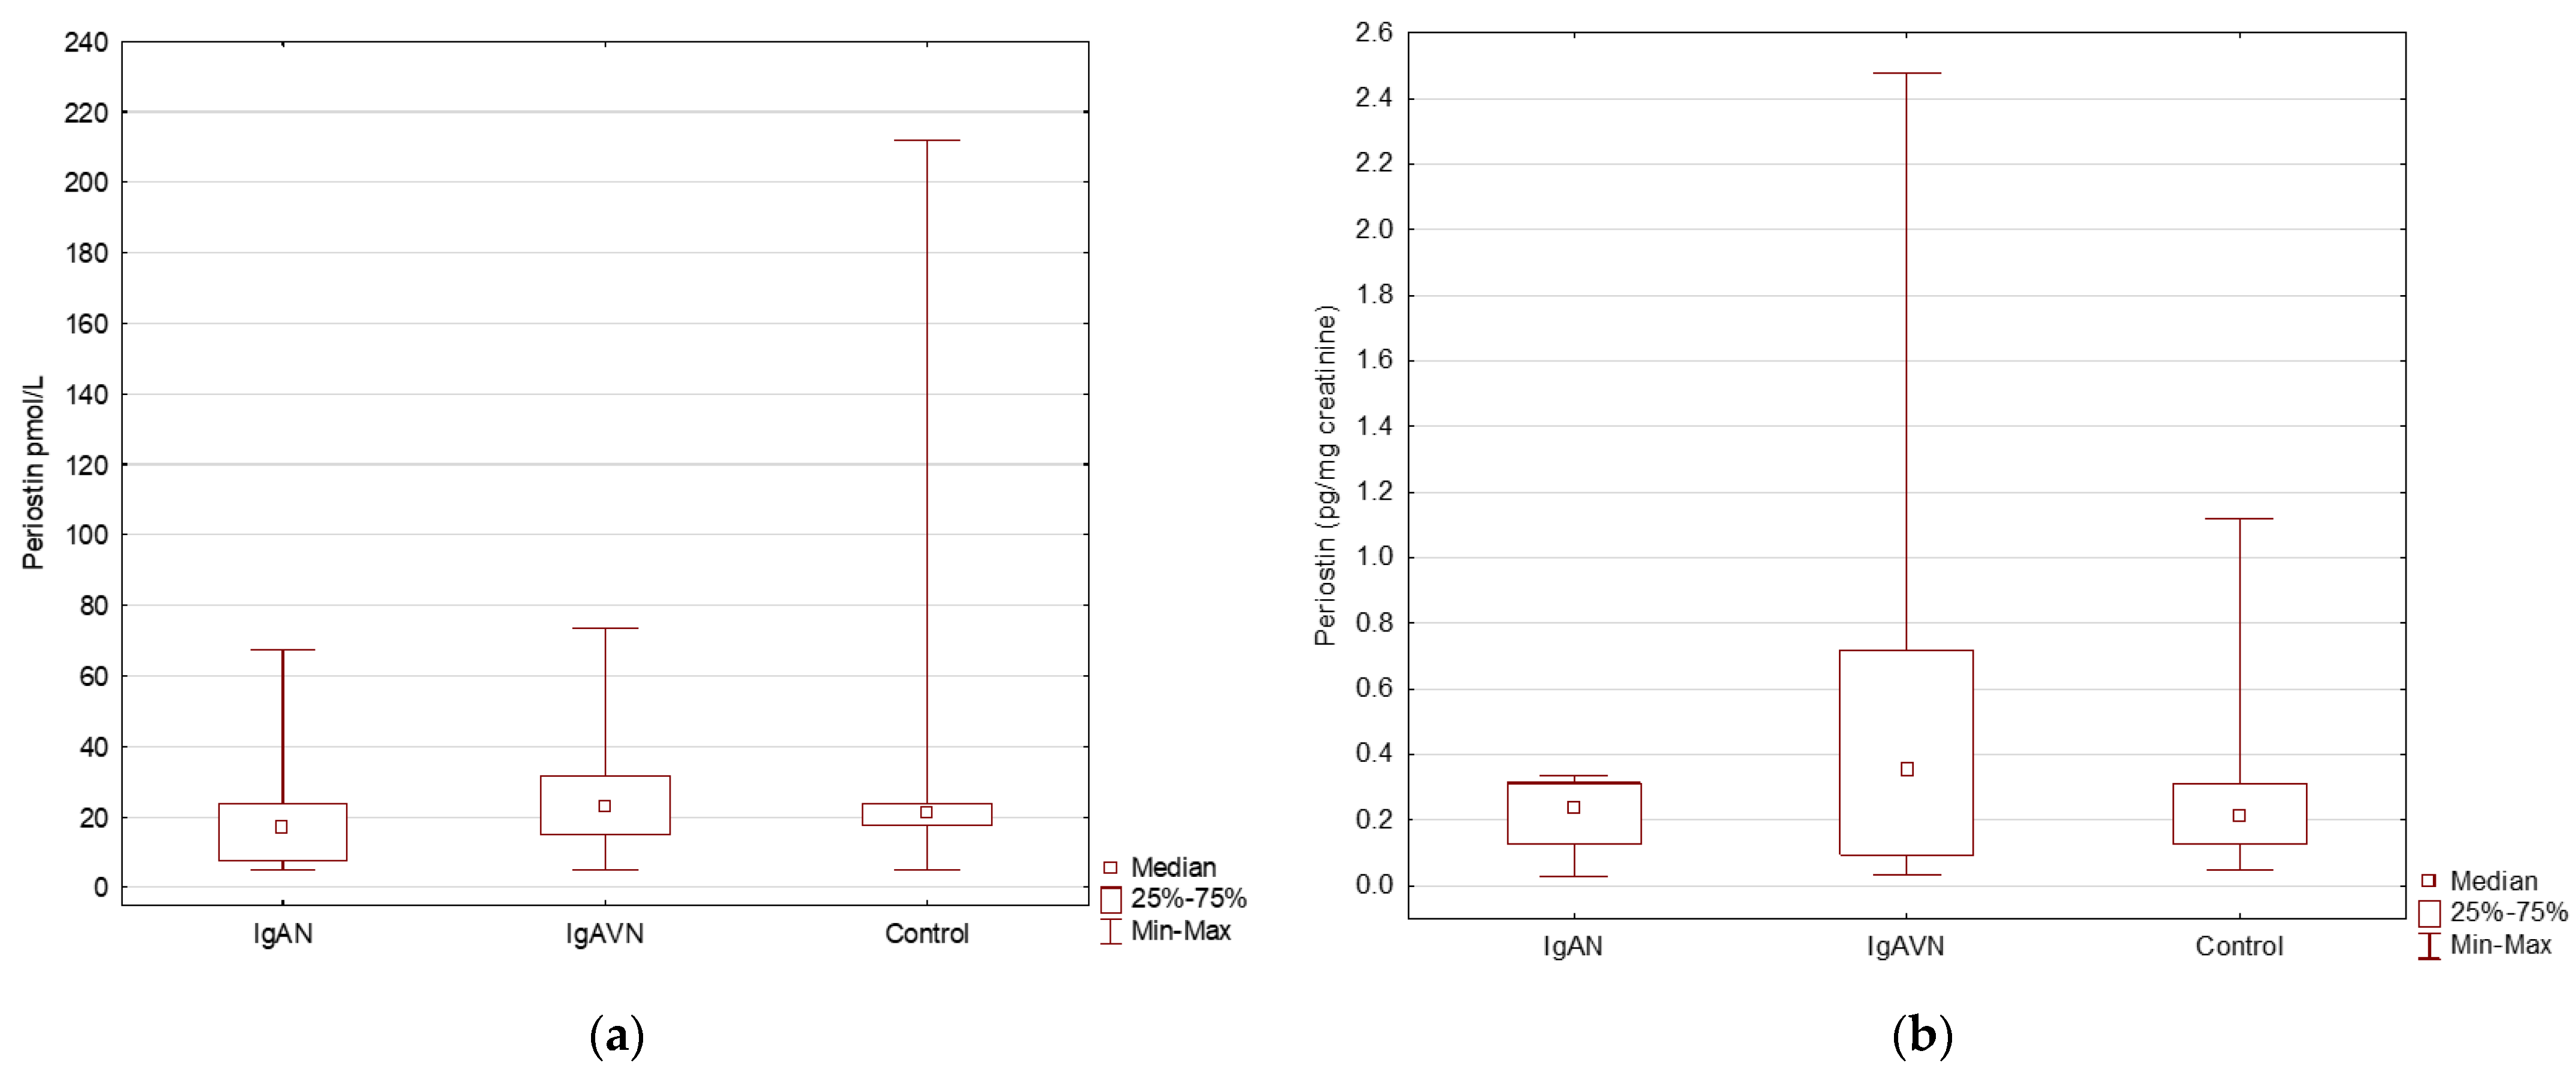
| Periostin (pmol/L) | 21 (5–212.1) | 16.7 (5–67.5) | 22.8 (5–73.4) | NS |
| Vanin (pg/mg creatinine) * | 0.5 (0.0–11.6) | 1.8 (0.0–7.5) | 1.8 (0–11.6) | NS |
| Perostin (pg/mg creatinine) * | 0.2 (0.1–1.1) | 0.2 (0.0–153.3) | 0.4 (0.0–2.5) | NS |
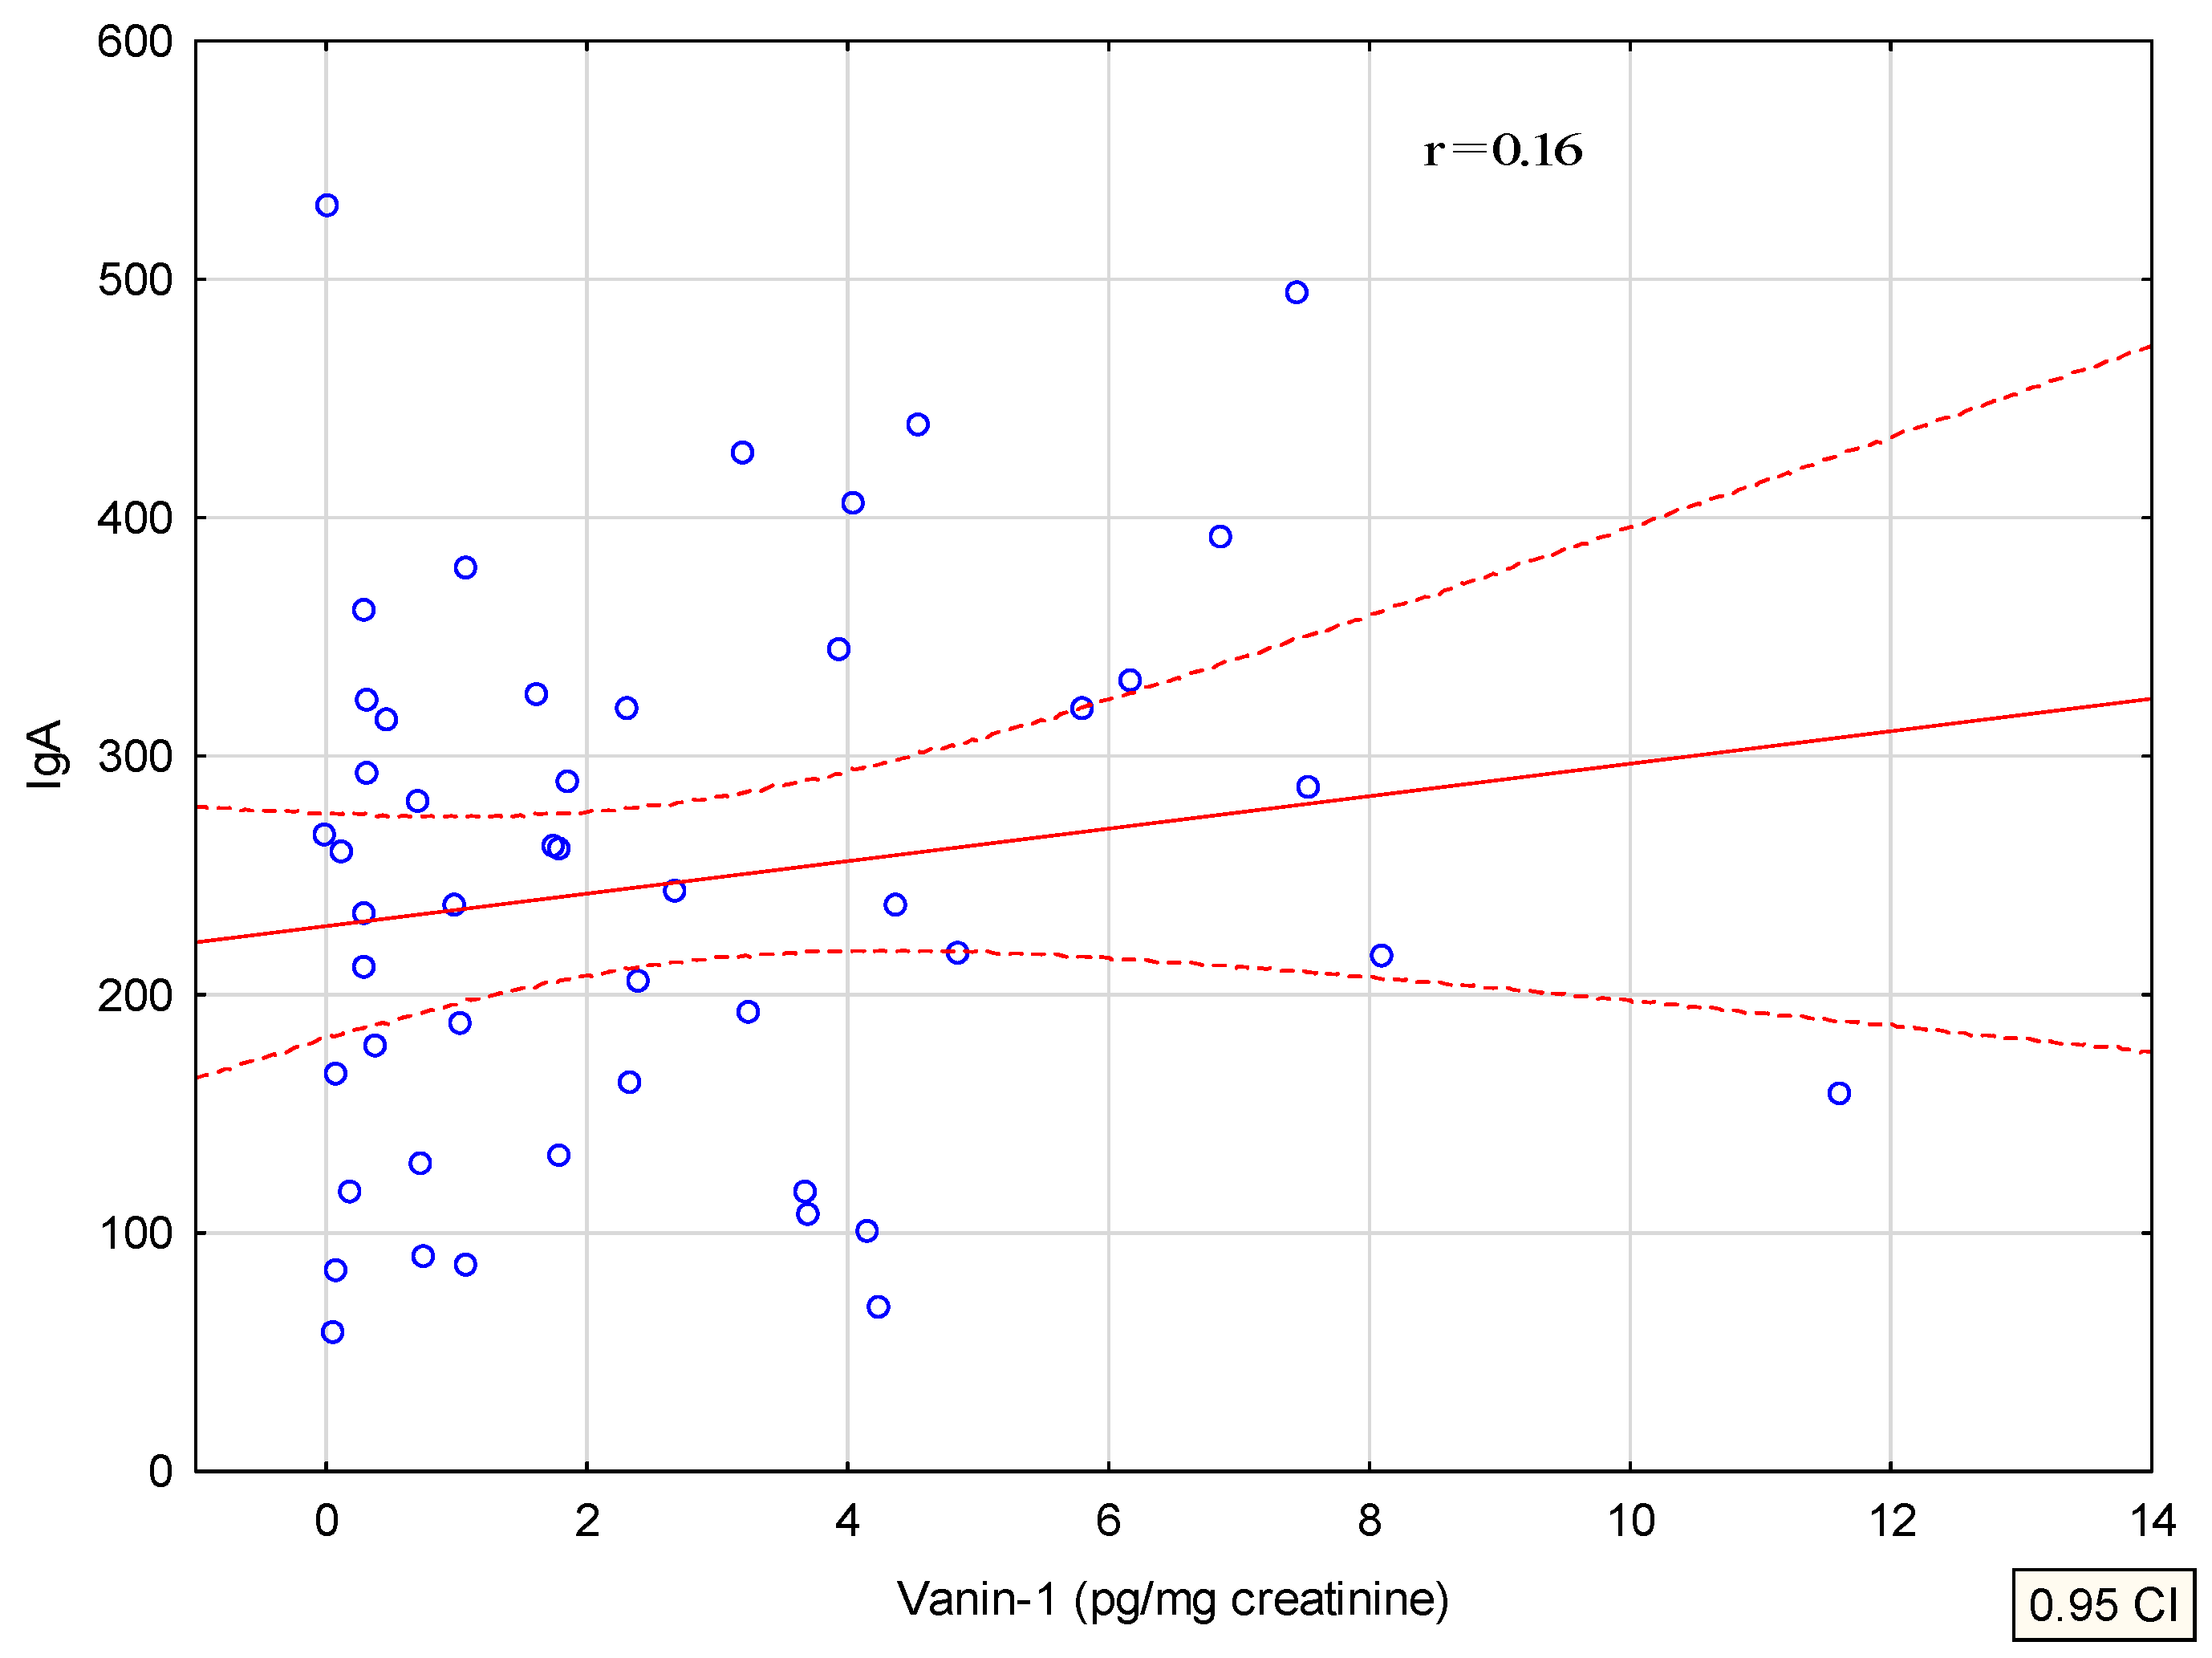
| Subgroup | Vanin (pg/mg Creatinine) Parameter Correlation | −95% CI | +95% CI | p | |
|---|---|---|---|---|---|
| SDS to weight at FU | 0.6757 | −0.0755 | 1.2760 | 0.0285 | |
| GFR at FU | 0.0075 | −0.0416 | 0.0565 | 0.7582 | |
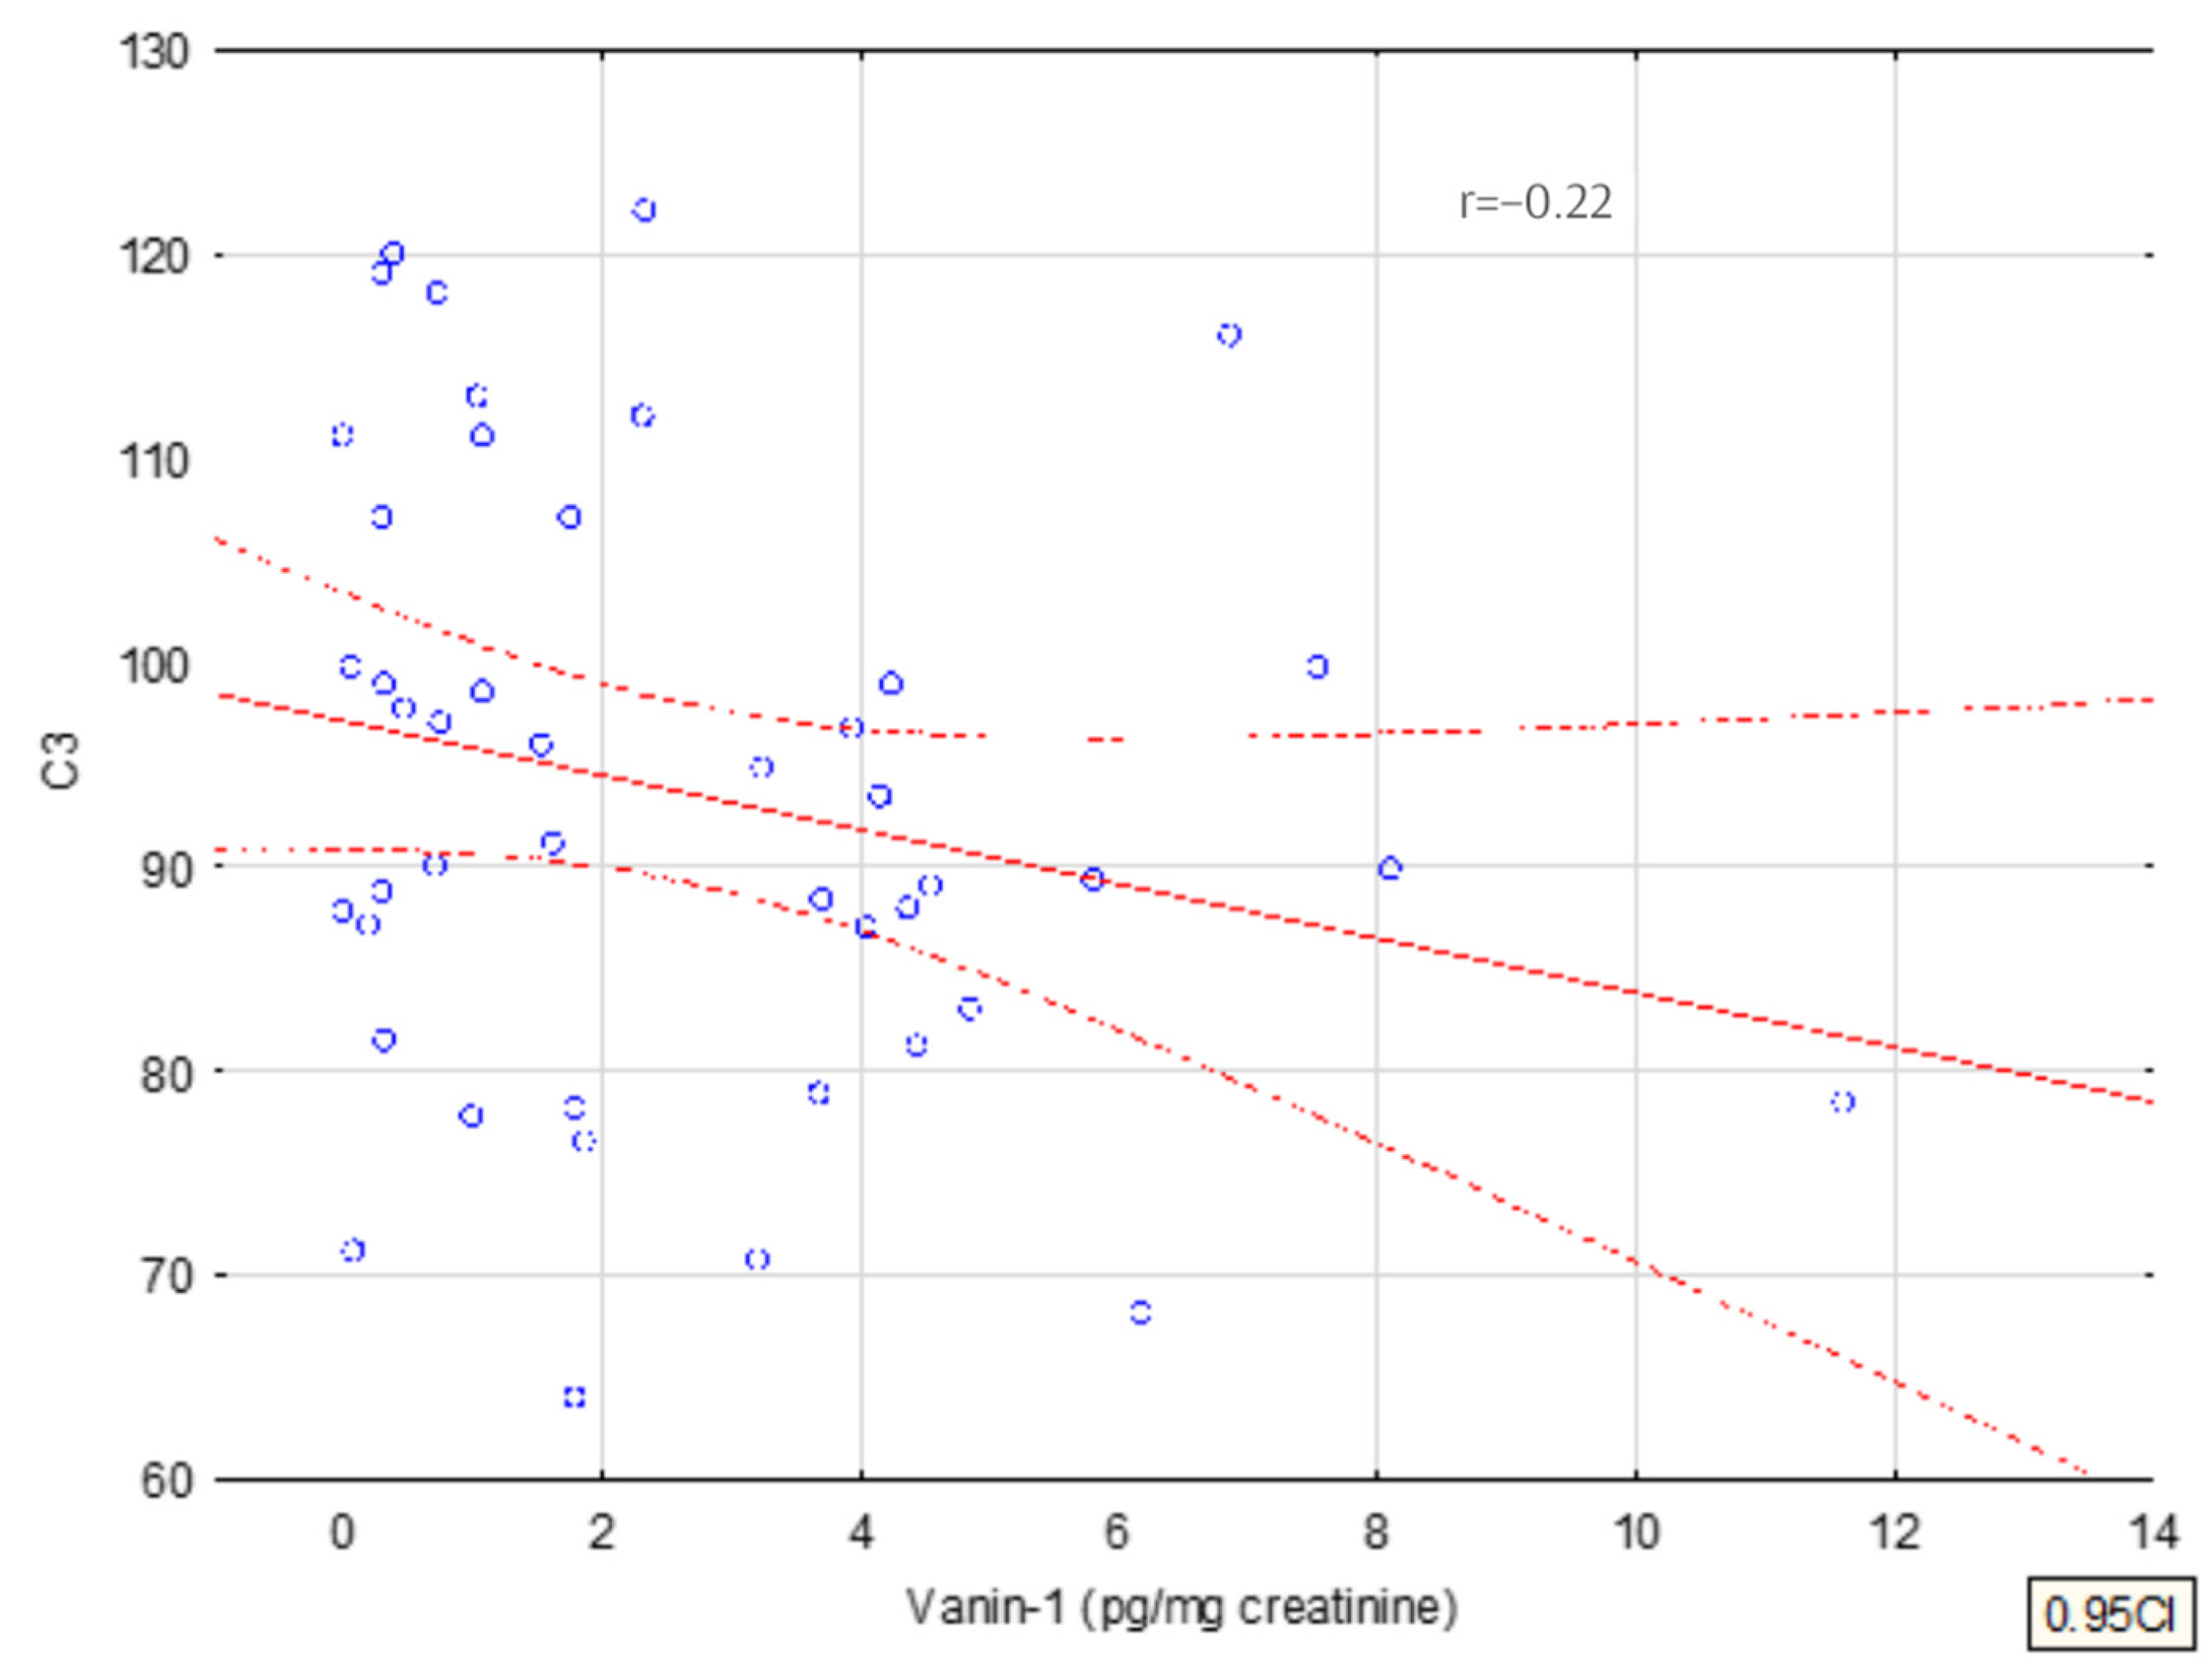
| C3 at FU | −0.0561 | −0.1079 | 0.0047 | 0.0711 | |
| Group | IgAN | 0.1450 | −0.7856 | 1.0757 | 0.7533 |
| Sex | F | −0.1197 | −0.9952 | 0.7559 | 0.7827 |
Publisher’s Note: MDPI stays neutral with regard to jurisdictional claims in published maps and institutional affiliations. |
© 2022 by the authors. Licensee MDPI, Basel, Switzerland. This article is an open access article distributed under the terms and conditions of the Creative Commons Attribution (CC BY) license (https://creativecommons.org/licenses/by/4.0/).
Share and Cite
Mizerska-Wasiak, M.; Płatos, E.; Cichoń-Kawa, K.; Demkow, U.; Pańczyk-Tomaszewska, M. The Usefulness of Vanin-1 and Periostin as Markers of an Active Autoimmune Process or Renal Fibrosis in Children with IgA Nephropathy and IgA Vasculitis with Nephritis—A Pilot Study. J. Clin. Med. 2022, 11, 1265. https://doi.org/10.3390/jcm11051265
Mizerska-Wasiak M, Płatos E, Cichoń-Kawa K, Demkow U, Pańczyk-Tomaszewska M. The Usefulness of Vanin-1 and Periostin as Markers of an Active Autoimmune Process or Renal Fibrosis in Children with IgA Nephropathy and IgA Vasculitis with Nephritis—A Pilot Study. Journal of Clinical Medicine. 2022; 11(5):1265. https://doi.org/10.3390/jcm11051265
Chicago/Turabian StyleMizerska-Wasiak, Małgorzata, Emilia Płatos, Karolina Cichoń-Kawa, Urszula Demkow, and Małgorzata Pańczyk-Tomaszewska. 2022. "The Usefulness of Vanin-1 and Periostin as Markers of an Active Autoimmune Process or Renal Fibrosis in Children with IgA Nephropathy and IgA Vasculitis with Nephritis—A Pilot Study" Journal of Clinical Medicine 11, no. 5: 1265. https://doi.org/10.3390/jcm11051265