
Presence of Pleural Effusion in the Assessment of Remote Dielectric Sensing
 , ,
, ,
Abstract
:1. Introduction
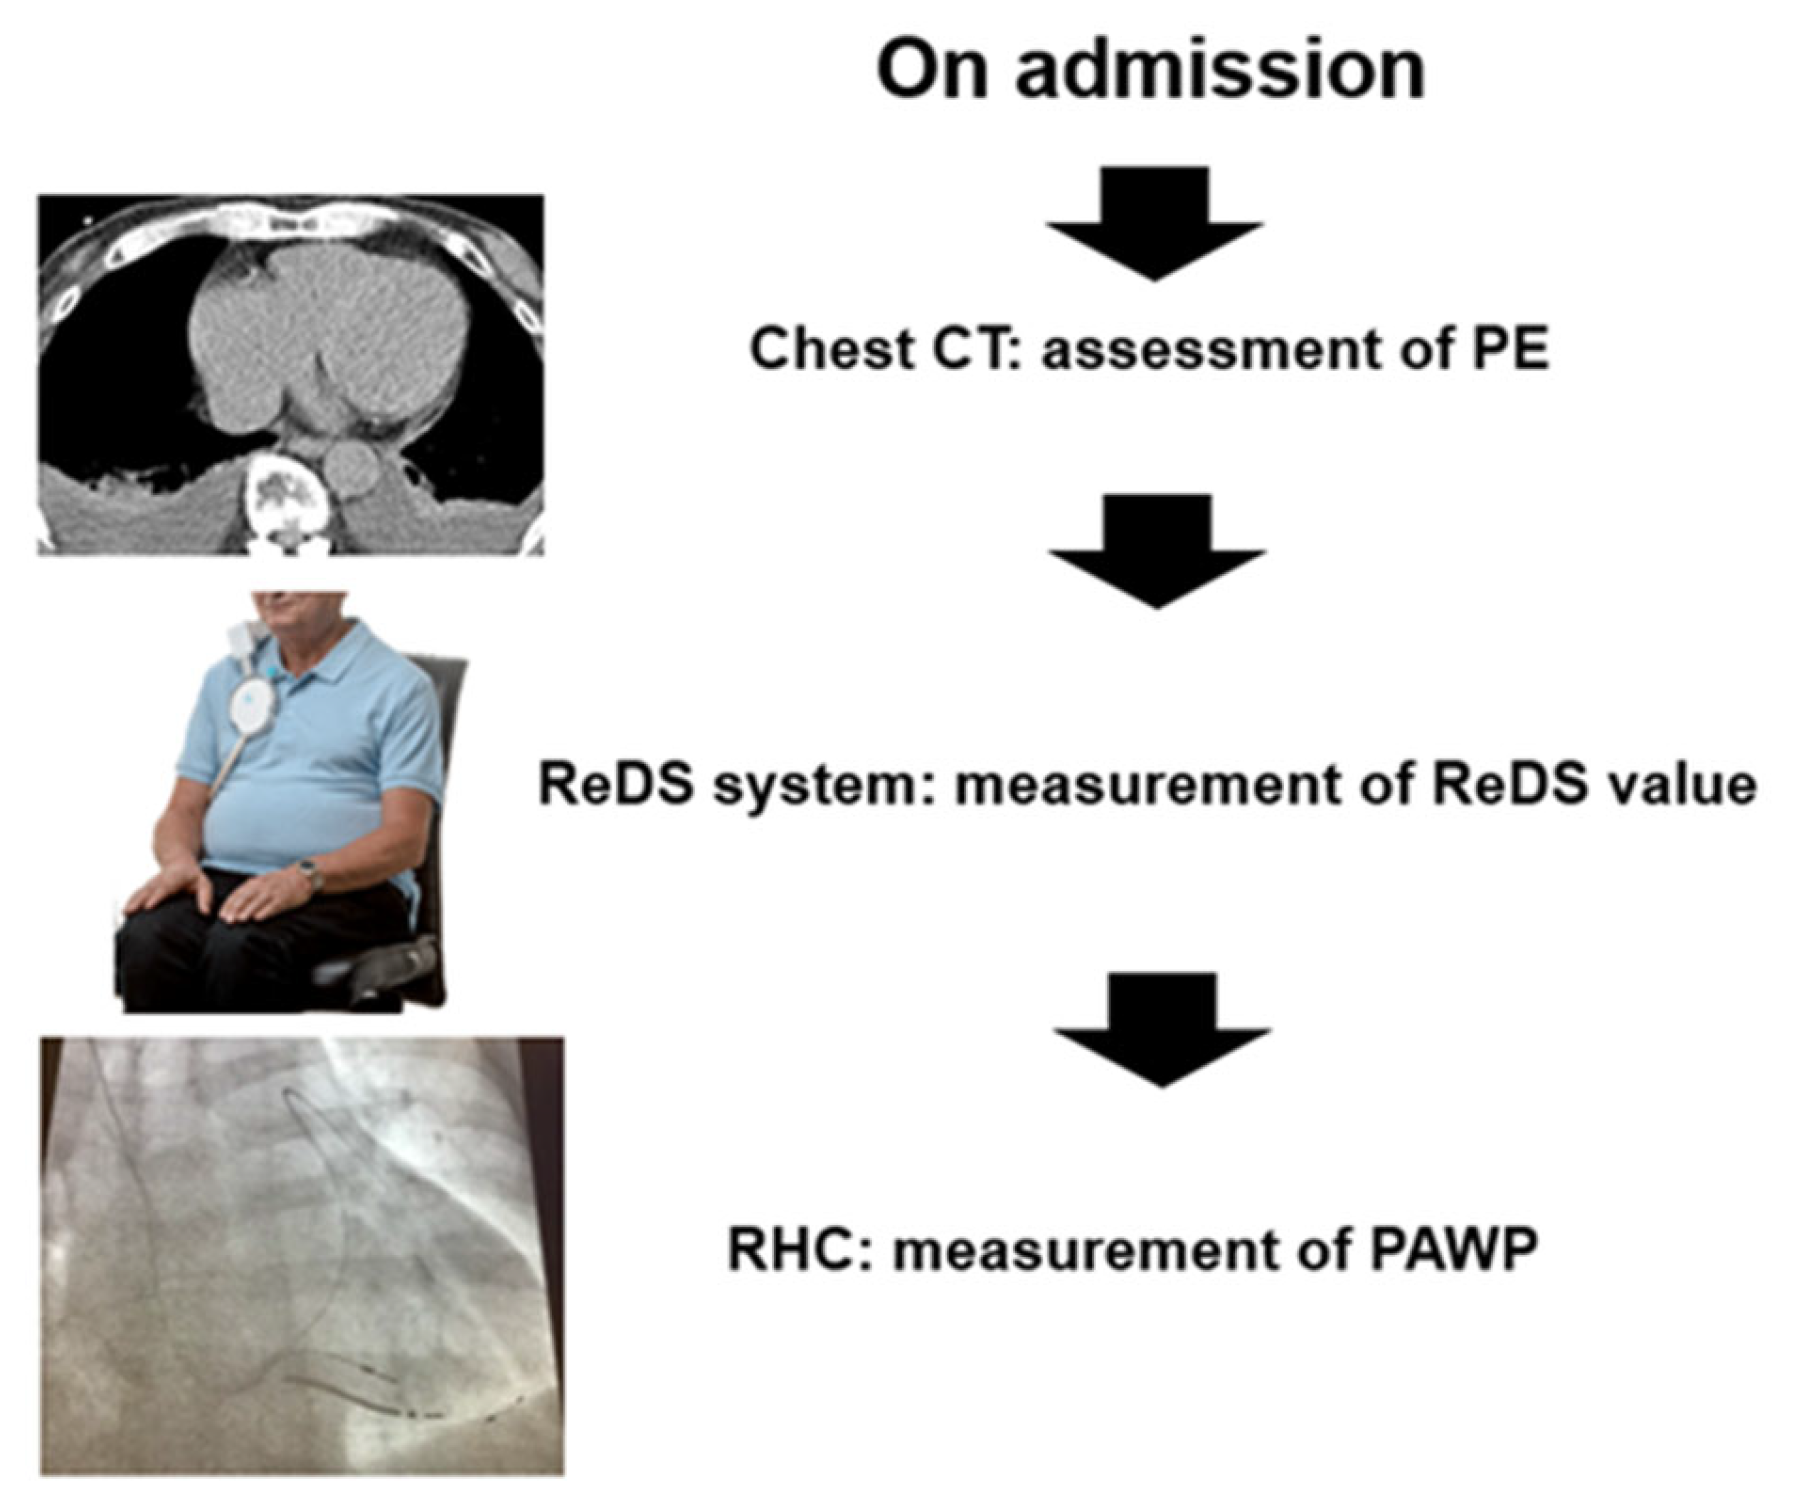
2. Methods
2.1. Study Design
2.2. Patient Selection
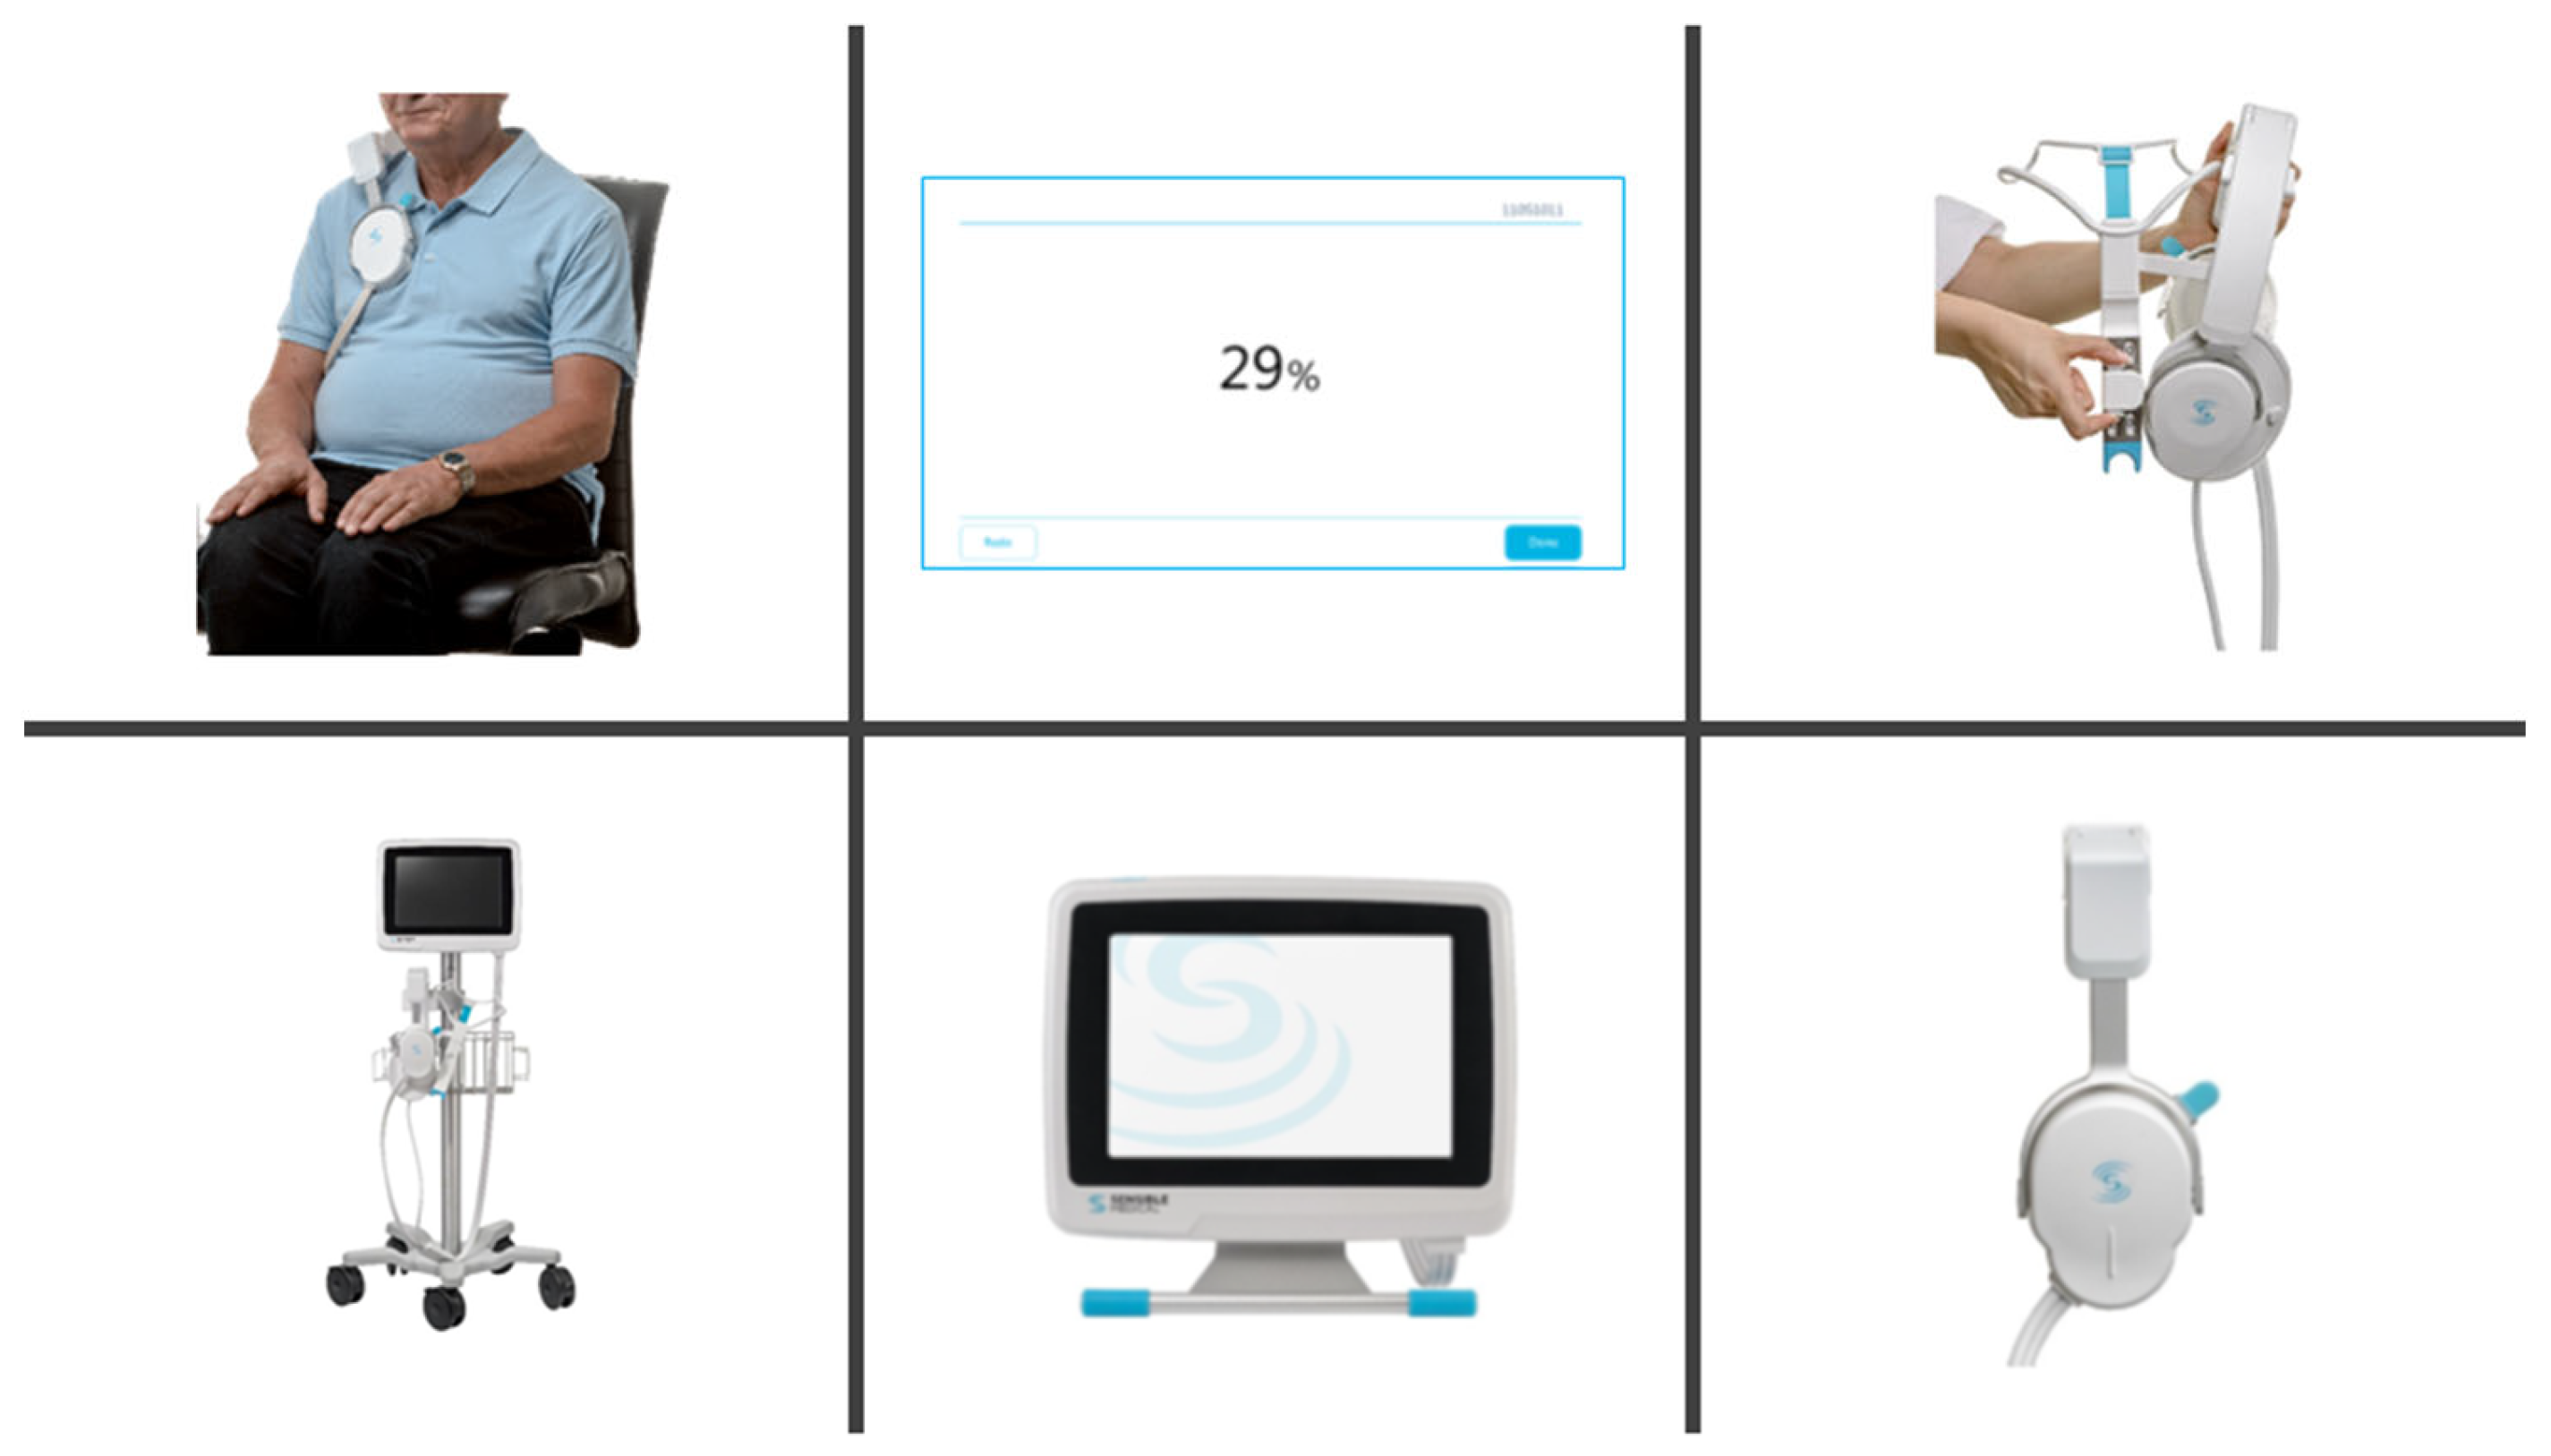
2.3. ReDS Measurement
2.4. Right Heart Catheterization
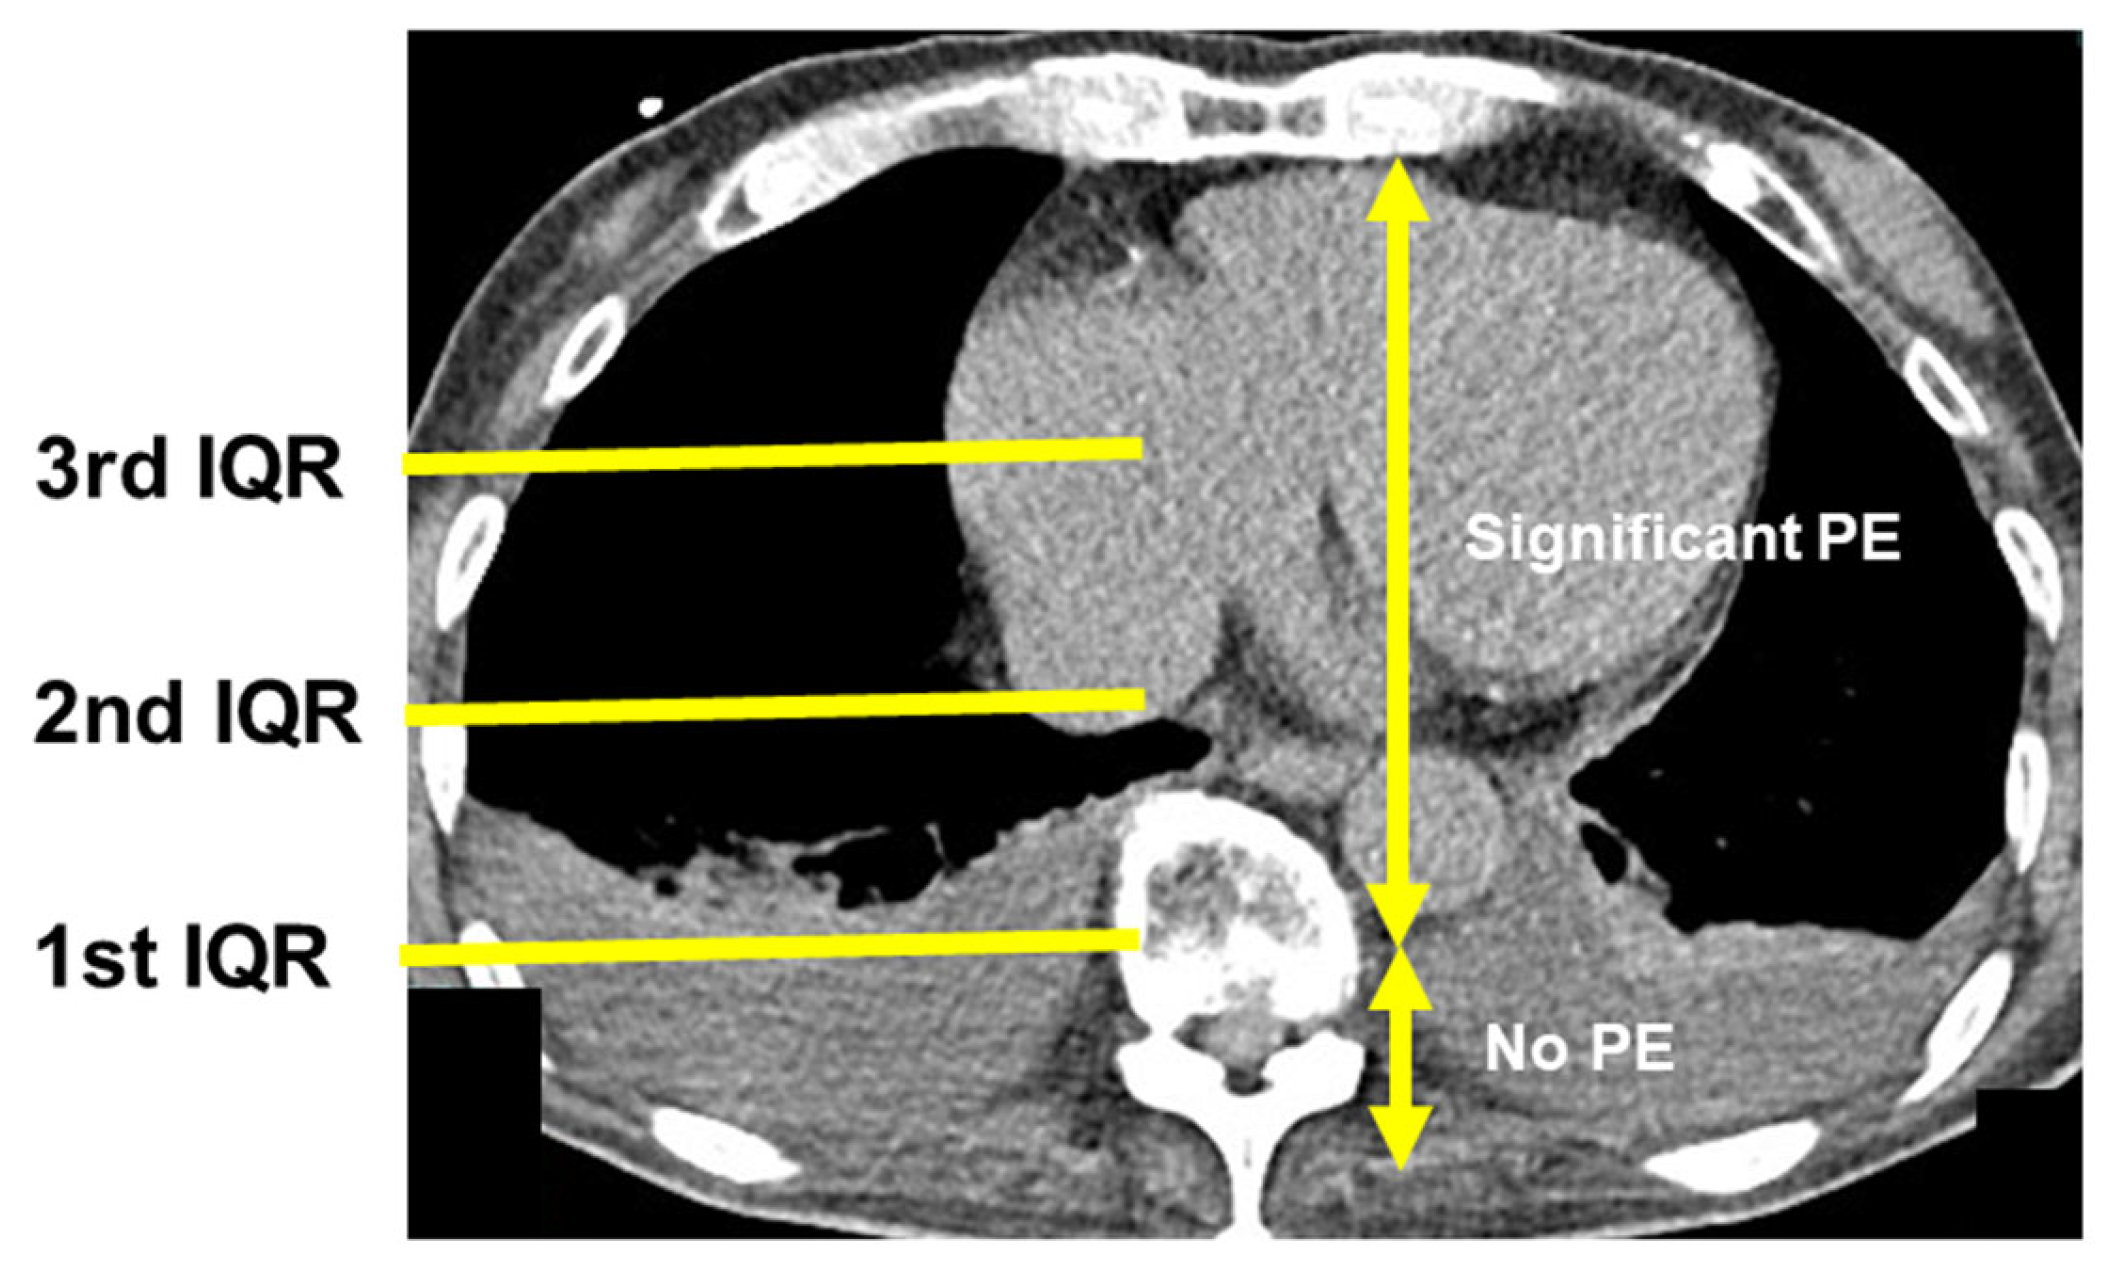
2.5. Chest Computed Tomography
2.6. Statistical Analysis
3. Results
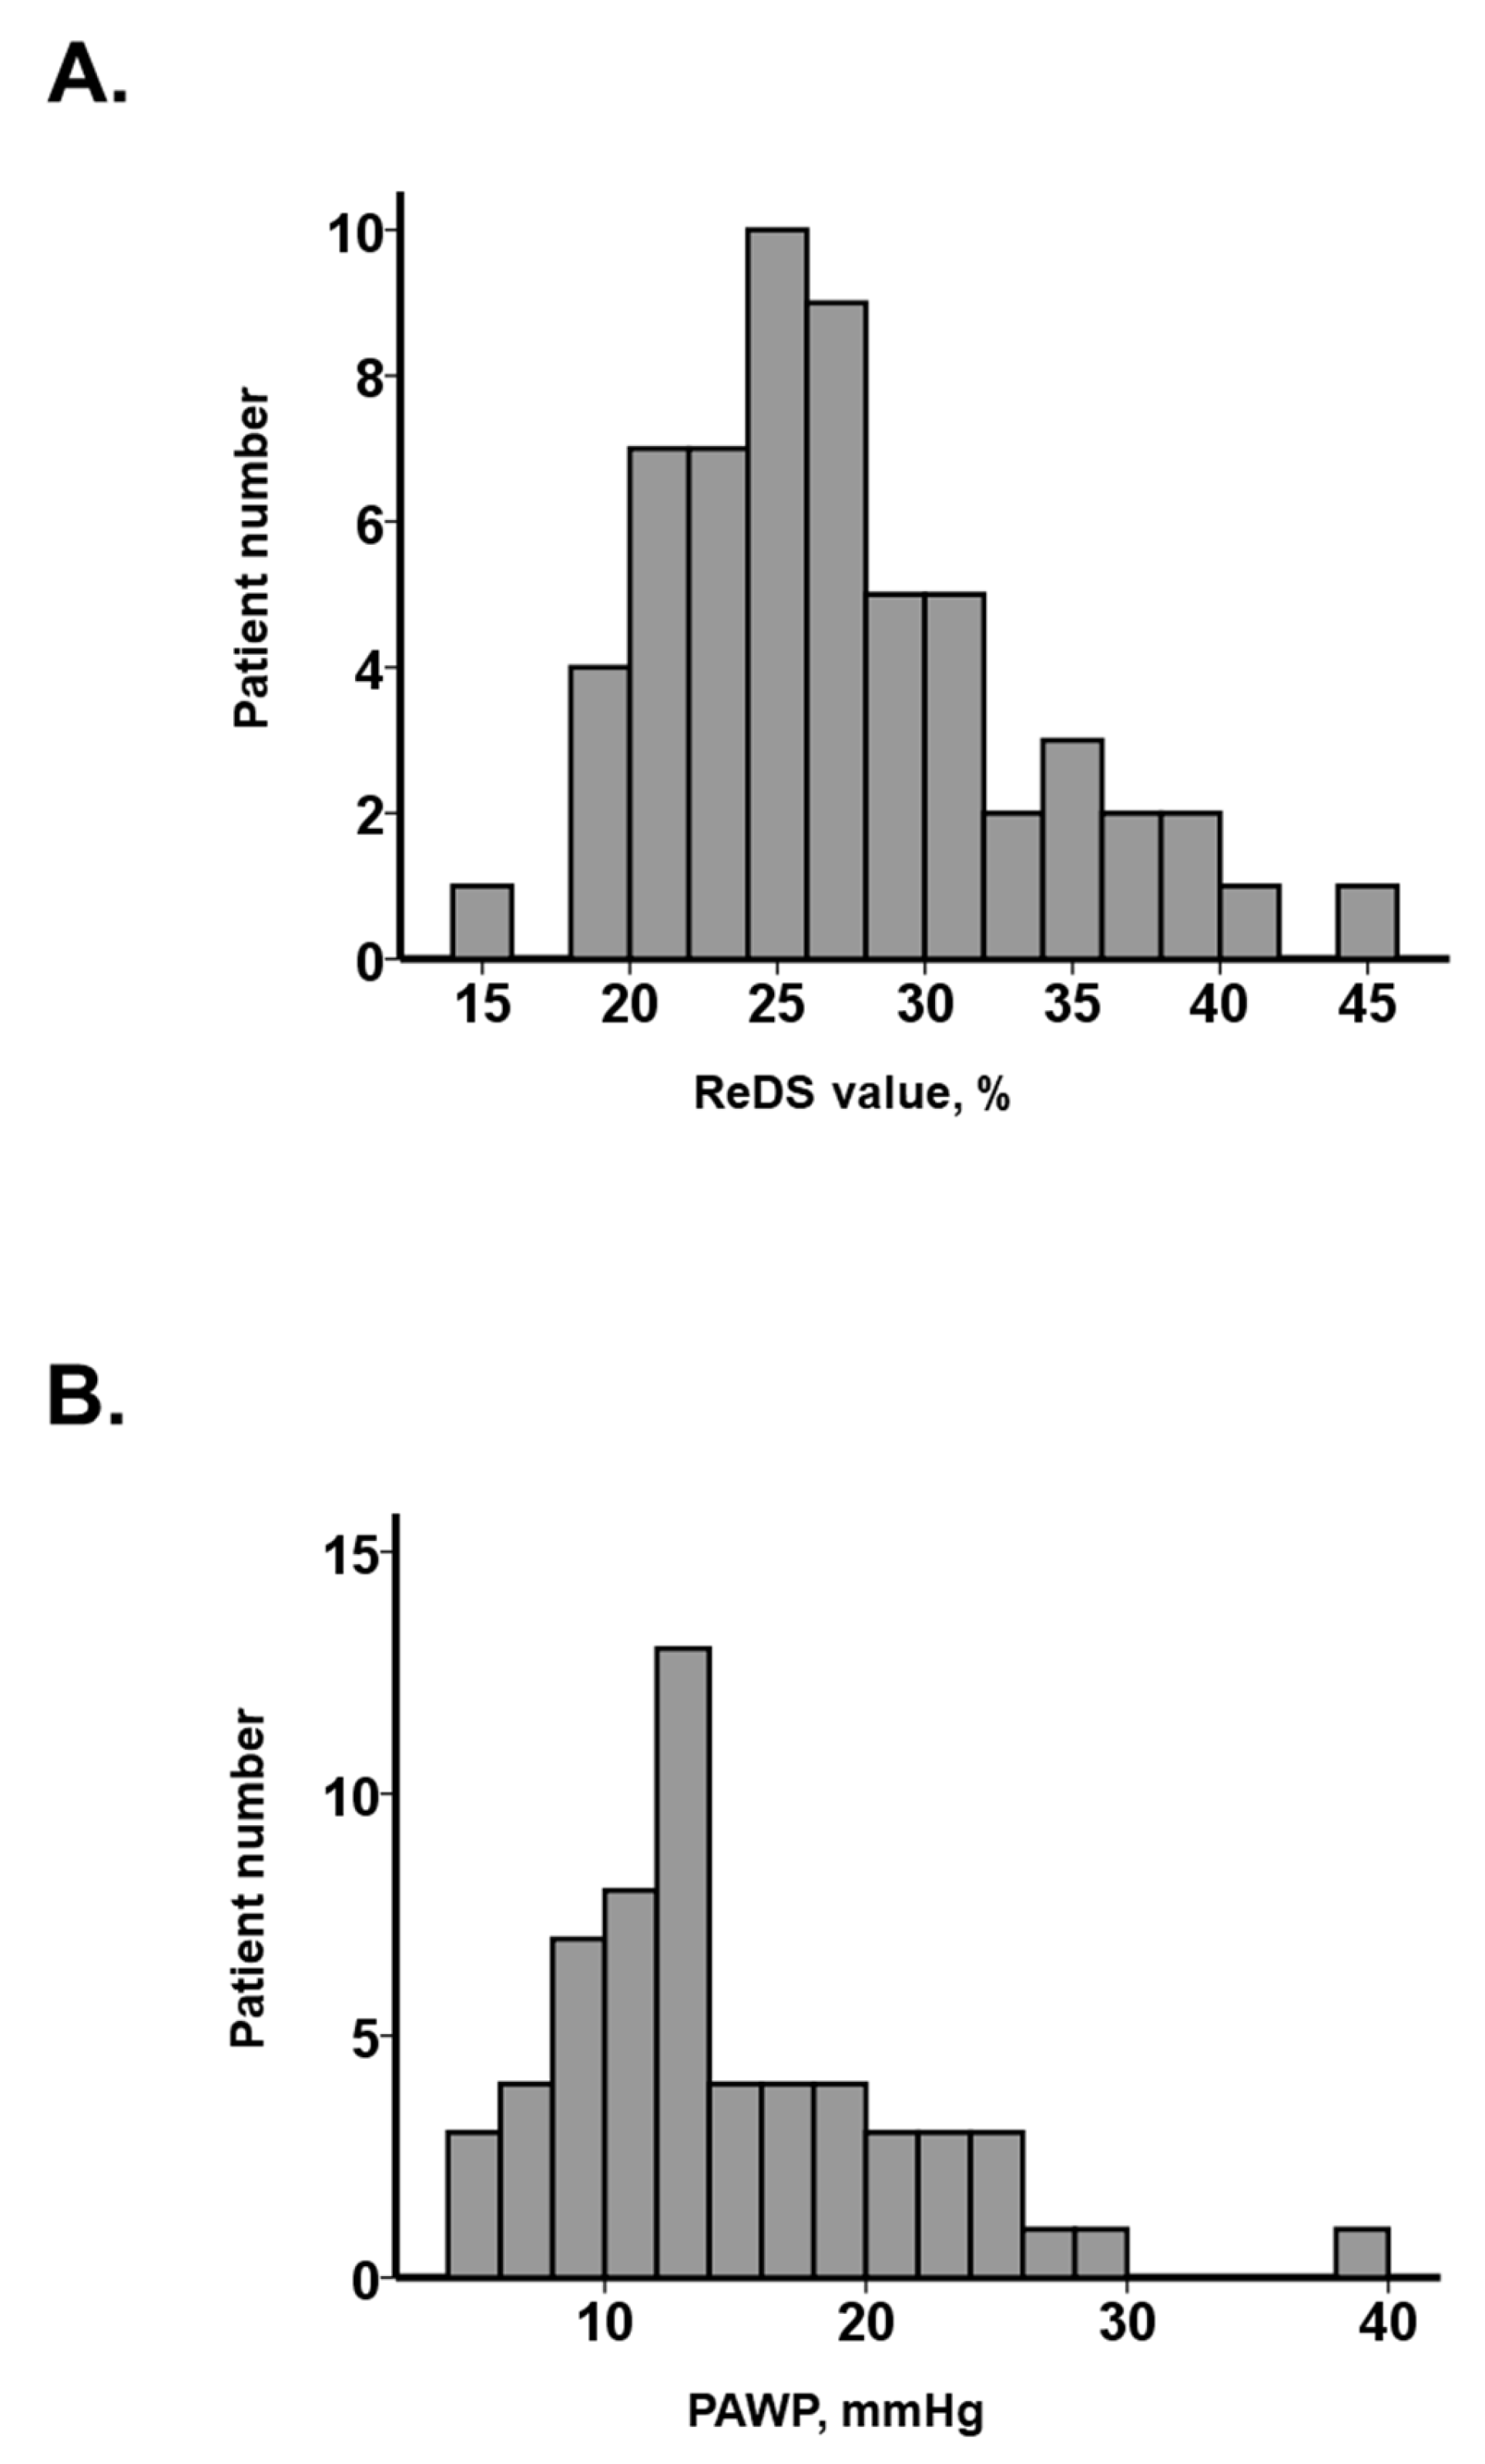
3.1. Baseline Characteristics
3.2. Presence of PE
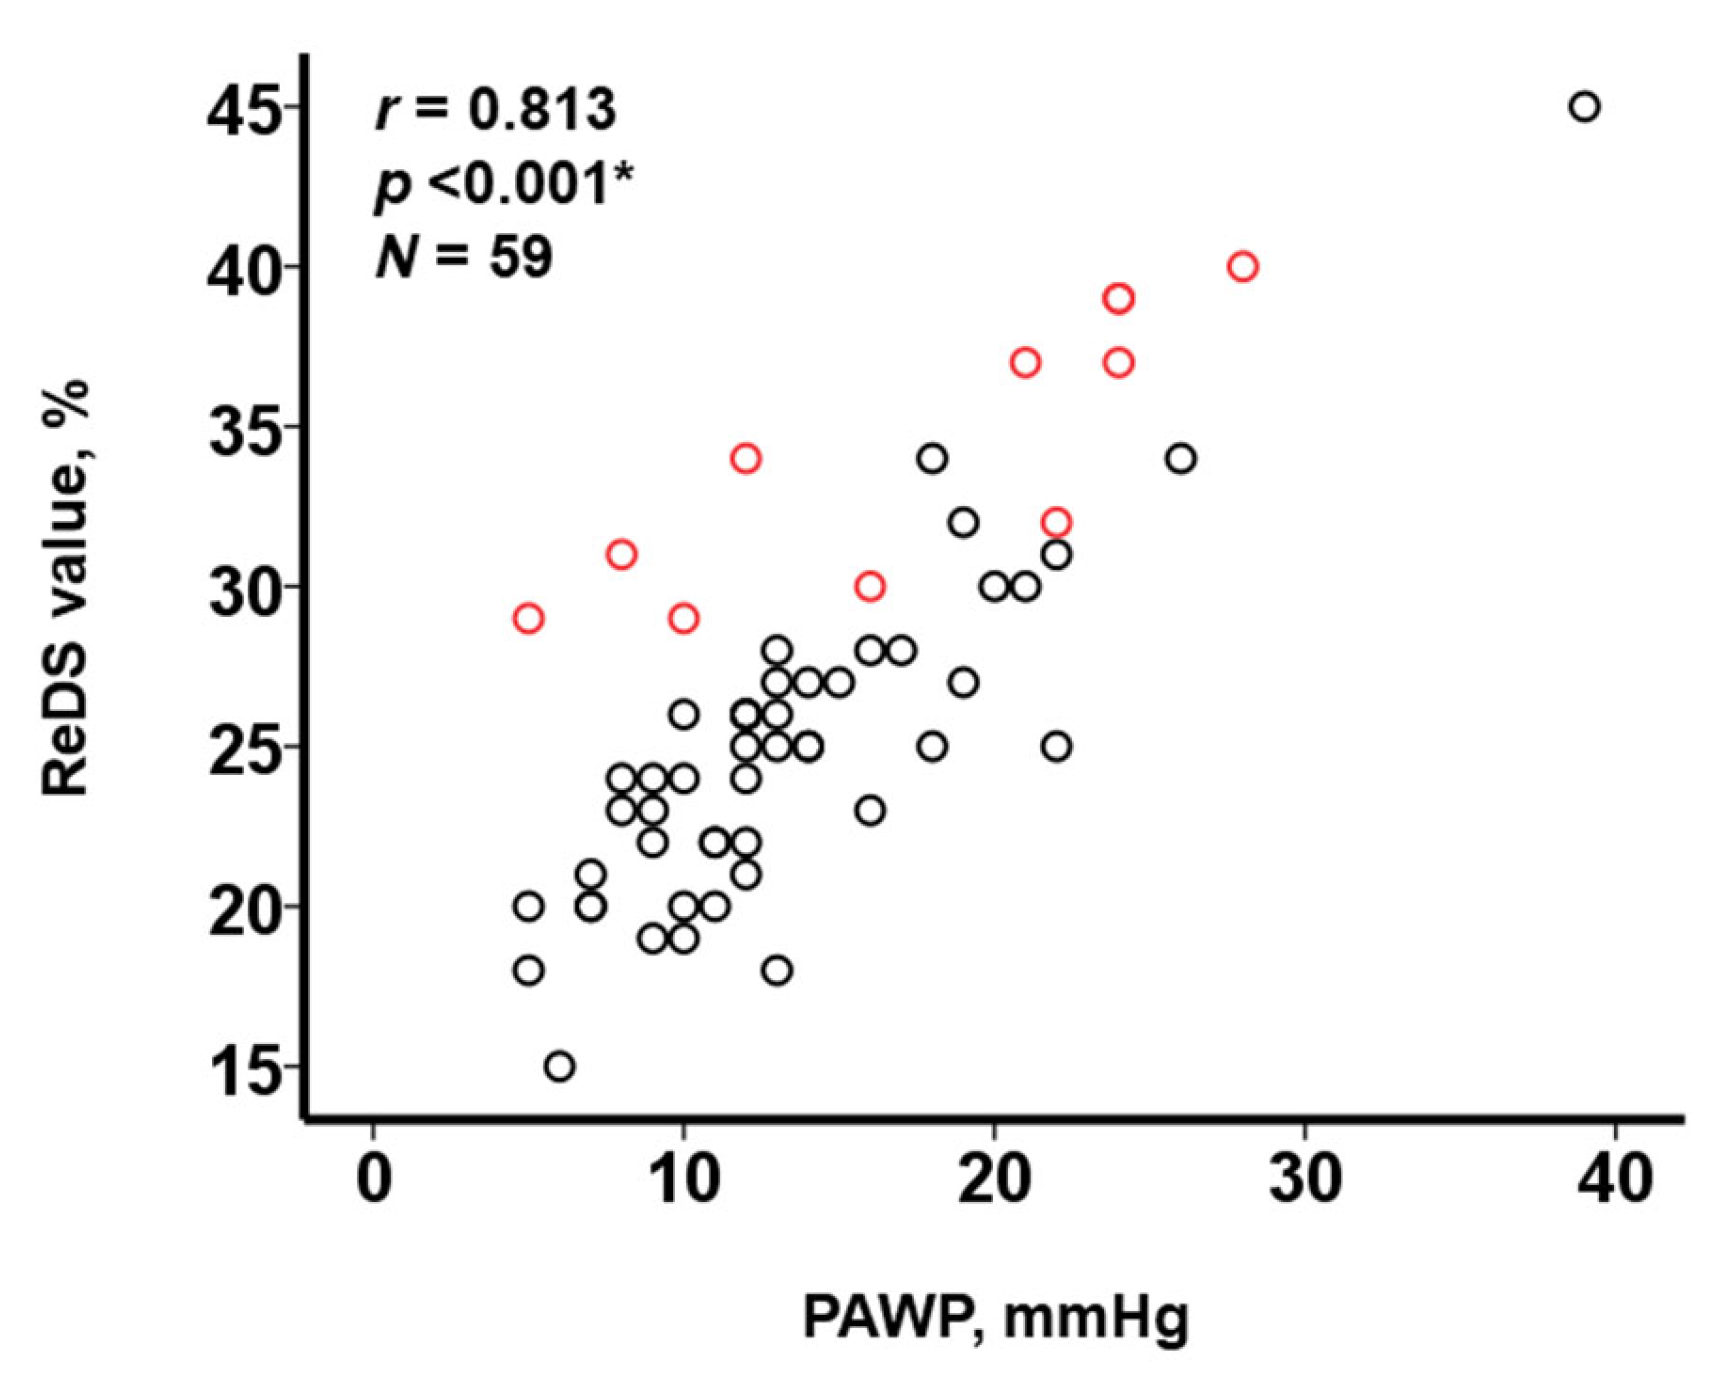
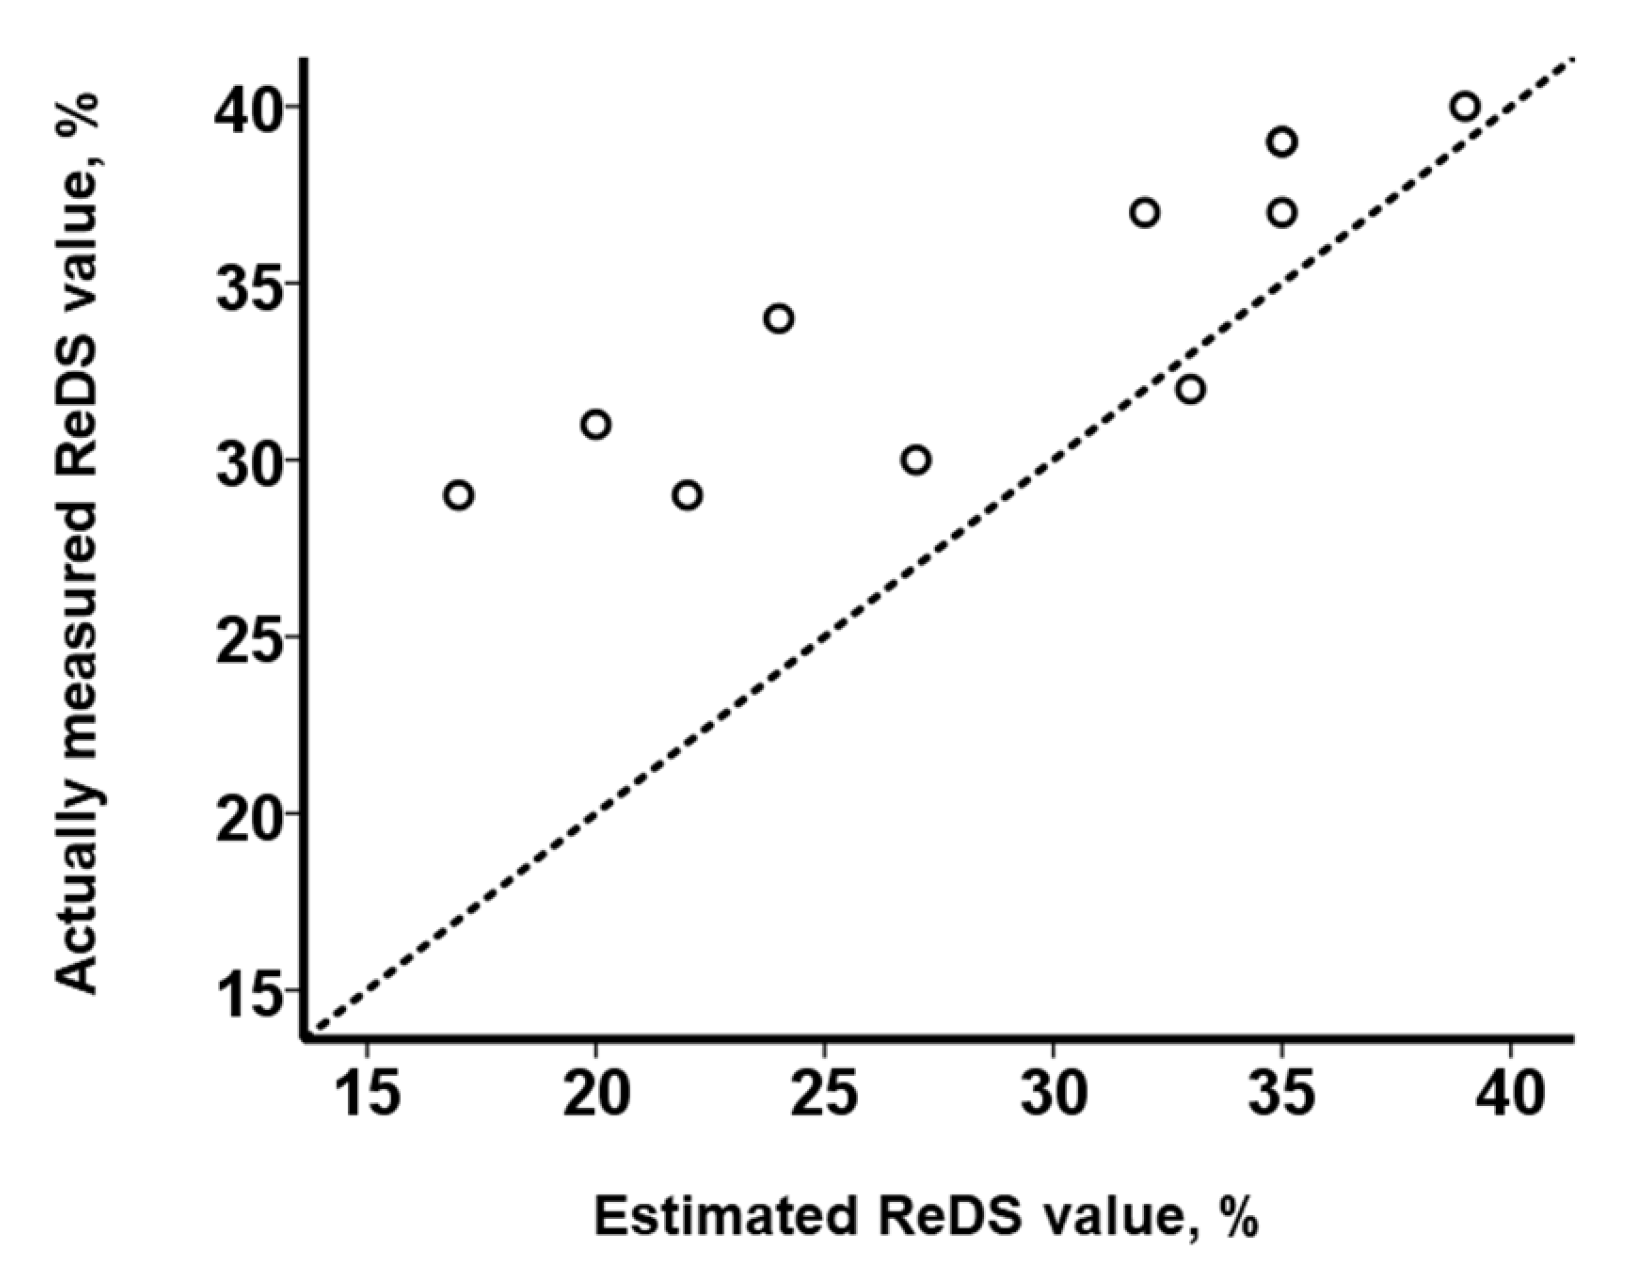
3.3. Impact of PE on the Relationship between ReDS Values and PAWP
4. Discussion
4.1. ReDS System to Estimate PAWP Levels
4.2. Impact of the Presence of PE on the Relationship between ReDS Values and PAWP
4.3. Limitations
5. Conclusions
Author Contributions
Funding
Institutional Review Board Statement
Informed Consent Statement
Data Availability Statement
Conflicts of Interest
References
- Bart, N.K.; Kotlyar, E.; Keogh, A.M. Pulmonary haemodynamics and pulmonary congestion: Where are we now? Eur. Heart J. 2022, 43, 4515. [Google Scholar] [CrossRef] [PubMed]
- Rivas-Lasarte, M.; Maestro, A.; Fernandez-Martinez, J.; Lopez-Lopez, L.; Sole-Gonzalez, E.; Vives-Borras, M.; Montero, S.; Mesado, N.; Pirla, M.J.; Mirabet, S.; et al. Prevalence and prognostic impact of subclinical pulmonary congestion at discharge in patients with acute heart failure. ESC Heart Fail. 2020, 7, 2621–2628. [Google Scholar] [CrossRef] [PubMed]
- Imamura, T. How to Assess the Degree of Pulmonary Congestion in Patients with Congestive Heart Failure. J. Clin. Med. 2023, 12, 2889. [Google Scholar] [CrossRef] [PubMed]
- Gardner, R.S.; Henderson, G.; McDonagh, T.A. The prognostic use of right heart catheterization data in patients with advanced heart failure: How relevant are invasive procedures in the risk stratification of advanced heart failure in the era of neurohormones? J. Heart Lung Transplant. 2005, 24, 303–309. [Google Scholar] [CrossRef] [PubMed]
- Imamura, T.; Narang, N.; Kinugawa, K. Clinical implications of remote dielectric sensing system to estimate lung fluid levels. J. Cardiol. 2023, 81, 276–282. [Google Scholar] [CrossRef] [PubMed]
- Imamura, T.; Gonoi, W.; Hori, M.; Ueno, Y.; Narang, N.; Onoda, H.; Tanaka, S.; Nakamura, M.; Kataoka, N.; Ushijima, R.; et al. Validation of Noninvasive Remote Dielectric Sensing System to Quantify Lung Fluid Levels. J. Clin. Med. 2021, 11, 164. [Google Scholar] [CrossRef] [PubMed]
- Imamura, T.; Hori, M.; Ueno, Y.; Narang, N.; Onoda, H.; Tanaka, S.; Nakamura, M.; Kataoka, N.; Sobajima, M.; Fukuda, N.; et al. Association between Lung Fluid Levels Estimated by Remote Dielectric Sensing Values and Invasive Hemodynamic Measurements. J. Clin. Med. 2022, 11, 1208. [Google Scholar] [CrossRef] [PubMed]
- Izumida, T.; Imamura, T.; Kinugawa, K. Remote dielectric sensing and lung ultrasound to assess pulmonary congestion. Heart Vessels 2022, 38, 517–522. [Google Scholar] [CrossRef] [PubMed]
- Izumida, T.; Imamura, T.; Hori, M.; Nakagaito, M.; Onoda, H.; Tanaka, S.; Ushijima, R.; Kinugawa, K. Correlation between Remote Dielectric Sensing and Chest X-ray to Assess Pulmonary Congestion. J. Clin. Med. 2023, 12, 598. [Google Scholar] [CrossRef] [PubMed]
- Izumida, T.; Imamura, T.; Hori, M.; Kinugawa, K. Correlation Between Plasma B-Type Natriuretic Peptide Levels and Remote Dielectric Sensing in Patients with Heart Failure. Int. Heart J. 2022, 63, 1128–1133. [Google Scholar] [CrossRef] [PubMed]
- Amir, O.; Azzam, Z.S.; Gaspar, T.; Faranesh-Abboud, S.; Andria, N.; Burkhoff, D.; Abbo, A.; Abraham, W.T. Validation of remote dielectric sensing (ReDS) technology for quantification of lung fluid status: Comparison to high resolution chest computed tomography in patients with and without acute heart failure. Int. J. Cardiol. 2016, 221, 841–846. [Google Scholar] [CrossRef] [PubMed] [Green Version]
- Uriel, N.; Sayer, G.; Imamura, T.; Rodgers, D.; Kim, G.; Raikhelkar, J.; Sarswat, N.; Kalantari, S.; Chung, B.; Nguyen, A.; et al. Relationship Between Noninvasive Assessment of Lung Fluid Volume and Invasively Measured Cardiac Hemodynamics. J. Am. Heart Assoc. 2018, 7, e009175. [Google Scholar] [CrossRef] [PubMed] [Green Version]
- Izumida, T.; Imamura, T.; Tanaka, S.; Kinugawa, K. Experience with remote dielectric sensing (ReDS) for acute decompensated heart failure complicated by chronic obstructive pulmonary disease. J. Cardiol. Cases 2022, 26, 386–389. [Google Scholar] [CrossRef] [PubMed]
- Jany, B.; Welte, T. Pleural Effusion in Adults-Etiology, Diagnosis, and Treatment. Dtsch. Arztebl. Int. 2019, 116, 377–386. [Google Scholar] [CrossRef] [PubMed]
- Amir, O.; Rappaport, D.; Zafrir, B.; Abraham, W.T. A novel approach to monitoring pulmonary congestion in heart failure: Initial animal and clinical experiences using remote dielectric sensing technology. Congest. Heart Fail. 2013, 19, 149–155. [Google Scholar] [CrossRef] [PubMed]
- Moy, M.P.; Levsky, J.M.; Berko, N.S.; Godelman, A.; Jain, V.R.; Haramati, L.B. A new, simple method for estimating pleural effusion size on CT scans. Chest 2013, 143, 1054–1059. [Google Scholar] [CrossRef] [PubMed] [Green Version]
- Imamura, T.; Izumida, T.; Narang, N.; Kinugawa, K. Changes in lung fluid levels with variations in the respiratory cycle. Heart Vessels 2023, 38, 749–752. [Google Scholar] [CrossRef] [PubMed]

| Total (N = 59) | PE (N = 11) | No PE (N = 48) | p Value | |
|---|---|---|---|---|
| Demographics | ||||
| Age, years | 79 (72, 84) | 74 (70, 84) | 79 (72, 84) | 0.78 |
| Male sex | 30 (51%) | 6 (55%) | 24 (50%) | 0.53 |
| Body mass index | 21.6 (19.5, 24.3) | 22.5 (20.2, 23.6) | 21.4 (19.3, 24.6) | 0.44 |
| Comorbidity | ||||
| Hypertension | 49 (83%) | 11 (100%) | 38 (79%) | 0.097 |
| Dyslipidemia | 26 (44%) | 6 (55%) | 20 (42%) | 0.44 |
| Diabetes mellitus | 15 (25%) | 4 (36%) | 11 (23%) | 0.36 |
| Heart failure | 31 (53%) | 6 (55%) | 25 (52%) | 0.58 |
| Atrial fibrillation | 27 (46%) | 4 (36%) | 23 (48%) | 0.36 |
| History of stroke | 5 (9%) | 3 (27%) | 2 (4%) | 0.013 * |
| History of coronary intervention | 6 (10%) | 1 (9%) | 5 (10%) | 0.90 |
| Echocardiography | ||||
| Left atrial diameter, mm | 45 (38, 49) | 48 (39, 59) | 45 (38, 49) | 0.18 |
| LVDd, mm | 48 (44, 57) | 49 (46, 58) | 48 (44, 57) | 0.69 |
| LVEF, % | 54 (40, 69) | 45 (28, 60) | 57 (44, 71) | 0.17 |
| Moderate or grater MR | 25 (42%) | 3 (27%) | 22 (46%) | 0.26 |
| Moderate or greater TR | 18 (31%) | 3 (27%) | 15 (31%) | 0.80 |
| Hemodynamics | ||||
| Mean right atrial pressure, mmHg | 8 (5, 10) | 9 (7, 16) | 6 (5, 10) | 0.20 |
| Mean pulmonary artery pressure, mmHg | 21 (17, 26) | 30 (21, 36) | 21 (17, 24) | 0.067 |
| PAWP, mmHg | 13 (10, 18) | 21 (11, 24) | 12 (10, 16) | 0.079 |
| Cardiac index, L/min/m2 | 2.4 (2.1, 2.9) | 2.6 (1.7, 3.1) | 2.4 (2.2, 2.8) | 0.87 |
| Systolic blood pressure, mmHg | 108 (90, 131) | 91 (81, 131) | 108 (92, 130) | 0.39 |
| Heart rate, bpm | 70 (63, 80) | 72 (58, 91) | 70 (64, 80) | 0.39 |
| Laboratory data | ||||
| Plasma BNP, pg/mL | 231 (82, 474) | 447 (245, 697) | 198 (65, 454) | 0.027 * |
| Medications | ||||
| Loop diuretics | 33 (56%) | 8 (73%) | 25 (52%) | 0.21 |
| Beta-blocker | 34 (58%) | 6 (54%) | 28 (58%) | 0.82 |
| Renin–angiotensin system inhibitor | 46 (78%) | 11 (100%) | 35 (73%) | 0.051 |
| Mineralocorticoid receptor antagonist | 28 (48%) | 5 (45%) | 23 (48%) | 0.58 |
| ReDS value, % | 25 (22, 30) | 34 (31, 38) | 25 (22, 27) | <0.001 * |
Disclaimer/Publisher’s Note: The statements, opinions and data contained in all publications are solely those of the individual author(s) and contributor(s) and not of MDPI and/or the editor(s). MDPI and/or the editor(s) disclaim responsibility for any injury to people or property resulting from any ideas, methods, instructions or products referred to in the content. |
© 2023 by the authors. Licensee MDPI, Basel, Switzerland. This article is an open access article distributed under the terms and conditions of the Creative Commons Attribution (CC BY) license (https://creativecommons.org/licenses/by/4.0/).
Share and Cite
Imamura, T.; Izumida, T.; Yamamoto, R.; Nomoto, Y.; Aakao, K.; Kinugawa, K. Presence of Pleural Effusion in the Assessment of Remote Dielectric Sensing. J. Clin. Med. 2023, 12, 4415. https://doi.org/10.3390/jcm12134415
Imamura T, Izumida T, Yamamoto R, Nomoto Y, Aakao K, Kinugawa K. Presence of Pleural Effusion in the Assessment of Remote Dielectric Sensing. Journal of Clinical Medicine. 2023; 12(13):4415. https://doi.org/10.3390/jcm12134415
Chicago/Turabian StyleImamura, Teruhiko, Toshihide Izumida, Riona Yamamoto, Yu Nomoto, Kousuke Aakao, and Koichiro Kinugawa. 2023. "Presence of Pleural Effusion in the Assessment of Remote Dielectric Sensing" Journal of Clinical Medicine 12, no. 13: 4415. https://doi.org/10.3390/jcm12134415