Abstract
The objective of this study was to determine whether there is an association between sex and outcome in trauma patients presented with severe traumatic brain injury (TBI). A retrospective multicenter study was performed in trauma patients aged ≥ 16 years who presented with severe TBI (Head Abbreviated Injury Scale (AIS) ≥ 4) over a 4-year-period. Subgroup analyses were performed for ages 16–44 and ≥45 years. Also, patients with isolated severe TBI (other AIS ≤ 2) were assessed, likewise, with subgroup analysis for age. Sex differences in mortality, Glasgow Outcome Score (GOS), ICU admission/length of stay (LOS), hospital LOS, and mechanical ventilation (MV) were examined. A total of 1566 severe TBI patients were included (831 patients with isolated TBI). Crude analysis shows an association between female sex and lower ICU admission rates, shorter ICU/hospital LOS, and less frequent and shorter MV in severe TBI patients ≥ 45 years. After adjusting, female sex appears to be associated with shorter ICU/hospital LOS. Sex differences in mortality and GOS were not found. In conclusion, this study found sex differences in patient outcomes following severe TBI, potentially favoring (older) females, which appear to indicate shorter ICU/hospital LOS (adjusted analysis). Large prospective studies are warranted to help unravel sex differences in outcomes after severe TBI.
1. Introduction
Traumatic brain injury (TBI) is a major cause of mortality and morbidity, resulting in millions of years of life lost [1,2,3,4]. In a European cross-sectional study with nearly 1.5 million patients, 55% of the patients suffering from TBI were 44 years or younger. TBI contributed to about 37% of the overall all-injury age-adjusted mortality, and interestingly, when splitting for sex, 42% in males and 29% in females [3]. Male patients were also more frequently admitted to the Emergency Department (ED) after TBI when compared to female patients and comprised the majority of mortalities [3].
In a large retrospective analysis, it was shown that female sex was independently associated with reduced mortality and decreased complications after TBI when compared to their male counterparts, especially in the peri- and postmenopausal-aged [5]. Likewise, female patients aged ≥ 50 years with moderate-to-severe TBI had increased survival rates when compared to age-matched males [6]. Furthermore, it was retrospectively found that female TBI patients had lower mortality rates compared to males during hospital admission [7]. On the other hand, several studies found higher mortality rates for female sex compared to male sex [8,9]. Ottochian et al. showed that females, particularly those aged ≥ 55 years, were significantly associated with mortality in isolated TBI, and another study found that females < 50 years had significantly higher mortality rates than males [8,9].
Although clinical studies have shown conflicting results regarding the protective effect of female sex in TBI [5,6,7,8,9,10,11,12,13], there is evidence suggesting that male and female nervous systems respond differently to injury. For example, in preclinical studies, the administration of estrogen and progesterone had a protective effect on mortality and complications, such as edema formation in rodents with TBI [14,15,16,17,18]. Furthermore, previous research found several protective effects of estrogen administration in mice with spinal cord injury, such as reducing the development of inflammation and tissue injury [19]. These findings suggest a role for sex hormones, and consequently age, in the relationship between sex and outcome after TBI, which, together, could possibly explain the contradictory findings of the clinical studies.
The aim of the present study was to investigate whether there is an association between sex and outcome among trauma patients presented with severe TBI. It was hypothesized that female sex, especially in the premenopausal age (aged 16–44 years) subgroup, is associated with better outcomes when compared to their male counterparts.
2. Materials and Methods
2.1. Study Design and Population
A retrospective study in three level I trauma centers in the Netherlands between 1 January 2015 and 31 December 2018 was performed. The included patients were aged 16 years or older and were admitted to the ED with a Head Abbreviated Injury Score (AIS) ≥ 4 [20]. Patients with drowning, asphyxia, or burns were excluded. To consider the potential influence of hormonal status, patients were stratified into two age groups (16–44 and ≥45 years) as a surrogate for the premenopausal and perimenopausal/postmenopausal phase, respectively [21]. In addition, a sub-analysis was performed in patients with isolated severe TBI. Isolated severe TBI was defined as an AIS Head ≥ 4 and other body region AIS scores ≤ 2. The study was approved by the independent Medical Research Ethics Committees of the three participating hospitals.
2.2. Data Collection and Parameter Outcome
Demographic and outcome parameters for all male and female patients were collected from the Trauma Registry. Injuries were classified by AIS per body region, injury severity by the Injury Severity Score (ISS), and vital signs by the Revised Trauma Score (RTS). Severe injuries of the head, thorax, abdomen, and lower extremity were dichotomized as an AIS of ≥3 per body region, respectively. ISS was used as a continuous variable. Vital signs of the patients were represented by the RTS as continuous and dichotomous variables (<4). The mechanism of injury (MOI) was either blunt or penetrating. The Glasgow coma scale (GCS) at admission was collected both as continuous and as dichotomous variables (≤8). Systolic blood pressure (SBP) at admission was collected both as a continuous variable and a dichotomized variable (<90 mmHg). Furthermore, pre-trauma comorbidity was collected as an ordinal variable using the American Society of Anesthesiologists (ASA) Physical Status Classification System (healthy, ASA I or mild comorbidity, ASA II and severe comorbidity, ASA ≥ III). Prehospital intubation, Physician-staffed Helicopter Emergency Medical Services (P-HEMS), assistance, and in-hospital treatment (including craniotomy and Intra Cranial Pressure (ICP) measurement) were defined as dichotomous variables. Primary outcomes were in-hospital mortality, unfavorable Glasgow Outcome Score (GOS) ≤3 at hospital discharge [22] and ICU admission. Secondary outcomes were 30-day mortality, ICU LOS, hospital LOS, MV during admission, and MV duration.
2.3. Statistical Analyses
Statistical tests were performed using IBM SPSS Statistics 27.0 and two-sided testing with a p-value < 0.0167 and <0.05 for primary and secondary outcomes, respectively, was considered statistically significant. A univariate data analysis was performed to compare patient demographics. In this study, male patients were used as a reference group compared to female patients. Continuous variables were presented as mean ± standard deviation (SD) and independent student’s t-tests were used to compare means between two groups for equally distributed data. For skewed data, median and interquartile range (IQR) were shown and a Mann–Whitney U-test was performed to compare medians between two groups. Categorical variables were expressed as proportions and compared using Chi-squared (χ2) tests or Fisher’s Exact Test. Logistic regression analyses were performed to determine if sex was associated with in-hospital mortality, GOS ≤ 3, ICU admission, 30-day mortality, ICU LOS > 7 days, hospital LOS > 7 days, MV during admission, and MV > 7 days. Regression models were presented with unadjusted values, and adjusted values for a priori-based covariates based on clinical relevance, including age, MOI, ISS, RTS < 4, GCS ≤ 8, Shock Index (SI), comorbidity ASA ≥ III, ICP measurement, and craniotomy. A maximum number of covariates was accepted during analysis powered to the smallest group in our primary outcome. Missing data was not replaced and only complete cases were included in the multivariable models. Logistic regression analyses results are presented as odds ratio (OR) with 95% confidence intervals (CI). Also, analyses were performed after stratification for age (16–44 and ≥ 45 years) and isolated TBI.
3. Results
3.1. Patient Characteristics—Severe TBI
A total of 1566 severe TBI patients were included (Figure 1). The study population characteristics are presented in Table 1. Median age was higher in females compared to males (65 vs. 56 years, p < 0.001, Table 1). Patients aged 16 to 44 were more likely to be male (35.6% vs. 20.8%, p < 0.001, Table 1), whereas patients aged 45 or older where more likely to be female (79.2% vs. 64.4%, p < 0.001, Table 1). At ED admission, males compared to females showed a significantly higher ISS (26 vs. 25, p < 0.001, Table 1), lower RTS (5.97 vs. 5.97, p = 0.005, Table 1), higher SI (0.6 vs. 0.6, p = 0.012, Table 1), and lower GCS (6 vs. 8, p = 0.010, Table 1).
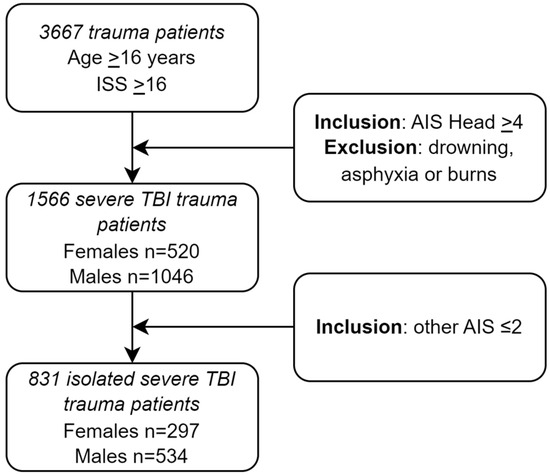
Figure 1.
Flowchart of included trauma patients admitted to the ED of three level I trauma centers.

Table 1.
Patient characteristics in the study population of trauma patients with severe TBI.
Furthermore, males compared to females presented more frequently with AIS Spine ≥ 3 (6.6% vs. 4.0%, p = 0.041, Table 1), AIS Thorax ≥ 3 (26.5% vs. 17.3%, p < 0.001, Table 1), RTS < 4 (8.7% vs. 5.2%, p = 0.013, Table 1), SBP < 90 mmHg (8.4% vs. 4.8%, p = 0.009, Table 1), prehospital intubation (49.3% vs. 41.3%, p = 0.003), and P-HEMS assistance (36.3% vs. 27.9%, p < 0.001). Other patient characteristics did not show significant differences for sex.
3.2. Clinical Outcomes—Severe TBI
No significant differences in in-hospital mortality (34.2% vs. 33.3%, p = 0.704, Table 2), 30-day mortality (35.4% vs. 34.3%, p = 0.677, Table 2), or GOS ≤ 3 at hospital discharge (57.3% vs. 58.6%, p = 0.622, Table 2) were found for females vs. males, respectively (Table 2). Females compared to males did have a significantly lower ICU admission rate (65.2% vs. 72.5%, p = 0.003, Table 2), lower ICU LOS (3 vs. 2 days, p = 0.002, Table 2), and less frequently ICU LOS > 7 days (23.8% vs. 30.8%, p = 0.004, Table 2). Moreover, females compared to males showed shorter hospital LOS (6 vs. 7 days, p = 0.044, Table 2). Females were less frequently mechanically ventilated at ED admission (50.2% vs. 57.4%, p = 0.007, Table 2) and for a shorter period of time (1 vs. 2 days, p = 0.004, Table 2).
Table 2.
Clinical outcomes of trauma patients with severe TBI stratified for sex.
3.3. Logistic Regression Analysis—Severe TBI
Unadjusted logistic regression analysis showed a significant association between sex and the outcomes of ICU admission (OR 0.712; 95% CI 0.568–0.892, p = 0.003, Table 3), ICU LOS > 7 days (OR 0.704; 95% CI 0.553–0.896, p = 0.004, Table 3), and MV at ED admission (OR 0.749; 95% CI 0.607–0.925, p = 0.007, Table 3). Female sex was not associated with in-hospital mortality (OR 1.044; 95% CI 0.836–1.304, p = 0.704, Table 3), GOS ≤ 3 at hospital discharge (OR 1.056; 95% CI 0.850–1.312, p = 0.622, Table 3), or other outcome measures. After adjusting for covariates (Appendix A), female sex appears to be associated with ICU LOS > 7 days (OR 0.719; 95% CI 0.544–0.951, p = 0.021, Table 3) but not with ICU admission (OR 0.796; 95% CI 0.608–1.043, p = 0.098, Table 3) or MV at ED admission (OR 0.808; 95% CI 0.609–1.071, p = 0.139, Table 3).
Table 3.
The association of female sex with clinical outcome parameters in trauma patients presenting with severe TBI.
3.4. Patient Characteristics—Severe TBI—Stratified for Age
Four hundred eighty patients aged 16 to 44 years were identified (22.5% females). Females compared to males were significantly younger (25 vs. 28 years, p = 0.001, Appendix B, Table A9), had lower SBP (122 vs. 130 mmHg, p = 0.002, Appendix B, Table A9), and lower SI (0.7 vs. 0.7, p = 0.038, Appendix B, Table A9) at ED admission. Other patient characteristics for the patients aged 16 to 44 years did not show significant differences for sex.
In the ≥45 years group, 1086 patients were identified (37.9% female) of which females compared to males showed significantly higher age (70 vs. 68 years, p = 0.008, Appendix B, Table A9) and blunt injury as the mechanism of injury (99.8% vs. 97.8%, p = 0.008, Appendix B, Table A9). At ED admission, males compared to females showed a significantly higher ISS (25 vs. 25, p = 0.006, Appendix B, Table A9), lower RTS (5.97 vs. 6.76, p = 0.007, Appendix B, Table A9), higher SI (0.6 vs. 0.6, p = 0.008, Appendix B, Table A9), and lower GCS (7 vs. 9, p = 0.010, Appendix B, Table A9). Furthermore, males compared to females were more frequently presented with AIS Spine ≥ 3 (6.1% vs. 2.4%, p = 0.006, Appendix B, Table A9), AIS Thorax ≥ 3 (23.9% vs. 14.3%, p < 0.001, Appendix B, Table A9), SBP < 90 mmHg (8.3% vs. 3.6%, p = 0.003), prehospital intubation (46.7% vs. 37.2%, p = 0.002, Appendix B, Table A9), and P-HEMS assistance (36.5% vs. 26.0%, p = <0.001). In contrast, females more often underwent a craniotomy compared to males (22.1% vs. 16.8%, p = 0.029, Appendix B, Table A9). Other patient characteristics for the patients aged ≥ 45 years did not show significant differences for sex.
3.5. Clinical Outcomes—Severe TBI—Stratified for Age
No significant sex differences in outcomes in patients aged 16–44 years were found (Table 4). In patients aged ≥ 45 years, females compared to males were less often, (62.1% vs. 69.6%, p = 0.011, Table 4) and for shorter time periods, admitted to the ICU (2 vs. 2 days, p = 0.004, Table 4), and they showed lower rates of ICU LOS > 7 days (34.8% vs. 42.0%, p = 0.006, Table 4). Furthermore, females had a lower hospital LOS compared to their male counterparts (5 vs. 7, p = 0.024, Table 4). Also, females were less frequently mechanically ventilated at ED admission (46.6% vs. 53.4%, p = 0.029, Table 4) and for a shorter period of time (1 vs. 1 days, p = 0.005, Table 4). No significant differences in in-hospital mortality (37.6% vs. 38.9%, p = 0.681, Table 4), GOS ≤ 3 at hospital discharge (58.8% vs. 63.5%, p = 0.132, Table 4), or other outcomes were found for females vs. males, respectively (Table 4).
Table 4.
Clinical outcomes of trauma patients with severe TBI stratified for age 16–44 years and ≥45 years.
3.6. Logistic Regression Analysis—Severe TBI—Stratified for Age
No significant associations between sex and outcome were found in patients aged 16–44 years (Table 5).
Table 5.
The association of female sex with clinical outcome parameters in trauma patients presenting with severe TBI stratified for age 16–44 years and ≥45 years.
For patients aged ≥ 45 years, unadjusted logistic regression analysis showed a significant association between sex and the outcomes of ICU admission (OR 0.717; 95% CI 0.554–0.928, p = 0.012, Table 5), ICU LOS > 7 days (OR 0.667; 95% CI 0.501–0.889, p = 0.006, Table 5), and MV at ED admission (OR 0.761; 95% CI 0.595–0.973, p = 0.030, Table 5). Female sex was not associated with in-hospital mortality (OR 0.948; 95% CI 0.737–1.221, p = 0.681, Table 5), GOS ≤ 3 at hospital discharge (OR 1.217; 95% CI 0.942–1.572, p = 0.133, Table 5), or other outcome measures. After adjusting for covariates, female sex was still associated with ICU LOS > 7 days (OR 0.644; 95% CI 0.462–0.898, p = 0.010, Table 5) and with hospital LOS > 7 days (OR 0.755; 95% CI 0.580–0.983, p = 0.037, Table 5), but not with ICU admission (OR 0.742; 95% CI 0.544–1.012, p = 0.060, Table 5) or MV at ED admission (OR 0.761; 95% CI 0.547–1.058, p = 0.104, Table 5).
3.7. Patient Characteristics—Isolated Severe TBI
Eight hundred thirty-one isolated severe TBI patients aged ≥ 16 years with an AIS Head ≥ 4 and all other AIS scores ≤ 2 were admitted (Figure 1). Median age was higher in females compared to males (68 vs. 58 years, p < 0.001, Appendix B, Table A10). Patients aged 16 to 44 where more likely to be male (32.2% vs. 13.5%, p < 0.001, Appendix B, Table A10), whereas patients aged 45 or older where more likely to be female (86.5% vs. 67.8%, p < 0.001, Appendix B, Table A10). A blunt mechanism of injury was more frequent in females compared to males (99.7% vs. 97.2%, p = 0.013, Appendix B, Table A10). Other patient characteristics did not show significant differences for sex.
3.8. Clinical Outcomes—Isolated Severe TBI
No significant sex differences in clinical outcomes were found (Appendix B, Table A11).
3.9. Logistic Regression Analysis—Isolated Severe TBI
Unadjusted as well as adjusted logistic regression analysis, respectively, showed no significant association between sex and the outcomes (Appendix B, Table A12).
3.10. Patient Characteristics—Isolated Severe TBI—Stratified for Age
Two hundred twelve patients aged 16 to 44 years were identified (18.9% females). Females compared to males were significantly younger (25 vs. 30 years, p = 0.014, Appendix B, Table A13) and had lower SBP (125 vs. 134 mmHg, p = 0.005, Appendix B, Table A13) at ED admission. Other patient characteristics for the patients aged 16 to 44 years did not show significant differences for sex.
In the ≥45 years group, 619 patients were identified (41.5% female) of which females compared to males showed significantly higher age (71 vs. 68 years, p = 0.024, Appendix B, Table A13) and blunt injury as the mechanism of injury (99.2% vs. 96.6%, p = 0.003, Appendix B, Table A13). Other patient characteristics for the patients aged ≥ 45 years did not show significant differences for sex.
3.11. Clinical Outcomes—Isolated Severe TBI—Stratified for Age
No significant sex differences (in both age groups, 16–44 and ≥45 years, respectively) in clinical outcomes were found (Appendix B, Table A14).
3.12. Logistic Regression Analysis—Isolated Severe TBI—Stratified for Age
Unadjusted as well as adjusted logistic regression analysis in both age groups, 16–44 and ≥45 years, showed no significant association between sex and outcomes (Appendix B, Table A15).
4. Discussion
This study investigated sex differences in outcomes in a contemporary population of severe TBI patients at level 1 trauma centers in the Netherlands in a mature trauma system with complete datasets. In severe TBI patients, female sex compared to male sex was associated with lower ICU admission rates, shorter ICU LOS, shorter hospital LOS, and less frequent and shorter MV in crude analysis (Table 2). Furthermore, when adjusting for a priori-determined covariates in severe TBI patients, female sex appears to be associated with a decreased (28.1%) likelihood for ICU LOS > 7 days compared to male sex (Table 3). Significant associations between sex and in-hospital mortality, GOS ≤ 3 at discharge, and 30-day mortality could not be confirmed. Subgroup analysis for age in severe TBI patients showed that the above mentioned crude sex differences in outcomes favoring females seem to be limited to the older patient group (≥5 years) (Table 4). When adjusting for covariates in these older aged severe TBI patients, female sex compared to male sex appears to be associated with a decreased (18% and 7.2%) likelihood for ICU LOS > 7 days and hospital LOS > 7 days, respectively (Table 5). In severe isolated TBI patients, an association between sex and clinical outcomes could not be confirmed. Subgroup analysis for age in severe isolated TBI similarly did not show sex differences in patient outcomes.
This study specifically focused on trauma patients with severe TBI as defined by Head AIS ≥ 4. According to our knowledge, this is the first study regarding sexual dimorphism in outcomes in patients with severe TBI as defined by Head AIS ≥ 4. In contrast to other studies, a Head AIS ≥ 4 was an inclusion criterion in this study instead of GCS, as a low GCS may also include intubated patients without TBI [7,11,13].
In line with our earlier-mentioned findings regarding the association between sex and outcome in severe TBI, Mikolic et al. found that, following moderate/severe TBI, females compared to males had shorter median hospital LOS and mild TBI females were less likely to be admitted to the ICU [11]. Sex differences in the Glasgow Outcome Scale Extended (GOSE) for females with mild TBI and more post-concussion symptoms for females after suffering from moderate/severe TBI were found [11], whereas in our study sex differences in GOS were not found. However, our follow-up may not have been long enough to find a significant difference, as patients with TBI usually still recover over time, both during rehabilitation and after hospital discharge. Similar to our findings regarding mortality, Mikolic et al., Yeung et al., Leitgeb et al., and Ponsford et al. did not find a significant association between sex and mortality following TBI [10,11,12,13]. Contrary to our findings, Berry et al., Davis et al., and De Guise et al. did find a survival advantage for females compared to males from the same age group [5,6,7].
In the literature, several studies report on the role of age in the association between sex and outcome. Similar to our finding that females (aged ≥ 45 years) had lower ICU admission rates and shorter ICU/hospital LOS, multiple studies into sex differences in severe (non TBI) trauma patients also demonstrated that males have a significantly higher rate of ICU admission and a longer ICU LOS compared to females [23,24,25]. De Guise et al. found no sex differences in hospital LOS nor in GOSE outcome [7]. Furthermore, Berry et al. included 72,294 patients with moderate/severe TBI (AIS Head ≥ 3) and applied stratification for age as a surrogate for hormonal status: 14–45 years (premenopausal), 46–55 years (perimenopausal), and >55 years (postmenopausal). In line with our findings, the study did not find differences in mortality for premenopausal women compared to age-matched males, but, contrarily, it did find a significantly lower risk for mortality for perimenopausal/postmenopausal females [5]. Likewise, Davis et al. found a lower mortality for females aged ≥ 50 years compared to age-matched males in patients with moderate-to-severe TBI (AIS Head ≥ 3) [6] and De Guise et al. found that female sex was associated with a reduced likelihood of in-hospital mortality after adjusting for covariates in patients with moderate/severe TBI [7]. Interestingly, Czosnyka et al. and Ottochian et al. found not lower, but higher mortality rates for females compared to males [8,9]. Czosnyka et al. showed that premenopausal females (<50 years) had a significantly higher mortality rate compared to males [8] and Ottochian et al. that female postmenopausal (≥55 years) patients with isolated moderate-to-severe TBI (AIS Head ≥ 3) had a significantly higher mortality rate [9]. Critically reviewing the existing literature and the results from this study, it appears that the baseline characteristics from the (older) severe TBI patients seemed to differ more in comparison to the other researched populations. Notably, a craniotomy was significantly more often performed in females aged > 45 years than in their male counterparts, which might suggest that females were more likely to have treatable injuries. Interestingly, although one could argue that males seem more severely injured compared to females, potentially explaining sex differences in outcomes such as ICU admission rate and ICU/hospital LOS, this does not definitively explain the similar mortality rates and GOS found in females and males.
It is important to evaluate the factors which could possibly contribute to observed sex differences in outcomes after TBI. Farace and Alves [26] performed a meta-analysis researching sex differences in TBI outcomes. They identified several contributing factors, e.g., mechanism of the accident (females are more likely to use safety restraints, which could change the site of impact/increase the severity of the accident to cause injury), mechanism in the brain (sex differences in functional organization of the brain are present), treatment effects (sex-related differences in brain metabolism are present), and premorbid sex differences (sex differences in incidence of TBI are broadly known, with males being more often affected). Other covariates could be of influence and mediate the effect between sex and outcome, such as injury severity, mechanism of injury, pre-existing comorbidity, and so on. Also, a speculative explanation of contradictory findings in the existing literature could be that unknown mediators attribute to the found effect, such as hormonal status, with estradiol or testosterone having a positive or negative effect on the association between sex and outcome. Unfortunately, studies regularly fail to measure hormone levels, which could potentially explain the sex differences in outcomes. There is, though, one prospective cohort study which measured sex steroids during ICU stays in severely injured patients and determined the association with mortality [27]. The authors did not find a sex difference in mortality but did find elevated estradiol levels in non-survivors regardless of sex. Therefore, estradiol may play a bigger role in relation to outcomes in the severely injured trauma patient than we are currently aware of [27]. In contrast, preclinical studies in rodents show a protective effect of administered estrogen in mortality rates following TBI [14,15,16,17,18]. These findings suggest higher levels of estrogen being potentially beneficial for survival after TBI. It is important to state that, since the current study did not measure hormonal levels during hospital admission, we can only speculate about hormones playing a role in the association between sex and outcome.
There are several limitations in this retrospective study. Females represent only 33.2% of the whole study population. Nevertheless, comparable percentages of included females compared to males were seen in similar studies [5,6,7,11]. And, despite the relatively large included population, subgroup sizes may be too small to detect a (age effect on) survival advantage for female patients with severe (isolated) TBI compared to male patients. Notably, other studies included more than 10,000 patients [6,9]. However, those articles also included moderate TBI whereas the current study only included patients with severe TBI, potentially resulting in different outcomes caused by the larger extent of damage to the brain. Because of the retrospective nature of the Trauma Registry, it was impossible to collect data on reproductive cycles, hormonal status, hormone replacements, or oral contraceptives. Therefore, patients were divided in subgroups as a surrogate for hormonal status: premenopausal or hormonally active phase (aged 16–44 years), in which estrogen levels are considered highest, and both the peri- and postmenopausal phase (aged ≥ 45 years), in which hormonal status is unclear or most likely inactive. Regarding parameter outcomes, GOS at hospital discharge did not show a significant sex difference. However, our follow-up may not have been long enough to find a significant difference, as patients with TBI usually still recover over time, during rehabilitation and after hospital discharge. This study did not further investigate different trauma mechanisms (e.g., fall from height or high velocity vehicle accident) or the use of direct oral anticoagulants, vitamin-k antagonists or thrombocyte aggregation inhibitors, which may lead to differences in outcomes after severe TBI. Furthermore, unknown factors may remain, contributing to the found sex differences in outcomes in the current study. Also, results regarding the association between sex and secondary outcomes serve an exploratory purpose and should therefore be seen as a means/focus for future studies and not to draw strong conclusions from. Lastly, it should be stated that this investigation adopts an exploratory approach, thereby precluding any conclusive assertion of causality.
One of the strengths of this study is, with regard to sample size, the relatively large included population: 1566 patients with severe TBI, of which 831 patients had severe isolated TBI. Other strengths of this study include the exclusion of trauma patients with drowning, asphyxia, or burns to reduce heterogeneity within the population due to difference in pathophysiology and the complete data on patient characteristics, treatment, and outcome, as well as the multicentered nature of this study. Lastly, in the adjusted outcomes reported in this study, the a priori-determined covariates method was used.
This study provides insights into the association between sex and outcomes in trauma patients with severe TBI. Sex differences in outcomes following severe TBI are found, potentially favoring (older) females. This suggests some support for the hypothesis that female compared to male trauma patients might benefit from protective effects, but the conclusion that females are better able to withstand trauma and sustain a physiologic response after severe TBI remains to be elucidated. Future research may focus on large prospective studies including additional variables such as hormonal status (including hormone serum levels), exact mechanism of injury, and use of hormone replacement therapy, direct oral anticoagulants, vitamin-k antagonists and thrombocyte aggregation inhibitors. This information will help to unravel sex differences in outcomes after trauma, specifically in severe TBI, and may eventually lead to future improvements of patient-specific treatment.
5. Conclusions
This study found sex differences in outcomes following severe TBI, potentially favoring females. In trauma patients with severe TBI, especially ≥ 45 years of age, female sex compared to male sex was significantly associated with lower ICU admission rates, shorter ICU LOS, shorter hospital LOS, and less frequent and shorter MV after crude analysis. Furthermore, female sex compared to male sex in severe TBI patients appears, after adjusting for covariates, significantly associated with shorter ICU LOS and hospital LOS. On the contrary, significant associations between sex and in-hospital mortality, GOS ≤ 3 at discharge, and 30-day mortality could not be confirmed in this study.
Even after stratification for age, no sex differences in outcomes in severe isolated TBI patients were found. The current results suggest that female sex might be related to different physiological responses to severe TBI. Nevertheless, causality, pathophysiology, and associations with outcomes such as mortality should be investigated in future prospective studies with larger populations to help unravel sex differences in outcomes after trauma.
Author Contributions
E.B. analyzed and interpreted all the patients’ data and wrote the article. S.F.v.W. collected patients’ data, helped to analyze and interpret data, and helped write the article. L.M.G.G.J. designed the study and led the multicenter project, interpreted the patients’ data, and was a major contributor in writing the manuscript. M.C.V., W.P.Z., T.N.T. and E.M.M.v.L. corrected the manuscript and helped S.F.v.W. with the process of ethical approval at the Medical Research Ethics Committees of the hospitals. F.W.B. and C.E.v.d.B. corrected the manuscript. M.J.R.E. and M.H.J.V. corrected the manuscript and gave their approval for using the data. All authors have read and agreed to the published version of the manuscript.
Funding
This research received no external funding.
Institutional Review Board Statement
The study was conducted in accordance with the Declaration of Helsinki, and approved by the Institutional Review Board of the Amsterdam UMC, Erasmus MC and Radboudumc (number: 2019.471/2021.0074, 2019.0657 and 2019.5913, respectively. First date of approval: 18 September 2019).
Informed Consent Statement
Patient consent was waived due to the observational and non-invasive nature of this study.
Acknowledgments
Graphical abstract was created with BioRender.com.
Data Availability Statement
The datasets generated and analyzed during the current study are available from the corresponding author on reasonable request.
Conflicts of Interest
The authors declare no conflict of interest.
Appendix A
Table A1.
Multivariable logistic regression analysis of in-hospital mortality in trauma patients presenting with severe TBI.
Table A1.
Multivariable logistic regression analysis of in-hospital mortality in trauma patients presenting with severe TBI.
| In-Hospital Mortality | ||||||||
|---|---|---|---|---|---|---|---|---|
| B | S.E. | Wald | df | Sig. | Exp(B) | 95% C.I. for EXP(B) | ||
| Lower | Upper | |||||||
| Sex | 0.072 | 0.137 | 0.274 | 1 | 0.600 | 1.074 | 0.822 | 1.405 |
| Age | 0.045 | 0.004 | 136.489 | 1 | <0.001 | 1.046 | 1.038 | 1.054 |
| MOI | 1.037 | 0.477 | 4.723 | 1 | 0.030 | 2.822 | 1.107 | 7.192 |
| ISS | 0.056 | 0.007 | 59.276 | 1 | <0.001 | 1.058 | 1.043 | 1.073 |
| RTS < 4 | 0.537 | 0.265 | 4.115 | 1 | 0.043 | 1.711 | 1.018 | 2.876 |
| GCS ≤ 8 | 1.774 | 0.149 | 141.624 | 1 | <0.001 | 5.897 | 4.403 | 7.898 |
| SI | 1.027 | 0.246 | 17.479 | 1 | <0.001 | 2.793 | 1.726 | 4.522 |
| ASA ≥ III | 0.270 | 0.170 | 2.529 | 1 | 0.112 | 1.310 | 0.939 | 1.826 |
| ICP | −0.132 | 0.199 | 0.441 | 1 | 0.506 | 0.876 | 0.593 | 1.294 |
| Craniotomy | 0.239 | 0.165 | 2.100 | 1 | 0.147 | 1.270 | 0.919 | 1.753 |
| Constant | −6.870 | 0.415 | 274.263 | 1 | <0.001 | 0.001 | ||
Table A2.
Multivariable logistic regression analysis of GOS ≤ 3 at discharge in trauma patients presenting with severe TBI.
Table A2.
Multivariable logistic regression analysis of GOS ≤ 3 at discharge in trauma patients presenting with severe TBI.
| GOS ≤ 3 at Discharge | ||||||||
|---|---|---|---|---|---|---|---|---|
| B | S.E. | Wald | df | Sig. | Exp(B) | 95% C.I. for EXP(B) | ||
| Lower | Upper | |||||||
| Sex | 0.119 | 0.140 | 0.728 | 1 | 0.394 | 1.127 | 0.857 | 1.481 |
| Age | −0.035 | 0.004 | 92.288 | 1 | <0.001 | 0.966 | 0.959 | 0.973 |
| MOI | −0.938 | 0.513 | 3.340 | 1 | 0.068 | 0.391 | 0.143 | 1.070 |
| ISS | −0.067 | 0.009 | 61.050 | 1 | <0.001 | 0.936 | 0.920 | 0.951 |
| RTS < 4 | 0.045 | 0.327 | 0.019 | 1 | 0.891 | 1.046 | 0.551 | 1.986 |
| GCS ≤ 8 | −2.071 | 0.149 | 193.604 | 1 | <0.001 | 0.126 | 0.094 | 0.169 |
| SI | −1.026 | 0.295 | 12.060 | 1 | <0.001 | 0.358 | 0.201 | 0.640 |
| ASA ≥ III | −0.741 | 0.178 | 17.388 | 1 | <0.001 | 0.476 | 0.336 | 0.675 |
| ICP | −0.827 | 0.228 | 13.104 | 1 | <0.001 | 0.437 | 0.279 | 0.684 |
| Craniotomy | −0.844 | 0.170 | 24.538 | 1 | <0.001 | 0.430 | 0.308 | 0.600 |
| Constant | 5.479 | 0.397 | 190.591 | 1 | <0.001 | 239.649 | ||
Table A3.
Multivariable logistic regression analysis of ICU admission in trauma patients presenting with severe TBI.
Table A3.
Multivariable logistic regression analysis of ICU admission in trauma patients presenting with severe TBI.
| ICU Admission | ||||||||
|---|---|---|---|---|---|---|---|---|
| B | S.E. | Wald | df | Sig. | Exp(B) | 95% C.I. for EXP(B) | ||
| Lower | Upper | |||||||
| Sex | −0.228 | 0.138 | 2.746 | 1 | 0.098 | 0.796 | 0.608 | 1.043 |
| Age | −0.017 | 0.003 | 24.535 | 1 | <0.001 | 0.984 | 0.977 | 0.990 |
| MOI | 0.076 | 0.470 | 0.026 | 1 | 0.872 | 1.079 | 0.430 | 2.710 |
| ISS | 0.037 | 0.008 | 21.033 | 1 | <0.001 | 1.038 | 1.021 | 1.054 |
| RTS < 4 | −0.190 | 0.309 | 0.380 | 1 | 0.538 | 0.827 | 0.451 | 1.515 |
| GCS ≤ 8 | 1.248 | 0.146 | 73.219 | 1 | <0.001 | 3.484 | 2.618 | 4.638 |
| SI | −0.395 | 0.265 | 2.218 | 1 | 0.136 | 0.674 | 0.401 | 1.133 |
| ASA ≥ III | 0.163 | 0.167 | 0.953 | 1 | 0.329 | 1.177 | 0.848 | 1.633 |
| ICP | 3.554 | 0.719 | 24.439 | 1 | <0.001 | 34.952 | 8.542 | 143.024 |
| Craniotomy | 2.158 | 0.247 | 76.113 | 1 | <0.001 | 8.656 | 5.330 | 14.057 |
| Constant | 0.144 | 0.313 | 0.212 | 1 | 0.645 | 1.155 | ||
Table A4.
Multivariable logistic regression analysis of 30-day mortality in trauma patients presenting with severe TBI.
Table A4.
Multivariable logistic regression analysis of 30-day mortality in trauma patients presenting with severe TBI.
| 30-Day Mortality | ||||||||
|---|---|---|---|---|---|---|---|---|
| B | S.E. | Wald | df | Sig. | Exp(B) | 95% C.I. for EXP(B) | ||
| Lower | Upper | |||||||
| Sex | 0.050 | 0.137 | 0.132 | 1 | 0.717 | 1.051 | 0.803 | 1.375 |
| Age | 0.047 | 0.004 | 147.664 | 1 | <0.001 | 1.048 | 1.040 | 1.056 |
| MOI | 1.025 | 0.485 | 4.467 | 1 | 0.035 | 2.787 | 1.077 | 7.212 |
| ISS | 0.054 | 0.007 | 54.834 | 1 | <0.001 | 1.056 | 1.041 | 1.071 |
| RTS <4 | 0.514 | 0.267 | 3.705 | 1 | 0.054 | 1.672 | 0.991 | 2.822 |
| GCS ≤ 8 | 1.878 | 0.151 | 155.285 | 1 | <0.001 | 6.541 | 4.868 | 8.789 |
| SI | 1.027 | 0.247 | 17.254 | 1 | <0.001 | 2.794 | 1.721 | 4.537 |
| ASA ≥ III | 0.472 | 0.170 | 7.758 | 1 | 0.005 | 1.604 | 1.150 | 2.236 |
| ICP | −0.221 | 0.200 | 1.215 | 1 | 0.270 | 0.802 | 0.541 | 1.188 |
| Craniotomy | 0.241 | 0.165 | 2.127 | 1 | 0.145 | 1.273 | 0.920 | 1.760 |
| Constant | −6.968 | 0.419 | 277.091 | 1 | <0.001 | 0.001 | ||
Table A5.
Multivariable logistic regression analysis of ICU > 7 days in trauma patients presenting with severe TBI.
Table A5.
Multivariable logistic regression analysis of ICU > 7 days in trauma patients presenting with severe TBI.
| ICU > 7 Days | ||||||||
|---|---|---|---|---|---|---|---|---|
| B | S.E. | Wald | df | Sig. | Exp(B) | 95% C.I. for EXP(B) | ||
| Lower | Upper | |||||||
| Sex | −0.330 | 0.143 | 5.355 | 1 | 0.021 | 0.719 | 0.544 | 0.951 |
| Age | −0.006 | 0.003 | 3.328 | 1 | 0.068 | 0.994 | 0.988 | 1.000 |
| MOI | 0.052 | 0.459 | 0.013 | 1 | 0.910 | 1.054 | 0.428 | 2.593 |
| ISS | 0.031 | 0.007 | 20.960 | 1 | <0.001 | 1.031 | 1.018 | 1.045 |
| RTS < 4 | −0.960 | 0.288 | 11.082 | 1 | <0.001 | 0.383 | 0.218 | 0.674 |
| GCS ≤ 8 | 1.027 | 0.143 | 51.640 | 1 | <0.001 | 2.794 | 2.111 | 3.697 |
| SI | −0.455 | 0.252 | 3.271 | 1 | 0.071 | 0.634 | 0.387 | 1.039 |
| ASA ≥ III | 0.335 | 0.182 | 3.404 | 1 | 0.065 | 1.398 | 0.979 | 1.997 |
| ICP | 2.180 | 0.193 | 127.288 | 1 | <0.001 | 8.846 | 6.058 | 12.919 |
| Craniotomy | 1.461 | 0.151 | 94.142 | 1 | <0.001 | 4.311 | 3.209 | 5.791 |
| Constant | −2.328 | 0.319 | 53.408 | 1 | <0.001 | 0.097 | ||
Table A6.
Multivariable logistic regression analysis of Hospital > 7 days in trauma patients presenting with severe TBI.
Table A6.
Multivariable logistic regression analysis of Hospital > 7 days in trauma patients presenting with severe TBI.
| Hospital > 7 Days | ||||||||
|---|---|---|---|---|---|---|---|---|
| B | S.E. | Wald | df | Sig. | Exp(B) | 95% C.I. for EXP(B) | ||
| Lower | Upper | |||||||
| Sex | −0.178 | 0.115 | 2.395 | 1 | 0.122 | 0.837 | 0.667 | 1.049 |
| Age | −0.005 | 0.003 | 4.002 | 1 | 0.045 | 0.995 | 0.989 | 1.000 |
| MOI | −0.307 | 0.400 | 0.590 | 1 | 0.442 | 0.736 | 0.336 | 1.610 |
| ISS | 0.011 | 0.006 | 3.363 | 1 | 0.067 | 1.011 | 0.999 | 1.022 |
| RTS < 4 | −0.719 | 0.248 | 8.372 | 1 | 0.004 | 0.487 | 0.299 | 0.793 |
| GCS ≤ 8 | 0.012 | 0.118 | 0.011 | 1 | 0.917 | 1.012 | 0.803 | 1.276 |
| SI | −0.594 | 0.218 | 7.445 | 1 | 0.006 | 0.552 | 0.360 | 0.846 |
| ASA ≥ III | 0.055 | 0.146 | 0.143 | 1 | 0.706 | 1.057 | 0.793 | 1.408 |
| ICP | 1.539 | 0.194 | 62.802 | 1 | <0.001 | 4.661 | 3.185 | 6.820 |
| Craniotomy | 0.978 | 0.140 | 48.802 | 1 | <0.001 | 2.659 | 2.021 | 3.499 |
| Constant | 0.093 | 0.258 | 0.129 | 1 | 0.720 | 1.097 | ||
Table A7.
Multivariable logistic regression analysis of MV admission in trauma patients presenting with severe TBI.
Table A7.
Multivariable logistic regression analysis of MV admission in trauma patients presenting with severe TBI.
| MV Admission | ||||||||
|---|---|---|---|---|---|---|---|---|
| B | S.E. | Wald | df | Sig. | Exp(B) | 95% C.I. for EXP(B) | ||
| Lower | Upper | |||||||
| Sex | −0.214 | 0.144 | 2.194 | 1 | 0.139 | 0.808 | 0.609 | 1.071 |
| Age | −0.014 | 0.003 | 17.592 | 1 | <0.001 | 0.986 | 0.979 | 0.992 |
| MOI | 1.241 | 0.517 | 5.751 | 1 | 0.016 | 3.459 | 1.254 | 9.538 |
| ISS | 0.038 | 0.008 | 24.373 | 1 | <0.001 | 1.039 | 1.023 | 1.055 |
| RTS < 4 | −0.195 | 0.288 | 0.460 | 1 | 0.498 | 0.823 | 0.468 | 1.447 |
| GCS ≤ 8 | 2.207 | 0.146 | 227.996 | 1 | <0.001 | 9.086 | 6.823 | 12.100 |
| SI | −0.338 | 0.263 | 1.649 | 1 | 0.199 | 0.713 | 0.426 | 1.194 |
| ASA ≥ III | 0.451 | 0.179 | 6.303 | 1 | 0.012 | 1.569 | 1.104 | 2.231 |
| ICP | 2.737 | 0.354 | 59.744 | 1 | <0.001 | 15.434 | 7.711 | 30.891 |
| Craniotomy | 2.034 | 0.187 | 117.747 | 1 | <0.001 | 7.644 | 5.294 | 11.037 |
| Constant | −1.520 | 0.321 | 22.375 | 1 | <0.001 | 0.219 | ||
Table A8.
Multivariable logistic regression analysis of MV > 7 days in trauma patients presenting with severe TBI.
Table A8.
Multivariable logistic regression analysis of MV > 7 days in trauma patients presenting with severe TBI.
| MV >7 Days | ||||||||
|---|---|---|---|---|---|---|---|---|
| B | S.E. | Wald | df | Sig. | Exp(B) | 95% C.I. for EXP(B) | ||
| Lower | Upper | |||||||
| Sex | 0.033 | 0.153 | 0.047 | 1 | 0.828 | 1.034 | 0.765 | 1.396 |
| Age | −0.008 | 0.004 | 4.509 | 1 | 0.034 | 0.992 | 0.985 | 0.999 |
| MOI | −0.134 | 0.523 | 0.066 | 1 | 0.798 | 0.875 | 0.314 | 2.436 |
| ISS | 0.033 | 0.007 | 21.238 | 1 | <0.001 | 1.033 | 1.019 | 1.048 |
| RTS < 4 | −0.660 | 0.302 | 4.784 | 1 | 0.029 | 0.517 | 0.286 | 0.934 |
| GCS ≤ 8 | 1.195 | 0.165 | 52.379 | 1 | <0.001 | 3.303 | 2.390 | 4.565 |
| SI | −0.456 | 0.272 | 2.806 | 1 | 0.094 | 0.634 | 0.372 | 1.081 |
| ASA ≥ III | 0.245 | 0.206 | 1.413 | 1 | 0.235 | 1.278 | 0.853 | 1.914 |
| ICP | 2.074 | 0.191 | 117.374 | 1 | <0.001 | 7.957 | 5.467 | 11.579 |
| Craniotomy | 1.522 | 0.164 | 86.072 | 1 | <0.001 | 4.580 | 3.321 | 6.316 |
| Constant | −3.046 | 0.359 | 71.842 | 1 | <0.001 | 0.048 | ||
Appendix B
Table A9.
Patient characteristics in the study population of trauma patients with severe TBI stratified for age 16–44 years and ≥45 years.
Table A9.
Patient characteristics in the study population of trauma patients with severe TBI stratified for age 16–44 years and ≥45 years.
| 16–44 Years | ≥45 Years | |||||
|---|---|---|---|---|---|---|
| Female (n = 108) | Male (n = 372) | p-Value | Female (n = 412) | Male (n = 674) | p-Value | |
| Age | ||||||
| Age (years) median (IQR) | 25 (16–44) | 28 (16–44) | 0.001 | 70 (45–98) | 68 (45–95) | 0.008 |
| Injury and severity | ||||||
| Blunt | 103 (95.4%) | 361 (97.3%) | 0.345 | 408 (99.8%) | 654 (97.8%) | 0.008 |
| Penetrating | 5 (4.6%) | 10 (2.7%) | 0.345 | 1 (0.2%) | 15 (2.2%) | 0.008 |
| AIS Neck ≥ 3 | 1 (0.9%) | 9 (2.4%) | 0.339 | 2 (0.5%) | 5 (0.7%) | 0.716 |
| AIS Spine ≥ 3 | 11 (10.2%) | 28 (7.5%) | 0.373 | 10 (2.4%) | 41 (6.1%) | 0.006 |
| AIS Thorax ≥ 3 | 31 (28.7%) | 116 (31.2%) | 0.623 | 59 (14.3%) | 161 (23.9%) | <0.001 |
| AIS Abdomen ≥ 3 | 11 (10.2%) | 23 (6.2%) | 0.153 | 2 (0.5%) | 6 (0.9%) | 0.717 |
| AIS Lower extremities ≥ 3 | 17 (15.7%) | 40 (10.8%) | 0.158 | 18 (4.4%) | 35 (5.2%) | 0.541 |
| ISS median (IQR) | 26 (16–75) | 29 (16–75) | 0.395 | 25 (16–59) | 25 (16–75) | 0.006 |
| Vital signs | ||||||
| RTS median (IQR) | 4.09 (0–7.84) | 5.03 (0–7.84) | 0.650 | 6.76 (0–7.84) | 5.97 (1.76–7.84) | 0.007 |
| RTS < 4 | 9 (8.3%) | 45 (12.1%) | 0.276 | 18 (4.4%) | 46 (6.8%) | 0.095 |
| SBP median (IQR) | 122 (54–184) | 130 (50–240) | 0.002 | 145 (45–245) | 141 (50–240) | 0.113 |
| SBP < 90 mmHg | 10 (9.3%) | 32 (8.6%) | 0.832 | 15 (3.6%) | 56 (8.3%) | 0.003 |
| SI median (IQR) | 0.7 (0.4–2.2) | 0.7 (0.2–2.7) | 0.038 | 0.6 (0.2–2.3) | 0.6 (0.2–2.4) | 0.008 |
| Neurological | ||||||
| GCS median (IQR) | 3 (3–15) | 3 (3–15) | 0.610 | 9 (3–15) | 7 (3–15) | 0.010 |
| GCS ≤ 8 | 70 (64.8%) | 220 (59.1%) | 0.288 | 194 (47.1%) | 345 (51.2%) | 0.190 |
| Craniotomy | 20 (18.5%) | 76 (20.4%) | 0.662 | 91 (22.1%) | 113 (16.8%) | 0.029 |
| ICP measurement | 18 (16.7%) | 60 (16.1%) | 0.894 | 30 (7.3%) | 71 (10.5%) | 0.073 |
| Comorbidity | ||||||
| Healthy or mild (ASA ≤ II) | 93 (97.9%) | 294 (95.1%) | 0.381 | 276 (74.2%) | 414 (70.2%) | 0.177 |
| Severe comorbidity (ASA ≥ III) | 2 (2.1%) | 15 (4.9%) | 0.381 | 96 (25.8%) | 176 (29.8%) | 0.177 |
| Prehospital | ||||||
| Prehospital intubation | 60 (57.1%) | 198 (54.1%) | 0.581 | 151 (37.2%) | 311 (46.7%) | 0.002 |
| P-HEMS | 38 (35.2%) | 134 (36.0%) | 0.873 | 107 (26.0%) | 246 (36.5%) | <0.001 |
AIS, Abbreviated Injury Scale; ASA, American Society of Anesthesiologists; GCS, Glasgow Coma Scale; ICP, Intracranial pressure; IQR, Interquartile range; ISS, Injury Severity Score; P-HEMS, Physician-staffed helicopter emergency medical services; RTS, Revised Trauma Score; SBP, Systolic blood pressure; SI, Shock index.
Table A10.
Patient characteristics in the study population of trauma patients with isolated severe TBI.
Table A10.
Patient characteristics in the study population of trauma patients with isolated severe TBI.
| Total (n = 831) | Female (n = 297) | Male (n = 534) | p-Value | |
|---|---|---|---|---|
| Age | ||||
| Age (years) median (IQR) | 62 (16–98) | 68 (16–98) | 58 (16–95) | <0.001 |
| Age 16–44 years | 212 (25.5%) | 40 (13.5%) | 172 (32.2%) | <0.001 |
| Age ≥ 45 years | 619 (74.5%) | 257 (86.5%) | 362 (67.8%) | <0.001 |
| Injury and severity | ||||
| Blunt | 808 (98.1%) | 294 (99.7%) | 514 (97.2%) | 0.013 |
| Penetrating | 16 (1.9%) | 1 (0.3%) | 15 (2.8%) | 0.013 |
| ISS median (IQR) | 25 (16–75) | 25 (16–75) | 25 (16–75) | 0.807 |
| Vital signs | ||||
| RTS median (IQR) | 6.90 (0–7.84) | 6.07 (0–7.84) | 6.90 (1.76–7.84) | 0.986 |
| RTS < 4 | 34 (4.1%) | 11 (3.7%) | 23 (4.3%) | 0.674 |
| SBP median (IQR) | 141 (45–245) | 140 (45–245) | 142 (50–240) | 0.731 |
| SBP < 90 mmHg | 31 (3.7%) | 8 (2.7%) | 23 (4.3%) | 0.239 |
| SI median (IQR) | 0.6 (0.2–2.4) | 0.6 (0.2–1.6) | 0.6 (0.2–2.4) | 0.386 |
| Neurological | ||||
| GCS median (IQR) | 9 (3–15) | 8 (3–15) | 9 (3–15) | 0.883 |
| GCS ≤ 8 | 370 (44.5%) | 139 (46.8%) | 231 (43.3%) | 0.325 |
| Craniotomy | 154 (18.5%) | 58 (19.5%) | 96 (18.0%) | 0.581 |
| ICP measurement | 74 (8.9%) | 22 (7.4%) | 52 (9.7%) | 0.258 |
| Comorbidity | ||||
| Healthy or mild (ASA ≤ II) | 526 (71.1%) | 191 (71.0%) | 335 (71.1%) | 0.972 |
| Severe comorbidity (ASA ≥ III) | 214 (28.9%) | 78 (29.0%) | 136 (28.9%) | 0.972 |
| Prehospital | ||||
| Prehospital intubation | 314 (37.9%) | 106 (35.7%) | 208 (39.2%) | 0.322 |
| P-HEMS | 234 (28.2%) | 74 (24.9%) | 160 (30.0%) | 0.121 |
ASA, American Society of Anesthesiologists; GCS, Glasgow Coma Scale; ICP, Intracranial pressure; IQR, Interquartile range; ISS, Injury Severity Score; P-HEMS, Physician-staffed helicopter emergency medical services; RTS, Revised Trauma Score; SBP, Systolic blood pressure; SI, Shock index.
Table A11.
Clinical outcomes of trauma patients with isolated severe TBI stratified for sex.
Table A11.
Clinical outcomes of trauma patients with isolated severe TBI stratified for sex.
| Total (n = 831) | Female (n = 297) | Male (n = 534) | p-Value | |
|---|---|---|---|---|
| Primary outcomes | ||||
| In-hospital mortality | 234 (28.2%) | 94 (31.6%) | 140 (26.2%) | 0.095 |
| GOS ≤ 3 at discharge | 434 (54.3%) | 162 (56.8%) | 272 (52.9%) | 0.286 |
| ICU admission | 557 (67.0%) | 193 (65.0%) | 364 (68.2%) | 0.350 |
| Secondary outcomes | ||||
| 30-day mortality | 253 (30.4%) | 100 (33.7%) | 153 (28.7%) | 0.132 |
| ICU days median (IQR) | 2 (0–53) | 2 (0–39) | 2 (0–53) | 0.348 |
| ICU > 7 days | 201 (24.2%) | 65 (21.9%) | 136 (25.5%) | 0.248 |
| Hospital days median (IQR) | 5 (0–135) | 5 (0–98) | 6 (0–135) | 0.074 |
| Hospital > 7 days | 376 (45.2%) | 126 (42.4%) | 250 (46.8%) | 0.223 |
| MV admission | 424 (51.0%) | 145 (48.8%) | 279 (52.2%) | 0.344 |
| MV days median (IQR) | 1 (0–42) | 1 (0–33) | 1 (0–42) | 0.232 |
| MV > 7 days | 156 (18.8%) | 57 (19.2%) | 99 (18.5%) | 0.817 |
GOS, Glasgow Outcome Score; ICU, Intensive Care Unit; IQR, Interquartile range; MV, Mechanical ventilation.
Table A12.
The association of female sex with clinical outcome parameters in trauma patients presenting with isolated severe TBI.
Table A12.
The association of female sex with clinical outcome parameters in trauma patients presenting with isolated severe TBI.
| OR | 95% CI | p-Value | |
|---|---|---|---|
| Unadjusted values | |||
| In-hospital mortality | 1.303 | 0.954–1.779 | 0.096 |
| GOS ≤ 3 at discharge | 0.853 | 0.640–1.136 | 0.277 |
| ICU admission | 0.867 | 0.642–1.170 | 0.350 |
| 30-day mortality | 1.264 | 0.932–1.715 | 0.132 |
| ICU > 7 days | 0.820 | 0.585–1.148 | 0.248 |
| Hospital > 7 days | 0.837 | 0.629–1.114 | 0.223 |
| MV admission | 0.872 | 0.656–1.158 | 0.344 |
| MV > 7 days | 1.044 | 0.727–1.499 | 0.817 |
| Adjusted values * | |||
| In-hospital mortality | 1.056 | 0.719–1.550 | 0.781 |
| GOS ≤ 3 at discharge | 1.146 | 0.794–1.654 | 0.468 |
| ICU admission | 0.909 | 0.629–1.312 | 0.609 |
| 30-day mortality | 0.991 | 0.674–1.457 | 0.963 |
| ICU > 7 days | 0.786 | 0.522–1.183 | 0.248 |
| Hospital > 7 days | 0.847 | 0.621–1.155 | 0.293 |
| MV admission | 0.744 | 0.481–1.150 | 0.183 |
| MV > 7 days | 1.120 | 0.714–1.756 | 0.622 |
* corrected for the a priori-determined covariates age, MOI, ISS, RTS < 4, GCS ≤ 8, SI, ASA ≥ III, ICP, and craniotomy. ASA, American Society of Anesthesiologists; GCS, Glasgow Coma Scale; GOS, Glasgow Outcome Score; ICP, Intracranial pressure; ICU, Intensive Care Unit; ISS, Injury Severity Score; MOI, Mechanism of Injury; MV, Mechanical ventilation; RTS, Revised Trauma Score; SI, Shock index.
Table A13.
Patient characteristics in the study population of trauma patients with isolated severe TBI stratified for age 16–44 years and ≥45 years.
Table A13.
Patient characteristics in the study population of trauma patients with isolated severe TBI stratified for age 16–44 years and ≥45 years.
| 16–44 Years | ≥45 Years | |||||
|---|---|---|---|---|---|---|
| Female (n = 40) | Male (n = 172) | p-Value | Female (n = 257) | Male (n = 362) | p-Value | |
| Age | ||||||
| Age (years) median (IQR) | 25 (16–44) | 30 (16–44) | 0.014 | 71 (45–98) | 68 (45–95) | 0.024 |
| Injury and severity | ||||||
| Blunt | 39 (97.5%) | 169 (98.3%) | 0.570 | 255 (99.2%) | 345 (96.6%) | 0.003 |
| Penetrating | 1 (2.5%) | 3 (1.7%) | 0.570 | 2 (0.8%) | 12 (3.3%) | 0.003 |
| ISS median (IQR) | 23 (16–75) | 24 (16–75) | 0.202 | 25 (16–33) | 25 (16–75) | 0.826 |
| Vital signs | ||||||
| RTS median (IQR) | 5.97 (4.09–7.84) | 6.90 (2.63–7.84) | 0.612 | 6.75 (0–7.84) | 6.90 (1.76–7.84) | 0.765 |
| RTS < 4 | 0 (0%) | 8 (4.7%) | 0.357 | 11 (4.3%) | 15 (4.1%) | 0.934 |
| SBP median (IQR) | 125 (99–170) | 134 (55–240) | 0.005 | 144 (45–245) | 147 (50–224) | 0.660 |
| SBP < 90 mmHg | 0 (0%) | 6 (3.5%) | 0.597 | 8 (3.1%) | 17 (4.7%) | 0.324 |
| SI median (IQR) | 0.6 (0.4–1.1) | 0.6 (0.2–1.9) | 0.134 | 0.5 (0.2–1.6) | 0.6 (0.2–2.4) | 0.284 |
| Neurological | ||||||
| GCS median (IQR) | 7 (3–15) | 9 (3–15) | 0.569 | 9 (3–15) | 9 (3–15) | 0.998 |
| GCS ≤ 8 | 20 (50.0%) | 76 (44.2%) | 0.506 | 119 (46.3%) | 155 (42.8%) | 0.390 |
| Craniotomy | 5 (12.5%) | 34 (19.8%) | 0.285 | 53 (20.6%) | 62 (17.1%) | 0.271 |
| ICP measurement | 6 (15.0%) | 20 (11.6%) | 0.558 | 16 (6.2%) | 32 (8.8%) | 0.231 |
| Comorbidity | ||||||
| Healthy or mild (ASA ≤ II) | 31 (93.9%) | 140 (93.3%) | 0.087 | 160 (67.8%) | 195 (60.7%) | 1.000 |
| Severe comorbidity (ASA ≥ III) | 2 (6.1%) | 10 (6.7%) | 0.087 | 76 (32.2%) | 126 (39.3%) | 1.000 |
| Prehospital | ||||||
| Prehospital intubation | 15 (37.5%) | 67 (39.2%) | 0.322 | 91 (35.4%) | 141 (39.2%) | 0.342 |
| P-HEMS | 11 (27.5%) | 51 (29.7%) | 0.788 | 63 (24.5%) | 109 (30.1%) | 0.126 |
ASA, American Society of Anesthesiologists; GCS, Glasgow Coma Scale; ICP, Intracranial pressure; IQR, Interquartile range; ISS, Injury Severity Score; P-HEMS, Physician-staffed helicopter emergency medical services; RTS, Revised Trauma Score; SBP, Systolic blood pressure; SI, Shock index.
Table A14.
Clinical outcomes of trauma patients with isolated severe TBI stratified for age 16–44 years and ≥45 years.
Table A14.
Clinical outcomes of trauma patients with isolated severe TBI stratified for age 16–44 years and ≥45 years.
| 16–44 Years | ≥45 Years | |||||
|---|---|---|---|---|---|---|
| Female (n = 40) | Male (n = 172) | p-Value | Female (n = 257) | Male (n = 362) | p-Value | |
| Primary outcomes | ||||||
| In-hospital mortality | 5 (12.5%) | 23 (13.4%) | 0.883 | 89 (34.6%) | 117 (32.3%) | 0.548 |
| GOS ≤ 3 at discharge | 15 (37.5%) | 62 (36.0%) | 0.877 | 147 (57.2%) | 210 (58.0%) | 0.852 |
| ICU admission | 27 (67.5%) | 119 (69.2%) | 0.836 | 166 (64.6%) | 245 (67.7%) | 0.423 |
| Secondary outcomes | ||||||
| 30-day mortality | 5 (12.5%) | 23 (13.4%) | 0.883 | 95 (37.0%) | 130 (35.9%) | 0.788 |
| ICU days median (IQR) | 2 (0–39) | 3 (0–47) | 0.642 | 2 (0–34) | 2 (0–53) | 0.523 |
| ICU > 7 days | 8 (29.6%) | 47 (39.5%) | 0.341 | 57 (34.3%) | 89 (36.3%) | 0.487 |
| Hospital days median (IQR) | 6 (0–98) | 6 (0–93) | 0.931 | 5 (0–74) | 6 (0–135) | 0.090 |
| Hospital > 7 days | 18 (45.0%) | 78 (45.3%) | 0.968 | 108 (42.0%) | 172 (47.5%) | 0.176 |
| MV admission | 19 (47.5%) | 93 (54.1%) | 0.453 | 126 (49.0%) | 186 (51.4%) | 0.564 |
| MV days median (IQR) | 1 (0–28) | 1 (0–42) | 0.358 | 1 (0–33) | 1 (0–33) | 0.499 |
| MV > 7 days | 8 (42.1%) | 34 (36.6%) | 0.973 | 49 (38.9%) | 65 (34.9%) | 0.725 |
GOS, Glasgow Outcome Score; ICU, Intensive Care Unit; IQR, Interquartile range; MV, Mechanical ventilation.
Table A15.
The association of female sex with clinical outcome parameters in trauma patients presenting with isolated severe TBI stratified for age 16–44 years and ≥45 years.
Table A15.
The association of female sex with clinical outcome parameters in trauma patients presenting with isolated severe TBI stratified for age 16–44 years and ≥45 years.
| 16–44 Years | ≥45 Years | |||||
|---|---|---|---|---|---|---|
| OR | 95% CI | p-value | OR | 95% CI | p-value | |
| Unadjusted values | ||||||
| In-hospital mortality | 0.925 | 0.329–2.605 | 0.883 | 1.109 | 0.791–1.556 | 0.548 |
| GOS ≤ 3 at discharge | 0.945 | 0.461–1.936 | 0.877 | 1.032 | 0.740–1.441 | 0.852 |
| ICU admission | 0.925 | 0.443–1.932 | 0.836 | 0.871 | 0.622–1.221 | 0.423 |
| 30-day mortality | 0.925 | 0.329–2.605 | 0.883 | 1.047 | 0.751–1.459 | 0.788 |
| ICU > 7 days | 0.665 | 0.286–1.547 | 0.343 | 0.874 | 0.598–1.277 | 0.487 |
| Hospital > 7 days | 0.986 | 0.494–1.969 | 0.968 | 0.801 | 0.580–1.105 | 0.177 |
| MV admission | 0.769 | 0.386–1.531 | 0.454 | 0.910 | 0.661–1.253 | 0.564 |
| MV > 7 days | 1.015 | 0.429–2.400 | 0.973 | 1.076 | 0.714–1.624 | 0.725 |
| Adjusted values * | ||||||
| In-hospital mortality | 1.083 | 0.273–4.302 | 0.910 | 1.067 | 0.712–1.600 | 0.753 |
| GOS ≤ 3 at discharge | 0.992 | 0.375–2.625 | 0.987 | 1.241 | 0.814–1.894 | 0.316 |
| ICU admission | 0.725 | 0.280–1.875 | 0.507 | 0.886 | 0.585–1.343 | 0.569 |
| 30-day mortality | 1.083 | 0.273–4.302 | 0.910 | 0.992 | 0.660–1.489 | 0.968 |
| ICU > 7 days | 0.378 | 0.110–1.301 | 0.123 | 0.819 | 0.520–1.289 | 0.387 |
| Hospital > 7 days | 0.907 | 0.397–2.073 | 0.818 | 0.811 | 0.575–1.142 | 0.230 |
| MV admission | 0.356 | 0.103–1.226 | 0.102 | 0.792 | 0.493–1.272 | 0.792 |
| MV > 7 days | 1.007 | 0.321–3.158 | 0.991 | 1.087 | 0.651–1.815 | 0.750 |
* corrected for the a priori-determined covariates age, MOI, ISS, RTS < 4, GCS ≤ 8, SI, ASA ≥ III, ICP, and craniotomy. ASA, American Society of Anesthesiologists; GCS, Glasgow Coma Scale; GOS, Glasgow Outcome Score; ICP, Intracranial pressure; ICU, Intensive Care Unit; ISS, Injury Severity Score; MOI, Mechanism of Injury; MV, Mechanical ventilation; RTS, Revised Trauma Score; SI, Shock index.
References
- Coronado, V.G.; Xu, L.; Basavaraju, S.V.; McGuire, L.C.; Wald, M.M.; Faul, M.; Hemphill, J.D. Surveillance for traumatic brain injury-related deaths—United States, 1997–2007. MMWR Surveill Summ. 2011, 60, 1–32. [Google Scholar]
- Maas, A.I.; Stocchetti, N.; Bullock, R. Moderate and severe traumatic brain injury in adults. Lancet Neurol. 2008, 7, 728–741. [Google Scholar] [PubMed]
- Majdan, M.; Plancikova, D.; Brazinova, A.; Rusnak, M.; Nieboer, D.; Feigin, V.; Maas, A. Epidemiology of traumatic brain injuries in Europe: A cross-sectional analysis. Lancet Public Health. 2016, 1, e76–e83. [Google Scholar] [PubMed]
- Majdan, M.; Plancikova, D.; Maas, A.; Polinder, S.; Feigin, V.; Theadom, A.; Rusnak, M.; Brazinova, A.; Haagsma, J. Years of life lost due to traumatic brain injury in Europe: A cross-sectional analysis of 16 countries. PLoS Med. 2017, 14, e1002331. [Google Scholar] [CrossRef] [PubMed]
- Berry, C.; Ley, E.J.; Tillou, A.; Cryer, G.; Margulies, D.R.; Salim, A. The effect of gender on patients with moderate to severe head injuries. J. Trauma 2009, 67, 950–953. [Google Scholar] [CrossRef]
- Davis, D.P.; Douglas, D.J.; Smith, W.; Sise, M.J.; Vilke, G.M.; Holbrook, T.L.; Kennedy, F.; Eastman, A.B.; Velky, T.; Hoyt, D.B. Traumatic brain injury outcomes in pre- and post- menopausal females versus age-matched males. J. Neurotrauma 2006, 23, 140–148. [Google Scholar]
- De Guise, E.; LeBlanc, J.; Dagher, J.; Tinawi, S.; Lamoureux, J.; Marcoux, J.; Maleki, M.; Feyz, M. Outcome in Women with Traumatic Brain Injury Admitted to a Level 1 Trauma Center. Int. Sch. Res. Not. 2014, 2014, 263241. [Google Scholar] [CrossRef]
- Czosnyka, M.; Radolovich, D.; Balestreri, M.; Lavinio, A.; Hutchinson, P.; Timofeev, I.; Smielewski, P.; Pickard, J.D. Gender-related differences in intracranial hypertension and outcome after traumatic brain injury. Acta Neurochir. Suppl. 2008, 102, 25–28. [Google Scholar]
- Ottochian, M.; Salim, A.; Berry, C.; Chan, L.S.; Wilson, M.T.; Margulies, D.R. Severe traumatic brain injury: Is there a gender difference in mortality? Am. J. Surg. 2009, 197, 155–158. [Google Scholar] [CrossRef]
- Leitgeb, J.; Mauritz, W.; Brazinova, A.; Janciak, I.; Majdan, M.; Wilbacher, I.; Rusnak, M. Effects of gender on outcomes after traumatic brain injury. J. Trauma 2011, 71, 1620–1626. [Google Scholar] [CrossRef]
- Mikolić, A.; van Klaveren, D.; Groeniger, J.O.; Wiegers, E.J.; Lingsma, H.F.; Zeldovich, M.; von Steinbüchel, N.; Maas, A.I.; Roeters van Lennep, J.E.; Polinder, S.; et al. Differences between Men and Women in Treatment and Outcome after Traumatic Brain Injury. J. Neurotrauma 2021, 38, 235–251. [Google Scholar] [CrossRef] [PubMed]
- Yeung, J.H.; Mikocka-Walus, A.A.; Cameron, P.A.; Poon, W.S.; Ho, H.F.; Chang, A.; Graham, C.A.; Rainer, T.H. Protection from traumatic brain injury in hormonally active women vs men of a similar age: A retrospective international study. Arch. Surg. 2011, 146, 436–442. [Google Scholar] [CrossRef] [PubMed]
- Ponsford, J.L.; Myles, P.S.; Cooper, D.J.; Mcdermott, F.T.; Murray, L.J.; Laidlaw, J.; Cooper, G.; Tremayne, A.B.; Bernard, S.A. Gender differences in outcome in patients with hypotension and severe traumatic brain injury. Injury 2008, 39, 67–76. [Google Scholar] [CrossRef] [PubMed]
- Roof, R.L.; Duvdevani, R.; Heyburn, J.W.; Stein, D.G. Progesterone rapidly decreases brain edema: Treatment delayed up to 24 hours is still effective. Exp. Neurol. 1996, 138, 246–251. [Google Scholar] [CrossRef] [PubMed]
- Suzuki, T.; Bramlett, H.M.; Ruenes, G.; Dietrich, W.D. The effects of early post-traumatic hyperthermia in female and ovariectomized rats. J. Neurotrauma 2004, 21, 842–853. [Google Scholar] [CrossRef]
- Kim, H.; Cam-Etoz, B.; Zhai, G.; Hubbard, W.J.; Zinn, K.R.; Chaudry, I.H. Salutary Effects of Estrogen Sulfate for Traumatic Brain Injury. J. Neurotrauma 2015, 32, 1210–1216. [Google Scholar] [CrossRef]
- Kim, H.; Yu, T.; Cam-Etoz, B.; van Groen, T.; Hubbard, W.J.; Chaudry, I.H. Treatment of traumatic brain injury with 17alpha-ethinylestradiol-3-sulfate in a rat model. J. Neurosurg. 2017, 127, 23–31. [Google Scholar] [CrossRef]
- Roof, R.L.; Hall, E.D. Estrogen-related gender difference in survival rate and cortical blood flow after impact-acceleration head injury in rats. J. Neurotrauma 2000, 17, 1155–1169. [Google Scholar] [CrossRef]
- Cuzzocrea, S.; Genovese, T.; Mazzon, E.; Esposito, E.; Di Paola, R.; Muià, C.; Crisafulli, C.; Peli, A.; Bramanti, P.; Chaudry, I.H. Effect of 17beta-estradiol on signal transduction pathways and secondary damage in experimental spinal cord trauma. Shock 2008, 29, 362–371. [Google Scholar] [CrossRef]
- Association for the Advancement of Automotive Medicine. The Abbreviated Injury Scale 2015 Revision; AAAM: Des Plaines, IL, USA, 2015. [Google Scholar]
- Nelson, H.D. Menopause. Lancet 2008, 371, 760–770. [Google Scholar] [CrossRef]
- Jennett, B.; Bond, M. Assessment of outcome after severe brain damage. Lancet 1975, 1, 480–484. [Google Scholar] [CrossRef]
- Mostafa, G.; Huynh, T.; Sing, R.F.; Miles, W.S.; Norton, H.J.; Thomason, M.H. Gender-related outcomes in trauma. J. Trauma 2002, 53, 430–434, discussion 4–5. [Google Scholar] [CrossRef] [PubMed]
- Frink, M.; Pape, H.C.; van Griensven, M.; Krettek, C.; Chaudry, I.H.; Hildebrand, F. Influence of sex and age on mods and cytokines after multiple injuries. Shock 2007, 27, 151–156. [Google Scholar] [CrossRef] [PubMed]
- Pape, M.; Giannakópoulos, G.F.; Zuidema, W.P.; de Lange-Klerk, E.S.; Toor, E.J.; Edwards, M.J.; Verhofstad, M.H.; Tromp, T.N.; van Lieshout, E.M.; Bloemers, F.W.; et al. Is there an association between female gender and outcome in severe trauma? A multi-center analysis in the Netherlands. Scand. J. Trauma Resusc. Emerg. Med. 2019, 27, 16. [Google Scholar] [CrossRef]
- Farace, E.; Alves, W.M. Do women fare worse: A metaanalysis of gender differences in traumatic brain injury outcome. J. Neurosurg. 2000, 93, 539–545. [Google Scholar] [CrossRef]
- Dossett, L.A.; Swenson, B.R.; Heffernan, D.; Bonatti, H.; Metzger, R.; Sawyer, R.G.; May, A.K. High levels of endogenous estrogens are associated with death in the critically injured adult. J. Trauma 2008, 64, 580–585. [Google Scholar] [CrossRef] [PubMed]

Disclaimer/Publisher’s Note: The statements, opinions and data contained in all publications are solely those of the individual author(s) and contributor(s) and not of MDPI and/or the editor(s). MDPI and/or the editor(s) disclaim responsibility for any injury to people or property resulting from any ideas, methods, instructions or products referred to in the content. |
© 2023 by the authors. Licensee MDPI, Basel, Switzerland. This article is an open access article distributed under the terms and conditions of the Creative Commons Attribution (CC BY) license (https://creativecommons.org/licenses/by/4.0/).