
Sex Differences in Delayed Hospitalization in Patients with Non-ST-Segment Elevation Myocardial Infarction Undergoing New-Generation Drug-Eluting Stent Implantation

 , ,
, ,
Abstract
:1. Introduction
2. Methods
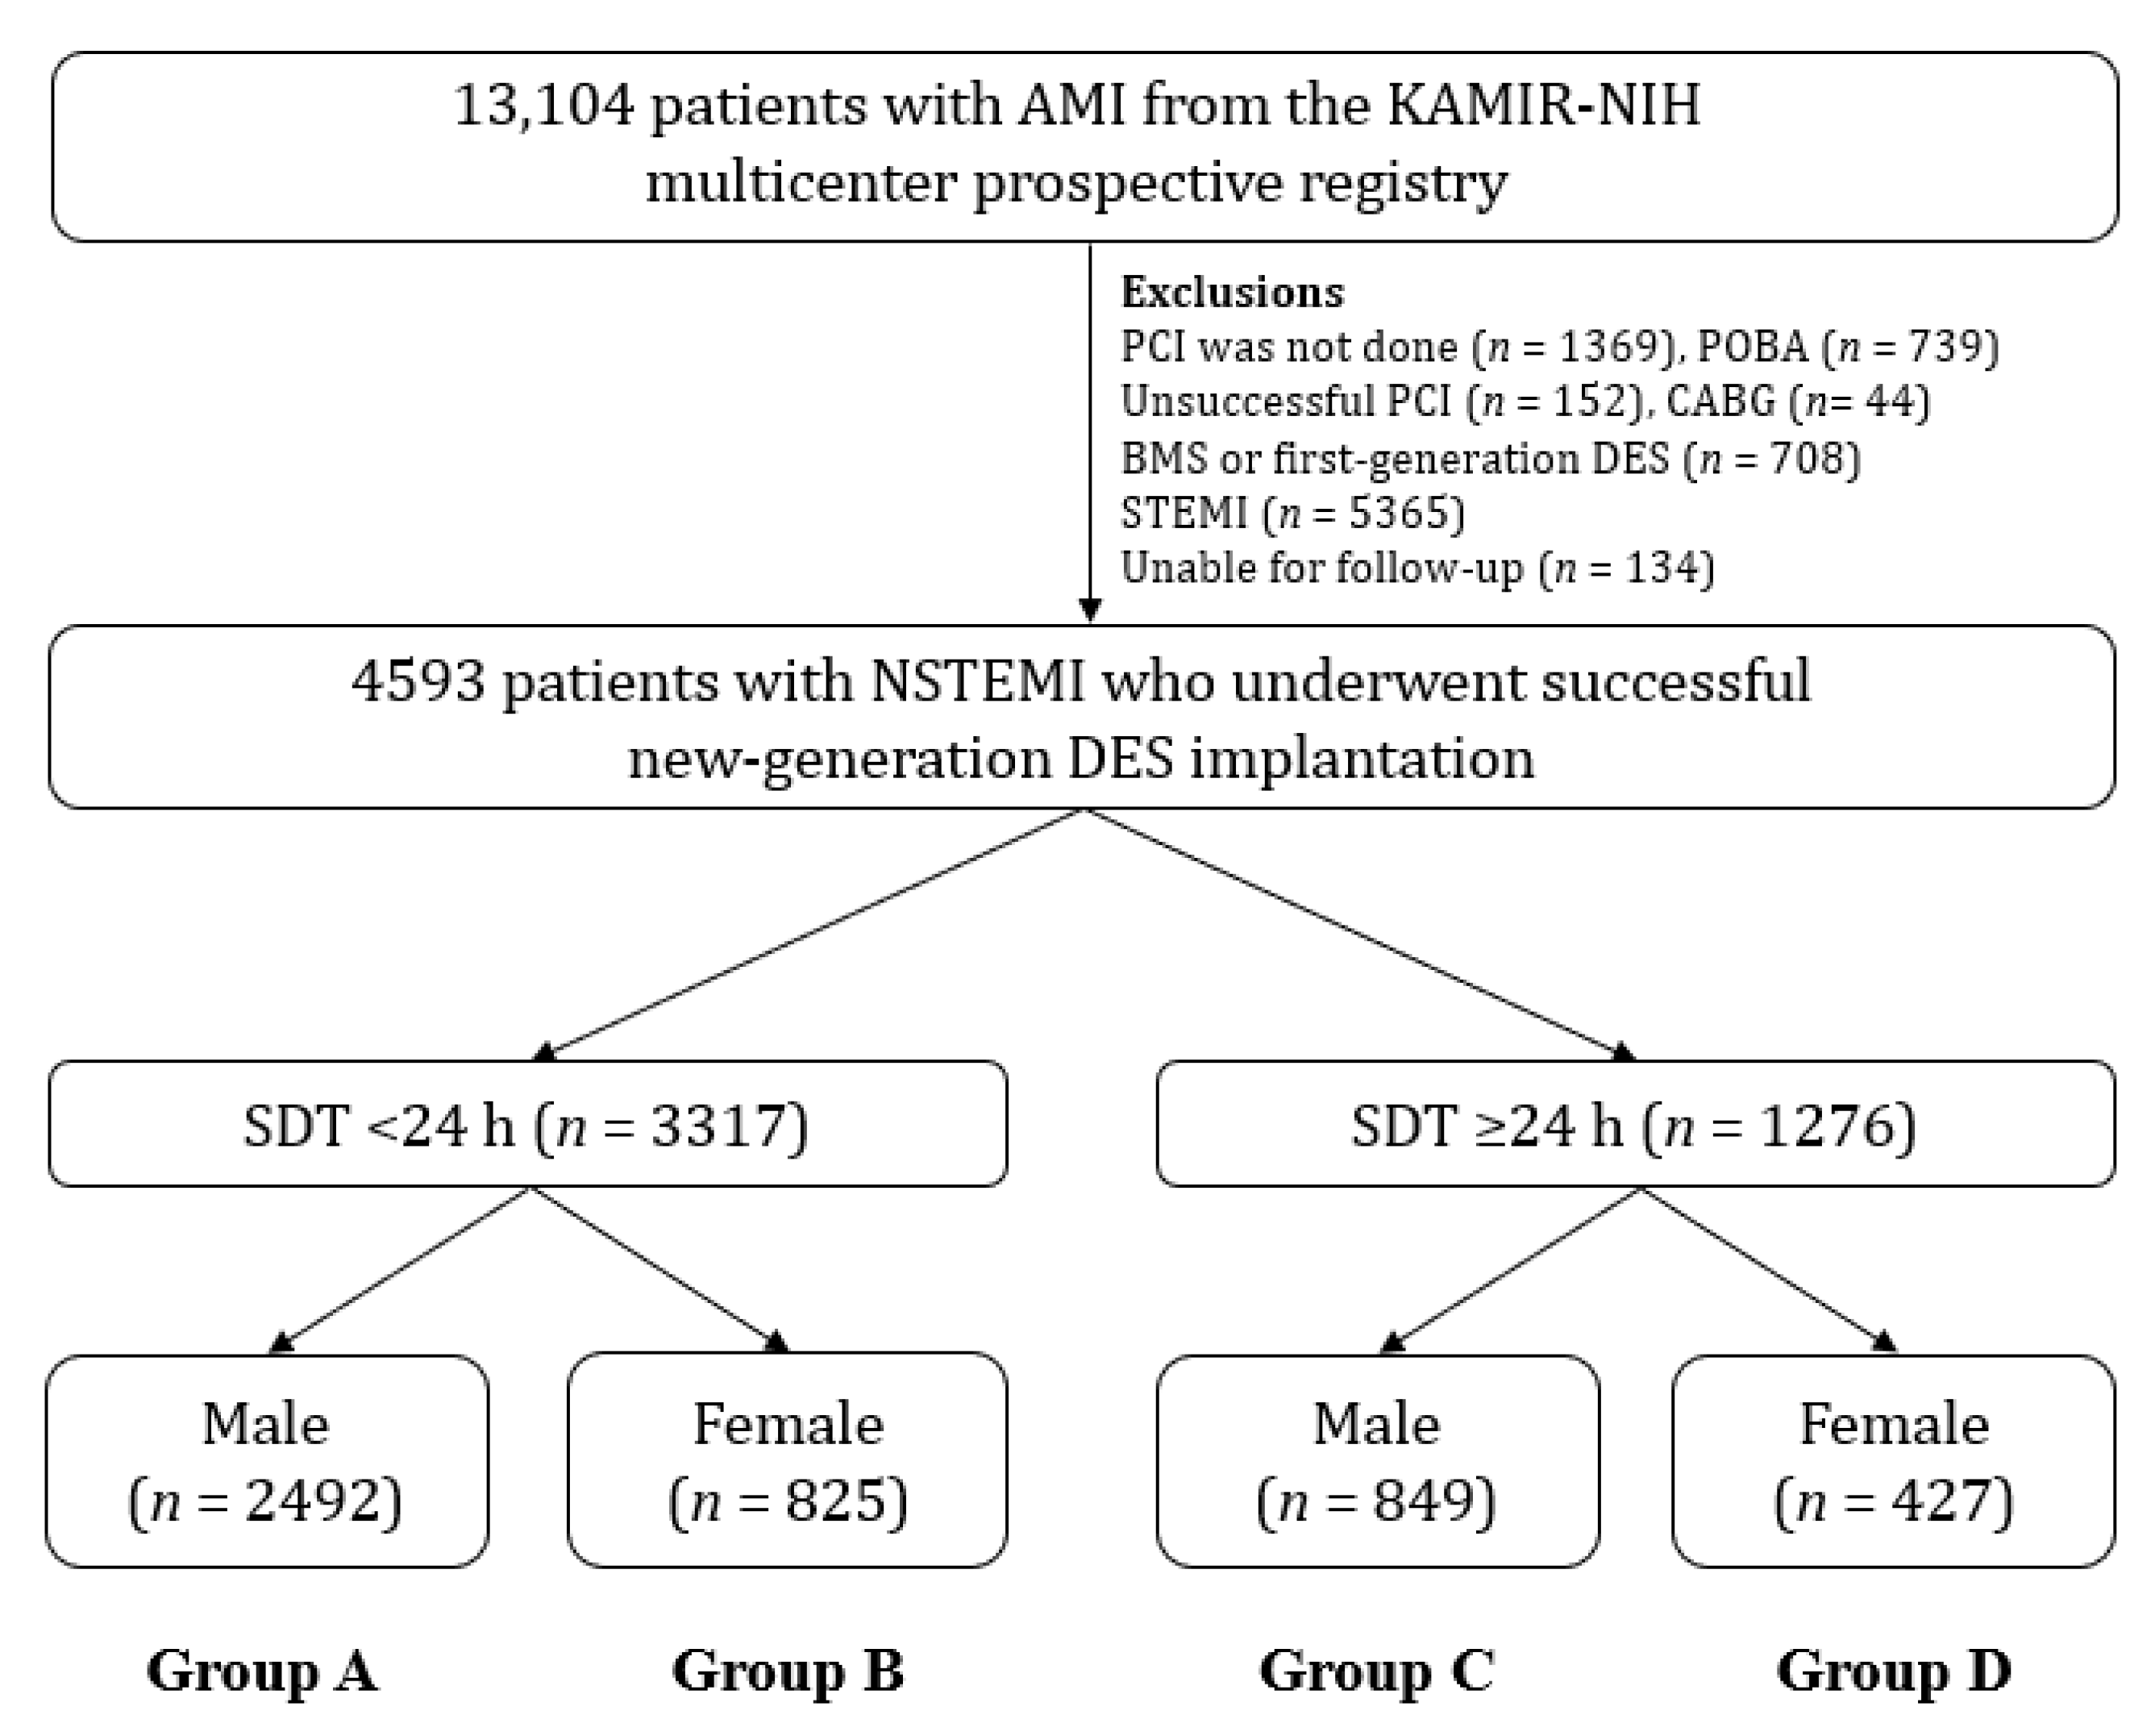
2.1. Study Population
2.2. Percutaneous Coronary Intervention and Medical Treatment
2.3. Study Definitions and Clinical Outcomes
2.4. Statistical Analyses
3. Results
3.1. Baseline Characteristics
3.2. Clinical Outcomes
4. Discussion
5. Conclusions
Supplementary Materials
Author Contributions
Funding
Institutional Review Board Statement
Informed Consent Statement
Data Availability Statement
Acknowledgments
Conflicts of Interest
References
- Libby, P. Mechanisms of acute coronary syndromes and their implications for therapy. N. Engl. J. Med. 2013, 368, 2004–2013. [Google Scholar] [CrossRef] [PubMed] [Green Version]
- Casscells, W.; Naghavi, M.; Willerson, J.T. Vulnerable atherosclerotic plaque: A multifocal disease. Circulation 2003, 107, 2072–2075. [Google Scholar] [CrossRef]
- Di Vito, L.; Niccoli, G.; Porto, I.; Vergallo, R.; Gatto, L.; Prati, F.; Crea, F. Recurrent acute coronary syndrome and mechanisms of plaque instability. Int. J. Cardiol. 2017, 243, 98–102. [Google Scholar] [CrossRef]
- Amsterdam, E.A.; Wenger, N.K.; Brindis, R.G.; Casey, D.E., Jr.; Ganiats, T.G.; Holmes, D.R., Jr.; Jaffe, A.S.; Jneid, H.; Kelly, R.F.; Kontos, M.C.; et al. 2014 AHA/ACC Guideline for the Management of Patients with Non-ST-Elevation Acute Coronary Syndromes: A report of the American College of Cardiology/American Heart Association Task Force on Practice Guidelines. J. Am. Coll. Cardiol. 2014, 64, e139–e228. [Google Scholar] [CrossRef] [PubMed] [Green Version]
- Montarello, N.; Chan, W.P.A. Coronary artery disease in women. Aust. Prescr. 2022, 45, 193–199. [Google Scholar] [CrossRef] [PubMed]
- Koek, H.L.; de Bruin, A.; Gast, F.; Gevers, E.; Kardaun, J.W.; Reitsma, J.B.; Grobbee, D.E.; Bots, M.L. Short- and long-term prognosis after acute myocardial infarction in men versus women. Am. J. Cardiol. 2006, 98, 993–999. [Google Scholar] [CrossRef]
- Matetic, A.; Shamkhani, W.; Rashid, M.; Volgman, A.S.; Van Spall, H.G.C.; Coutinho, T.; Mehta, L.S.; Sharma, G.; Parwani, P.; Mohamed, M.O.; et al. Trends of Sex Differences in Clinical Outcomes After Myocardial Infarction in the United States. CJC Open 2021, 3 (Suppl. S12), S19–S27. [Google Scholar] [CrossRef]
- Berger, J.S.; Elliott, L.; Gallup, D.; Roe, M.; Granger, C.B.; Armstrong, P.W.; Simes, R.J.; White, H.D.; Van de Werf, F.; Topol, E.J.; et al. Sex differences in mortality following acute coronary syndromes. JAMA 2009, 302, 874–882. [Google Scholar] [CrossRef] [Green Version]
- Leifheit-Limson, E.C.; D’Onofrio, G.; Daneshvar, M.; Geda, M.; Bueno, H.; Spertus, J.A.; Krumholz, H.M.; Lichtman, J.H. Sex Differences in Cardiac Risk Factors, Perceived Risk, and Health Care Provider Discussion of Risk and Risk Modification Among Young Patients With Acute Myocardial Infarction: The VIRGO Study. J. Am. Coll. Cardiol. 2015, 66, 1949–1957. [Google Scholar] [CrossRef] [Green Version]
- Bell, D.M.; Nappi, J. Myocardial infarction in women: A critical appraisal of gender differences in outcomes. Pharmacotherapy 2000, 20, 1034–1044. [Google Scholar] [CrossRef]
- Mochari-Greenberger, H.; Miller, K.L.; Mosca, L. Racial/ethnic and age differences in women’s awareness of heart disease. J. Women Health 2012, 21, 476–480. [Google Scholar] [CrossRef] [Green Version]
- Dey, S.; Flather, M.D.; Devlin, G.; Brieger, D.; Gurfinkel, E.P.; Steg, P.G.; Fitzgerald, G.; Jackson, E.A.; Eagle, K.A. Sex-related differences in the presentation, treatment and outcomes among patients with acute coronary syndromes: The Global Registry of Acute Coronary Events. Heart 2009, 95, 20–26. [Google Scholar] [CrossRef]
- McKee, G.; Mooney, M.; O’Donnell, S.; O’Brien, F.; Biddle, M.J.; Moser, D.K. Multivariate analysis of predictors of pre-hospital delay in acute coronary syndrome. Int. J. Cardiol. 2013, 168, 2706–2713. [Google Scholar] [CrossRef] [PubMed]
- Ibanez, B.; James, S.; Agewall, S.; Antunes, M.J.; Bucciarelli-Ducci, C.; Bueno, H.; Caforio, A.L.P.; Crea, F.; Goudevenos, J.A.; Halvorsen, S.; et al. 2017 ESC Guidelines for the management of acute myocardial infarction in patients presenting with ST-segment elevation: The Task Force for the management of acute myocardial infarction in patients presenting with ST-segment elevation of the European Society of Cardiology (ESC). Eur. Heart J. 2018, 39, 119–177. [Google Scholar] [PubMed] [Green Version]
- Meisel, S.R.; Kleiner-Shochat, M.; Abu-Fanne, R.; Frimerman, A.; Danon, A.; Minha, S.; Levi, Y.; Blatt, A.; Mohsen, J.; Shotan, A.; et al. Direct Admission of Patients With ST-Segment-Elevation Myocardial Infarction to the Catheterization Laboratory Shortens Pain-to-Balloon and Door-to-Balloon Time Intervals but Only the Pain-to-Balloon Interval Impacts Short- and Long-Term Mortality. J. Am. Heart Assoc. 2021, 10, e018343. [Google Scholar] [CrossRef] [PubMed]
- Collet, J.P.; Thiele, H.; Barbato, E.; Barthélém, O.; Bauersachs, J.; Bhatt, D.L.; Dendale, P.; Dorobantu, M.; Edvardsen, T.; Folliguet, T.; et al. 2020 ESC Guidelines for the management of acute coronary syndromes in patients presenting without persistent ST-segment elevation. Eur. Heart J. 2021, 42, 1289–1367. [Google Scholar] [CrossRef]
- Eggers, K.M.; James, S.K.; Jernberg, T.; Lindahl, B. Timing of coronary angiography in patients with non-ST-elevation acute coronary syndrome: Long-term clinical outcomes from the nationwide SWEDEHEART registry. EuroIntervention 2022, 18, 582–589. [Google Scholar] [CrossRef]
- Kim, Y.H.; Her, A.Y.; Rha, S.W.; Choi, C.U.; Choi, B.G.; Kim, J.B.; Park, S.; Kang, D.O.; Park, J.Y.; Park, S.H.; et al. Comparison of 3-Year Outcomes between Early and Delayed Invasive Strategies in Older and Younger Adults with Non-ST-Segment Elevation Myocardial Infarction Undergoing New-Generation Drug-Eluting Stent Implantation. J. Clin. Med. 2022, 11, 4780. [Google Scholar] [CrossRef]
- Fox, K.A.; Clayton, T.C.; Damman, P.; Pocock, S.J.; de Winter, R.J.; Tijssen, J.G.; Lagerqvist, B.; Wallentin, L. Long-term outcome of a routine versus selective invasive strategy in patients with non-ST-segment elevation acute coronary syndrome a meta-analysis of individual patient data. J. Am. Coll. Cardiol. 2010, 55, 2435–2445. [Google Scholar] [CrossRef] [Green Version]
- Cha, J.J.; Bae, S.; Park, D.W.; Park, J.H.; Hong, S.J.; Park, S.M.; Yu, C.W.; Rha, S.W.; Lim, D.S.; Suh, S.Y.; et al. Clinical Outcomes in Patients With Delayed Hospitalization for Non-ST-Segment Elevation Myocardial Infarction. J. Am. Coll. Cardiol. 2022, 79, 311–323. [Google Scholar] [CrossRef]
- Erol, M.K.; Kayıkçıoğlu, M.; Kılıçkap, M.; Güler, A.; Öztürk, Ö.; Tuncay, B.; İnci, S.; Balaban, İ.; Tatar, F.; Çırakoğlu, Ö.F.; et al. Time delays in each step from symptom onset to treatment in acute myocardial infarction: Results from a nation-wide TURKMI registry. Anatol. J. Cardiol. 2021, 25, 294–303. [Google Scholar] [CrossRef] [PubMed]
- Kim, J.H.; Chae, S.C.; Oh, D.J.; Kim, H.S.; Kim, Y.J.; Ahn, Y.; Cho, M.C.; Kim, C.J.; Yoon, J.H.; Park, H.Y.; et al. Multicenter Cohort Study of Acute Myocardial Infarction in Korea–Interim Analysis of the Korea Acute Myocardial Infarction Registry-National Institutes of Health Registry. Circ. J. 2016, 80, 1427–1436. [Google Scholar] [CrossRef] [Green Version]
- Grech, E.D. ABC of interventional cardiology: Percutaneous coronary intervention. II: The procedure. BMJ 2003, 326, 1137–1140. [Google Scholar] [CrossRef] [Green Version]
- Guedeney, P.; Collet, J.P. Diagnosis and Mangement of Acute Coronary Syndrome: What is New and Why? Insight From the 2020 European Society of Cardiology Guidelines. J. Clin. Med. 2020, 9, 3474. [Google Scholar] [CrossRef]
- Pieper, K.S.; Gore, J.M.; FitzGerald, G.; Granger, C.B.; Goldberg, R.J.; Steg, G.; Eagle, K.A.; Anderson, F.A.; Budaj, A.; Fox, K.A. Validity of a risk-prediction tool for hospital mortality: The Global Registry of Acute Coronary Events. Am. Heart J. 2009, 157, 1097–1105. [Google Scholar] [CrossRef]
- Oh, S.; Hyun, D.Y.; Cho, K.H.; Kim, J.H.; Jeong, M.H. Long-term outcomes in ST-elevation myocardial infarction patients treated according to hospital visit time. Korean J. Intern. Med. 2022, 37, 605–617. [Google Scholar] [CrossRef] [PubMed]
- Lee, J.M.; Rhee, T.M.; Hahn, J.Y.; Kim, H.K.; Park, J.; Hwang, D.; Choi, K.H.; Kim, J.; Park, T.K.; Yang, J.H.; et al. Multivessel Percutaneous Coronary Intervention in Patients With ST-Segment Elevation Myocardial Infarction With Cardiogenic Shock. J. Am. Coll. Cardiol. 2018, 71, 844–856. [Google Scholar] [CrossRef]
- Kim, Y.H.; Her, A.Y.; Jeong, M.H.; Kim, B.K.; Lee, S.Y.; Hong, S.J.; Shin, D.H.; Kim, J.S.; Ko, Y.G.; Choi, D.; et al. Impact of renin-angiotensin system inhibitors on long-term clinical outcomes in patients with acute myocardial infarction treated with successful percutaneous coronary intervention with drug-eluting stents: Comparison between STEMI and NSTEMI. Atherosclerosis 2019, 280, 166–173. [Google Scholar] [CrossRef] [PubMed]
- Sacco, R.L.; Kasner, S.E.; Broderick, J.P.; Caplan, L.R.; Connors, J.J.; Culebras, A.; Elkind, M.S.; George, M.G.; Hamdan, A.D.; Higashida, R.T.; et al. An updated definition of stroke for the 21st century: A statement for healthcare professionals from the American Heart Association/American Stroke Association. Stroke 2013, 44, 2064–2089. [Google Scholar] [CrossRef] [Green Version]
- Cutlip, D.E.; Windecker, S.; Mehran, R.; Boam, A.; Cohen, D.J.; van Es, G.A.; Steg, P.G.; Morel, M.A.; Mauri, L.; Vranckx, P.; et al. Clinical end points in coronary stent trials: A case for standardized definitions. Circulation 2007, 115, 2344–2351. [Google Scholar] [CrossRef] [Green Version]
- Vatcheva, K.P.; Lee, M.; McCormick, J.B.; Rahbar, M.H. Multicollinearity in Regression Analyses Conducted in Epidemiologic Studies. Epidemiology 2016, 6, 227. [Google Scholar] [CrossRef] [Green Version]
- Kim, J.H. Multicollinearity and misleading statistical results. Korean J. Anesthesiol. 2019, 72, 558–569. [Google Scholar] [CrossRef] [Green Version]
- Kalantari, S.; Khalili, D.; Asgari, S.; Fahimfar, N.; Hadaegh, F.; Tohidi, M.; Azizi, F. Predictors of early adulthood hypertension during adolescence: A population-based cohort study. BMC Public Health 2017, 17, 915. [Google Scholar] [CrossRef]
- Vaccarino, V.; Parsons, L.; Every, N.R.; Barron, H.V.; Krumholz, H.M. Sex-based differences in early mortality after myocardial infarction. National Registry of Myocardial Infarction 2 Participants. N. Engl. J. Med. 1999, 341, 217–225. [Google Scholar] [CrossRef]
- Peerwani, G.; Khan, S.M.; Khan, M.D.; Bashir, F.; Sheikh, S.; Ramsey, D.J.; Aijaz, S.; Samad, Z.; Malik, R.; Hanif, B.; et al. Gender Differences in Clinical Outcomes After Percutaneous Coronary Intervention-Analysis of 15,106 Patients from the Cardiac Registry of Pakistan Database. Am. J. Cardiol. 2023, 188, 61–67. [Google Scholar] [CrossRef]
- Weininger, D.; Cordova, J.P.; Wilson, E.; Eslava, D.J.; Alviar, C.L.; Korniyenko, A.; Bavishi, C.P.; Hong, M.K.; Chorzempa, A.; Fox, J.; et al. Delays to Hospital Presentation in Women and Men with ST-Segment Elevation Myocardial Infarction: A Multi-Center Analysis of Patients Hospitalized in New York City. Ther. Clin. Risk. Manag. 2022, 18, 1–9. [Google Scholar] [CrossRef] [PubMed]
- Cubeddu, R.J.; Palacios, I.F.; Blankenship, J.C.; Horvath, S.A.; Xu, K.; Kovacic, J.C.; Dangas, G.D.; Witzenbichler, B.; Guagliumi, G.; Kornowski, R.; et al. Outcome of patients with ST-segment elevation myocardial infarction undergoing primary percutaneous coronary intervention during on- versus off-hours (a Harmonizing Outcomes with Revascularization and Stents in Acute Myocardial Infarction [HORIZONS-AMI] trial substudy). Am. J. Cardiol. 2013, 111, 946–954. [Google Scholar] [PubMed]
- Solhpour, A.; Chang, K.W.; Arain, S.A.; Balan, P.; Loghin, C.; McCarthy, J.J.; Vernon Anderson, H.; Smalling, R.W. Ischemic time is a better predictor than door-to-balloon time for mortality and infarct size in ST-elevation myocardial infarction. Catheter. Cardiovasc. Interv. 2016, 87, 1194–1200. [Google Scholar] [CrossRef]
- Foo, C.Y.; Bonsu, K.O.; Nallamothu, B.K.; Reid, C.M.; Dhippayom, T.; Reidpath, D.D.; Chaiyakunapruk, N. Coronary intervention door-to-balloon time and outcomes in ST-elevation myocardial infarction: A meta-analysis. Heart 2018, 104, 1362–1369. [Google Scholar] [CrossRef] [PubMed]
- Jobs, A.; Mehta, S.R.; Montalescot, G.; Vicaut, E.; Van’t Hof, A.W.J.; Badings, E.A.; Neumann, F.J.; Kastrati, A.; Sciahbasi, A.; Reuter, P.G.; et al. Optimal timing of an invasive strategy in patients with non-ST-elevation acute coronary syndrome: A meta-analysis of randomised trials. Lancet 2017, 390, 737–746. [Google Scholar] [CrossRef] [PubMed]
- Kim, Y.H.; Her, A.Y.; Jeong, M.H.; Kim, B.K.; Hong, S.J.; Kim, J.S.; Ko, Y.G.; Choi, D.; Hong, M.K.; Jang, Y. Impact of stent generation on 2-year clinical outcomes in ST-segment elevation myocardial infarction patients with multivessel disease who underwent culprit-only or multivessel percutaneous coronary intervention. Catheter. Cardiovasc. Interv. 2020, 95, E40–E55. [Google Scholar] [CrossRef] [PubMed]
- Champney, K.P.; Frederick, P.D.; Bueno, H.; Parashar, S.; Foody, J.; Merz, C.N.; Canto, J.G.; Lichtman, J.H.; Vaccarino, V. The joint contribution of sex, age and type of myocardial infarction on hospital mortality following acute myocardial infarction. Heart 2009, 95, 895–899. [Google Scholar] [CrossRef] [PubMed] [Green Version]
- Schoenenberger, A.W.; Radovanovic, D.; Stauffer, J.C.; Windecker, S.; Urban, P.; Niedermaier, G.; Keller, P.F.; Gutzwiller, F.; Erne, P. Acute coronary syndromes in young patients: Presentation, treatment and outcome. Int. J. Cardiol. 2011, 148, 300–304. [Google Scholar] [CrossRef] [PubMed]
- Heer, T.; Hochadel, M.; Schmidt, K.; Mehilli, J.; Zahn, R.; Kuck, K.H.; Hamm, C.; Böhm, M.; Ertl, G.; Hoffmeister, H.M.; et al. Sex Differences in Percutaneous Coronary Intervention-Insights From the Coronary Angiography and PCI Registry of the German Society of Cardiology. J. Am. Heart Assoc. 2017, 6, e002331. [Google Scholar] [CrossRef] [PubMed]
- Donataccio, M.P.; Puymirat, E.; Parapid, B.; Steg, P.G.; Eltchaninoff, H.; Weber, S.; Ferrari, E.; Vilarem, D.; Charpentier, S.; Manzo-Silberman, S.; et al. In-hospital outcomes and long-term mortality according to sex and management strategy in acute myocardial infarction. Insights from the French ST-elevation and non-ST-elevation Myocardial Infarction (FAST-MI) 2005 Registry. Int. J. Cardiol. 2015, 201, 265–270. [Google Scholar] [CrossRef] [PubMed]
- Ahmed, S.; Khan, A.; Ali, S.I.; Saad, M.; Jawaid, H.; Islam, M.; Saiyed, H.; Fatima, S.; Khan, A.; Basham, M.A.; et al. Differences in symptoms and presentation delay times in myocardial infarction patients with and without diabetes: A cross-sectional study in Pakistan. Indian Heart J. 2018, 70, 241–245. [Google Scholar] [CrossRef]
- Hu, D.Q.; Hao, Y.C.; Liu, J.; Yang, N.; Yang, Y.Q.; Sun, Z.Q.; Zhao, D.; Liu, J. Pre-hospital delay in patients with acute myocardial infarction in China: Findings from the Improving Care for Cardiovascular Disease in China-Acute Coronary Syndrome (CCC-ACS) project. J. Geriatr. Cardiol. 2022, 19, 276–283. [Google Scholar]
- Luo, C.; Pook, E.; Wang, F.; Archacki, S.R.; Tang, B.; Zhang, W.; Hu, J.S.; Yang, J.; Leineweber, K.; Bechem, M.; et al. ADTRP regulates TFPI expression via transcription factor POU1F1 involved in coronary artery disease. Gene 2020, 753, 144805. [Google Scholar] [CrossRef]


| Variables | SDT < 24 h, n = 3317 | SDT ≥ 24 h, n = 1276 | ||||
|---|---|---|---|---|---|---|
| Male (n = 2492, Group A) | Female (n = 825, Group B) | p Value | Male (n = 849, Group C) | Female (n = 427, Group D) | p Value | |
| Age, years | 61.0 ± 11.6 | 70.9 ± 9.8 | <0.001 | 63.4 ± 11.9 | 72.7 ± 9.2 | <0.001 |
| LVEF, % | 54.9 ± 10.2 | 53.7 ± 10.9 | 0.007 | 53.6 ± 11.5 | 53.1 ± 11.5 | 0.435 |
| BMI, kg/m2 | 24.4 ± 3.2 | 23.4 ± 3.5 | <0.001 | 24.2 ± 3.3 | 23.5 ± 3.7 | 0.003 |
| SBP, mmHg | 136.7 ± 26.6 | 136.7 ± 27.6 | 0.979 | 133.4 ± 23.3 | 133.6 ± 25.6 | 0.880 |
| DBP, mmHg | 82.5 ± 16.0 | 80.0 ± 15.1 | <0.001 | 80.6 ± 13.9 | 79.2 ± 15.1 | 0.116 |
| SDT, hours | 3.5 (1.6–8.0) | 4.4 (2.0–9.2) | 0.001 | 72.0 (34.7–136.7) | 67.9 (32.2–12.0) | 0.987 |
| DBT, hours | 13.0 (3.9–25.2) | 14.1 (4.0–25.0) | 0.319 | 16.5 (3.7–25.6) | 16.8 (4.3–26.2) | 0.203 |
| Cardiogenic shock, n (%) | 48 (1.9) | 18 (2.2) | 0.666 | 6 (0.7) | 9 (2.1) | 0.049 |
| CPR on admission, n (%) | 69 (2.8) | 39 (4.7) | 0.009 | 18 (2.1) | 16 (3.7) | 0.098 |
| Atypical chest pain, n (%) | 303 (12.2) | 149 (18.1) | <0.001 | 177 (20.8) | 119 (27.9) | 0.006 |
| Dyspnea, n (%) | 531 (21.3) | 224 (27.2) | 0.001 | 234 (27.6) | 140 (32.8) | 0.059 |
| EKG on admission | ||||||
| Q-wave, n (%) | 190 (7.6) | 39 (4.7) | 0.004 | 100 (11.8) | 33 (7.7) | 0.026 |
| ST-segment depression, n (%) | 552 (22.2) | 227 (27.5) | 0.002 | 135 (15.9) | 109 (25.5) | <0.001 |
| T-wave inversion, n (%) | 468 (18.8) | 248 (30.1) | <0.001 | 211 (24.9) | 139 (32.6) | 0.004 |
| Atrial fibrillation, n (%) | 99 (4.0) | 36 (4.4) | 0.612 | 31 (3.7) | 20 (4.7) | 0.368 |
| Killip class 1I/III, n (%) | 310 (12.4) | 177 (21.5) | <0.001 | 136 (16.0) | 105 (24.6) | <0.001 |
| First medical contact | ||||||
| EMS, n (%) | 318 (12.8) | 104 (12.6) | 0.952 | 30 (3.5) | 16 (3.7) | 0.874 |
| Non-PCI center, n (%) | 1207 (48.4) | 470 (57.0) | <0.001 | 484 (57.0) | 265 (62.1) | 0.092 |
| PCI center, n (%) | 967 (38.8) | 251 (30.4) | <0.001 | 335 (39.5) | 146 (34.2) | 0.076 |
| Hypertension, n (%) | 1163 (46.7) | 562 (68.1) | <0.001 | 423 (49.8) | 304 (71.2) | <0.001 |
| Diabetes mellitus, n (%) | 653 (26.2) | 316 (38.3) | <0.001 | 275 (32.4) | 173 (40.5) | 0.005 |
| Dyslipidemia, n (%) | 302 (12.1) | 98 (11.9) | 0.902 | 106 (12.5) | 42 (9.8) | 0.194 |
| Previous MI, n (%) | 178 (7.1) | 49 (5.9) | 0.265 | 61 (7.2) | 32 (7.5) | 0.821 |
| Previous PCI, n (%) | 267 (10.7) | 78 (9.5) | 0.324 | 80 (9.4) | 38 (8.9) | 0.838 |
| Previous CABG, n (%) | 16 (0.6) | 9 (1.1) | 0.243 | 7 (0.8) | 4 (0.9) | 0.838 |
| Previous HF, n (%) | 29 (1.2) | 20 (2.4) | 0.012 | 10 (1.2) | 10 (2.3) | 0.150 |
| Previous stroke, n (%) | 128 (5.1) | 61 (7.4) | 0.019 | 55 (6.5) | 34 (8.0) | 0.352 |
| Current smokers, n (%) | 1201 (48.2) | 63 (7.6) | <0.001 | 358 (42.2) | 23 (5.4) | <0.001 |
| Peak CK-MB, mg/dL | 28.5 (7.3–94.9) | 20.0 (6.6–85.6) | 0.034 | 11.4 (4.3–37.6) | 12.8 (5.1–39.9) | 0.623 |
| Peak troponin-I, ng/mL | 8.6 (1.7–26.9) | 6.1 (1.5–22.9) | 0.290 | 4.4 (1.2–16.1) | 4.2 (1.2–15.4) | 0.264 |
| Blood glucose, mg/dL | 156.2 ± 72.3 | 179.2 ± 93.5 | <0.001 | 146.7 ± 57.1 | 164.7 ± 97.6 | 0.001 |
| Hs-CRP (mg/dL) | 0.96 ± 2.72 | 1.60 ± 8.07 | 0.083 | 3.02 ± 13.5 | 2.48 ± 12.8 | 0.604 |
| Serum creatinine (mg/L) | 1.16 ± 1.29 | 1.08 ± 1.33 | 0.143 | 1.25 ± 1.55 | 1.09 ± 0.98 | 0.027 |
| Total cholesterol, mg/dL | 179.2 ± 43.9 | 182.4 ± 48.6 | 0.106 | 173.2 ± 43.3 | 180.8 ± 47.8 | 0.006 |
| Triglyceride, mg/L | 136.0 ± 116.9 | 126.9 ± 130.2 | 0.088 | 132.0 ± 110.4 | 121.0 ± 69.5 | 0.038 |
| HDL cholesterol, mg/L | 42.4 ± 11.3 | 45.3 ± 12.3 | <0.001 | 40.4 ± 11.2 | 44.3 ± 12.9 | <0.001 |
| LDL cholesterol, mg/L | 113.8 ± 38.5 | 113.8 ± 40.2 | 0.984 | 109.3 ± 37.7 | 114.4 ± 40.6 | 0.047 |
| GRACE risk score | 124.3 ± 40.1 | 146.7 ± 42.3 | <0.001 | 127.9 ± 36.0 | 148.4 ± 37.7 | <0.001 |
| >140, n (%) | 683 (27.4) | 408 (49.5) | <0.001 | 273 (32.2) | 239 (56.0) | <0.001 |
| Discharge medications, n (%) | ||||||
| Aspirin, n (%) | 2462 (98.8) | 815 (98.8) | 0.985 | 832 (98.0) | 423 (99.1) | 0.242 |
| Clopidogrel, n (%) | 1720 (69.0) | 643 (77.9) | <0.001 | 597 (70.3) | 362 (84.8) | <0.001 |
| Ticagrelor, n (%) | 500 (20.1) | 144 (17.5) | 0.104 | 160 (18.8) | 50 (11.7) | 0.001 |
| Prasugrel, n (%) | 272 (10.9) | 38 (4.6) | <0.001 | 92 (10.8) | 15 (3.5) | <0.001 |
| BBs, n (%) | 2100 (84.3) | 714 (86.5) | 0.117 | 711 (83.7) | 352 (82.4) | 0.578 |
| ACEI or ARBs, n (%) | 2032 (81.5) | 690 (83.6) | 0.191 | 687 (80.9) | 344 (80.6) | 0.880 |
| Statin, n (%) | 2362 (94.8) | 763 (92.5) | 0.016 | 795 (93.6) | 398 (93.2) | 0.810 |
| Anticoagulant, n (%) | 43 (1.7) | 14 (1.7) | 0.956 | 23 (2.7) | 16 (3.7) | 0.306 |
| Infarct-related artery | ||||||
| Left main, n (%) | 81 (3.3) | 16 (1.9) | 0.056 | 30 (3.5) | 19 (4.4) | 0.442 |
| LAD, n (%) | 1045 (41.9) | 370 (44.8) | 0.143 | 334 (39.3) | 202 (47.3) | 0.007 |
| LCx, n (%) | 666 (26.7) | 209 (25.3) | 0.439 | 200 (23.6) | 92 (21.5) | 0.438 |
| RCA, n (%) | 700 (28.1) | 230 (27.9) | 0.929 | 285 (33.6) | 114 (26.7) | 0.013 |
| Treated vessel | ||||||
| Left main, n (%) | 118 (4.7) | 28 (3.4) | 0.117 | 51 (6.0) | 26 (6.1) | 0.954 |
| LAD, n (%) | 1385 (55.6) | 500 (60.6) | 0.012 | 475 (55.9) | 278 (65.1) | 0.002 |
| LCx, n (%) | 976 (39.2) | 312 (37.8) | 0.510 | 324 (38.2) | 159 (37.2) | 0.760 |
| RCA, n (%) | 914 (36.7) | 300 (36.4) | 0.900 | 366 (43.1) | 150 (35.1) | 0.007 |
| Multivessel disease, n (%) | 1327 (53.3) | 465 (56.4) | 0.126 | 499 (58.8) | 250 (58.5) | 0.952 |
| ACC/AHA type B2/C lesions, n (%) | 2100 (84.3) | 693 (84.0) | 0.869 | 716 (84.3) | 360 (84.3) | 0.991 |
| Pre-PCI TIMI flow grade 0/1, n (%) | 964 (38.7) | 315 (38.2) | 0.805 | 338 (39.8) | 145 (34.0) | 0.044 |
| GP IIb/IIIa inhibitor, n (%) | 222 (8.9) | 66 (8.0) | 0.476 | 77 (9.1) | 34 (8.0) | 0.530 |
| Transradial approach, n (%) | 1301 (52.2) | 369 (44.7) | <0.001 | 495 (58.3) | 219 (51.3) | 0.020 |
| IVUS/OCT, n (%) | 661 (26.5) | 170 (20.6) | 0.001 | 233 (27.4) | 87 (20.4) | 0.006 |
| FFR, n (%) | 59 (2.4) | 15 (1.8) | 0.415 | 26 (3.1) | 3 (0.7) | 0.008 |
| Drug-eluting stents a | ||||||
| ZES, n (%) | 629 (25.2) | 200 (24.2) | 0.578 | 183 (21.6) | 98 (23.0) | 0.568 |
| EES, n (%) | 1313 (52.7) | 437 (53.0) | 0.936 | 453 (53.4) | 230 (53.9) | 0.905 |
| BES, n (%) | 489 (19.6) | 166 (20.1) | 0.762 | 198 (23.3) | 88 (20.6) | 0.287 |
| Others, n (%) | 61 (2.4) | 22 (2.7) | 0.701 | 15 (1.8) | 11 (2.6) | 0.401 |
| Stent diameter (mm) | 3.11 ± 0.43 | 2.98 ± 0.39 | <0.001 | 3.11 ± 0.43 | 2.97 ± 0.39 | <0.001 |
| Stent length (mm) | 29.2 ± 13.7 | 30.2 ± 14.1 | 0.078 | 30.3 ± 15.4 | 29.9 ± 14.1 | 0.564 |
| Number of stents | 1.19 ± 0.45 | 1.22 ± 0.46 | 0.192 | 1.22 ± 0.47 | 1.21 ± 0.47 | 0.863 |
| In-Hospital Outcomes | |||||||||
|---|---|---|---|---|---|---|---|---|---|
| Outcomes | SDT < 24 h, n = 3317 | ||||||||
| Male (n = 2492, Group A) | Female (n = 825, Group B) | Log-Rank | Unadjusted | Multivariable-Adjusted a | Propensity Score-Adjusted | ||||
| HR (95% CI) | p | HR (95% CI) | p | HR (95% CI) | p | ||||
| All-cause death | 38 (1.5) | 16 (1.9) | 0.412 | 0.784 (0.437–1.406) | 0.414 | 1.034 (0.572–1.869) | 0.913 | 1.146 (0.627–2.096) | 0.657 |
| Cardiac death | 25 (1.0) | 13 (1.6) | 0.180 | 0.634 (0.325–1.241) | 0.184 | 1.324 (0.669–2.617) | 0.420 | 1.478 (0.730–2.992) | 0.278 |
| SDT ≥ 24 h, n = 1276 | |||||||||
| Male (n = 849, group C) | Female (n = 427, group D) | Log-rank | Unadjusted | Multivariable-adjusted a | Propensity score-adjusted | ||||
| HR (95% CI) | p | HR (95% CI) | p | HR (95% CI) | p | ||||
| All-cause death | 13 (1.5) | 6 (1.4) | 0.864 | 1.088 (0.414–2.864) | 0.864 | 1.218 (0.435–3.411) | 0.707 | 1.029 (0.318–3.218) | 0.932 |
| Cardiac death | 11 (1.3) | 5 (1.2) | 0.853 | 1.105 (0.384–3.180) | 0.853 | 1.011 (0.346–2.952) | 0.984 | 1.087 (0.484–3.380) | 0.878 |
| 3-year outcomes | |||||||||
| Outcomes | SDT < 24 h, n = 3317 | ||||||||
| Male (n = 2492, group A) | Female (n = 825, group B) | Log-rank | Unadjusted | Multivariable-adjusted a | Propensity score-adjusted | ||||
| HR (95% CI) | p | HR (95% CI) | p | HR (95% CI) | p | ||||
| MACCE | 392 (15.7) | 161 (19.5) | 0.010 | 0.783 (0.652–0.941) | 0.009 | 1.181 (0.982–1.422) | 0.098 | 1.208 (1.001–1.462) | 0.058 |
| All-cause death | 171 (6.9) | 88 (10.7) | <0.001 | 0.631 (0.488–0.816) | <0.001 | 1.392 (1.073–1.804) | 0.013 | 1.451 (1.118–1.884) | 0.005 |
| Cardiac death | 97 (3.9) | 54 (6.5) | 0.001 | 0.585 (0.419–0.816) | 0.002 | 1.520 (1.086–2.128) | 0.015 | 1.583 (1.129–2.220) | 0.008 |
| Non-cardiac death | 74 (3.0) | 34 (4.2) | 0.089 | 0.705 (0.469–1.058) | 0.091 | 1.226 (0.814–1.845) | 0.330 | 1.282 (0.851–1.933) | 0.235 |
| Recurrent MI | 73 (3.0) | 35 (4.3) | 0.050 | 0.670 (0.448–1.003) | 0.052 | 1.390 (0.926–2.087) | 0.112 | 1.401 (0.932–2.106) | 0.105 |
| Any repeat revascularization | 224 (9.4) | 72 (9.3) | 0.998 | 1.001 (0.767–1.304) | 0.999 | 1.038 (0.794–1.356) | 0.785 | 1.021 (0.781–1.335) | 0.879 |
| Stroke | 38 (1.6) | 20 (2.6) | 0.073 | 0.612 (0.356–1.052) | 0.076 | 1.562 (0.905–2.696) | 0.109 | 1.547 (0.894–2.676) | 0.147 |
| ST (definite or probable) | 11 (0.5) | 6 (0.8) | 0.299 | 0.594 (0.220–1.606) | 0.305 | 1.561 (0.565–4.311) | 0.390 | 1.438 (0.514–4.019) | 0.489 |
| Outcomes | SDT ≥ 24 h, n = 1276 | ||||||||
| Male (n = 849, group C) | Female (n = 427, group D) | Log-rank | Unadjusted | Multivariable-adjusted a | Propensity score-adjusted | ||||
| HR (95% CI) | p | HR (95% CI) | p | HR (95% CI) | p | ||||
| MACCE | 146 (17.2) | 76 (17.8) | 0.835 | 0.971 (0.736–1.281) | 0.835 | 1.013 (0.766–1.340) | 0.927 | 1.088 (0.819–1.447) | 0.561 |
| All-cause death | 79 (9.3) | 54 (12.7) | 0.072 | 0.729 (0.516–1.031) | 0.074 | 1.375 (0.968–1.952) | 0.075 | 1.362 (0.681–1.842) | 0.087 |
| Cardiac death | 49 (5.7) | 35 (8.2) | 0.103 | 0.699 (0.453–1.078) | 0.105 | 1.484 (0.955–2.305) | 0.079 | 1.451 (0.933–2.214) | 0.095 |
| Non-cardiac death | 30 (3.6) | 19 (4.5) | 0.409 | 0.785 (0.442–1.395) | 0.410 | 1.209 (0.676–2.164) | 0.522 | 1.295 (0.782–2.352) | 0.245 |
| Recurrent MI | 27 (3.3) | 15 (3.7) | 0.735 | 0.897 (0.477–1.686) | 0.735 | 1.099 (0.581–2.078) | 0.772 | 1.143 (0.601–2.175) | 0.746 |
| Any repeat revascularization | 71 (8.8) | 21 (5.2) | 0.028 | 1.715 (1.054–2.790) | 0.030 | 1.534 (0.879–2.676) | 0.132 | 1.597 (0.902–2.987) | 0.101 |
| Stroke | 22 (2.7) | 19 (4.7) | 0.072 | 0.573 (0.310–1.059) | 0.076 | 1.717 (0.923–3.194) | 0.088 | 1.612 (0.884–3.567) | 0.198 |
| ST (definite or probable) | 6 (0.7) | 2 (0.5) | 0.620 | 1.495 (0.302–7.406) | 0.623 | 1.447 (0.286–7.310) | 0.655 | 1.363 (0.189–9.834) | 0.758 |
| Outcomes | Total, n = 4593 | ||||||||
| Male (n = 3341, group A + C) | Female (n = 1252, group B + D) | Log-rank | Unadjusted | Multivariable-adjusted a | Propensity score-adjusted | ||||
| HR (95% CI) | p | HR (95% CI) | p | HR (95% CI) | p | ||||
| MACCE | 538 (16.1) | 237 (18.9) | 0.023 | 0.837 (0.719–0.976) | 0.023 | 1.124 (0.964–1.311) | 0.136 | 1.131 (1.002–1.383) | 0.101 |
| All-cause death | 250 (7.5) | 142 (11.3) | <0.001 | 0.649 (0.528–0.797) | <0.001 | 1.411 (1.147–1.737) | 0.001 | 1.408 (1.131–1.687) | 0.002 |
| Cardiac death | 146 (4.4) | 89 (7.1) | <0.001 | 0.606 (0.469–0.789) | <0.001 | 1.525 (1.169–1.989) | 0.002 | 1.458 (1.133–1.563) | 0.004 |
| Non-cardiac death | 104 (3.1) | 53 (4.2) | 0.052 | 0.721 (0.518–1.004) | 0.053 | 1.257 (0.901–1.754) | 0.179 | 1.179 (0.835–1.665) | 0.349 |
| Recurrent MI | 100 (3.0) | 50 (4.1) | 0.071 | 0.732 (0.521–1.028) | 0.072 | 1.300 (0.923–1.830) | 0.133 | 1.286 (0.905–1.785) | 0.204 |
| Any repeat revascularization | 295 (9.3) | 93 (7.9) | 0.190 | 1.168 (0.926–1.475) | 0.191 | 1.230 (0.944–1.603) | 0.124 | 1.181 (0.933–1.594) | 0.166 |
| Stroke | 60 (1.9) | 39 (3.3) | 0.005 | 0.562 (0.376–0.841) | 0.005 | 1.206 (0.753–1.931) | 0.437 | 1.360 (0.814–2.108) | 0.183 |
| ST (definite or probable) | 17 (0.5) | 8 (0.7) | 0.564 | 0.782 (0.337–1.811) | 0.565 | 1.266 (0.542–2.957) | 0.585 | 1.301 (0.787–3.124) | 0.202 |
| In-Hospital Outcomes | |||||||||
|---|---|---|---|---|---|---|---|---|---|
| Outcomes | Male, n = 3341 | ||||||||
| SDT < 24 h (n = 2492, Group A) | SDT ≥ 24 h (n = 849, Group C) | Log-Rank | Unadjusted | Multivariable-Adjusted a | Propensity Score-Adjusted | ||||
| HR (95% CI) | p | HR (95% CI) | p | HR (95% CI) | p | ||||
| All-cause death | 38 (1.5) | 13 (1.5) | 0.985 | 0.994 (0.530–1.866) | 0.985 | 1.425 (0.705–2.883) | 0.327 | 1.468 (0.750–3.012) | 0.238 |
| Cardiac death | 25 (1.0) | 11 (1.3) | 0.477 | 0.774 (0.381–1.572) | 0.478 | 2.036 (0.871–4.758) | 0.101 | 2.141 (0.917–4.784) | 0.096 |
| Outcomes | Female, n = 1252 | ||||||||
| SDT < 24 h (n = 825, group B) | SDT ≥ 24 h (n = 427, group D) | Log-rank | Unadjusted | Multivariable-adjusted a | Propensity score-adjusted | ||||
| HR (95% CI) | p | HR (95% CI) | p | HR (95% CI) | p | ||||
| All-cause death | 16 (1.9) | 6 (1.4) | 0.498 | 1.381 (0.540–3.530) | 0.500 | 1.143 (0.377–3.463) | 0.813 | 1.198 (0.443–3.621) | 0.622 |
| Cardiac death | 13 (1.6) | 5 (1.2) | 0.570 | 1.346 (0.480–3.777) | 0.572 | 1.618 (0.488–5.363) | 0.432 | 1.697 (0.561–6.021) | 0.387 |
| 3-year outcomes | |||||||||
| Outcomes | Male, n = 3341 | ||||||||
| SDT < 24 h (n = 2492, group A) | SDT ≥ 24 h (n = 849, group C) | Log-rank | Unadjusted | Multivariable-adjusted a | Propensity score-adjusted | ||||
| HR (95% CI) | p | HR (95% CI) | p | HR (95% CI) | p | ||||
| MACCE | 392 (15.7) | 146 (17.2) | 0.331 | 0.910 (0.753–1.100) | 0.331 | 1.099 (0.901–1.341) | 0.351 | 1.110 (0.912–1.349) | 0.297 |
| All-cause death | 171 (6.9) | 79 (9.3) | 0.020 | 0.730 (0.559–0.953) | 0.020 | 1.450 (1.066–1.925) | 0.010 | 1.434 (1.085–1.894) | 0.011 |
| Cardiac death | 97 (3.9) | 49 (5.7) | 0.021 | 0.668 (0.474–0.942) | 0.021 | 1.542 (1.093–2.231) | 0.022 | 1.587 (1.105–2.280) | 0.012 |
| Non-cardiac death | 74 (3.0) | 30 (3.6) | 0.390 | 0.830 (0.543–1.269) | 0.390 | 1.291 (0.827–2.016) | 0.261 | 1.251 (0.806–1.943) | 0.318 |
| Recurrent MI | 73 (3.0) | 27 (3.3) | 0.673 | 0.909 (0.585–1.414) | 0.673 | 1.105 (0.698–1.748) | 0.670 | 1.033 (0.658–1.622) | 0.887 |
| Any repeat revascularization | 224 (9.4) | 71 (8.8) | 0.636 | 1.066 (0.817–1.393) | 0.637 | 1.132 (0.860–1.491) | 0.377 | 1.095 (0.834–1.438) | 0.515 |
| Stroke | 38 (1.6) | 22 (2.7) | 0.037 | 0.570 (0.341–0.975) | 0.040 | 1.378 (0.806–2.390) | 0.238 | 1.474 (0.860–2.526) | 0.158 |
| ST (definite or probable) | 11 (0.5) | 6 (0.7) | 0.336 | 0.616 (0.228–1.667) | 0.340 | 1.253 (0.443–3.545) | 0.670 | 1.293 (0.466–3.687) | 0.612 |
| Outcomes | Female, n = 1252 | ||||||||
| SDT < 24 h (n = 825, group B) | SDT ≥ 24 h (n = 427, group D) | Log-rank | Unadjusted | Multivariable-adjusted a | Propensity score-adjusted | ||||
| HR (95% CI) | p | HR (95% CI) | p | HR (95% CI) | p | ||||
| MACCE | 161 (19.5) | 76 (17.8) | 0.399 | 1.124 (0.856–1.477) | 0.399 | 1.107 (0.833–1.471) | 0.483 | 1.133 (0.855–1.512) | 0.385 |
| All-cause death | 88 (10.7) | 54 (12.7) | 0.328 | 0.845 (0.602–1.185) | 0.329 | 1.249 (0.852–1.787) | 0.225 | 1.177 (0.829–1.673) | 0.362 |
| Cardiac death | 54 (6.5) | 35 (8.2) | 0.303 | 0.800 (0.523–1.224) | 0.304 | 1.342 (0.872–2.112) | 0.205 | 1.325 (0.848–2.070) | 0.216 |
| Non-cardiac death | 34 (4.2) | 19 (4.5) | 0.790 | 0.926 (0.528–1.624) | 0.790 | 1.143 (0.635–2.055) | 0.656 | 1.016 (0.573–1.801) | 0.956 |
| Recurrent MI | 35 (4.3) | 15 (3.7) | 0.518 | 1.220 (0.666–2.234) | 0.519 | 1.253 (0.669–2.346) | 0.481 | 1.226 (0.659–2.282) | 0.520 |
| Any repeat revascularization | 72 (9.3) | 21 (5.2) | 0.014 | 1.825 (1.122–2.967) | 0.015 | 1.634 (0.994–2.542) | 0.102 | 1.531 (0.864–2.375) | 0.352 |
| Stroke | 20 (2.6) | 19 (4.7) | 0.051 | 0.541 (0.289–1.013) | 0.055 | 1.706 (0.103–3.376) | 0.086 | 1.698 (0.913–3.264) | 0.093 |
| ST (definite or probable) | 6 (0.8) | 2 (0.5) | 0.586 | 1.555 (0.314–7.703) | 0.589 | 1.395 (0.232–8.387) | 0.716 | 1.451 (0.264–8.874) | 0.634 |
| Outcomes | Total, n = 4593 | ||||||||
| SDT < 24 h (n = 3317, group A + B) | SDT ≥ 24 h (n = 1276, group C + D) | Log-rank | Unadjusted | Multivariable-adjusted a | Propensity score-adjusted | ||||
| HR (95% CI) | p | HR (95% CI) | p | HR (95% CI) | p | ||||
| MACCE | 553 (16.7) | 222 (17.4) | 0.615 | 0.961 (0.822–1.123) | 0.615 | 1.051 (0.895–1.235) | 0.543 | 1.044 (0.890–1.189) | 0.625 |
| All-cause death | 259 (7.8) | 133 (10.4) | 0.004 | 0.743 (0.603–0.916) | 0.005 | 1.433 (1.152–1.781) | 0.001 | 1.385 (1.115–1.718) | 0.003 |
| Cardiac death | 151(4.5) | 84 (6.5) | 0.005 | 0.687 (0.526–0.896) | 0.006 | 1.574 (1.189–2.082) | 0.002 | 1.543 (1.168–2.039) | 0.003 |
| Non-cardiac death | 108 (3.3) | 49 (3.9) | 0.309 | 0.839 (0.599–1.176) | 0.309 | 1.234 (0.871–1.751) | 0.237 | 1.178 (0.832–1.696) | 0.355 |
| Recurrent MI | 108 (3.3) | 42 (3.5) | 0.871 | 0.981 (0.687–1.401) | 0.872 | 1.134 (0.784–1.639) | 0.505 | 1.082 (0.752–1.558) | 0.671 |
| Any repeat revascularization | 296 (9.4) | 92 (7.6) | 0.071 | 1.240 (0.981–1.567) | 0.071 | 1.231 (0.961–1.418) | 0.082 | 1.214 (0.958–1.540) | 0.109 |
| Stroke | 58 (1.8) | 41 (3.4) | 0.002 | 0.534 (0.358–0.797) | 0.002 | 1.502 (1.062–2.335) | 0.182 | 1.513 (1.074–2.412) | 0.142 |
| ST (definite or probable) | 17 (0.5) | 8 (0.7) | 0.620 | 0.809 (0.349–1.874) | 0.620 | 1.059 (0.438–2.565) | 0.898 | 1.078 (0.450–2.583) | 0.832 |
Disclaimer/Publisher’s Note: The statements, opinions and data contained in all publications are solely those of the individual author(s) and contributor(s) and not of MDPI and/or the editor(s). MDPI and/or the editor(s) disclaim responsibility for any injury to people or property resulting from any ideas, methods, instructions or products referred to in the content. |
© 2023 by the authors. Licensee MDPI, Basel, Switzerland. This article is an open access article distributed under the terms and conditions of the Creative Commons Attribution (CC BY) license (https://creativecommons.org/licenses/by/4.0/).
Share and Cite
Kim, Y.H.; Her, A.-Y.; Rha, S.-W.; Choi, C.U.; Choi, B.G.; Kim, J.B.; Park, S.; Kang, D.O.; Park, J.Y.; Choi, W.G.; et al. Sex Differences in Delayed Hospitalization in Patients with Non-ST-Segment Elevation Myocardial Infarction Undergoing New-Generation Drug-Eluting Stent Implantation. J. Clin. Med. 2023, 12, 1982. https://doi.org/10.3390/jcm12051982
Kim YH, Her A-Y, Rha S-W, Choi CU, Choi BG, Kim JB, Park S, Kang DO, Park JY, Choi WG, et al. Sex Differences in Delayed Hospitalization in Patients with Non-ST-Segment Elevation Myocardial Infarction Undergoing New-Generation Drug-Eluting Stent Implantation. Journal of Clinical Medicine. 2023; 12(5):1982. https://doi.org/10.3390/jcm12051982
Chicago/Turabian StyleKim, Yong Hoon, Ae-Young Her, Seung-Woon Rha, Cheol Ung Choi, Byoung Geol Choi, Ji Bak Kim, Soohyung Park, Dong Oh Kang, Ji Young Park, Woong Gil Choi, and et al. 2023. "Sex Differences in Delayed Hospitalization in Patients with Non-ST-Segment Elevation Myocardial Infarction Undergoing New-Generation Drug-Eluting Stent Implantation" Journal of Clinical Medicine 12, no. 5: 1982. https://doi.org/10.3390/jcm12051982