Figure 1.
LV time–activity curve by the radionuclide technique in a typical patient with diastolic heart failure and a normal control: note the reduced early filling and filling rate and the reliance on atrial systole in the patient with diastolic heart failure. AFR = Atrial filling rate; AS = Atrial systole; DIA = Diastasis; EDV = End-diastolic volume; ESV = End-systolic volume; PFR = Peak filling rate; RFP = Rapid filling period; TPFR = Time to peak filling rate.
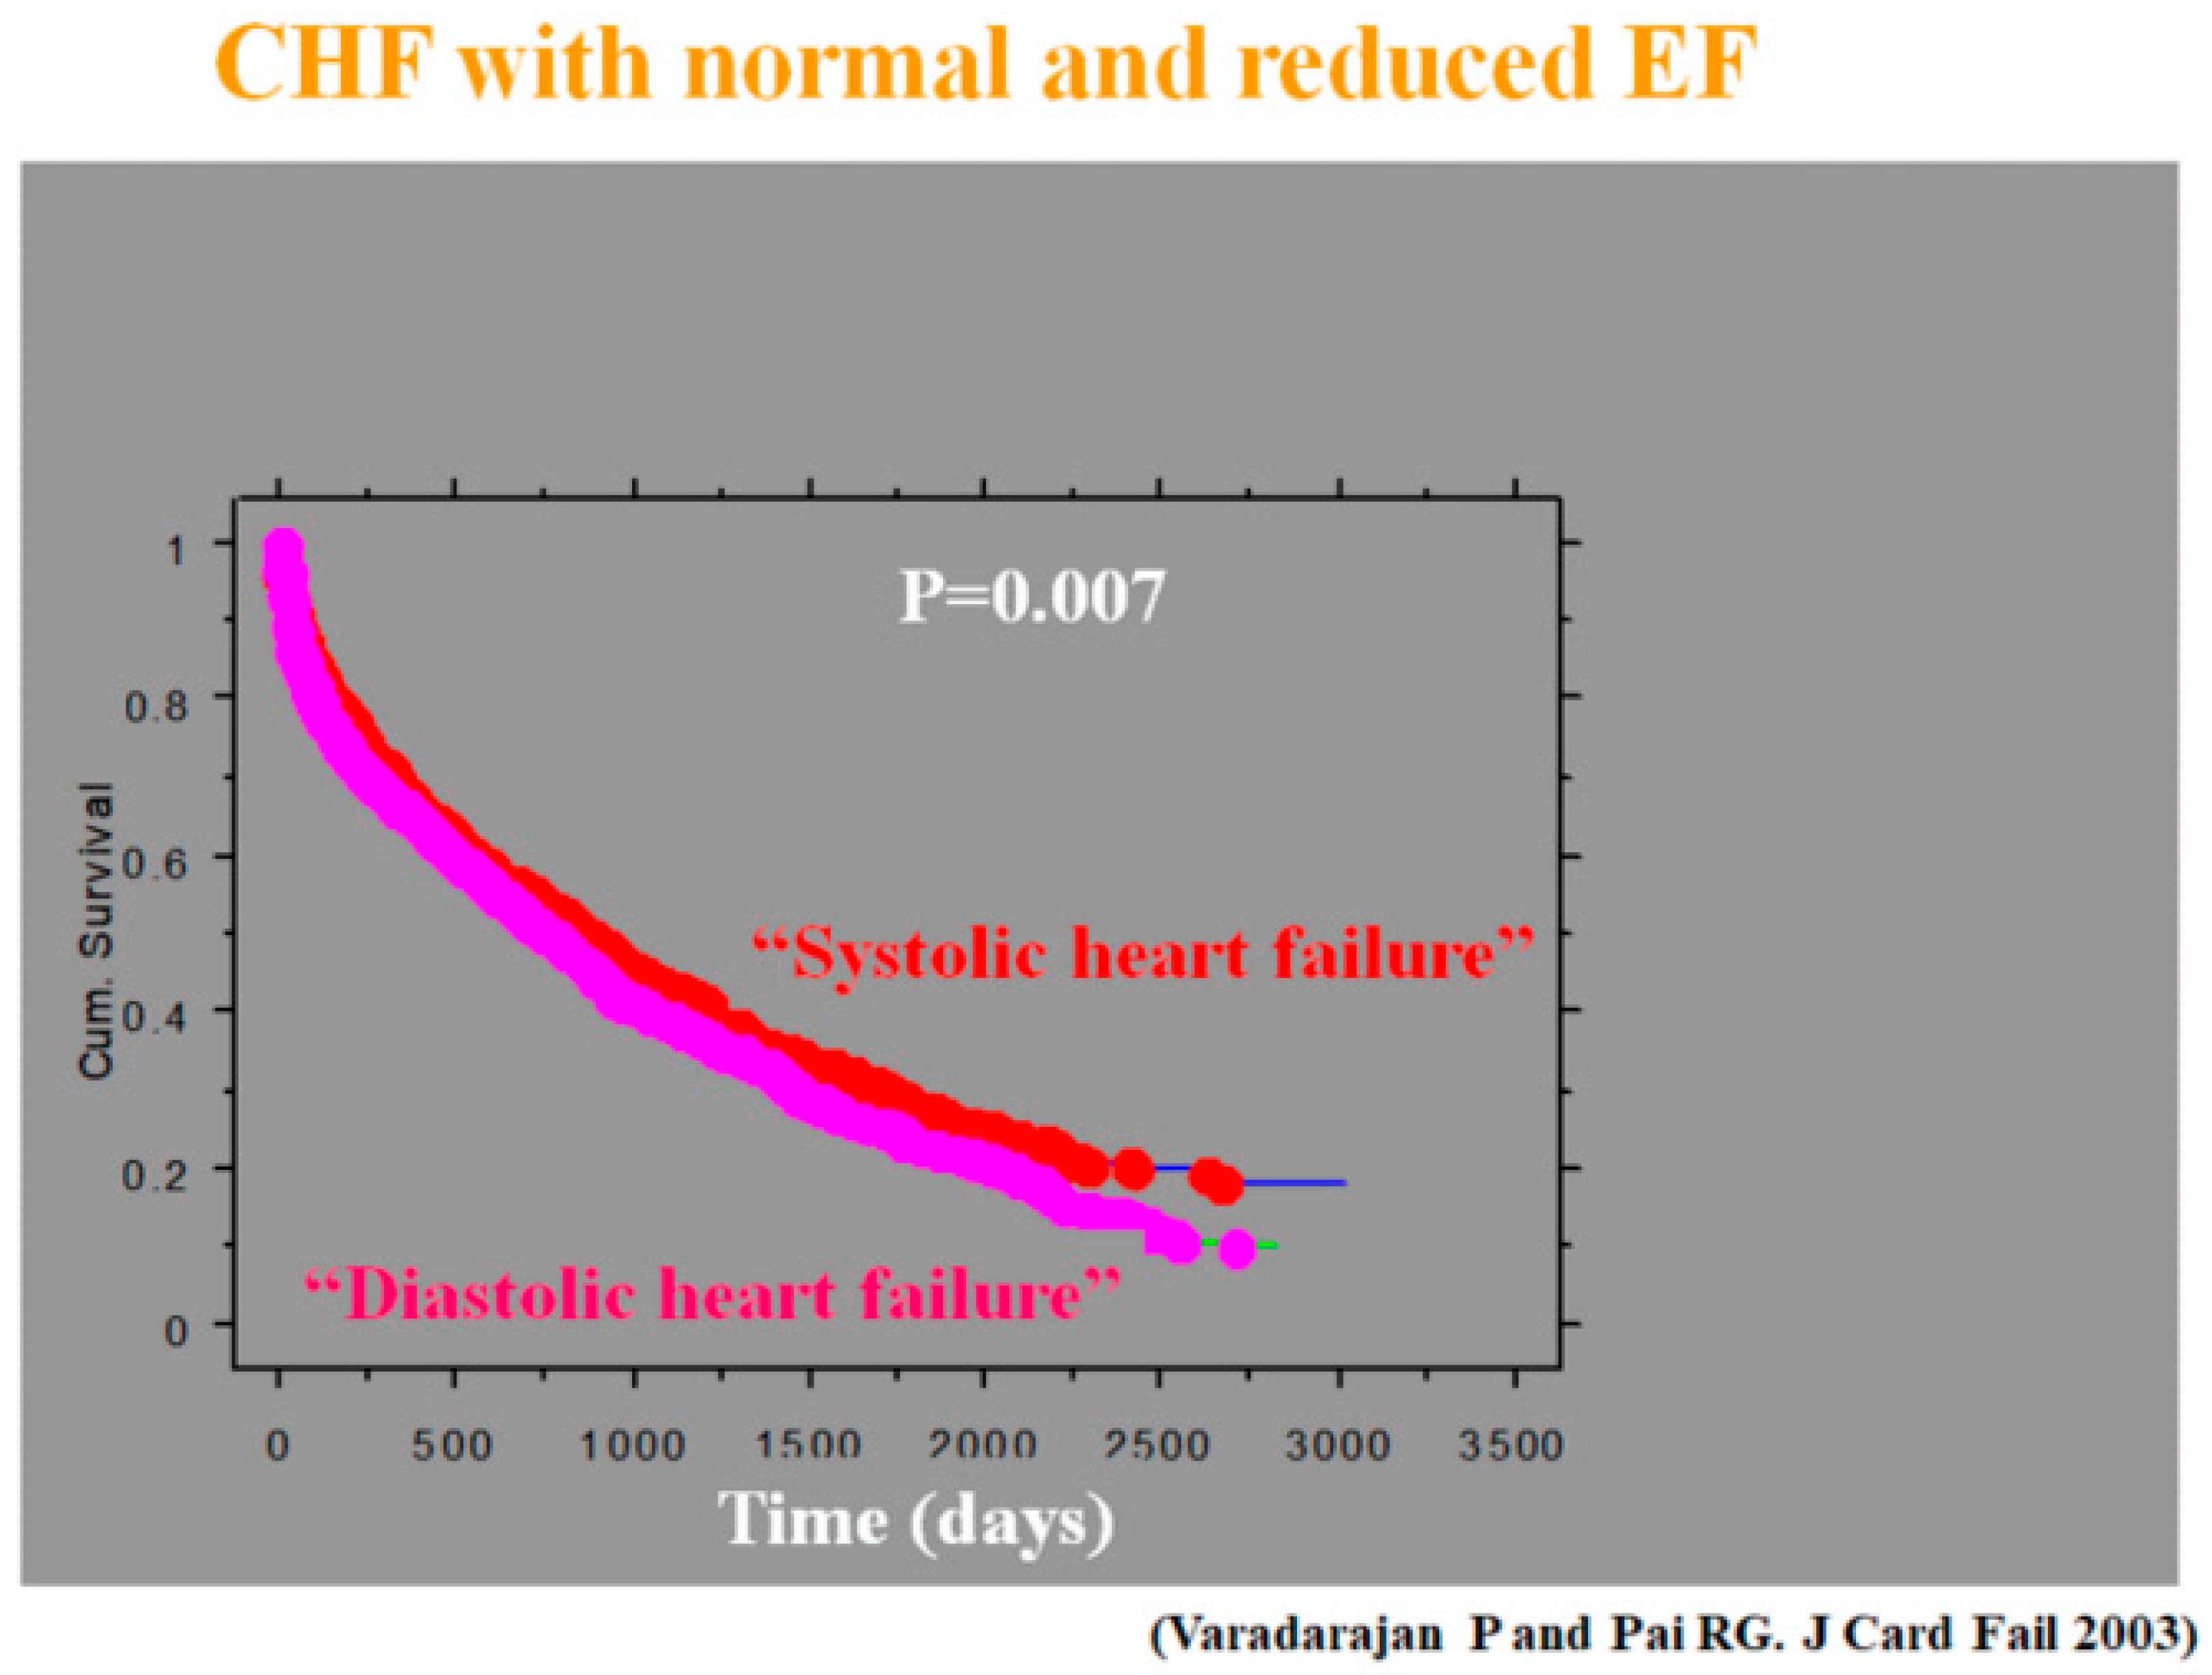
Figure 2.
Prognosis of heart failure (HF) patients admitted to the hospital for decompensation [
5]: though both groups fared poorly, the survival for diastolic heart failure was worse. CHF = Congestive HF; EF = Ejection fraction.
Figure 2.
Prognosis of heart failure (HF) patients admitted to the hospital for decompensation [
5]: though both groups fared poorly, the survival for diastolic heart failure was worse. CHF = Congestive HF; EF = Ejection fraction.
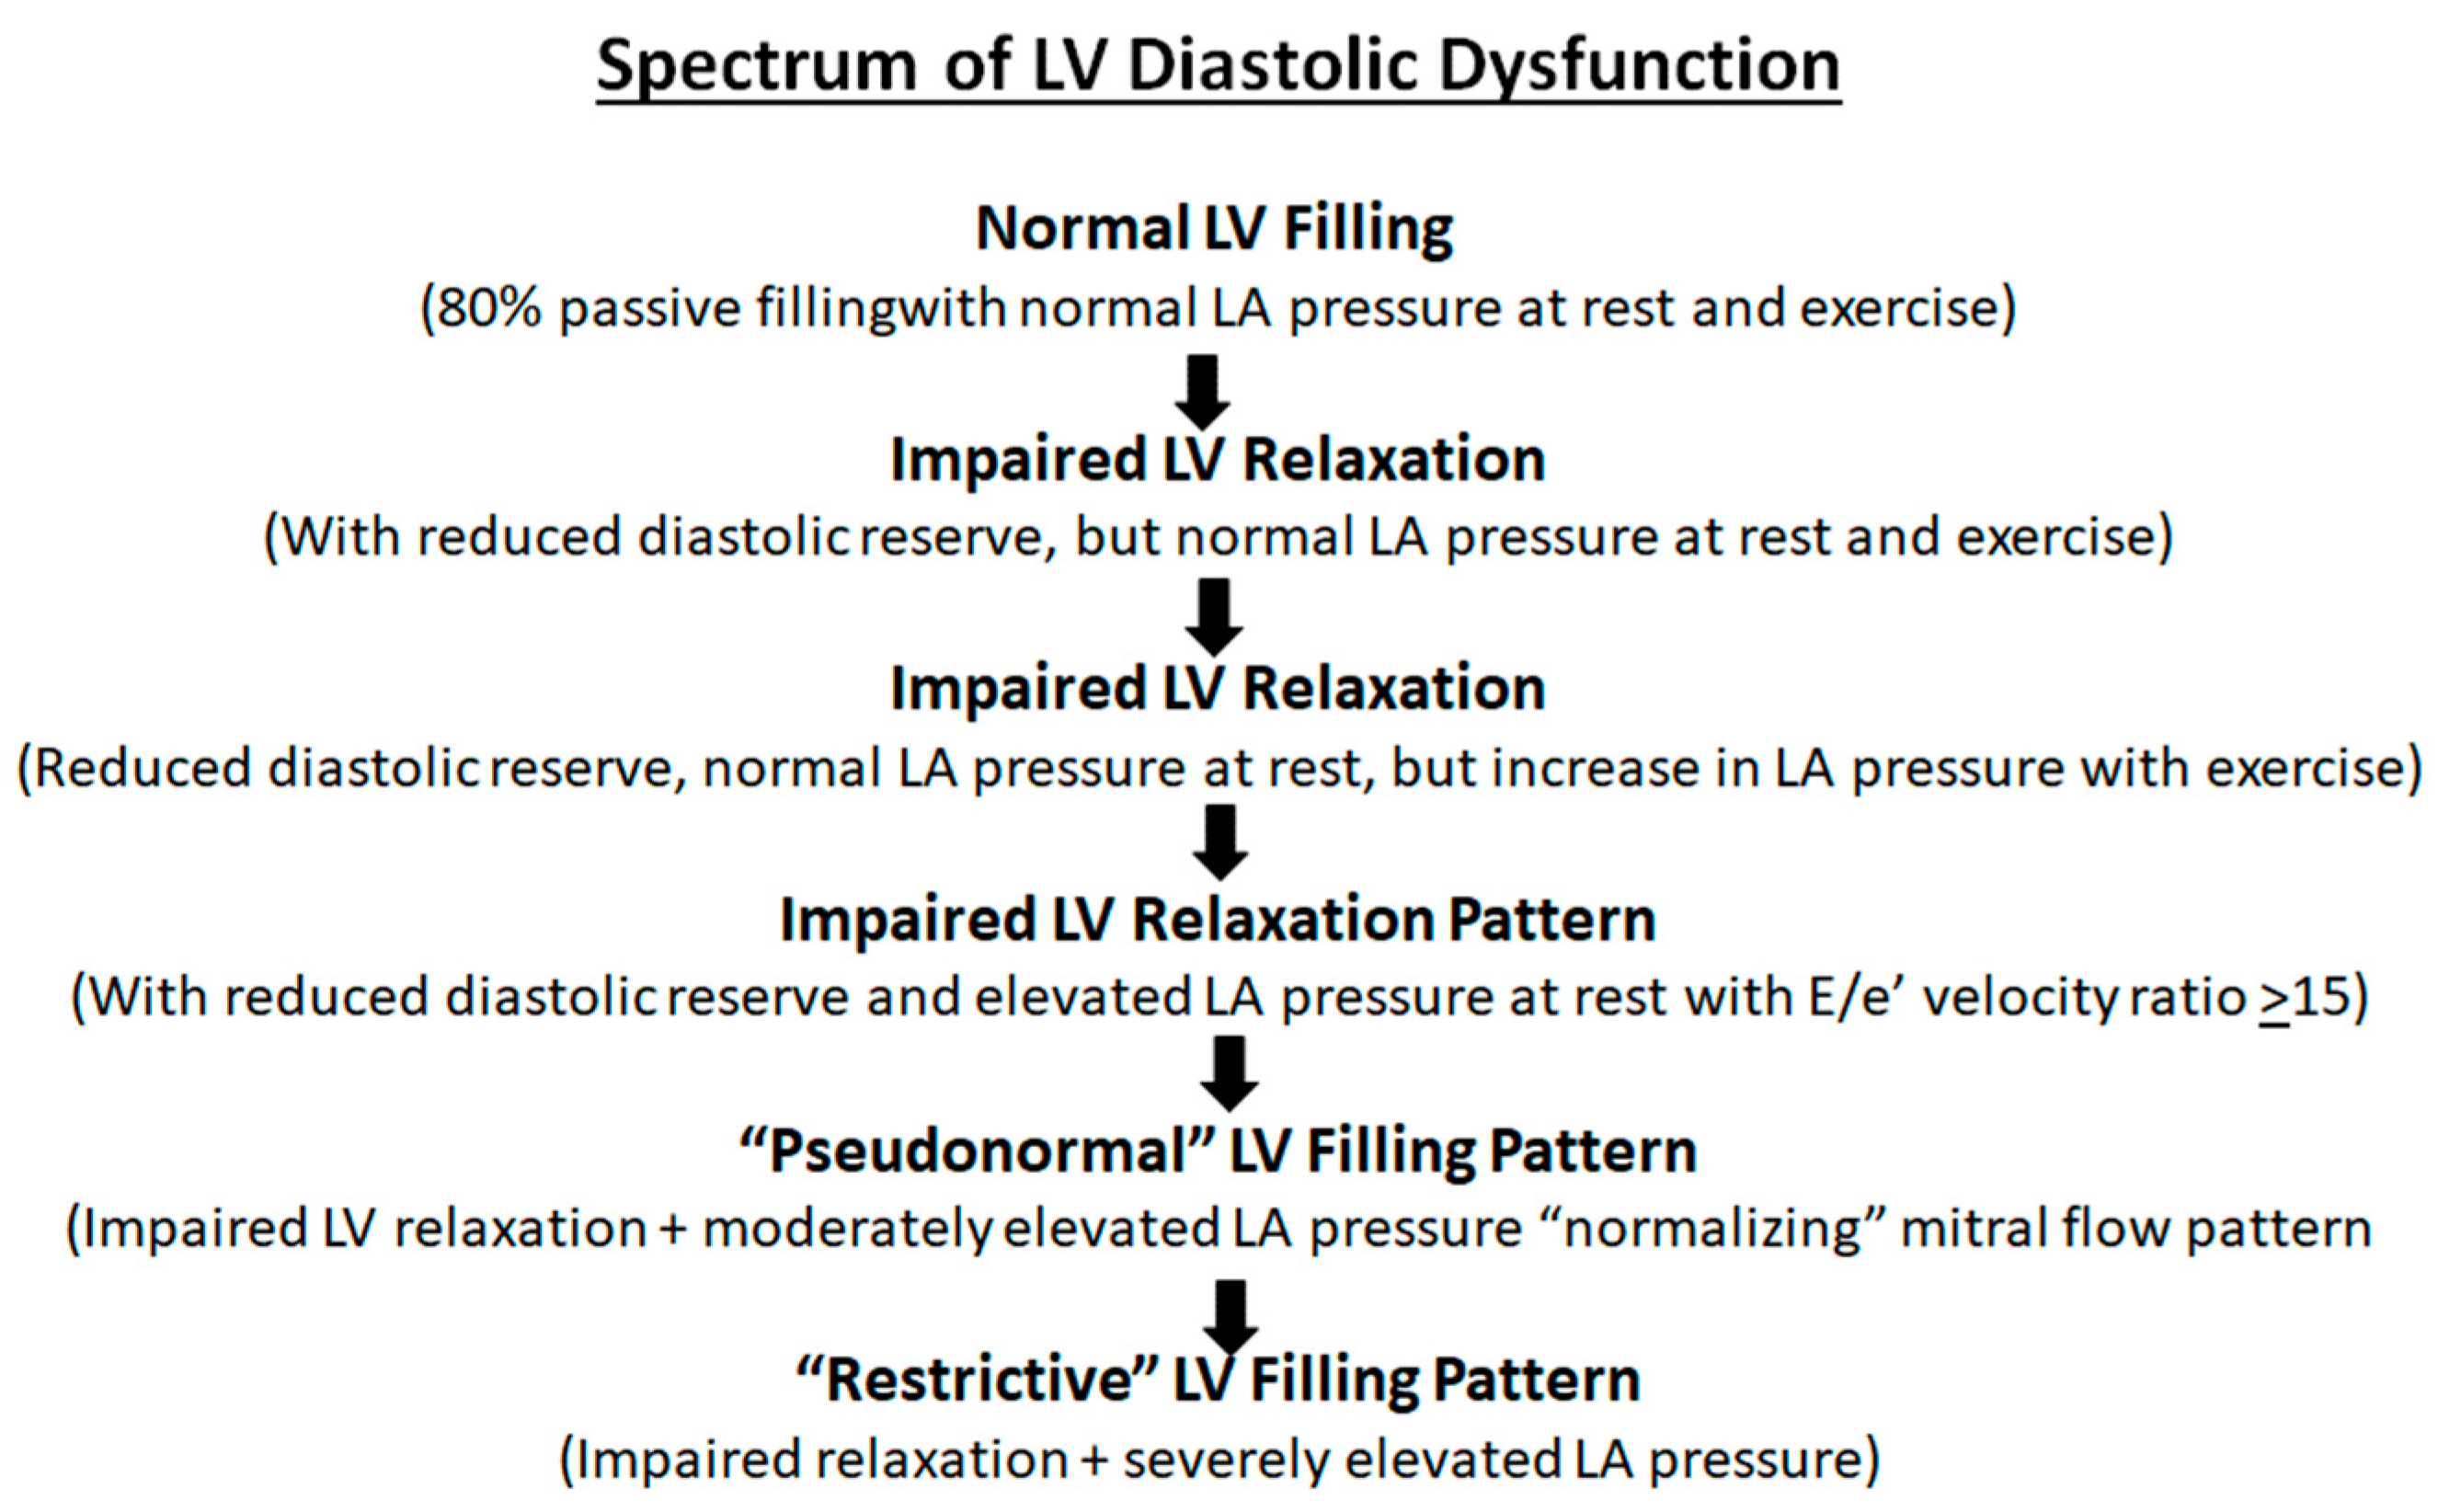
Figure 3.
Spectrum of left ventricular (LV) diastolic dysfunction: proposed progression from normal diastolic function to progressive impairment of LV relaxation and compliance with clinical worsening at each stage. LA = Left atrium.
Figure 3.
Spectrum of left ventricular (LV) diastolic dysfunction: proposed progression from normal diastolic function to progressive impairment of LV relaxation and compliance with clinical worsening at each stage. LA = Left atrium.
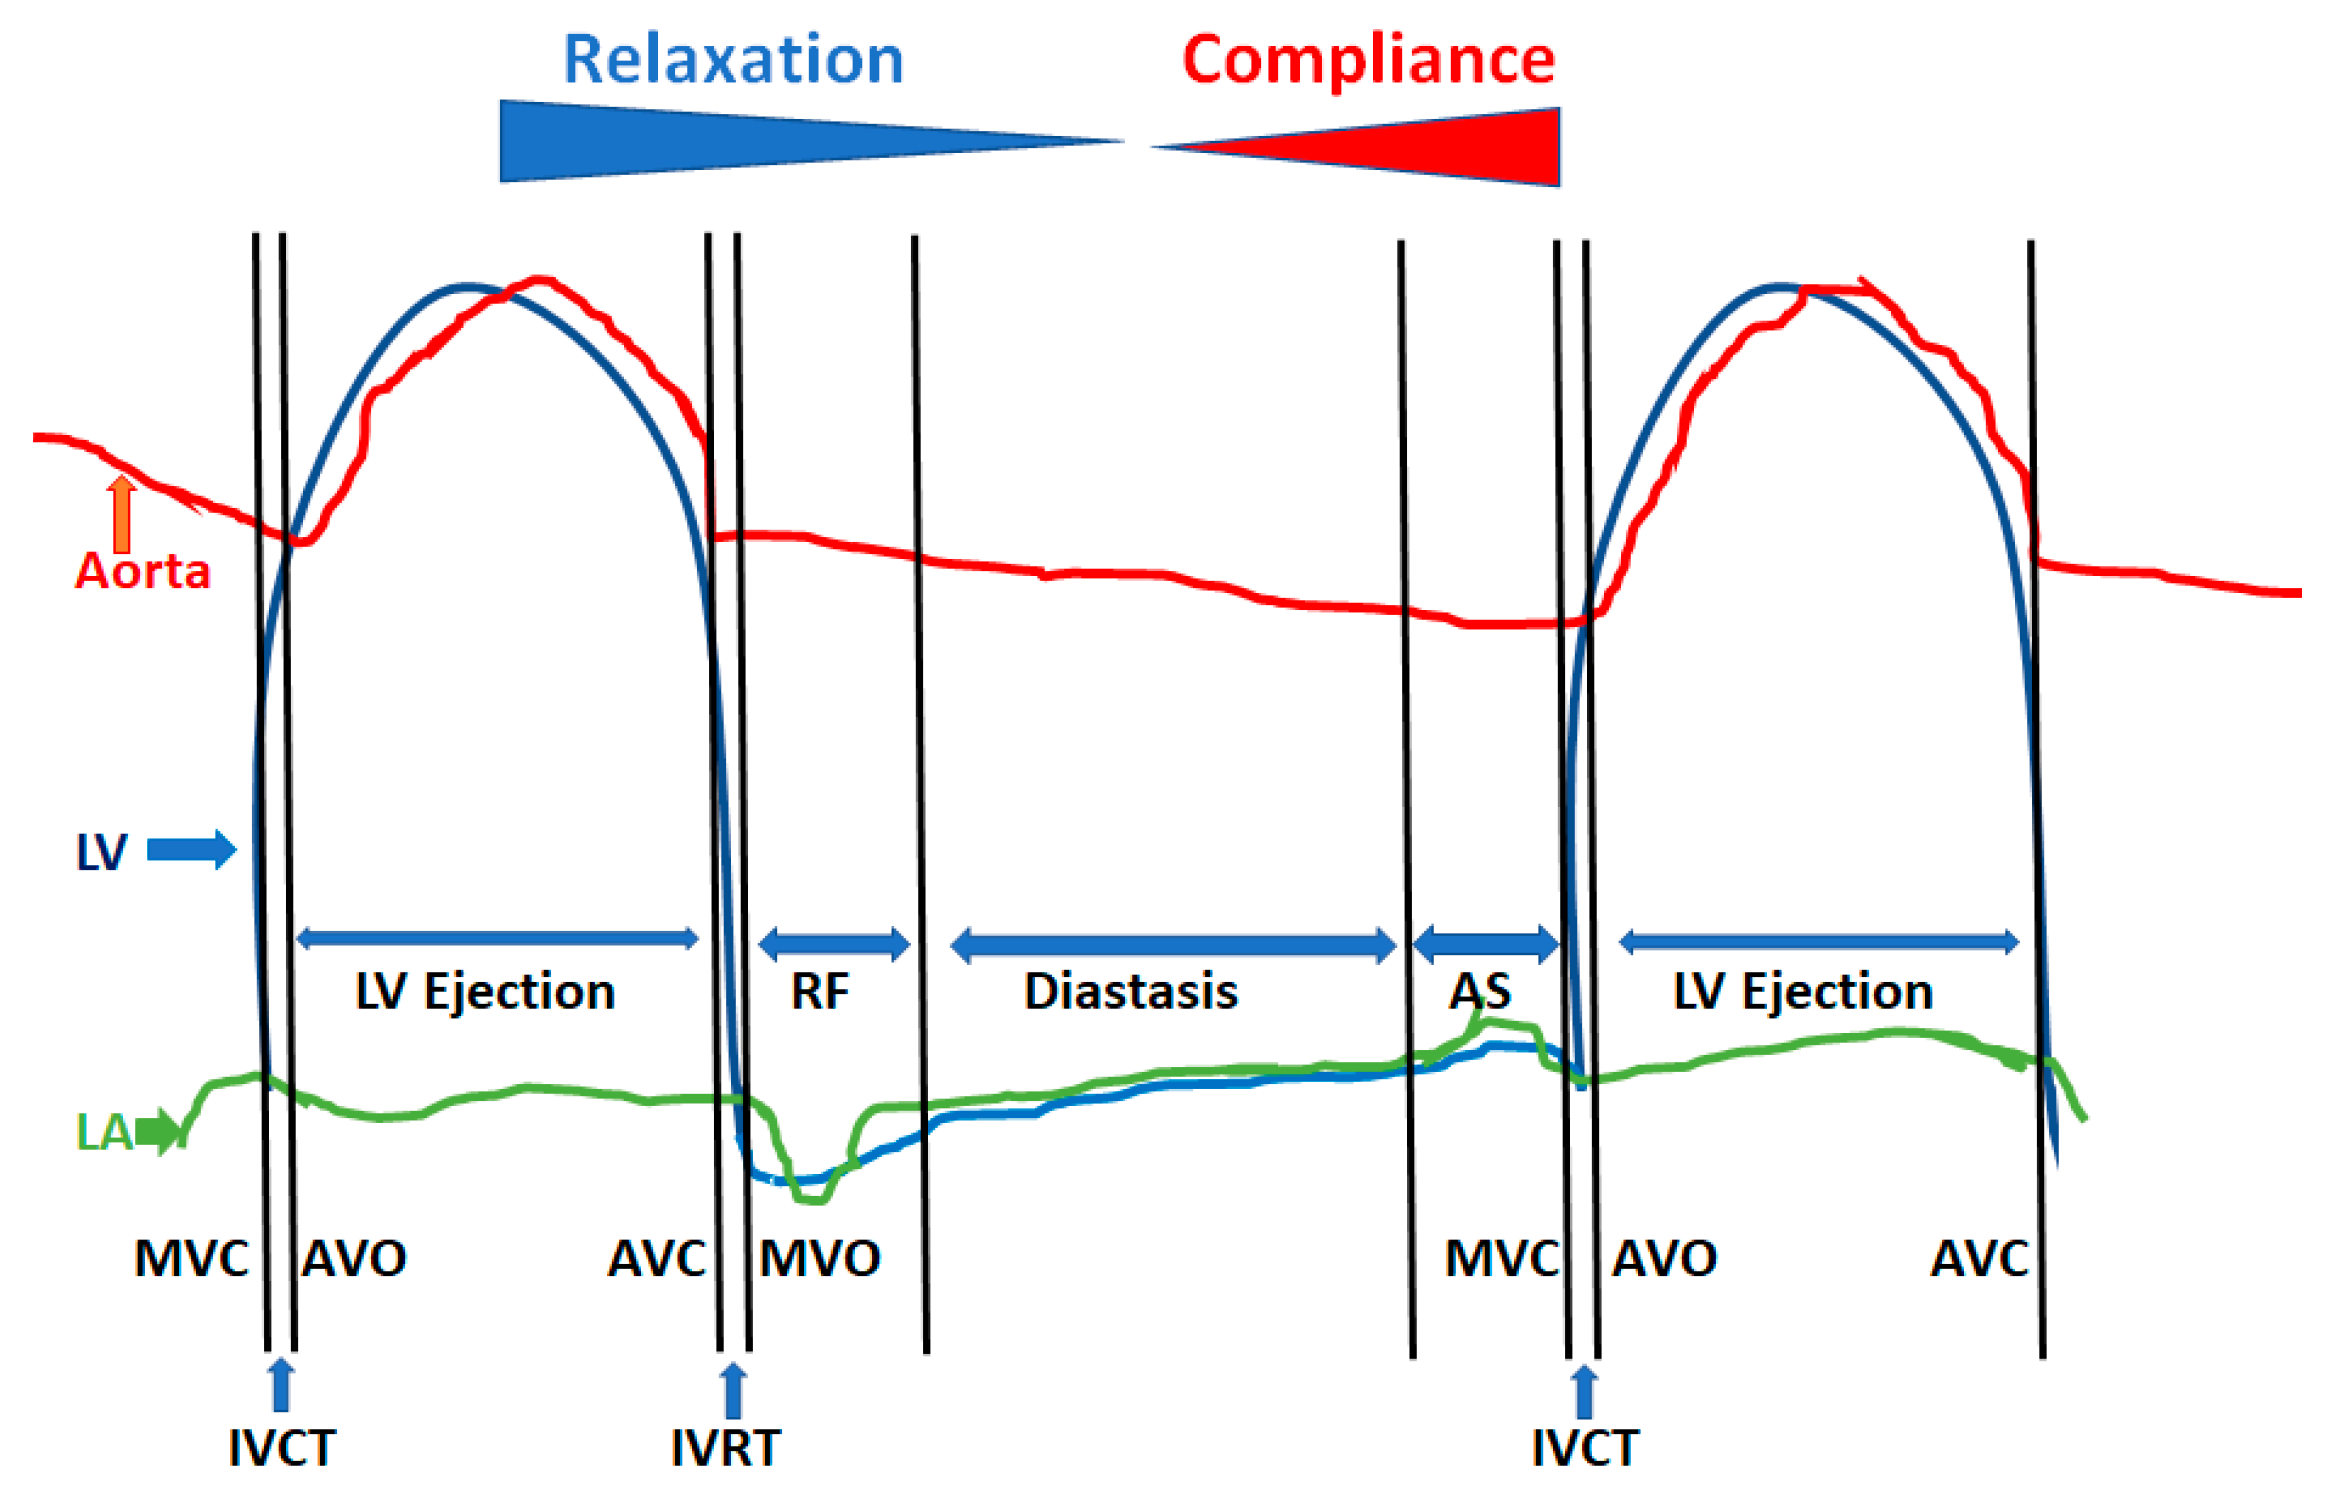
Figure 4.
Phases of diastole and their determinants. The 4 phases of diastole are shown: left ventricular (LV) isovolumic relaxation phase and time (IVRT), which starts with aortic valve closure (AVC) or A2 and extends to mitral valve opening (MVO); phase of rapid filling (RF), which is the early passive filling of the LV marked by the mitral E wave and is heavily dependent upon LV relaxation and recoil; diastasis, where less than 5% of LV filling normally occurs and is the phase of diastolic reserve that is used up at faster heart rates; and atrial systole (AS), which is the booster pump to achieve maximal LV filling in the end-diastole volume without having a need to increase the left atrial (LA) pressure throughout diastole. The latter part of diastole is dependent on the LV compliance and atrial systolic function. AVO = Aortic valve opening; IVCT = LV isovolumic contraction time; MVC = Mitral valve closure.
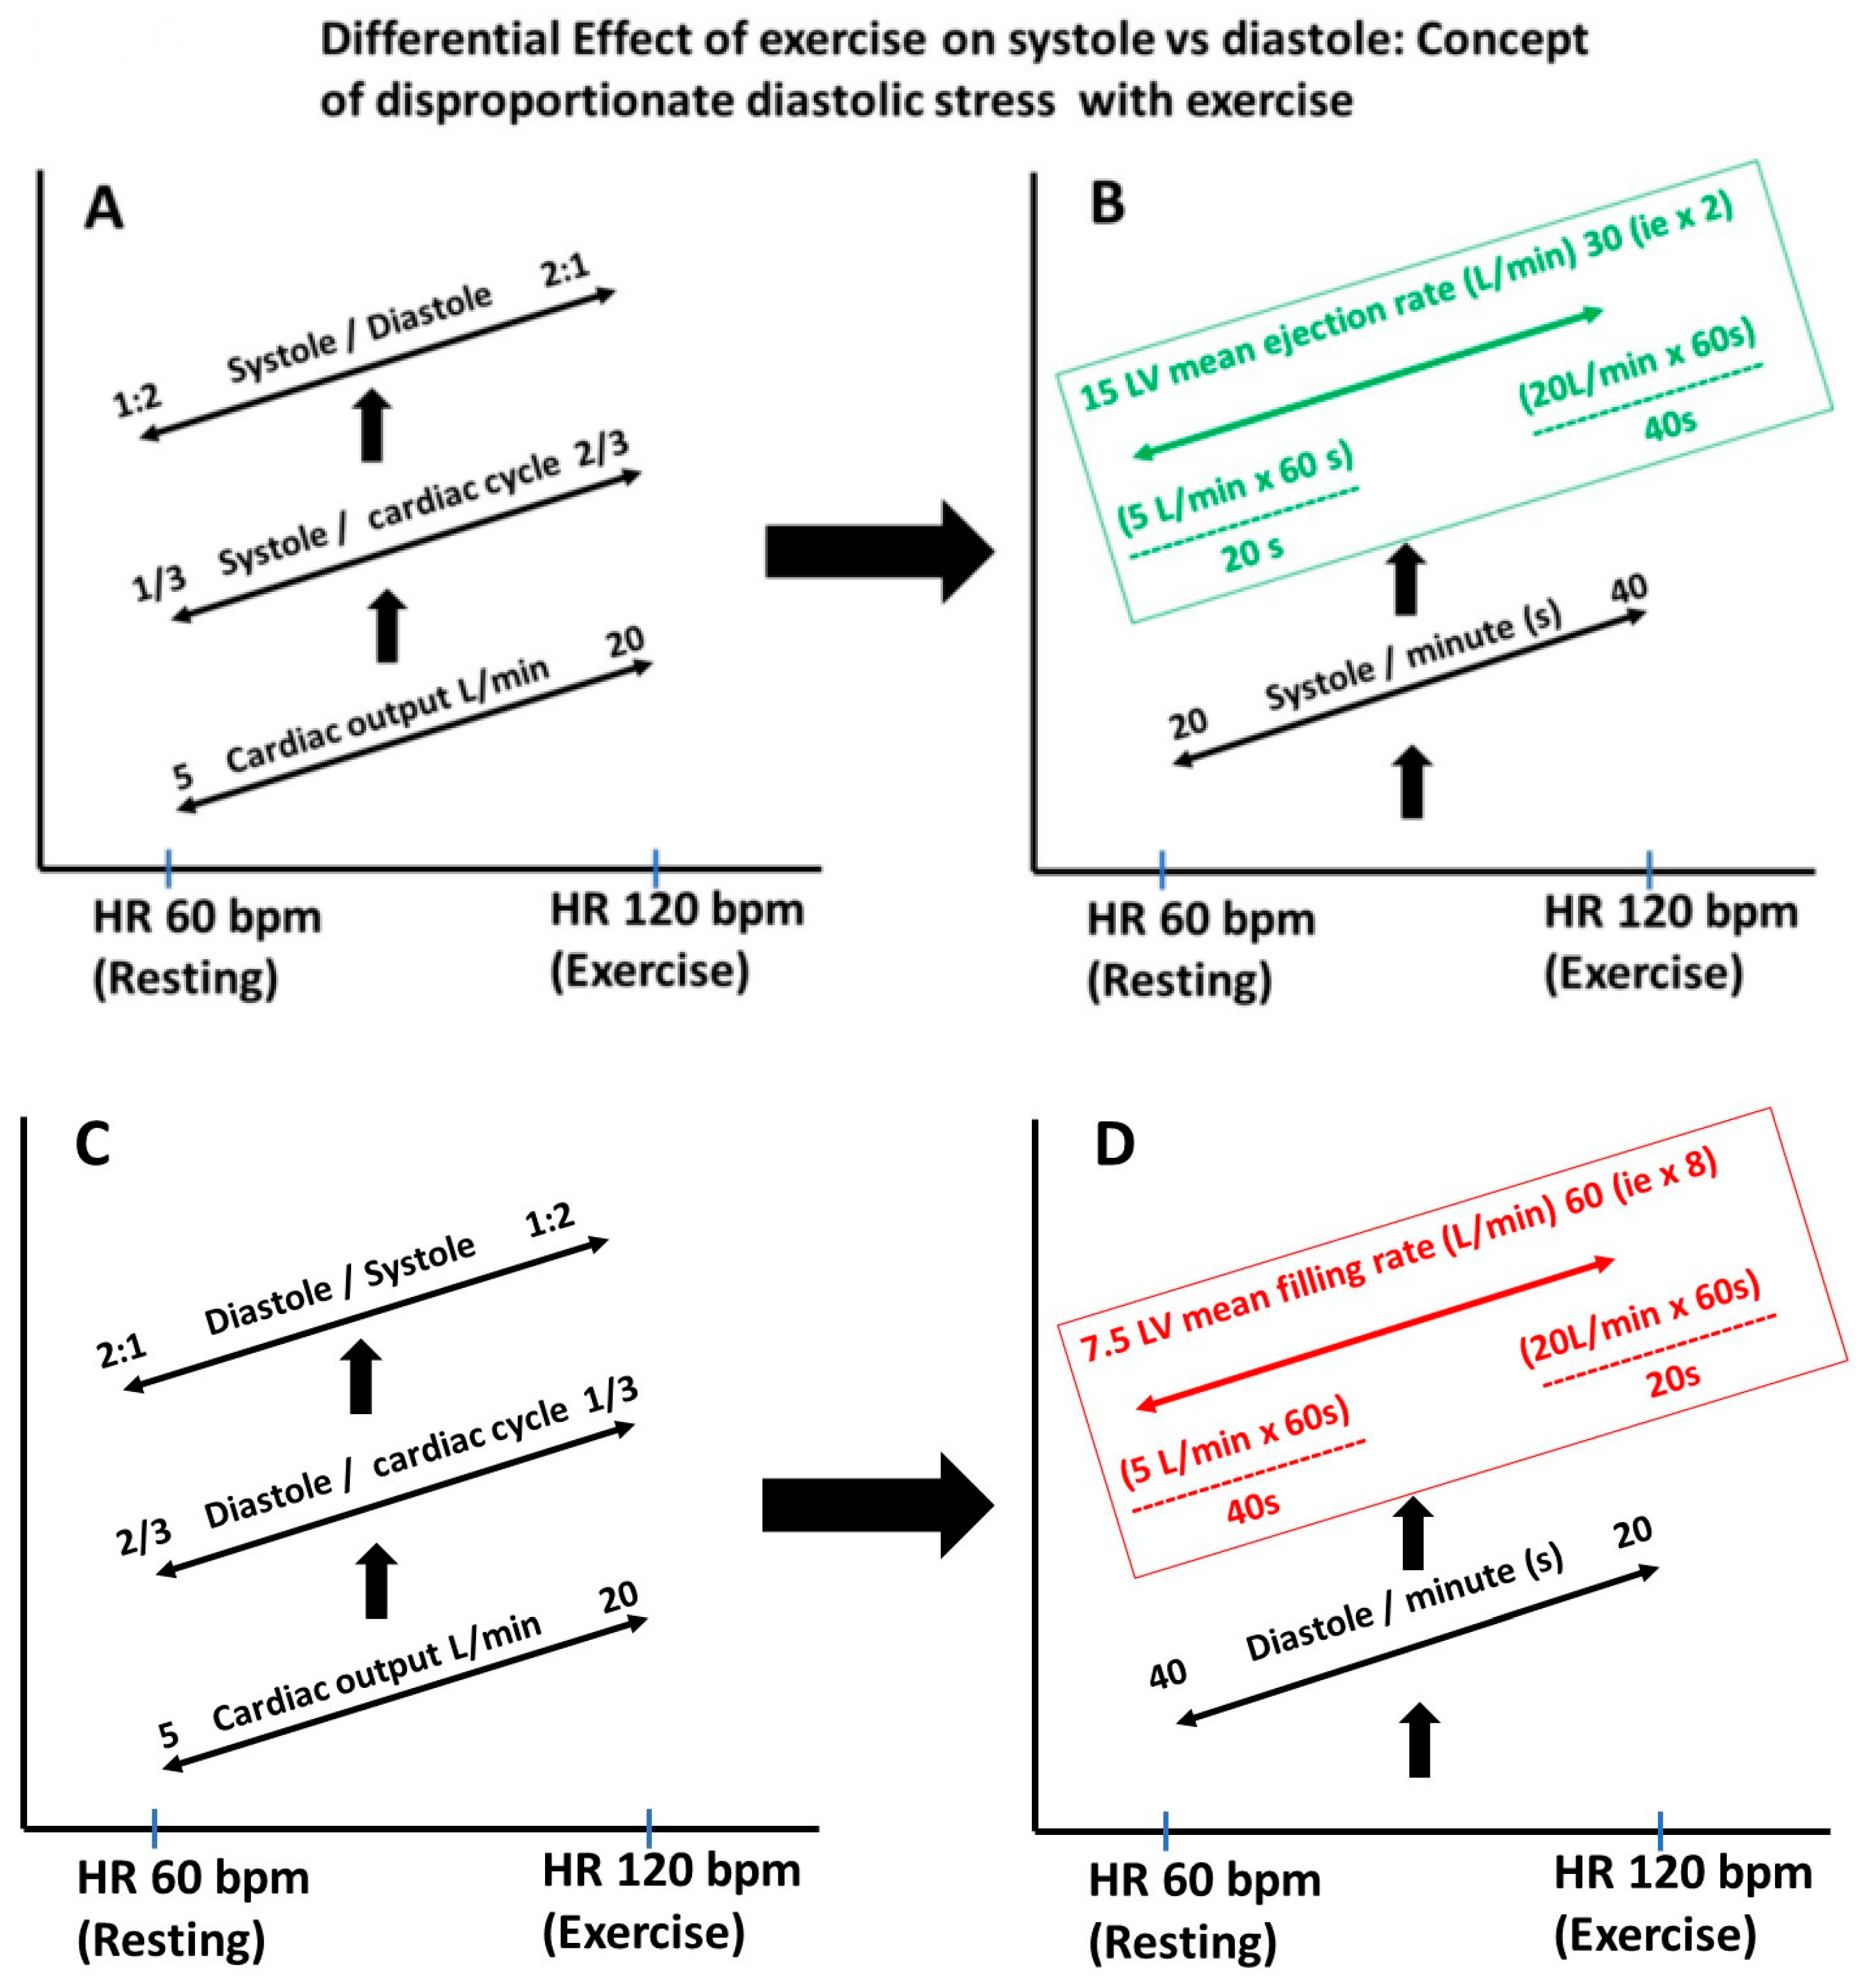
Figure 5.
(A–D) Differential stress on diastole vs. systole when the heart rate is increased. During exercise, the cardiac output increases as a result of the increase in the heart rate (HR) and stroke volume. In this example, the resting HR of 60 bpm and cardiac output of 5 L/min increased to 120 bpm and 20 L/min, respectively. At rest, diastole occupies about 2/3 of the cardiac cycle, and with exercise, only 1/3 of the cardiac cycle, placing disproportionate stress on LV filling and requiring a higher filling rate than the LV ejection rate. In this example, the ejection rate just had to double, but the mean filling rate had to increase by 8 folds, stressing the need for diastolic efficiency and why even early LV disease will manifest because of LV dysfunction.
Figure 6.
Measurement of Tau: Tau is a mathematical description of the rate of LV pressure decay after aortic valve closure or peak negative dP/dt. Various methods of computing it are listed in the figure, but the monoexponential method is the standard one. It has to be kept in mind that the pressure tracings should be of a high quality, with a high-frequency response system, and this is typically obtained by micromanometer tipped catheters, which have a frequency response of 200 Hz.
Figure 7.
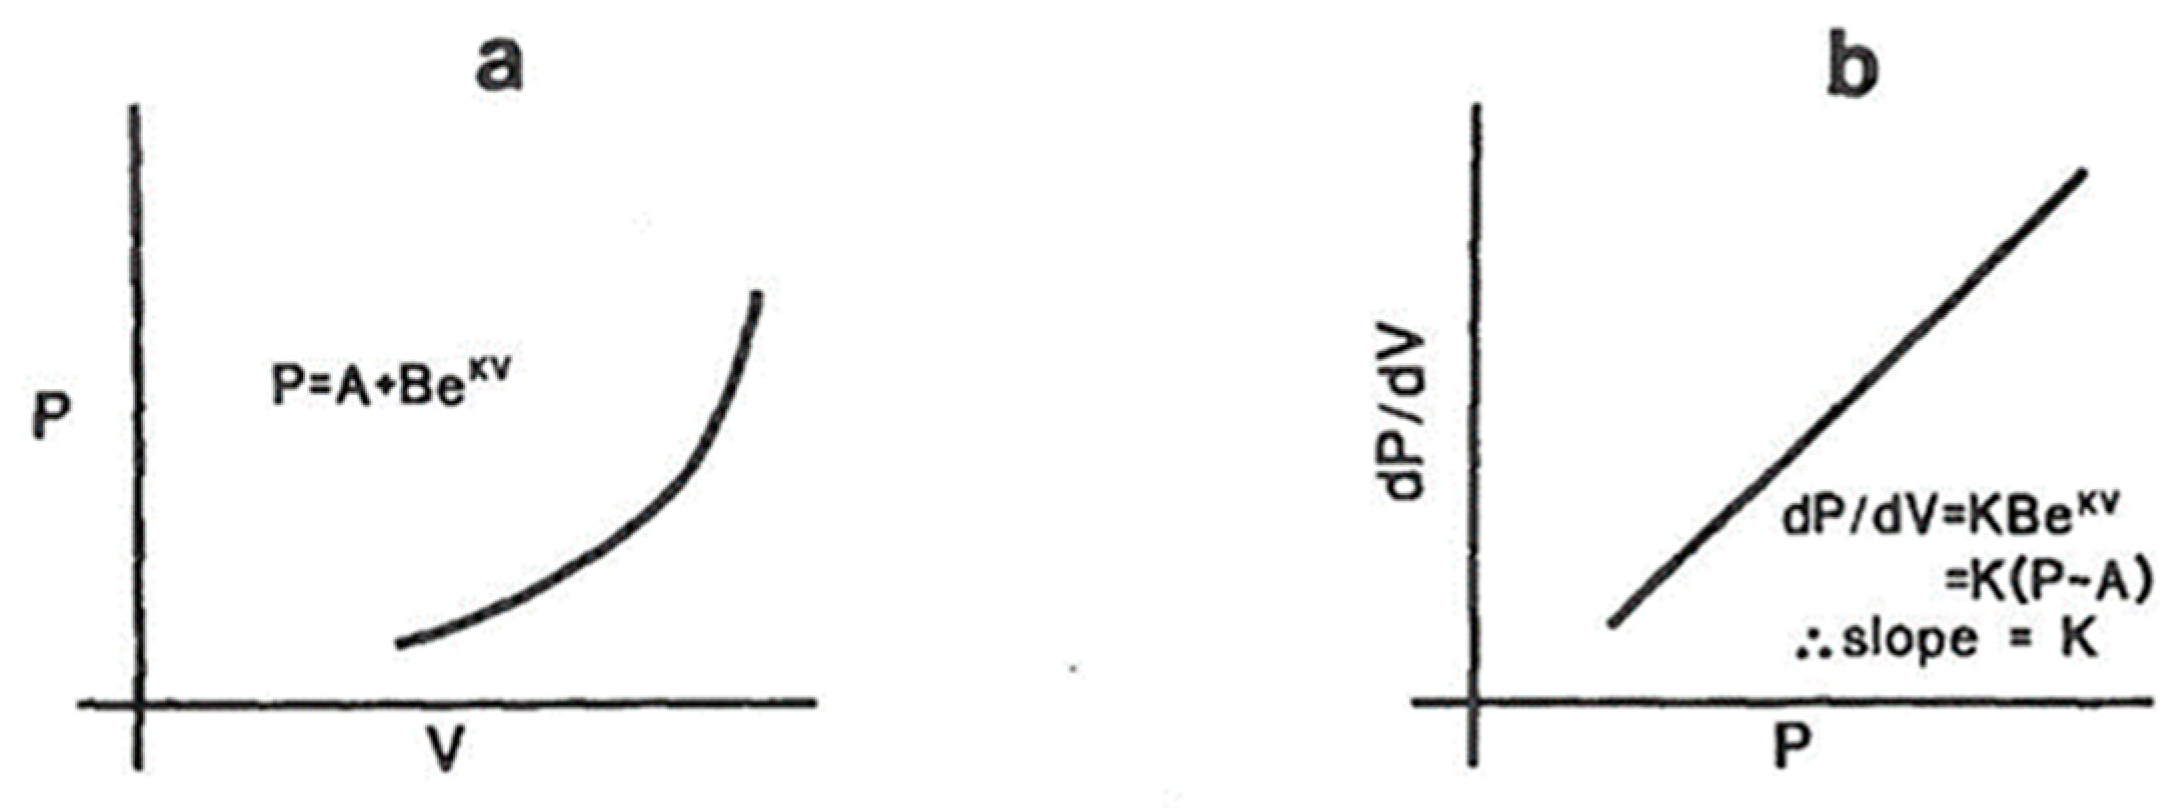
Measurement of LV compliance. (a) As the LV fills passively in the latter stage of diastole, the rate of the pressure rise depends on the degree of filling; hence, instantaneous compliance is volume-dependent. The pressure (P)–volume (V) relationship is exponential, as shown in (a). A and B are constants and K is referred to as the modulus of LV chamber stiffness. K is a number that is volume-independent and fundamentally describes the viscoelastic properties of the LV. To obtain this, you need a simultaneous recording of the LV diastolic pressures with a micromanometer tipped catheter (not fluid-filled, which has a frequency response <10 Hz) and LV volumes by contrast angiography at 60 fps or obtained by conductance catheter coupled with the micromanometer pressure tip. (b) As the instantaneous rate of the pressure rise (dP/dV) depends on the instantaneous volume and/or pressure, mathematics from (a) shows that the relationship between diastolic dP/dV and P is linear and the slope of this linear equation is the modulus of chamber stiffness, K.
Figure 7.
Measurement of LV compliance. (a) As the LV fills passively in the latter stage of diastole, the rate of the pressure rise depends on the degree of filling; hence, instantaneous compliance is volume-dependent. The pressure (P)–volume (V) relationship is exponential, as shown in (a). A and B are constants and K is referred to as the modulus of LV chamber stiffness. K is a number that is volume-independent and fundamentally describes the viscoelastic properties of the LV. To obtain this, you need a simultaneous recording of the LV diastolic pressures with a micromanometer tipped catheter (not fluid-filled, which has a frequency response <10 Hz) and LV volumes by contrast angiography at 60 fps or obtained by conductance catheter coupled with the micromanometer pressure tip. (b) As the instantaneous rate of the pressure rise (dP/dV) depends on the instantaneous volume and/or pressure, mathematics from (a) shows that the relationship between diastolic dP/dV and P is linear and the slope of this linear equation is the modulus of chamber stiffness, K.
![Jcm 13 03043 g007]()
Figure 8.
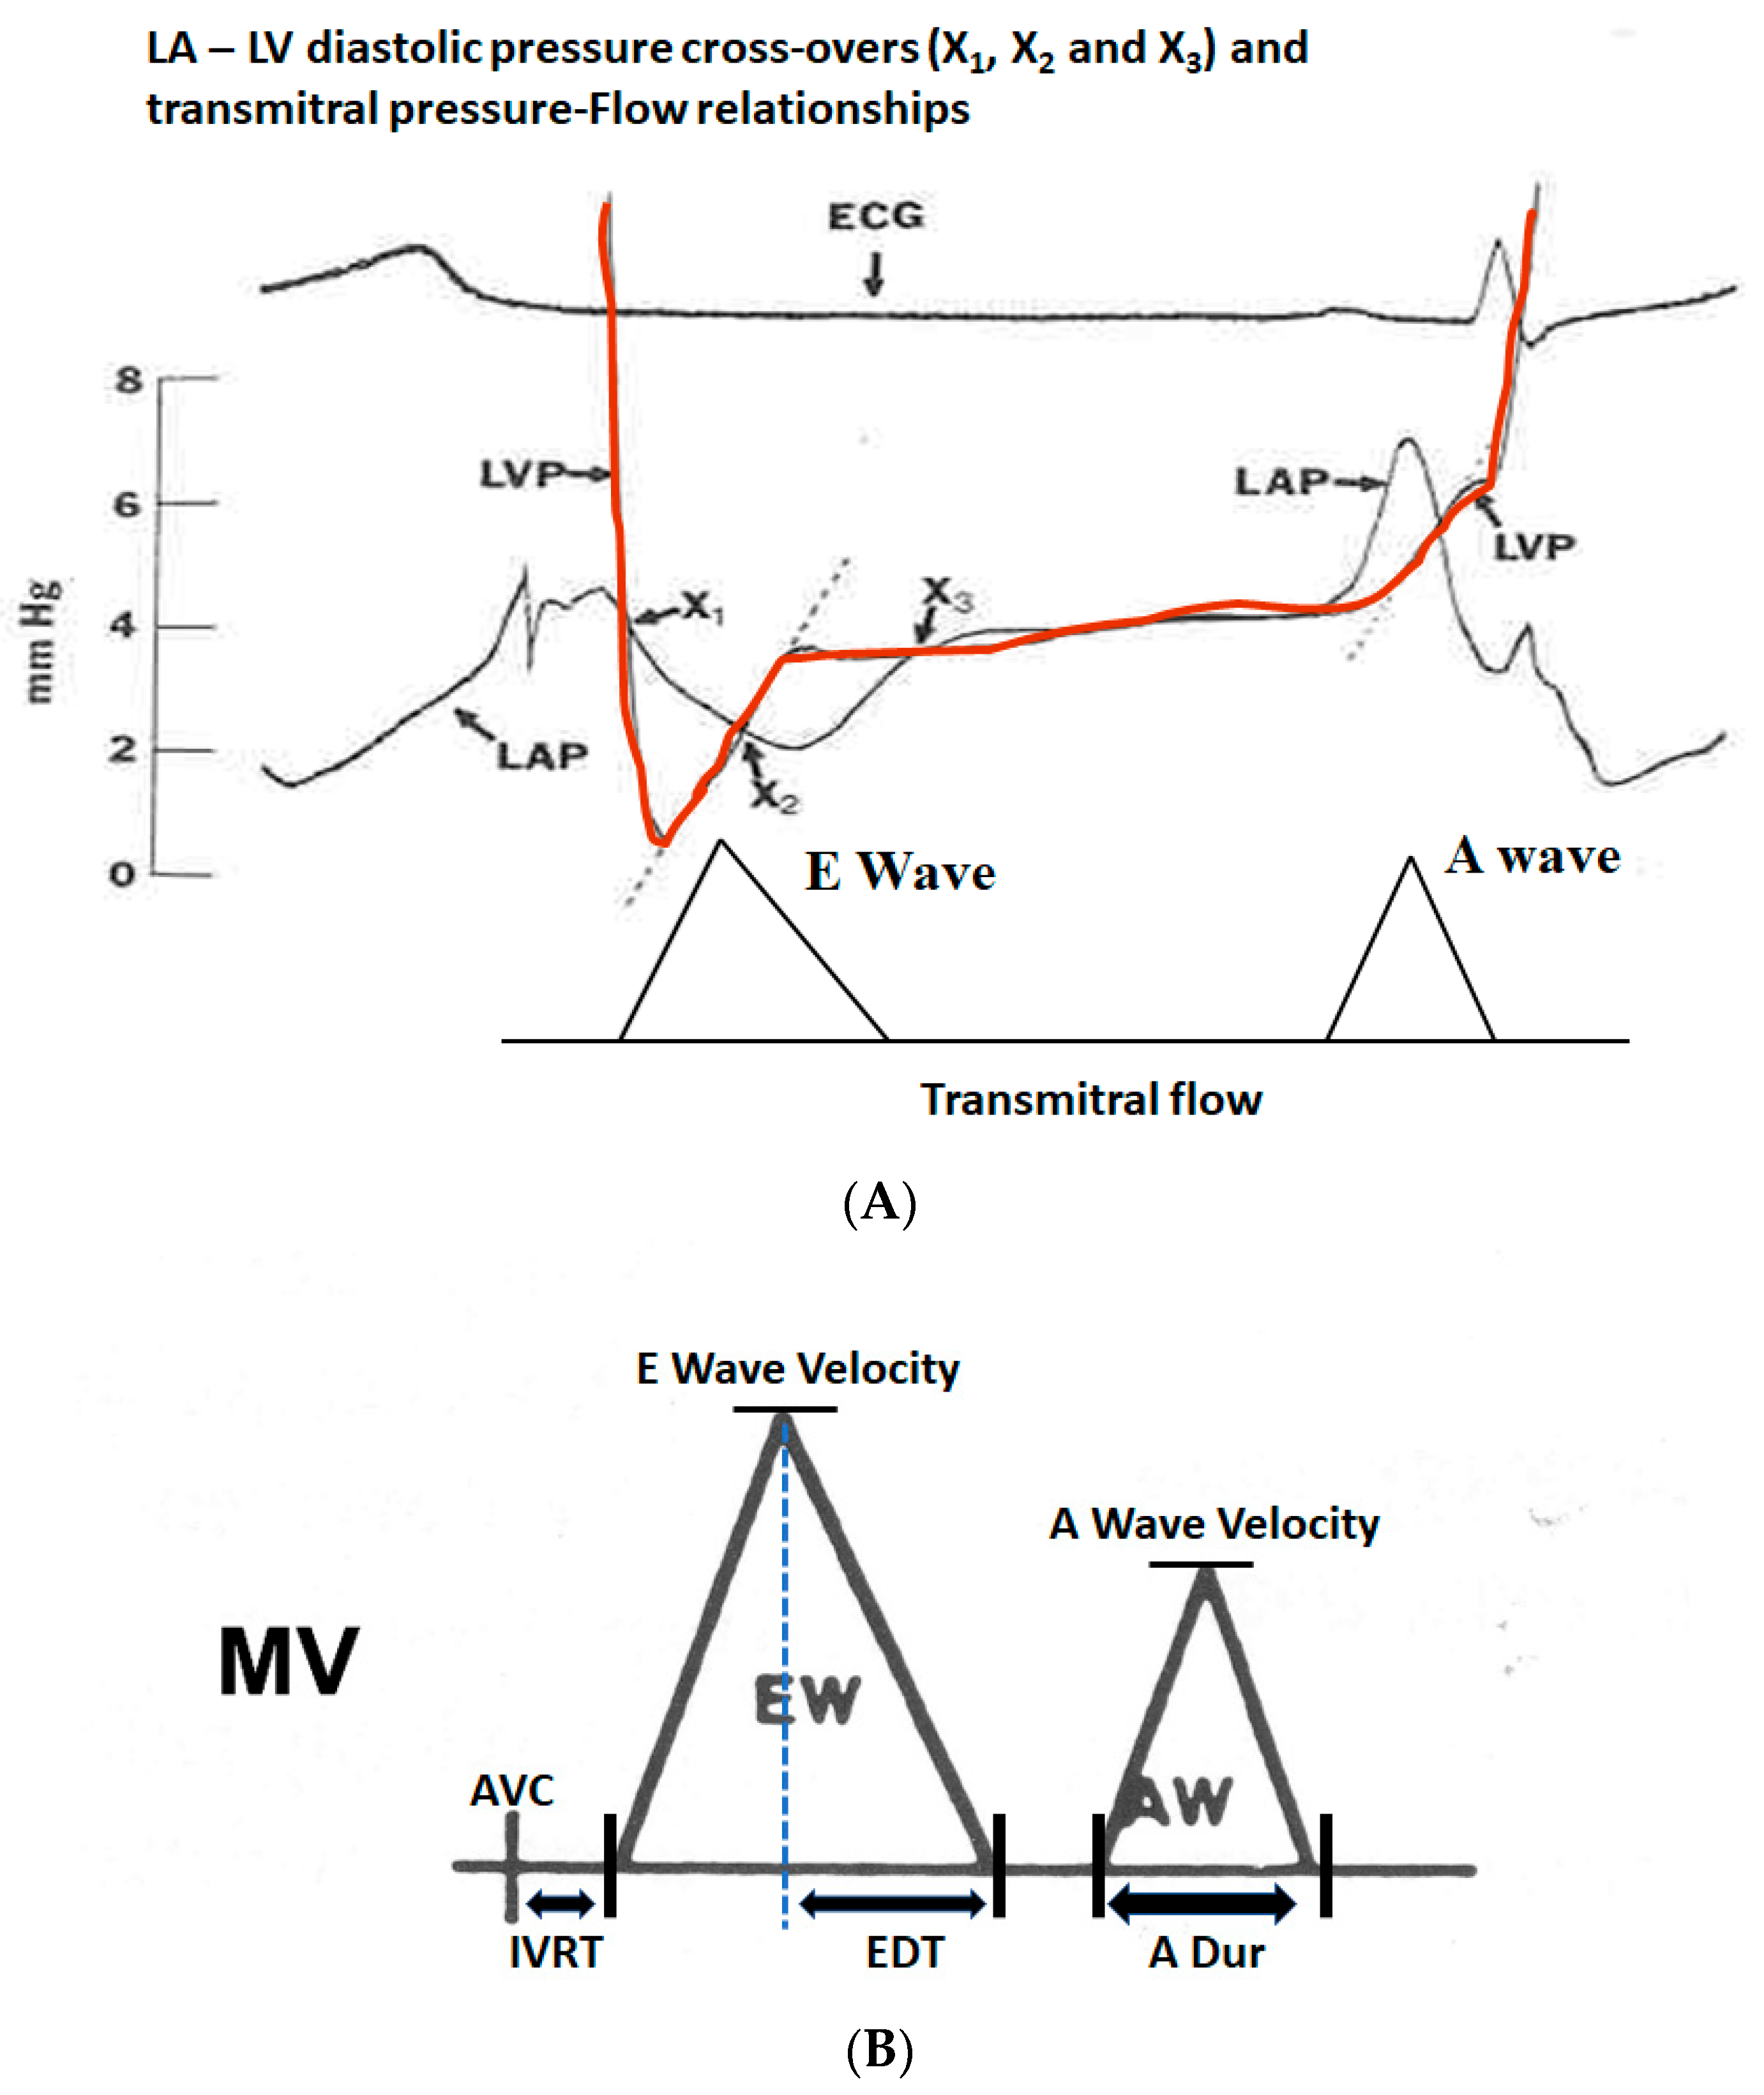
(A) Transmitral pressure–flow (P–F) relationships are poorly understood and the simplified Bernoulli equation does not apply in this situation as the pressure gradient is mainly used to accelerate the flow and the negative pressure gradient to decelerate the flow. When the LV pressure (red) drops below the LA pressure (black) at pressure cross-over X1, the transmitral flow starts and the gradient basically accelerates the transmitral flow. As the LV fills and the pressure in the LV equals that in the LA, X2 occurs when the pressure gradient is zero, but the E wave velocity is at the peak despite a zero pressure gradient. Between X2 and X3, the LV pressure is higher than that of LA and this negative gradient retards the mitral flow, resulting in its deceleration. It can be inferred from this P–F relationship that if the LV relaxation is slower, both the positive and negative gradients would be lower and the pressure cross-overs would be delayed, resulting in the slower acceleration of E wave, lower E wave amplitude and slower E wave deceleration, resulting in longer mitral E wave acceleration and deceleration times as well. On the other hand, higher LA pressure or very efficient LV relaxation as occurs in children would do just the opposite. (B) Schematic showing various measurements from the transmitral flow velocity profile by pulsed wave Doppler at the mitral leaflet tips: LV isovolumic relaxation time (IVRT) between the end of LV ejection or aortic valve closure (AVC) and the start of mitral inflow (typically 70–100 ms), mitral E wave velocity, E wave deceleration time (EDT, normally 160–250 ms), mitral A wave velocity and A wave duration (A dur, normally about 100 ms). The normal E/A velocity ratio in adults is typically between 1 and 1.5. In children, it can be >10, resulting physiological S3, and in elderly < 1, resulting in physiological S4. MV = Mitral valve flow.
Figure 8.
(A) Transmitral pressure–flow (P–F) relationships are poorly understood and the simplified Bernoulli equation does not apply in this situation as the pressure gradient is mainly used to accelerate the flow and the negative pressure gradient to decelerate the flow. When the LV pressure (red) drops below the LA pressure (black) at pressure cross-over X1, the transmitral flow starts and the gradient basically accelerates the transmitral flow. As the LV fills and the pressure in the LV equals that in the LA, X2 occurs when the pressure gradient is zero, but the E wave velocity is at the peak despite a zero pressure gradient. Between X2 and X3, the LV pressure is higher than that of LA and this negative gradient retards the mitral flow, resulting in its deceleration. It can be inferred from this P–F relationship that if the LV relaxation is slower, both the positive and negative gradients would be lower and the pressure cross-overs would be delayed, resulting in the slower acceleration of E wave, lower E wave amplitude and slower E wave deceleration, resulting in longer mitral E wave acceleration and deceleration times as well. On the other hand, higher LA pressure or very efficient LV relaxation as occurs in children would do just the opposite. (B) Schematic showing various measurements from the transmitral flow velocity profile by pulsed wave Doppler at the mitral leaflet tips: LV isovolumic relaxation time (IVRT) between the end of LV ejection or aortic valve closure (AVC) and the start of mitral inflow (typically 70–100 ms), mitral E wave velocity, E wave deceleration time (EDT, normally 160–250 ms), mitral A wave velocity and A wave duration (A dur, normally about 100 ms). The normal E/A velocity ratio in adults is typically between 1 and 1.5. In children, it can be >10, resulting physiological S3, and in elderly < 1, resulting in physiological S4. MV = Mitral valve flow.
![Jcm 13 03043 g008]()
Figure 9.
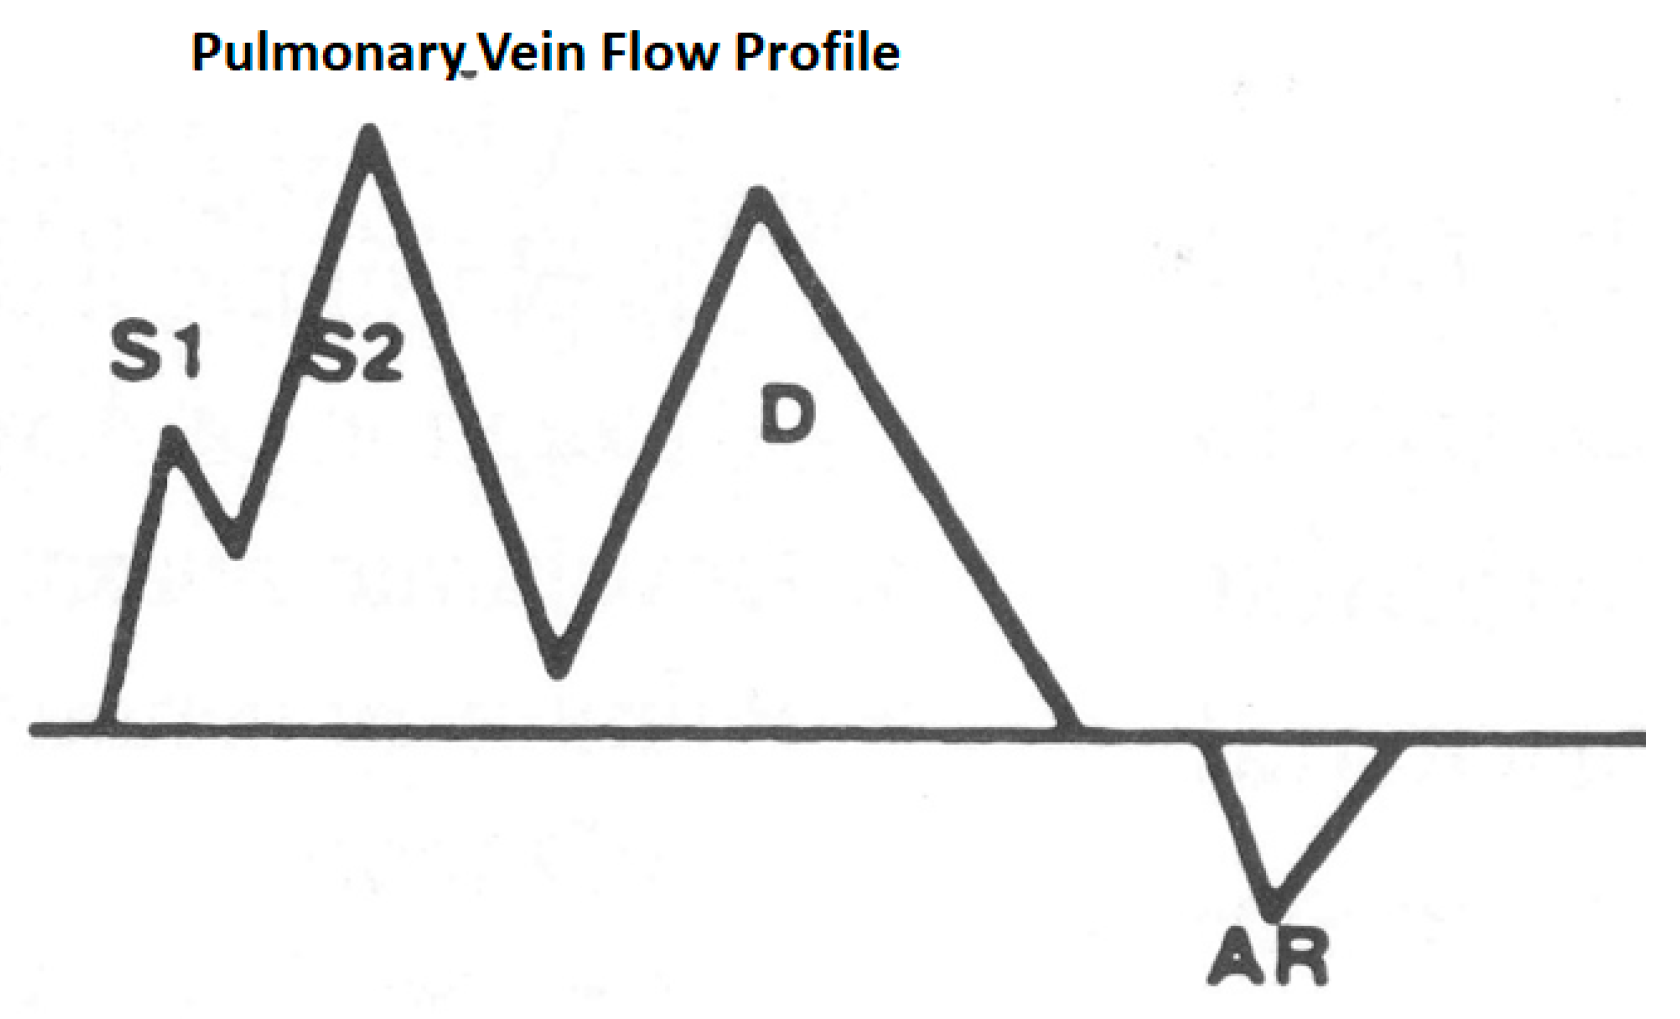
Schematic of pulmonary vein flow: S1 is a systolic wave produced because of left atrial relaxation causing a suction force, S2 is a systolic wave because of mitral annular descent stretching the left atrium and also right ventricular ejection transmitted through a low resistance, short pulmonary circulation D wave because of left atrial emptying when the mitral valve opens and the AR wave, which is a reflux into the pulmonary vein because of left arial contraction. Generally, the S waves are taller than the D waves, the transitions are smooth and the AR wave duration is a measure of the duration of left atrial systole, which is normally about 100 ms.
Figure 9.
Schematic of pulmonary vein flow: S1 is a systolic wave produced because of left atrial relaxation causing a suction force, S2 is a systolic wave because of mitral annular descent stretching the left atrium and also right ventricular ejection transmitted through a low resistance, short pulmonary circulation D wave because of left atrial emptying when the mitral valve opens and the AR wave, which is a reflux into the pulmonary vein because of left arial contraction. Generally, the S waves are taller than the D waves, the transitions are smooth and the AR wave duration is a measure of the duration of left atrial systole, which is normally about 100 ms.
Figure 10.
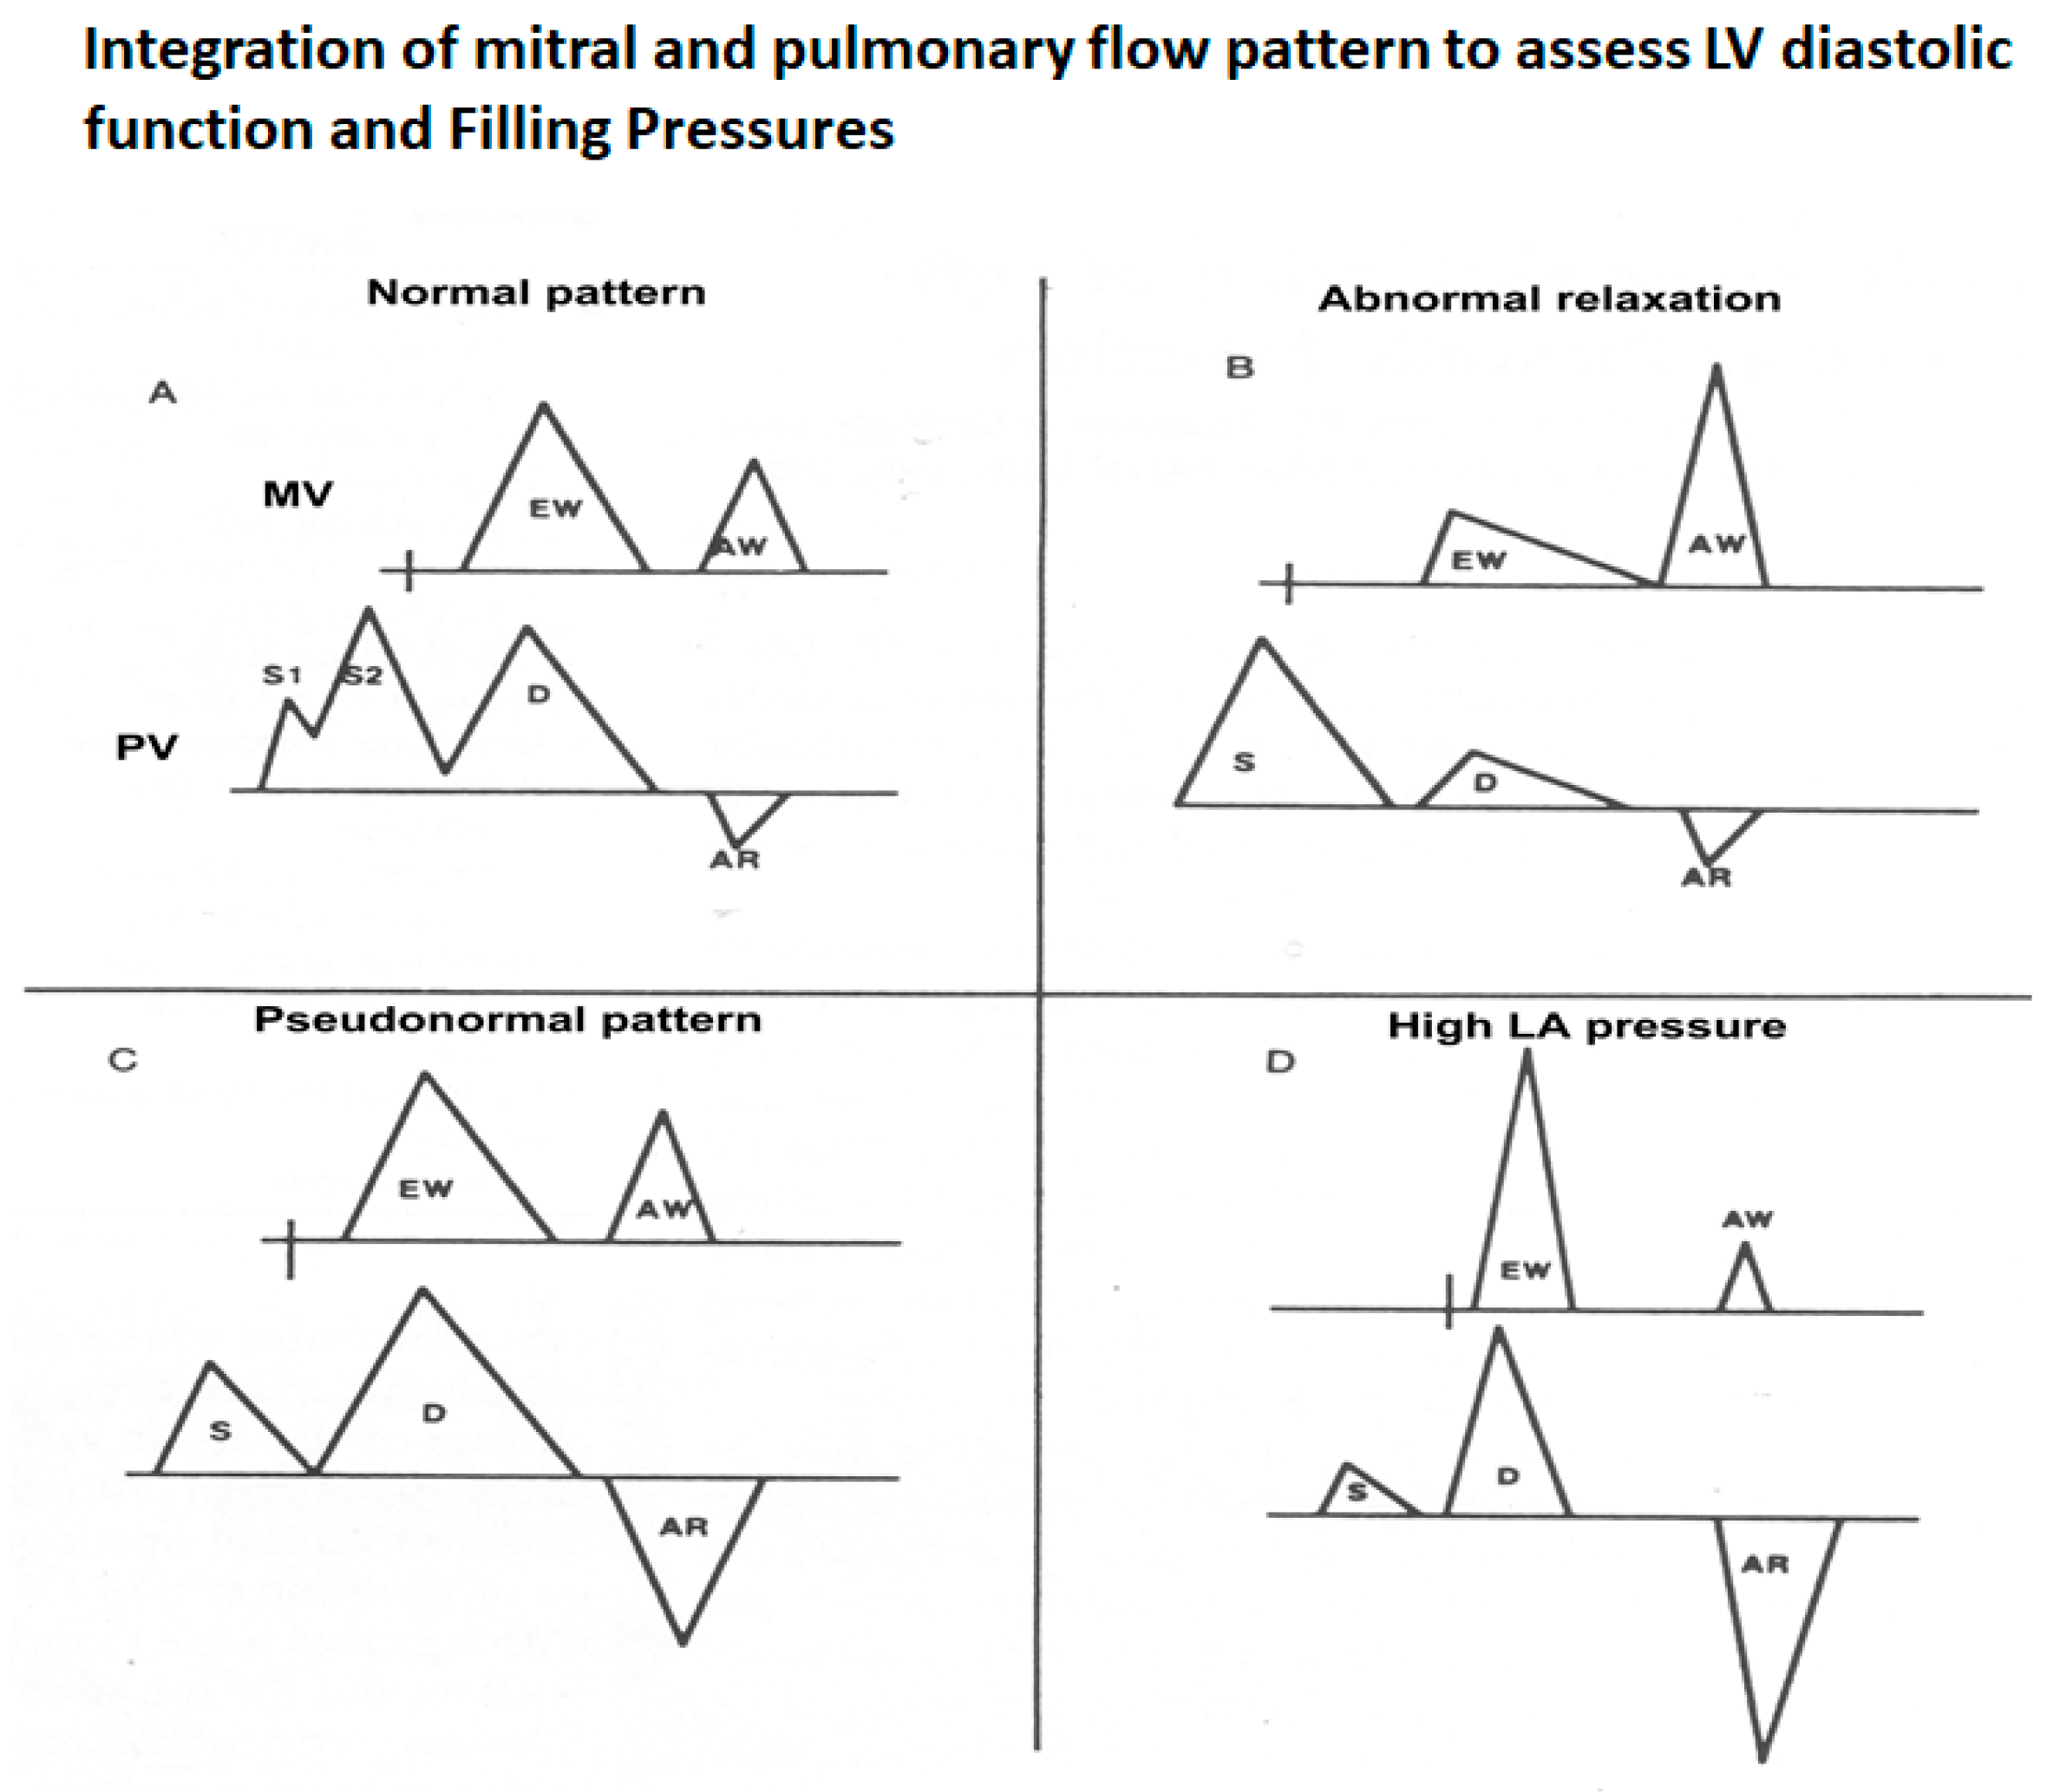
Schematic that shows how to interpret the mitral and pulmonary vein flows as a unit. (A) Normal pattern–IVRT 70–100 ms, E/A velocity ratio 1.0 to 1.5, E wave deceleration time 160–250 ms, S wave higher than D wave and AR wave duration same or less than that of the A wave duration. (B) Pattern of abnormal LV relaxation–IVRT >100 ms, E/A ratio <1, E wave deceleration time >250 ms and more prominent S wave because of the diminutive D wave secondary to the smaller E wave. (C) Pseudonormal pattern that is a combination of impaired LV relaxation and elevated left atrial pressure—these two work in opposite directions to normalize the mitral flow. But the clue is changes in pulmonary vein flow—mainly, the AR wave duration, which will be greater than the mitral A wave duration by >30 ms, indicating longer atrial systole, a marker of elevated LV end-diastolic pressure. Reduced LA compliance may also reduce the S wave amplitude. (D) Severely elevated LA pressure characterized by short IVRT (<70 ms), E/A velocity ration >2, E wave deceleration time <150 ms, S wave shorter than D, D wave deceleration time <170 ms and exaggerated AR wave duration and amplitude.
Figure 10.
Schematic that shows how to interpret the mitral and pulmonary vein flows as a unit. (A) Normal pattern–IVRT 70–100 ms, E/A velocity ratio 1.0 to 1.5, E wave deceleration time 160–250 ms, S wave higher than D wave and AR wave duration same or less than that of the A wave duration. (B) Pattern of abnormal LV relaxation–IVRT >100 ms, E/A ratio <1, E wave deceleration time >250 ms and more prominent S wave because of the diminutive D wave secondary to the smaller E wave. (C) Pseudonormal pattern that is a combination of impaired LV relaxation and elevated left atrial pressure—these two work in opposite directions to normalize the mitral flow. But the clue is changes in pulmonary vein flow—mainly, the AR wave duration, which will be greater than the mitral A wave duration by >30 ms, indicating longer atrial systole, a marker of elevated LV end-diastolic pressure. Reduced LA compliance may also reduce the S wave amplitude. (D) Severely elevated LA pressure characterized by short IVRT (<70 ms), E/A velocity ration >2, E wave deceleration time <150 ms, S wave shorter than D, D wave deceleration time <170 ms and exaggerated AR wave duration and amplitude.
![Jcm 13 03043 g010]()
Figure 11.
Components of mitral annular velocities obtained by Doppler tissue imaging from the LV apical view. The Sm wave is produced by the mitral annular descent, resulting in this apically directed velocity, the Em or E’ early diastolic velocity, which is produced by mitral annular ascent because of LV relaxation and is a good index of rate of LV relaxation and the Am or A’ velocity because of atrial contraction causing further annular ascent. The E’ velocity varies by the mitral annular quadrant and is generally >8 cm/s for the medial mitral annulus and >10 cm/s for the lateral annulus. Impaired LV relaxation causes a reduction in these velocities. Regional abnormalities will affect these regionally. In constrictive pericarditis, where the lateral LV wall is tethered to the pericardium, the lateral annular E’ velocity will be lower than the medial E’ velocity as the medial annulus compensates for the restricted LV lateral wall long axis function.
Figure 12.
In normal hearts, there is striking synchrony of the contraction and relaxation of various myocardial walls, both in systole and diastole, in terms of the onsets and offsets of these mechanical events. This synchrony is lost in myocardial disorders, including LV hypertrophy. Diastolic asynchrony is one of the bases of abnormal LV relaxation. Systolic asynchrony reduces the coordination of LV power generation as well.
Figure 13.
In normal subjects, the LV ejection starts within 10 ms of coordinated shortening of the LV wall segments and the mitral E wave follows the annular E’ wave within 20–40 ms. In those with LV hypertrophy, the LV systolic and diastolic dyssynchrony impairs both LV systolic and diastolic functions. Post-ejection LV shortening (PES) is common in such patients and markedly impairs the pressure decay in LV or LV relaxation.
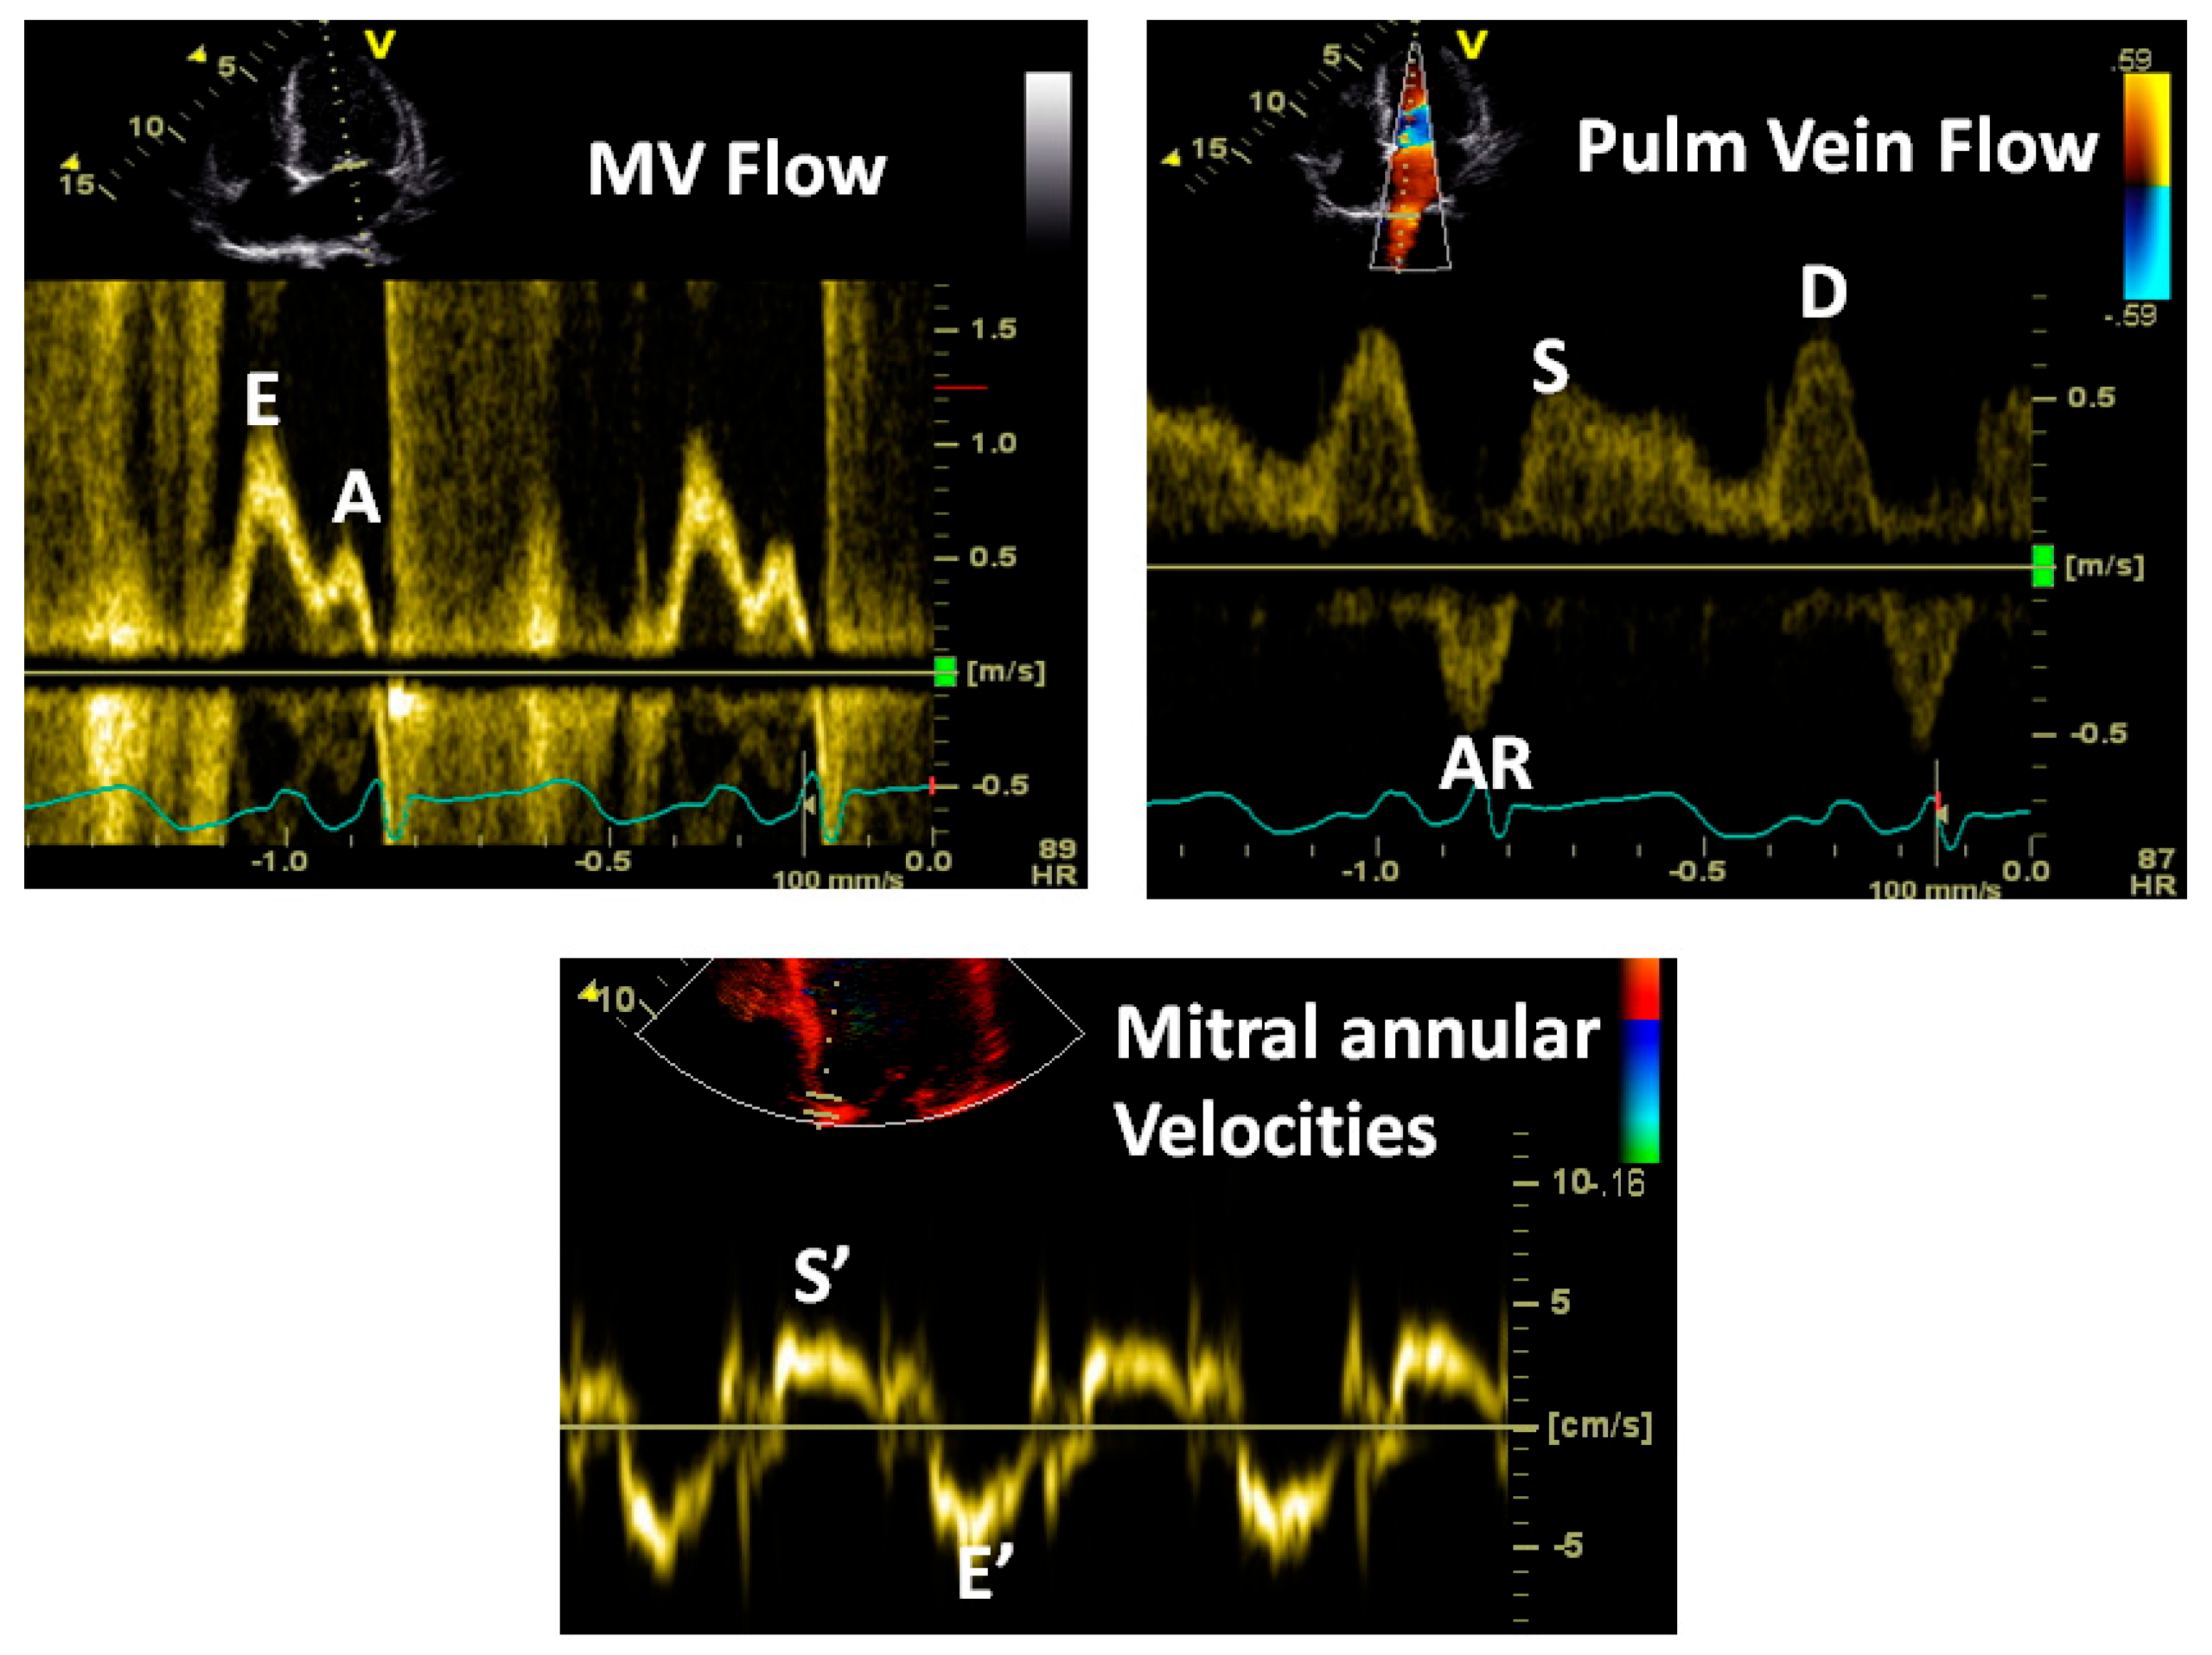
Figure 14.
Note the classic pattern of increased LA pressure: E/A velocity ratio >2, short E wave deceleration, E/E’ ratio >15 and an AR wave duration more than the mitral A wave duration. The last measure indicates elevated LV end-diastolic pressure and stiffness.
Figure 14.
Note the classic pattern of increased LA pressure: E/A velocity ratio >2, short E wave deceleration, E/E’ ratio >15 and an AR wave duration more than the mitral A wave duration. The last measure indicates elevated LV end-diastolic pressure and stiffness.
Figure 15.
Note that this patient has very high LA pressure signified by a high E/A velocity ratio and high E/E’ ratio. But note that that the IVRT (vertical arrow) is practically zero, indicating that the mitral valve opens immediately after aortic valve closure. In other words, the left atrial V wave is as high as the aortic end-systolic pressure (80–90 mmHg), indicating severe mitral regurgitation. A mean LA pressure in that range is incompatible with life.
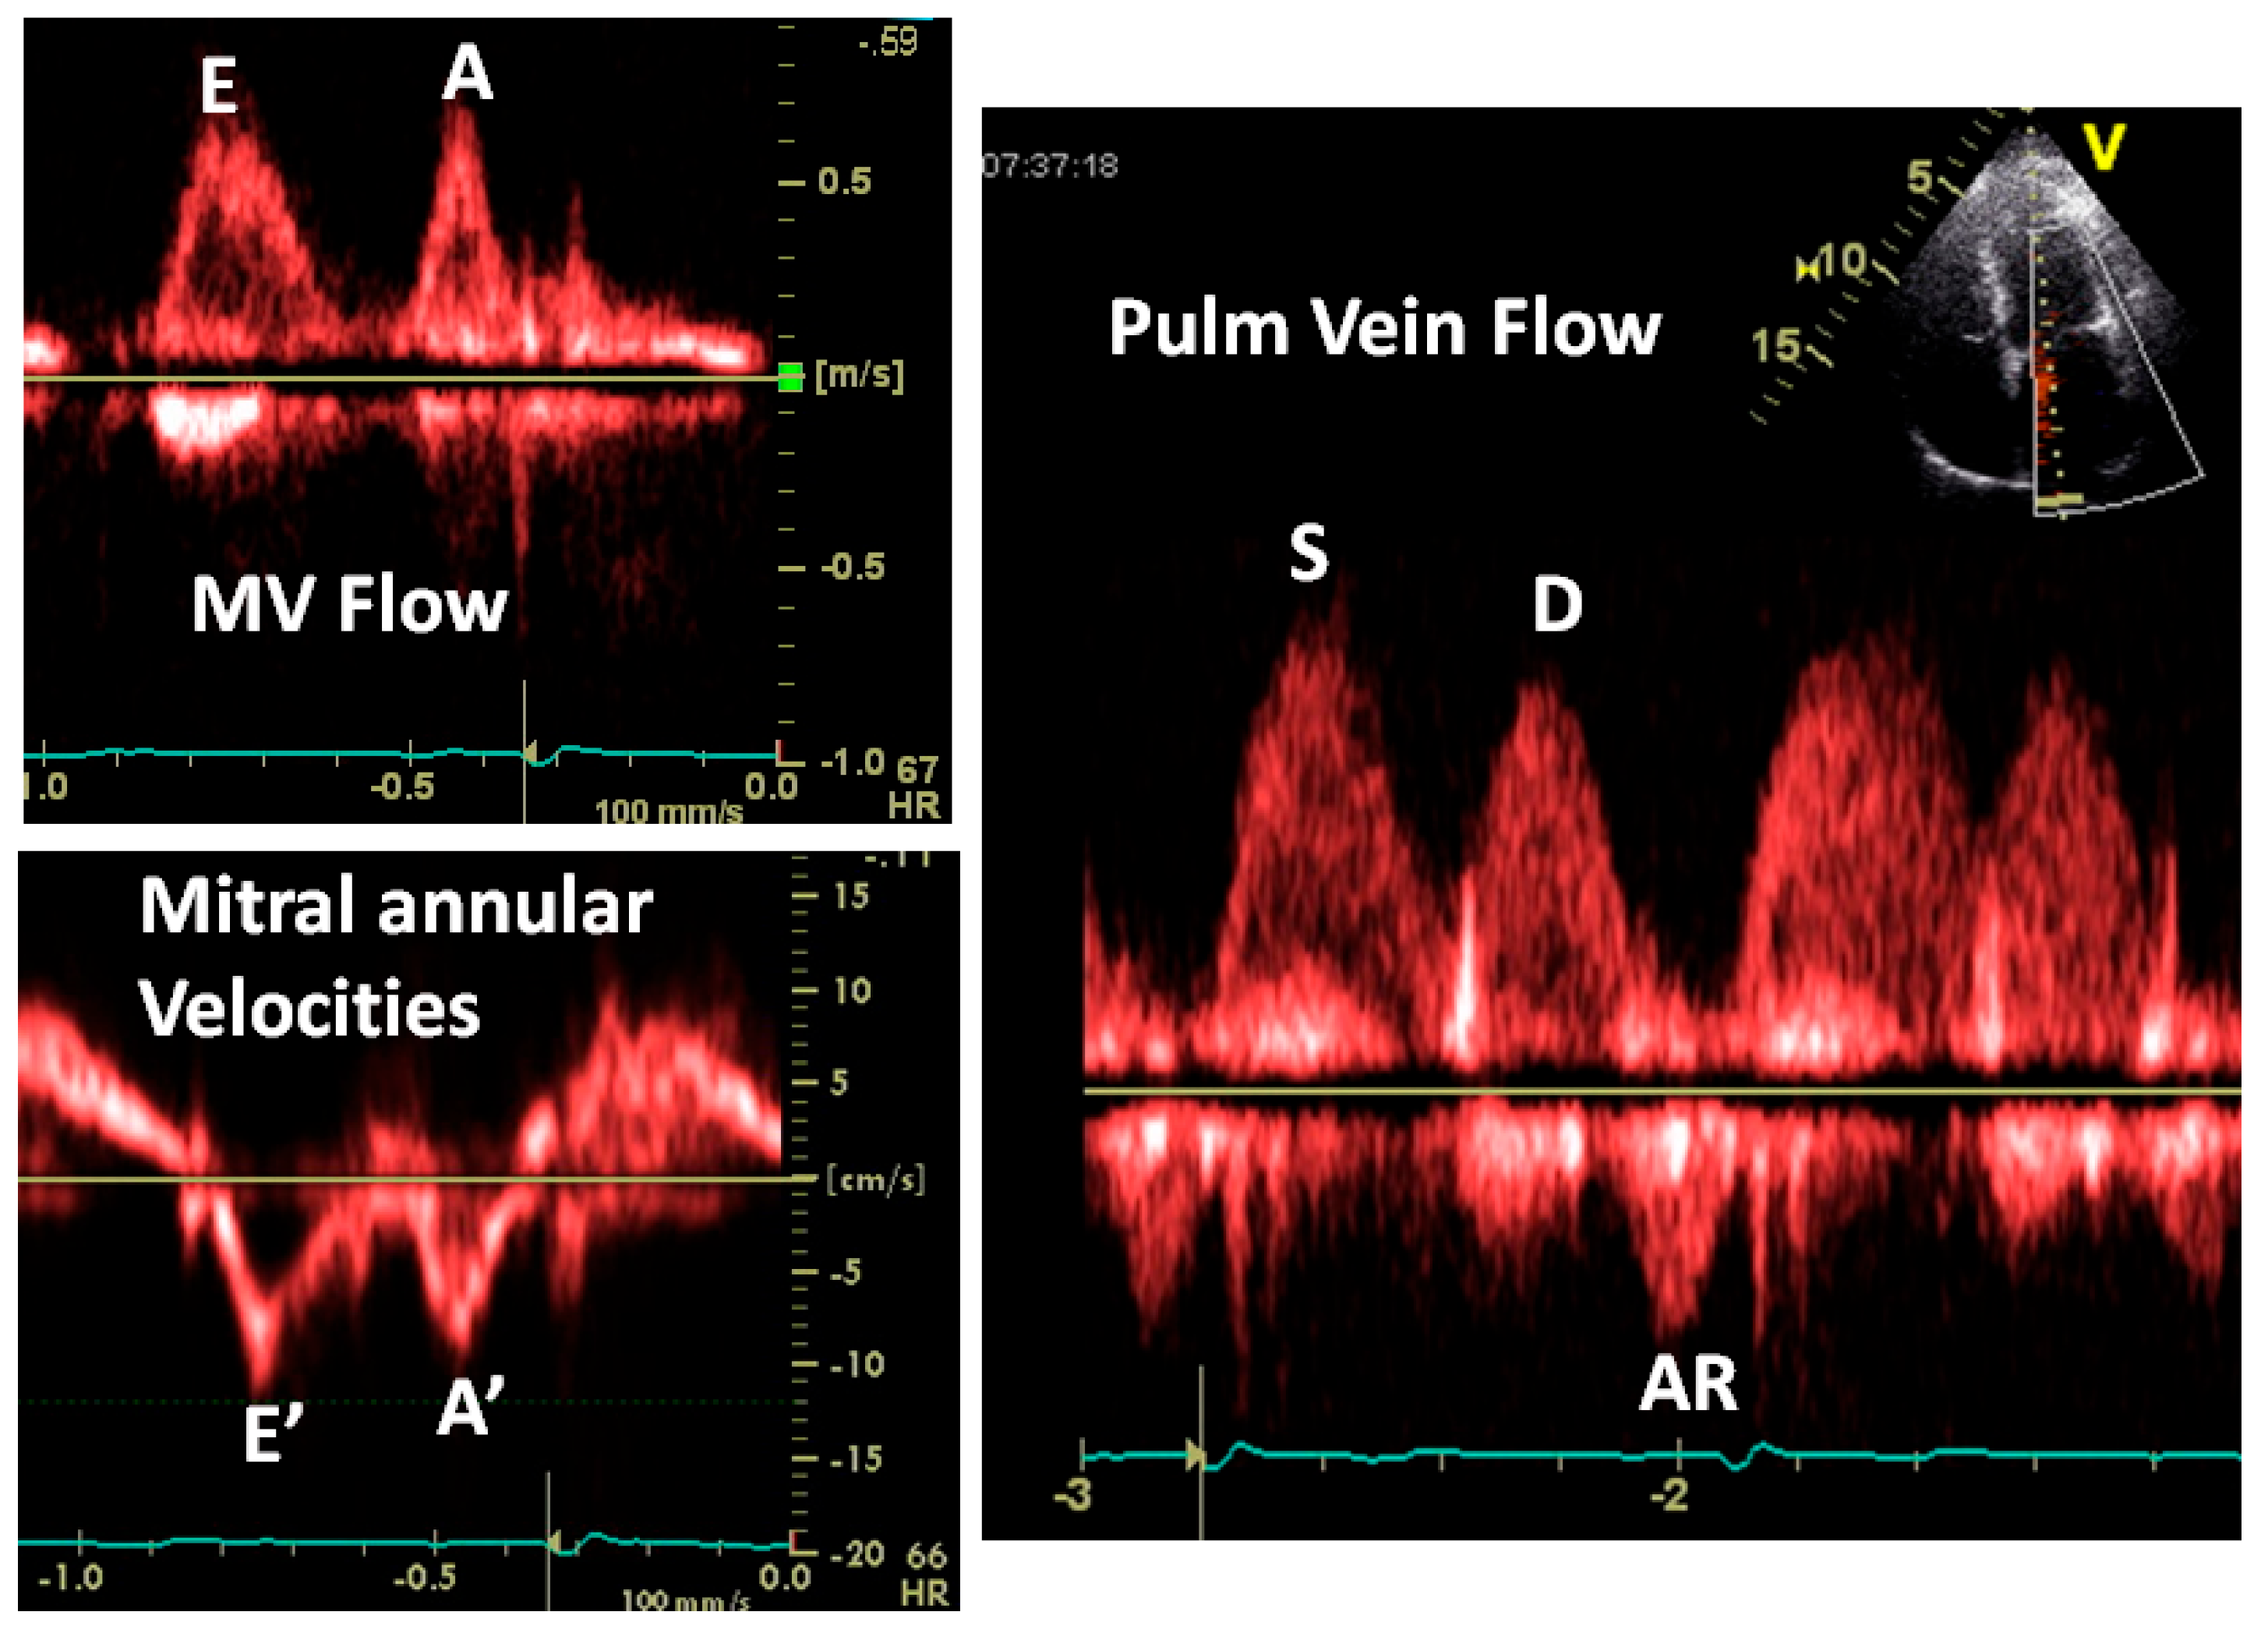
Figure 16.
Not everything is “black and white”. In this example, the mitral flow and annular velocities look normal. The E/E’ ratio is normal. The S wave is larger than the D wave and you may conclude that the LA pressure is normal. But note 2 things: the pulmonary AR wave duration is greater than that of the mitral A wave, indicating elevated LVEDP and the sharp transition between the S and D waves, indicating a stiff left atrium, a marker of elevated LA pressure. The shortness of breath in this patient was due to “diastolic heart failure” verified by cardiac catheterization.
Table 1.
History of concept developments in terms of diastolic HF.
Table 1.
History of concept developments in terms of diastolic HF.
| 100 AC | Galen proposed that the heart filled by dilation of the right ventricle |
| 1628 | Harvey proposed that most ventricular filling occurred during atrial systole |
| 1877 | Francois-Franck proposed that most LV filling occurred in early diastole |
| 1906 | Henderson described three phases of diastole |
| 1921 | Wiggers and Katz reported that the atrial contribution to LV filling varied |
| 1927 | Meek proposed that the “contraction remainder” extended into diastole |
| 1949 | Wiggers coined the term “inherent elasticity” to describe the diastolic properties of the myocardium |
| 1970s | Studies were performed on LV relaxation and passive LV properties, and these were characterized |
| 1970s | Extensive studies of hypertrophic cardiomyopathy describing severely abnormal diastole and potential benefits of verapamil |
| 1980s | Diastolic heart failure was described as an entity |
| 1992 | Monograph on “Diastolic heart failure” published by Shah and Pai |
| 2000s | The term “Heart failure with preserved ejection fraction (HFpEF)” was coined because of uncertainties about evaluating LV diastolic function |
Table 2.
Factors affecting LV relaxation.
Table 2.
Factors affecting LV relaxation.
| Factors impairing LV relaxation: |
| Aging |
| LV hypertrophy |
| Myocardial ischemia |
| LV dyssynchrony; e.g., RV pacing, LV hypertrophy, LBBB |
| Myocardial disarray as in hypertrophic cardiomyopathy |
| Increased LV afterload causing increased myocyte calcium load |
| Factors that improve LV relaxation: |
| Higher sympathetic tone and catecholamines |
| Calcium channel blockers |
| Specific LV lusiotropic agents such as levosimendan and calcium channel blockers in hypertrophic cardiomyopathy |
Table 3.
Processes associated with increased LV diastolic stiffness.
Table 3.
Processes associated with increased LV diastolic stiffness.
| Increasing age |
| LV hypertrophy |
| Interstitial fibrosis |
| Myocardial scarring |
| Infiltrative disorders such as cardiac amyloid, sarcoid and other storage disorders |
Table 4.
Diastolic heart failure mimickers.
Table 4.
Diastolic heart failure mimickers.
| Pericardial constriction |
| Acute pericarditis |
| Acute aortic regurgitation |
| Acute mitral regurgitation |
| Acute tricuspid regurgitation |
| Right ventricular infarction |
| Acute massive or submassive pulmonary embolism |
| Large pleural effusions |
| Tension pneumothorax |
| Large mediastinal tumors |
| Use of positive end-expiratory pressure (PEEP) and auto PEEP |
Table 5.
Commonly used terminology addressing LV diastolic function with the relevant definitions.
Table 5.
Commonly used terminology addressing LV diastolic function with the relevant definitions.
| Force: | An agent that causes a change in momentum |
| Stress: | Force per unit cross-sectional area that causes deformation |
| Strain: | Fractional change from unstressed dimension |
| Creep: | Time-dependent elongation of a material held at constant stress |
| Stress relaxation: | Diminution of stress when held at constant strain |
| Elasticity: | Property of recovery of a material from a stressed state when the stress is removed |
| Viscosity: | Property of the material that retards deformation in response to stress |
| Viscoelasticity: | Property of the material when stress depends upon strain, e.g., myocardium |
| Hookean material: | Material that follows Hooke’s law, which states that the stress–strain relationship is linear |
| Non-Hookean material: | Material that does not follow Hooke’s law, e.g., myocardium |
| Modulus of stiffness: | Slope of the stress–strain relationship |
| Compliance: | Change in volume per unit change in pressure for a chamber |
| Stiffness: | Reciprocal of compliance |
Table 6.
Factors affecting LV IVRT, E wave amplitude and A wave amplitude.
Table 6.
Factors affecting LV IVRT, E wave amplitude and A wave amplitude.
| Factors affecting LV IVRT: |
| Rate of LV relaxation increases with impaired relaxation |
| LBBB increases IVRT |
| RV pacing increases IVRT |
| High LA pressure reduces IVRT |
| Large left atrial V wave reduces IVRT |
| Factors affecting E wave amplitude: |
| Impaired LV relaxation reduces E wave amplitude |
| High LA pressure increases its amplitude |
| Exaggerated LV recoil increases its amplitude |
| Factors affecting mitral A wave amplitude: |
| Left atrial contractile function: reduced in atrial cardiomyopathy, post cardioversion |
| Atrial preload: larger LA volume at the time of systole boosts the atrial transport function |
| Atrial afterload: Higher LVEDP or pre-A pressure will reduce atrial contribution |


