
Estimated Pulse Wave Velocity and All-Cause and Cardiovascular Mortality in the General Population
 , , , , ,
Abstract
:1. Introduction
2. Materials and Methods
3. Results
4. Discussion
5. Conclusions
Supplementary Materials
Author Contributions
Funding
Institutional Review Board Statement
Informed Consent Statement
Data Availability Statement
Conflicts of Interest
References
- Greve, S.V.; Blicher, M.K.; Blyme, A.; Sehestedt, T.; Hansen, T.W.; Rassmusen, S.; Vishram, J.K.K.; Torp-Pedersen, C.; Olsen, M.H. Association between albuminuria, atherosclerotic plaques, elevated pulse wave velocity, age, risk category and prognosis in apparently healthy individuals. J. Hypertens. 2014, 32, 1034–1041. [Google Scholar] [CrossRef] [PubMed]
- Laurent, S.; Boutouyrie, P.; Asmar, R.; Gautier, I.; Laloux, B.; Guize, L.; Ducimetiere, P.; Benetos, A. Aortic stiffness is an independent predictor of all-cause and cardiovascular mortality in hypertensive patients. Hypertension 2001, 37, 1236–1241. [Google Scholar] [CrossRef] [PubMed]
- Vlachopoulos, C.; Aznaouridis, K.; Stefanadis, C. Prediction of cardiovascular events and all-cause mortality with arterial stiffness: A systematic review and meta-analysis. J. Am. Coll. Cardiol. 2010, 55, 1318–1327. [Google Scholar] [CrossRef] [PubMed]
- Boutouyrie, P.; Tropeano, A.I.; Asmar, R.; Gautier, I.; Benetos, A.; Lacolley, P.; Laurent, S. Aortic stiffness is an independent predictor of primary coronary events in hypertensive patients: A longitudinal study. Hypertension 2002, 39, 10–15. [Google Scholar] [CrossRef] [PubMed]
- Cruickshank, K.; Riste, L.; Anderson, S.G.; Wright, J.S.; Dunn, G.; Gosling, R.G. Aortic pulse-wave velocity and its relationship to mortality in diabetes and glucose intolerance: An integrated index of vascular function? Circulation 2002, 106, 2085–2090. [Google Scholar] [CrossRef] [PubMed]
- Willum-Hansen, T.; Staessen, J.A.; Torp-Pedersen, C.; Rasmussen, S.; Thijs, L.; Ibsen, H.; Jeppsen, J. Prognostic value of aortic pulse wave velocity as index of arterial stiffness in the general population. Circulation 2006, 113, 664–670. [Google Scholar] [CrossRef] [PubMed]
- Ben-Shlomo, Y.; Spears, M.; Boustred, C.; May, M.; Andersen, S.G.; Benjamin, E.J.; Boutouryrie, P. Aortic pulse wave velocity improves cardiovascular event prediction: An individual participant meta-analysis of prospective observational data from 17,635 subjects. J. Am. Coll. Cardiol. 2014, 63, 636–646. [Google Scholar] [CrossRef] [PubMed]
- Vishram-Nielsen, J.K.; Laurent, S.; Nilsson, P.M.; Linneberg, A.; Sehested, T.S.; Greve, S.V.; MORGAM Project. MORGAM Project. Does Estimated Pulse Wave Velocity Add Prognostic Information?: MORGAM Prospective Cohort Project. Hypertension 2020, 75, 1420–1428. [Google Scholar] [CrossRef] [PubMed]
- Benetos, A.; Rudnichi, A.; Safar, M.; Guize, L. Pulse pressure and cardiovascular mortality in normotensive and hypertensive subjects. Hypertension 1998, 32, 560–564. [Google Scholar] [CrossRef] [PubMed]
- Franklin, S.S.; Khan, S.A.; Wong, S.A.; Larson, M.G.; Levy, D. Is pulse pressure useful in predicting coronary heart disease? The Framingham Heart Study. Circulation 1999, 100, 354–360. [Google Scholar] [CrossRef] [PubMed]
- Chae, C.U.; Pfeffer, M.A.; Glynn, R.J.; Mitchell, G.F.; Taylor, J.O.; Hennekens, C.H. Increased pulse pressure and risk of heart failure in the elderly. JAMA 1999, 281, 634–643. [Google Scholar] [CrossRef] [PubMed]
- O’Rourke, M.; Frohlich, E.D. Pulse pressure: Is it a clinically useful risk factor? Hypertension 1999, 34, 372–374. [Google Scholar] [CrossRef] [PubMed]
- Greve, S.V.; Blicher, M.K.; Kruger, R.; Sehestedt, T.; Kampmann-Gram, E.; Rasmussen, S.; Vishram, J.K.K.; Laurent, S.; Olsen, M.H. Estimated carotid-femoral pulse wave velocity has similar predictive value as measured carotid-femoral pulse wave velocity. J. Hypertens. 2016, 34, 1279–1289. [Google Scholar] [CrossRef] [PubMed]
- Vlachopoulos, C.; Terentes-Printzios, D.; Laurent, S. Association of estimated pulse wave velocity with survival: A secondary analysis of sprint. JAMA Netw. Open. 2019, 2, e1912831. [Google Scholar] [CrossRef] [PubMed]
- Ji, C.P.; Gao, J.L.; Huang, Z.; Chen, S.; Wang, G.; Wu, S.; Jonas, J.B. Estimated pulse wave velocity and cardiovascular events in Chinese. Int. J. Cardiol. Hypertens. 2020, 7, 100063. [Google Scholar] [CrossRef] [PubMed]
- Jae, S.Y.; Heffernan, K.S.; Laukkanen, J.A. Association between estimated pulse wave velocity and the risk of stroke in middle-aged men. Int. J. Stroke. 2021, 16, 551–555. [Google Scholar] [CrossRef] [PubMed]
- He, X.W.; Park, J.; Huang, W.S.; Leng, L.H.; Pei, Y.B.; Zhu, G.; Wu, S. Usefulness of estimated pulse wave velocity for identifying prevalent coronary heart disease: Findings from a general Chinese population. BMC Cardiovasc. Disord. 2022, 22, 9. [Google Scholar] [CrossRef] [PubMed]
- Hsu, P.C.; Lee, W.H.; Tsai, W.C.; Chen, Y.C.; Chu, C.Y.; Yen, H.W.; Lin, T.H.; Voon, W.C.; Lai, W.T.; Sheu, S.H.; et al. Comparison between estimated and brachial-ankle pulse wave velocity for cardiovascular and overall mortality prediction. J. Clin. Hypertens. 2021, 23, 106–113. [Google Scholar] [CrossRef] [PubMed]
- Stamatelopoulos, K.; Georgiopoulos, G.; Baker, K.F.; Tiseo, G.; Delalis, D.; Lazaridis, C.; Barbieri, G.; Masi, S.; Vlachogiannis, N.I. Estimated pulse wave velocity improves risk stratification for all-cause mortality in patients with COVID-19. Sci. Rep. 2021, 11, 20239. [Google Scholar] [CrossRef] [PubMed]
- Heffernan, K.S.; Jae, S.Y.; Loprinzi, P.D. Estimated pulse wave velocity is associated with residual-specific mortality: Findings from the national health and nutrition examination survey. J. Hypertens. 2021, 39, 698–702. [Google Scholar] [CrossRef] [PubMed]
- Heffernan, K.S.; Wilmoth, J.M.; London, A.S. Estimated Pulse Wave Velocity and All-Cause Mortality: Findings From the Health and Retirement Study. Innov. Aging. 2022, 6, igac056. [Google Scholar] [CrossRef] [PubMed]
- Glasser, S.P.; Halberg, D.L.; Sands, C.D.; Mosher, A.; Muntner, P.M.; Howard, G. Is pulse pressure an independent risk factor for incident stroke, reasons for geographic and racial differences in stroke. Am. J. Hypertens. 2015, 28, 987–994. [Google Scholar] [CrossRef] [PubMed]
- Karjalainen, T.; Adiels, M.; Björck, L.; Cooney, M.T.; Graham, I.; Perk, J.; Rosengren, A.; Soderberg, S.; Eliasson, M. An evaluation of the performance of SCORE Sweden 2015 in estimating cardiovascular risk: The Northern Sweden MONICA Study 1999–2014. Eur. J. Prev. Cardiol. 2017, 24, 103–110. [Google Scholar] [CrossRef] [PubMed]
- D’Agostino, R.B., Sr.; Vasan, R.S.; Pencina, M.J.; Wolf, P.A.; Corbain, M.; Massaro, J.M.; Kannel, W.B. General cardiovascular risk profile for use in primary care: The Framingham Heart Study. Circulation 2008, 117, 743–753. [Google Scholar] [CrossRef] [PubMed]
- D’agostino, R.B., Sr.; Nam, B.H. Evaluation of the performance of survival analysis models: Discrimination and calibration measures. In Handbook of Statistics, Volume 23: Advances in Survival Analysis; Balakrishnan, N., Rao, C.R., Eds.; Elsevier BV: Amsterdam, The Netherlands, 2004; pp. 1–25. [Google Scholar]
- Pencina, M.J.; D’Agostino, R.B., Sr.; D’Agostino, R.B., Jr.; Vasan, R.S. Evaluating the added predictive ability of a new marker: From area under the ROC curve to reclassification and beyond. Stat. Med. 2008, 27, 157–172; discussion 207. [Google Scholar] [CrossRef] [PubMed]
- Sehestedt, T.; Jeppesen, J.; Hansen, T.W.; Wachtell, K.; Ibsen, H.; Torp-Pedersen, C.; Hildebrandt, P.; Olsen, M.H. Risk prediction is improved by adding markers of subclinical organ damage to SCORE. Eur. Heart. J. 2010, 31, 883–891. [Google Scholar] [CrossRef] [PubMed]
- Pencina, M.J.; D’Agostino, R.B., Sr.; Steyerberg, E.W. Extensions of net reclassification improvement calculations to measure usefulness of new biomarkers. Stat. Med. 2011, 30, 11–21. [Google Scholar] [CrossRef] [PubMed]
- Natriuretic Peptides Studies Collaboration; Willeit, P.; Kaptoge, S.; Welsh, P.; Butterworth, A.S.; Chowdhury, R.; Spackman, S.A.; Pennells, L.; Gao, P.; Burgess, S. Natriuretic Peptides Studies Collaboration; et al. Natriuretic peptides and integrated risk assessment for cardiovascular disease: An individual-participant-data meta-analysis. Lancet Diabetes Endocrinol. 2016, 4, 840–849. [Google Scholar] [CrossRef] [PubMed]
- Liu, C.; Pan, H.; Kong, F.; Yang, S. Association of arterial stiffness with all-cause and cause-specific mortality in the diabetic population: A national cohort study. Front. Endocrinol. 2023, 14, 1145914. [Google Scholar] [CrossRef]
- Huang, H.; Bu, X.; Pan, H.; Yang, S.; Cheng, W.; Shubha, Q.T.H.; Ma, N. Estimated pulse wave velocity is associated with all-cause and cardio-cerebrovascular disease mortality in stroke population: Results from NHANES (2003–2014). Front. Cardiovasc. Med. 2023, 10, 1140160. [Google Scholar] [CrossRef]
- Boutouyrie, P. Estimating Is Not Measuring. J. Am. Heart Assoc. 2022, 11, e025830. [Google Scholar] [CrossRef] [PubMed]
- Baran, J.; Kleczyński, P.; Niewiara, Ł.; Podolec, J.; Badacz, R.; Gackowski, A.; Pieniążek, P.; Legutko, J.; Żmudka, K.; Przewłocki, T.; et al. Importance of Increased Arterial Resistance in Risk Prediction in Patients with Cardiovascular Risk Factors and Degenerative Aortic Stenosis. J. Clin. Med. 2021, 10, 2109. [Google Scholar] [CrossRef] [PubMed]
- Segers, P.; Mahieu, D.; Kips, J.; Rietzschel, E.; Buyzere, M.D.; De Bacquer, D. Amplifiaction of the pressure pulse in the upper limb in healthy, middle- aged men and women. Hypertension 2009, 54, 414–420. [Google Scholar] [CrossRef] [PubMed]
- Koala, M.M.; Sorkin, J.D.; Fargostein, M.; Brown, V.; Cuthbert, B.A.; Hollis, J.; Raines, J.K.; Duncan, E.J. Predictors of Calf Aterial Complicance in Male Veterans With Psychiatric Diagnoses. Prim. Care Companion CNS Disord. 2016, 18, 3. [Google Scholar]
- Liu, H.R.; Li, C.Y.; Xia, X.; Feng, X.F.; Fenrg, G.D.; Chao, L.F.; Feng, H.J. Association of Estimated Pulse Wave Velocity and the Dynamic Changes in Estimated Pulse Wave Velocity with All-Cause Mortality among Middle-Aged and Elderly Chinese. Biomed. Environ. Sci. 2022, 35, 1001–1011. [Google Scholar] [PubMed]
- Laugesen, E.; Olesen, K.K.W.; Peters, C.D.; Buus, N.H.; Maeng, M.; Botker, H.E.; Poulsen, P.L. Estimated Pulse Wave Velocity Is Associated With All-Cause Mortality During 8.5 Years Follow-up in Patients Undergoing Elective Coronary Angiography. J. Am. Heart Assoc. 2022, 11, e025173. [Google Scholar] [CrossRef]
- Papaioannou, T.G.; Oikonomou, E.; Lazaros, G.; Christoforatou, E.; Vogiatzi, G.; Tsalamandris, S. The influence of resting heart rate on pulse wave velocity measurement is mediated by blood pressure and depends on aortic stiffness levels: Insights from the Corinthia study. Physiol. Meas. 2019, 40, 055005. [Google Scholar] [CrossRef] [PubMed]
- Lantelme, P.; Mestre, C.; Lievre, M.; Gressard, A.; Milon, H. Heart rate an important cofounder of pulse wave velocity assessment. Hypertension 2022, 39, 1083–1087. [Google Scholar] [CrossRef] [PubMed]
- Papaioannou, T.G.; Protogerou, A.D.; Stergiopulos, N.; Vardoulis, O.; Stefanadis, C.; Safar, M.; Blacher, J. Total arterial compliance estimated by a novel method and all-cause mortality in the elderly: The PROTEGER study. Age 2014, 36, 1555–1563. [Google Scholar] [CrossRef] [PubMed]

| 1st Tercile | 2nd Tercile | 3rd Tercile | p | |
|---|---|---|---|---|
| Age, (years) | 36 ± 8 36 (29–42) | 53 ± 7 48 (58–70) | 70 ± 7 70 (66–74) | <0.001 |
| Men (%) | 42.7 | 44.4 | 39.8 | 0.58 |
| Height, (cm) | 1.72 ± 0.10 1.71 (1.64–1.79) | 1.69 ± 0.9 1.68 (1.62–1.72) | 1.66 ± 0.09 1.65 (1.59–1.72) | <0.001 |
| Weight, (kg) | 73.2 ± 14.7 72.0 (62.0–82.0) | 80.1 ± 14.1 80.0 (70.0–89.0) | 79.3 ± 14.4 78.0 (69.0–86.5) | <0.001 |
| Body mass index, (kg/m2) | 24.7 ± 3.9 24 (22.0–27.0) | 27.9 ± 4.3 27.0 (25.0–31.0) | 29.0 ± 5.2 28.0 (26.0–32.0) | <0.001 |
| Systolic BP (mmHg) | 118 ± 12 118 (111–125) | 135 ± 14 132 (125–142) | 152 ± 19 152 (138–165) | <0.001 |
| Diastolic BP (mmHg) | 77 ± 7 77 (72–81) | 85 ± 8 83 (80–90) | 89 ± 11 89 (81–96) | <0.001 |
| Mean BP (mmHg) | 93 ± 8 94 (88–98) | 105 ± 10 103 (99–111) | 114 ± 13 114 (105–123) | <0.001 |
| Heart rate (bpm) | 72 ± 8 71 (67–76) | 73 ± 9 73 (67–79) | 74 ± 9 74 (67–80) | 0.032 |
| Fasting blood glucose (mmol/L) | 5.1 ± 0.7 5.1 (4.7–5.5) | 5.8 ± 1.4 5.5 (4.9–6.1) | 6.3 ± 2.2 5.7 (5.1–6.5) | <0.001 |
| Serum creatinine, (μmol/L) | 85 ± 14 87 (74–95) | 86 ± 37 81 (75–91) | 89 ± 27 86 (75–98) | 0.455 |
| eGFR (ml/min/1.73 m2) | 89.0 ± 13.9 89.7 (78.4–95.3) | 80.1 ± 18.1 80.8 (69.9–91.1) | 66.5 ± 15.5 65.7 (54.6–77.5) | <0.001 |
| Total cholesterol, (mmol/L) | 5.6 ± 1.3 5.4 (4.8–6.5) | 6.0 ± 1.2 6.0 (5.3 –6.6) | 6.3 ± 1.3 6.1 (5.4–7.1) | <0.001 |
| LDL cholesterol, (mmol/L) | 3.7 ± 1.1 3.7 (2.8–4.6) | 3.9 ± 1.0 3.9 (3.3–4.4) | 4.1 ± 1.3 4.0 (3.1–4.9) | 0.274 |
| HDL cholesterol, (mmol/L) | 1.4 ± 0.5 1.4 (1.1–1.6) | 1.3 ± 0.4 1.3 (1.0–1.5) | 1.4 ± 0.5 1.4 (1.1–1.6) | 0.203 |
| Triglycerides, (mmol/L) | 1.5 ± 1.0 1.3 (0.9–1.8) | 1.9 ± 1.2 1.6 (1.2–2.3) | 1.9 ± 1.2 1.7 (1.1–2.3) | 0.011 |
| Uric acid, (mmol/L) | 259.5 ± 87.0 239.0 (196.0–302.5) | 286.3 ± 102.3 280.0 (213.0–326.0) | 305.6 ± 84.3 297.0 (253.0–358.0) | 0.004 |
| ePWV (m/s) | 6.9 ± 0.5 6.9 (6.5–7.4) | 9.2 ± 0.9 9.1 (8.3–10.1) | 12.6 ± 1.2 12.5 (11.6–13.4) | <0.001 |
| Cancer deaths | 1.7 (6) | 6.3 (22) | 8.8 (31) | <0.001 |
| CV and stroke deaths | 0.3 (1) | 5.1 (18) | 26.3 (93) | <0.001 |
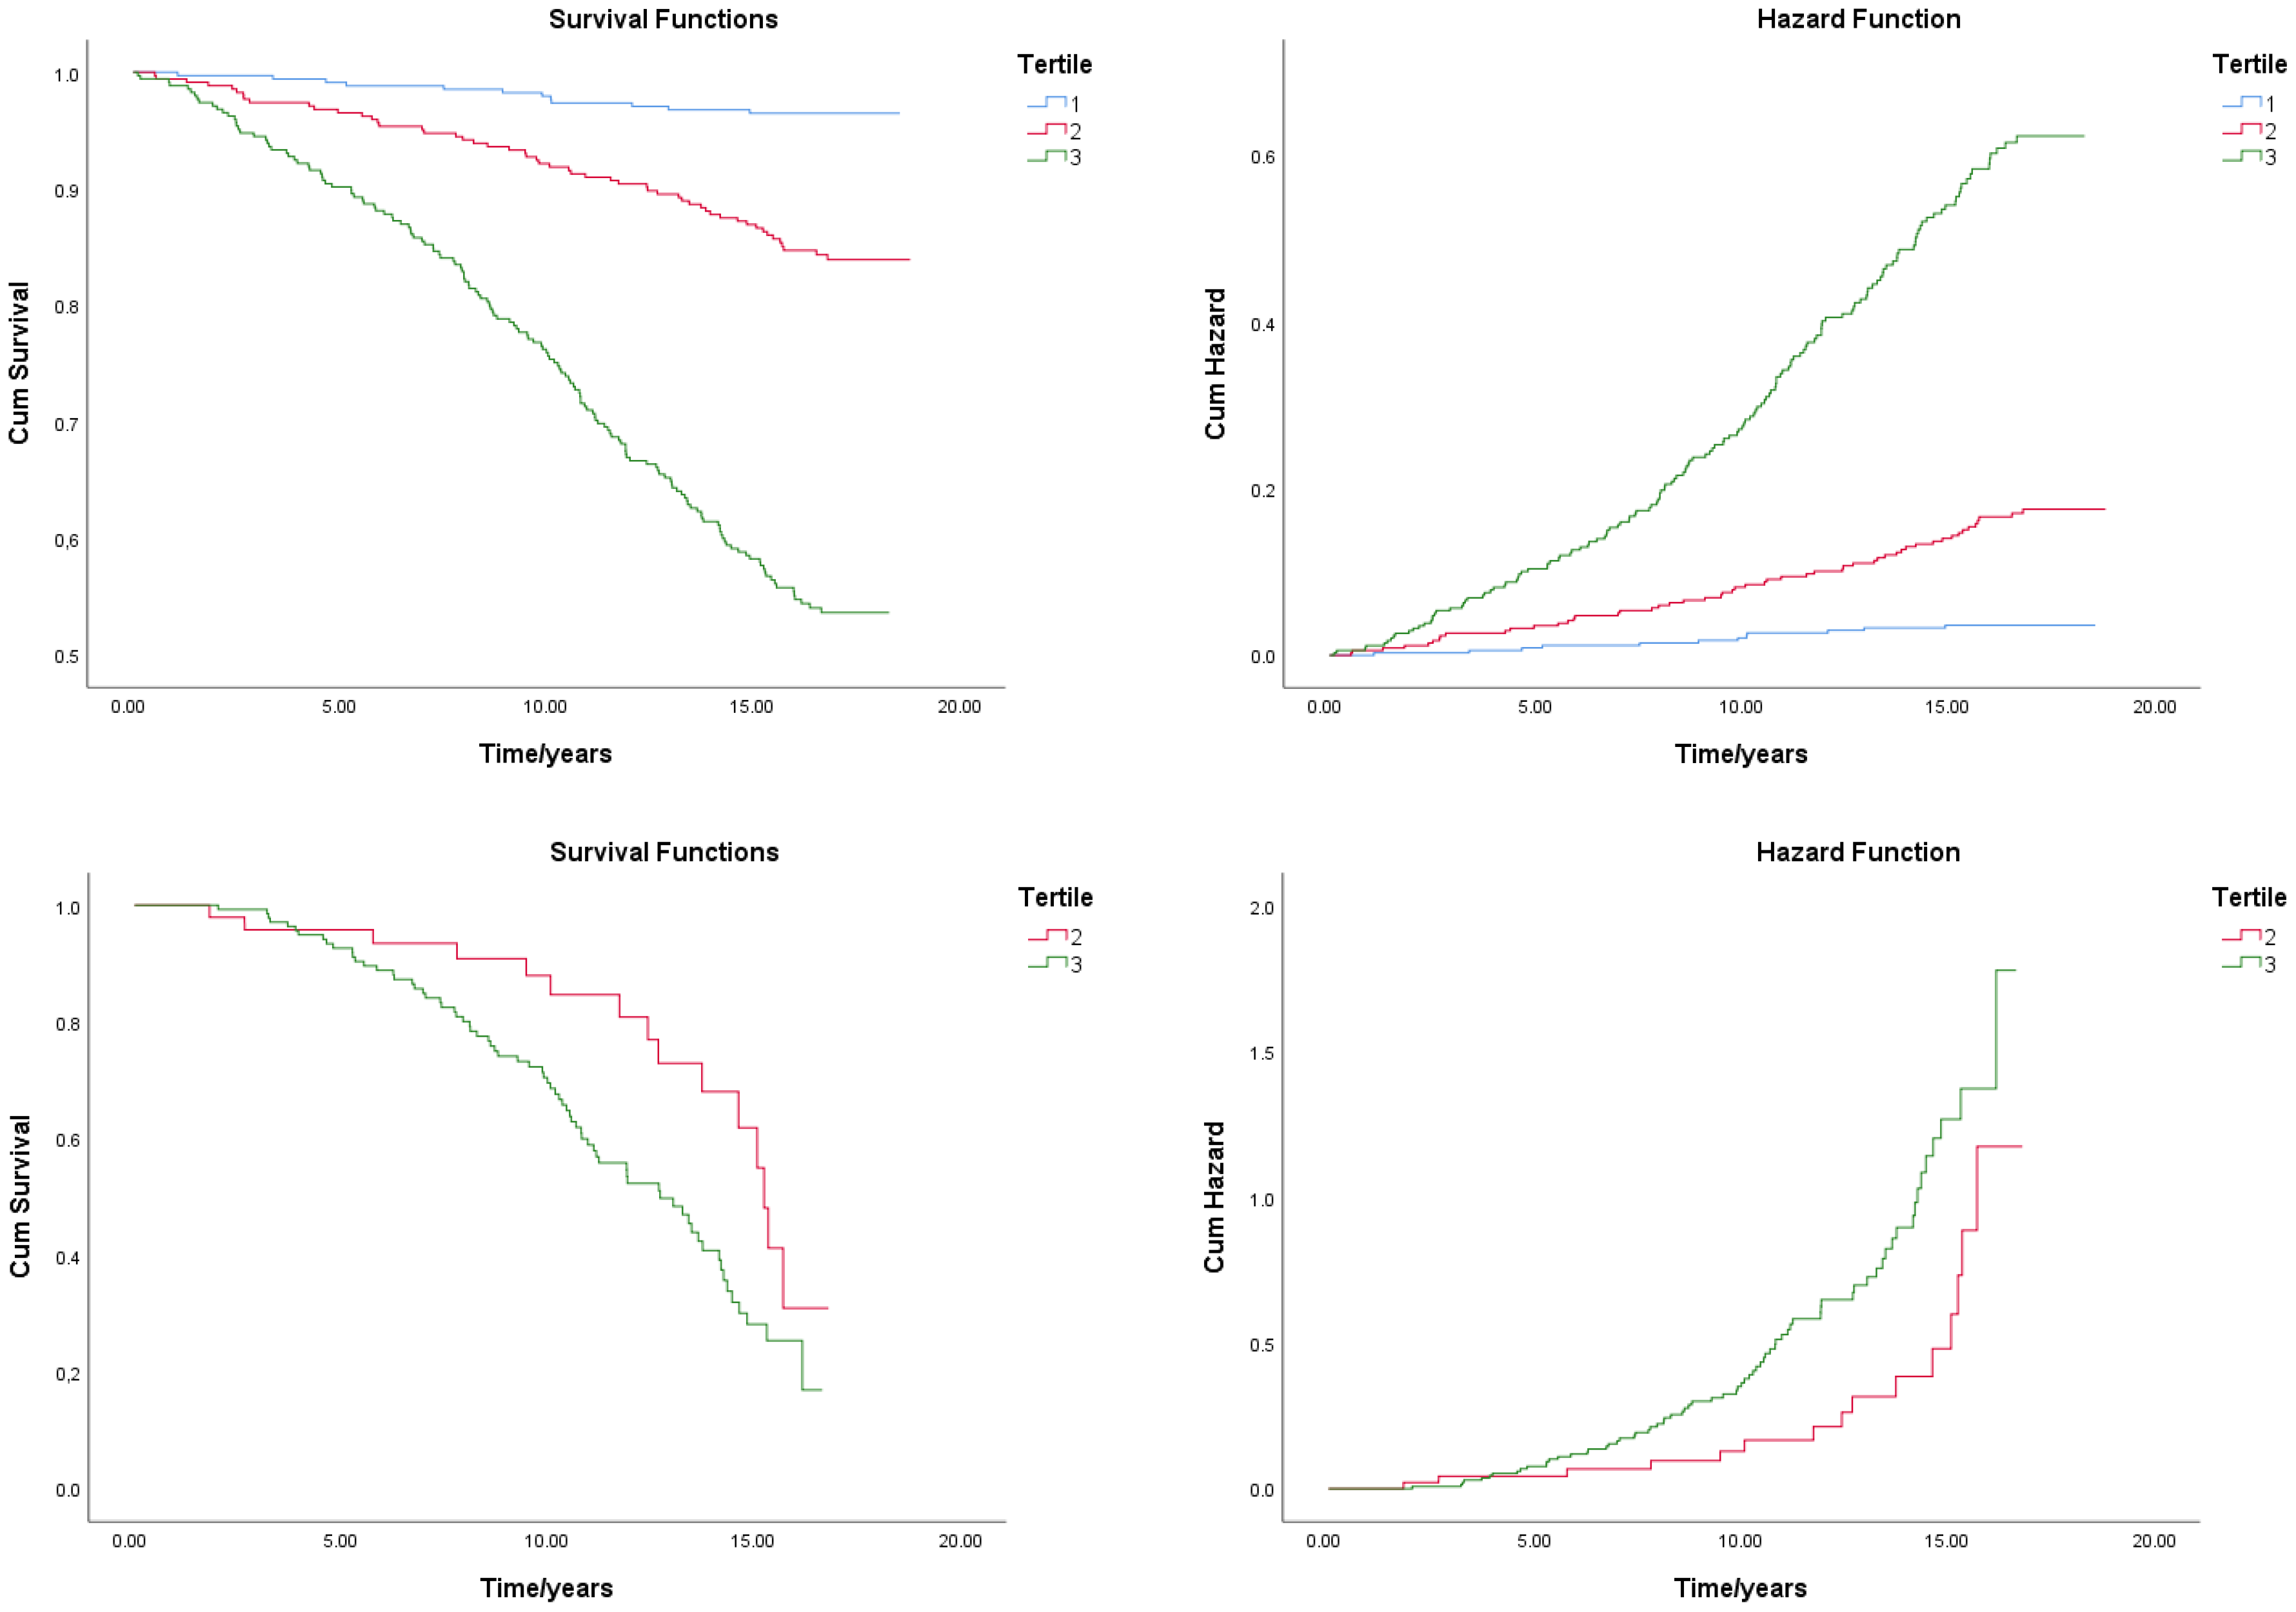
| All-Cause Death Survival Analysis | CV Death Survival Analysis | |||||
|---|---|---|---|---|---|---|
| Tercile | Average Survival Time (Years) | 95% CI | p (Log Rank, Mantel–Cox) | Average Survival Time (Years) | 95% CI | P (Log Rank, Mantel–Cox) |
| 1 | 18.2 ± 0.1 | 18.0–18.4 | <0.001 | 0.013 | ||
| 2 | 17.3 ± 0.2 | 16.9–17.8 | 14.0 ± 0.6 | 12.8–15.2 | ||
| 3 | 14.1 ± 0.3 | 13.5–14.7 | 11.9 ± 0.4 | 11.2–12.6 | ||
| Whole Group—General Population | Subgroup with High CV Risk | ||||||||
|---|---|---|---|---|---|---|---|---|---|
| b | p | HR | 95% CI | b | p | HR | 95% CI | ||
| Model 1 | ePWV | 0.135 | 0.038 * | 1.145 | 1.008–1.301 | 0.269 | <0.001 *** | 1.309 | 1.147–1.494 |
| Ct | −6.181 | <0.001 *** | 0.000052 | 0.000007–0.000409 | −7.116 | 0.108 | 0.000812 | 1.394–4.7290 | |
| HR | 0.012 | 0.366 | 1.012 | 0.988–1.041 | 0. | 0.358 | 1.013 | 0.998–1.041 | |
| Model 2 | ePWV | 0.209 | 0.725 | 1.232 | 0.385–3.938 | 1.108 | 0.029 * | 3.030 | 1.118–8.211 |
| Ct | −8.750 | 0.048 | 0.000158 | 0.000158–0.22666 | −9.235 | <0.001 *** | 0.000089 | 0.000011–0.000754 | |
| Age | 0.004 | 0.972 | 1.004 | 0.821–1.226 | −0.134 | 0.129 | 0.875 | 0.736–1.040 | |
| Sex | 0.057 | 0.814 | 1.059 | 0.659–1.701 | 0.057 | 0.803 | 1.059 | 0.677–1.657 | |
| MBP | −0.030 | 0.469 | 0.970 | 0.894–1.053 | −0.075 | 0.041 | 0.928 | 0.864–0.997 | |
| BMI | −0.019 | 0.520 | 0.981 | 0.925–1.041 | −0.054 | 0.038 | 0.948 | 0.901–0.997 | |
| HR | 0.020 | 0.152 | 1.020 | 0.993–1.048 | 0.570 | 1.008 | 0.980–1.036 | ||
| Model 3 | ePWV | 0.135 | 0.038 * | 1.145 | 1.007–1.301 | ||||
| Ct | 0.135 | <0.001 *** | 0.000044 | 0.000005–0.000400 | |||||
| Diabetes | 0.080 | 0.742 | 1.083 | 0.673–1.742 | |||||
| HR | 0.008 | 0.591 | 1.008 | 0.980–1.036 | |||||
| Model 2 | b | p | HR | 95% CI | |
| ePWV | 0.643 | 0.001 *** | 1.902 | 1.282–2.823 | |
| Ct | 0.135 | 0.031 * | 0.000007–0.000409 | 1.349–4.7283 | |
| Age | −0.079 | 0.011 ** | 0.924 | 0.869–0.982 | |
| Sex | −0.110 | 0.443 | 0.896 | 0.676–1.187 | |
| MBP | −0.050 | 0.001 *** | 0.951 | 0.924–0.979 | |
| BMI | −0.049 | 0.003 * | 0.953 | 0.923–0.983 | |
| HR | 0.015 | 0.080 | 1.016 | 0.998–1.033 |
Disclaimer/Publisher’s Note: The statements, opinions and data contained in all publications are solely those of the individual author(s) and contributor(s) and not of MDPI and/or the editor(s). MDPI and/or the editor(s) disclaim responsibility for any injury to people or property resulting from any ideas, methods, instructions or products referred to in the content. |
© 2024 by the authors. Licensee MDPI, Basel, Switzerland. This article is an open access article distributed under the terms and conditions of the Creative Commons Attribution (CC BY) license (https://creativecommons.org/licenses/by/4.0/).
Share and Cite
Prelević, V.; Blagus, L.; Bošnjak, V.; Radunović, D.; Marinović Glavić, M.; Premužić, V.; Kos, J.; Pećin, I.; Željković Vrkić, T.; Domislović, M.; et al. Estimated Pulse Wave Velocity and All-Cause and Cardiovascular Mortality in the General Population. J. Clin. Med. 2024, 13, 3377. https://doi.org/10.3390/jcm13123377
Prelević V, Blagus L, Bošnjak V, Radunović D, Marinović Glavić M, Premužić V, Kos J, Pećin I, Željković Vrkić T, Domislović M, et al. Estimated Pulse Wave Velocity and All-Cause and Cardiovascular Mortality in the General Population. Journal of Clinical Medicine. 2024; 13(12):3377. https://doi.org/10.3390/jcm13123377
Chicago/Turabian StylePrelević, Vladimir, Luka Blagus, Vito Bošnjak, Danilo Radunović, Mihaela Marinović Glavić, Vedran Premužić, Jelena Kos, Ivan Pećin, Tajana Željković Vrkić, Marija Domislović, and et al. 2024. "Estimated Pulse Wave Velocity and All-Cause and Cardiovascular Mortality in the General Population" Journal of Clinical Medicine 13, no. 12: 3377. https://doi.org/10.3390/jcm13123377