
Enteric Infection-Associated Reactive Arthritis: A Systematic Review and Meta-Analysis
 , , ,
, , ,  ,
,
Abstract
1. Introduction
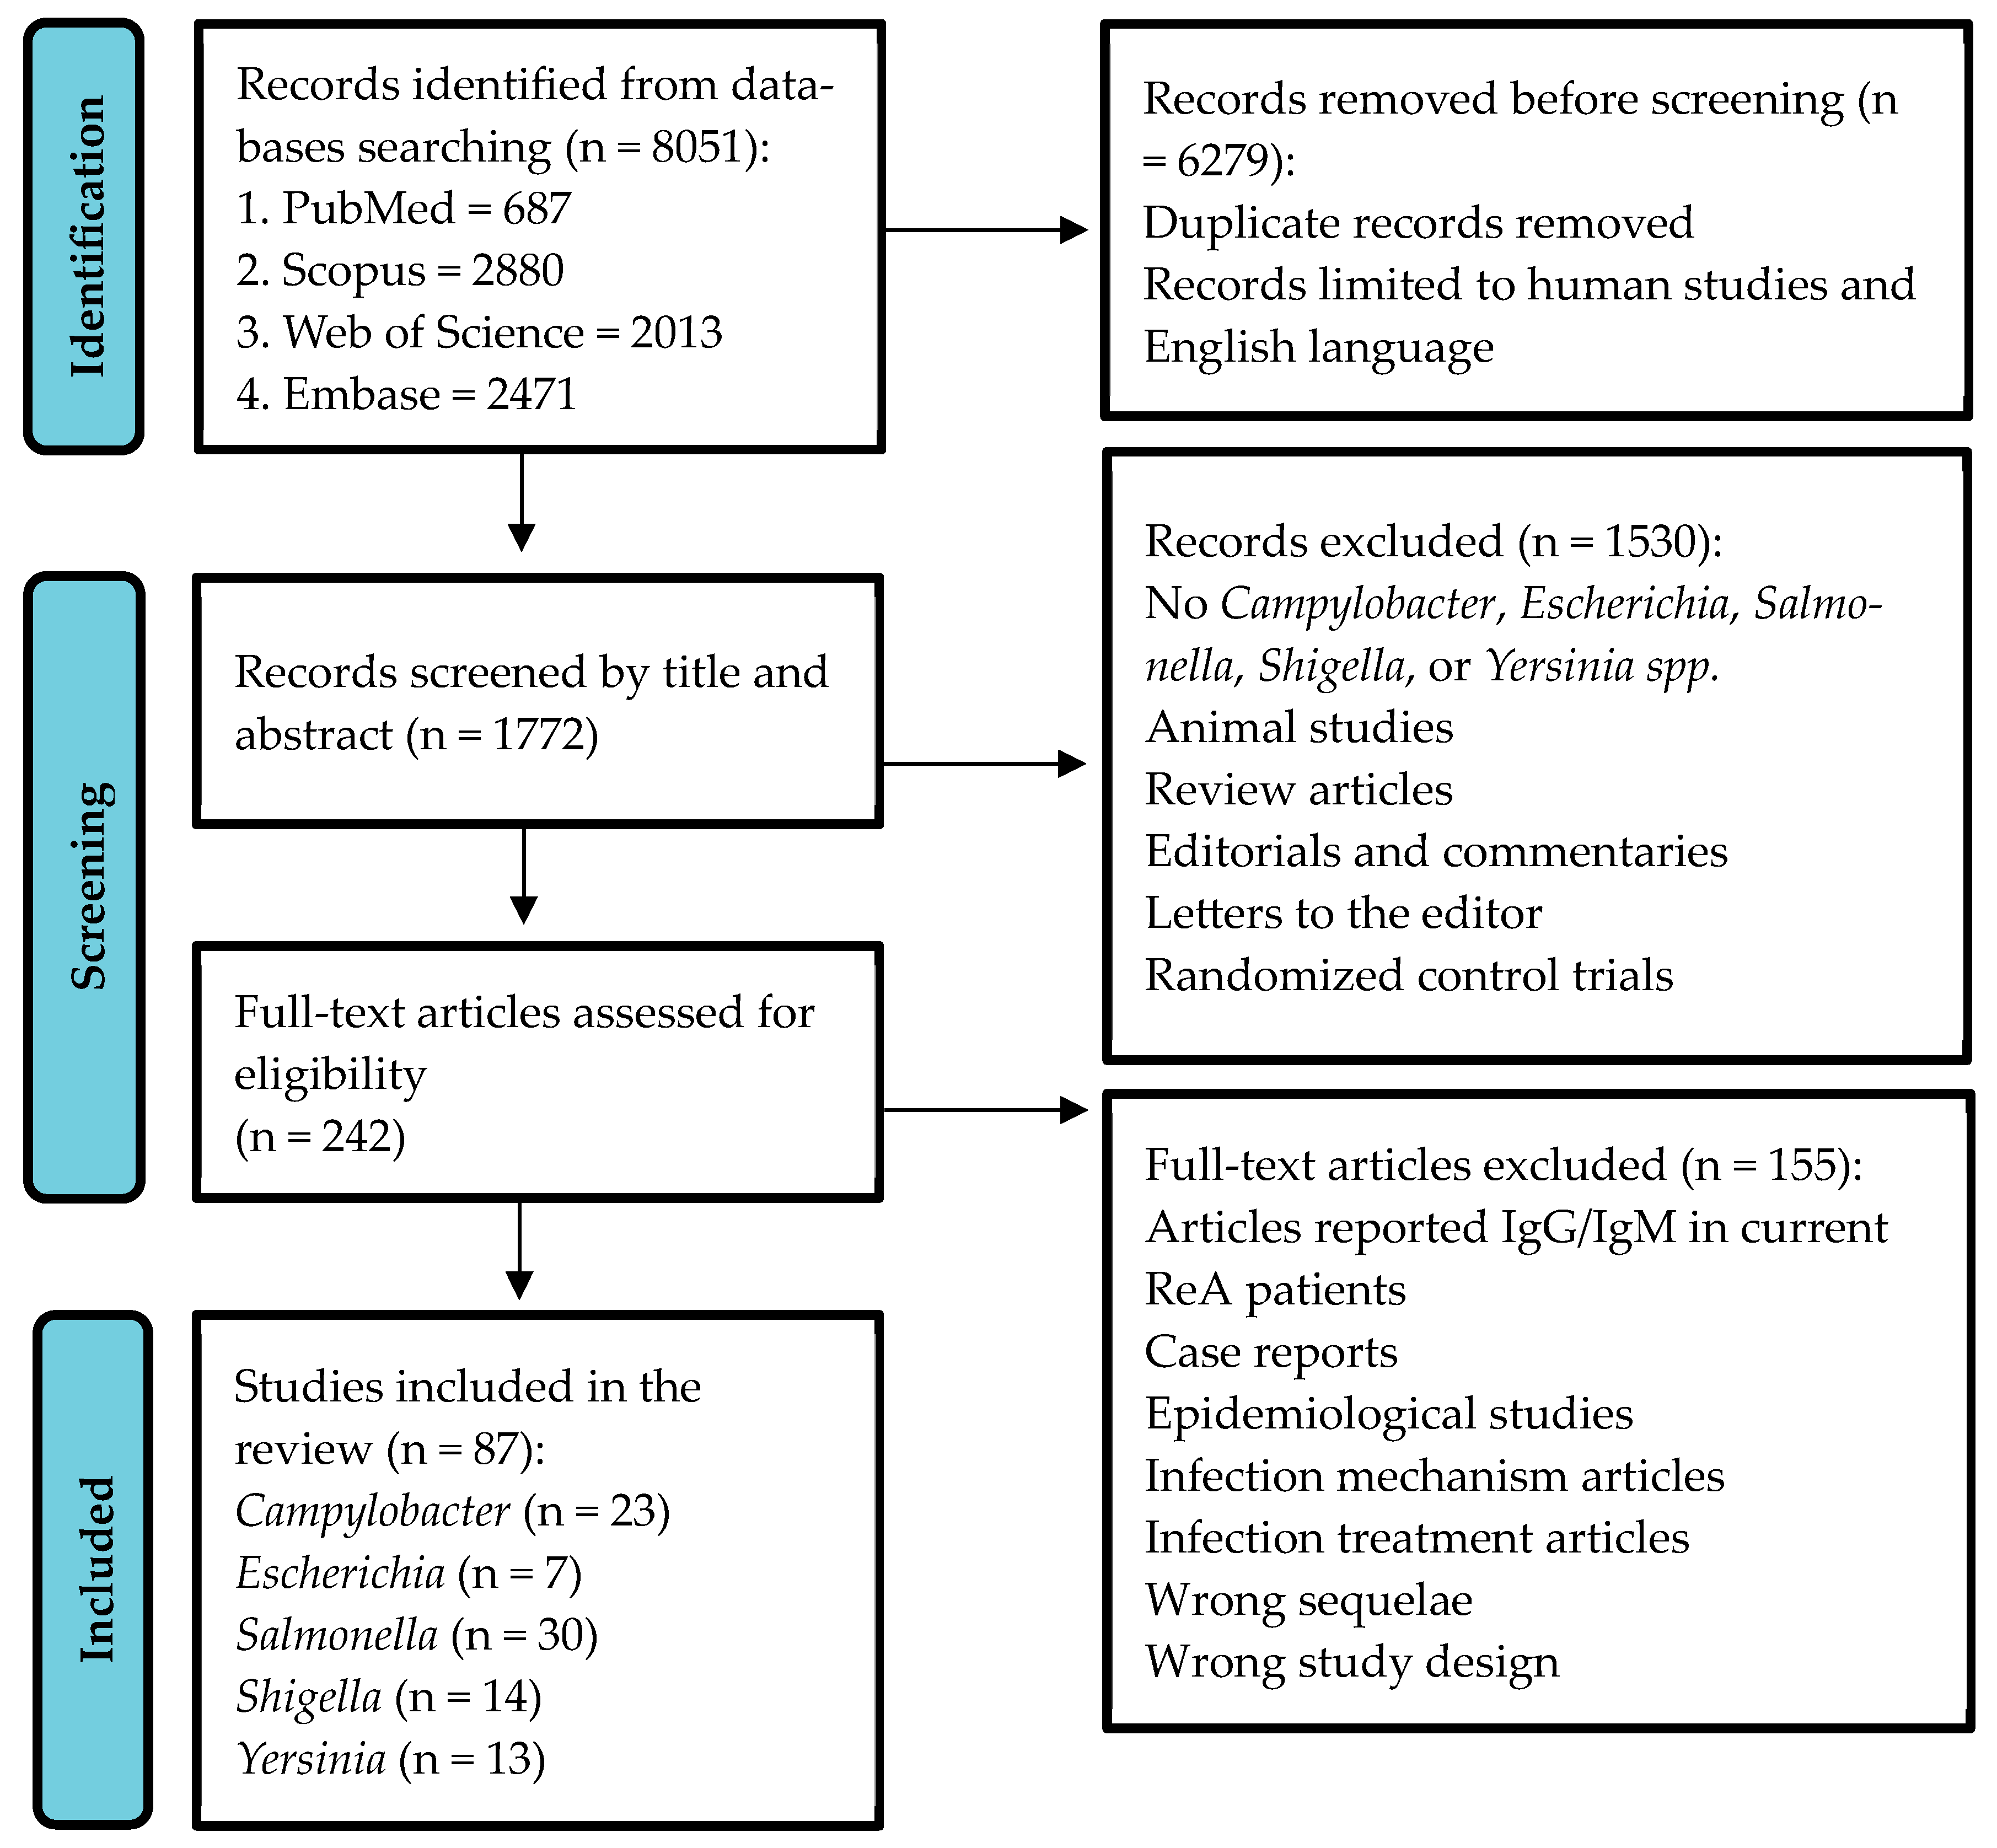
2. Materials and Methods
2.1. Search Strategy
2.2. Eligibility Criteria and Data Extraction
2.3. Meta-Analysis and Risk of Bias Assessment
3. Results
3.1. Campylobacter
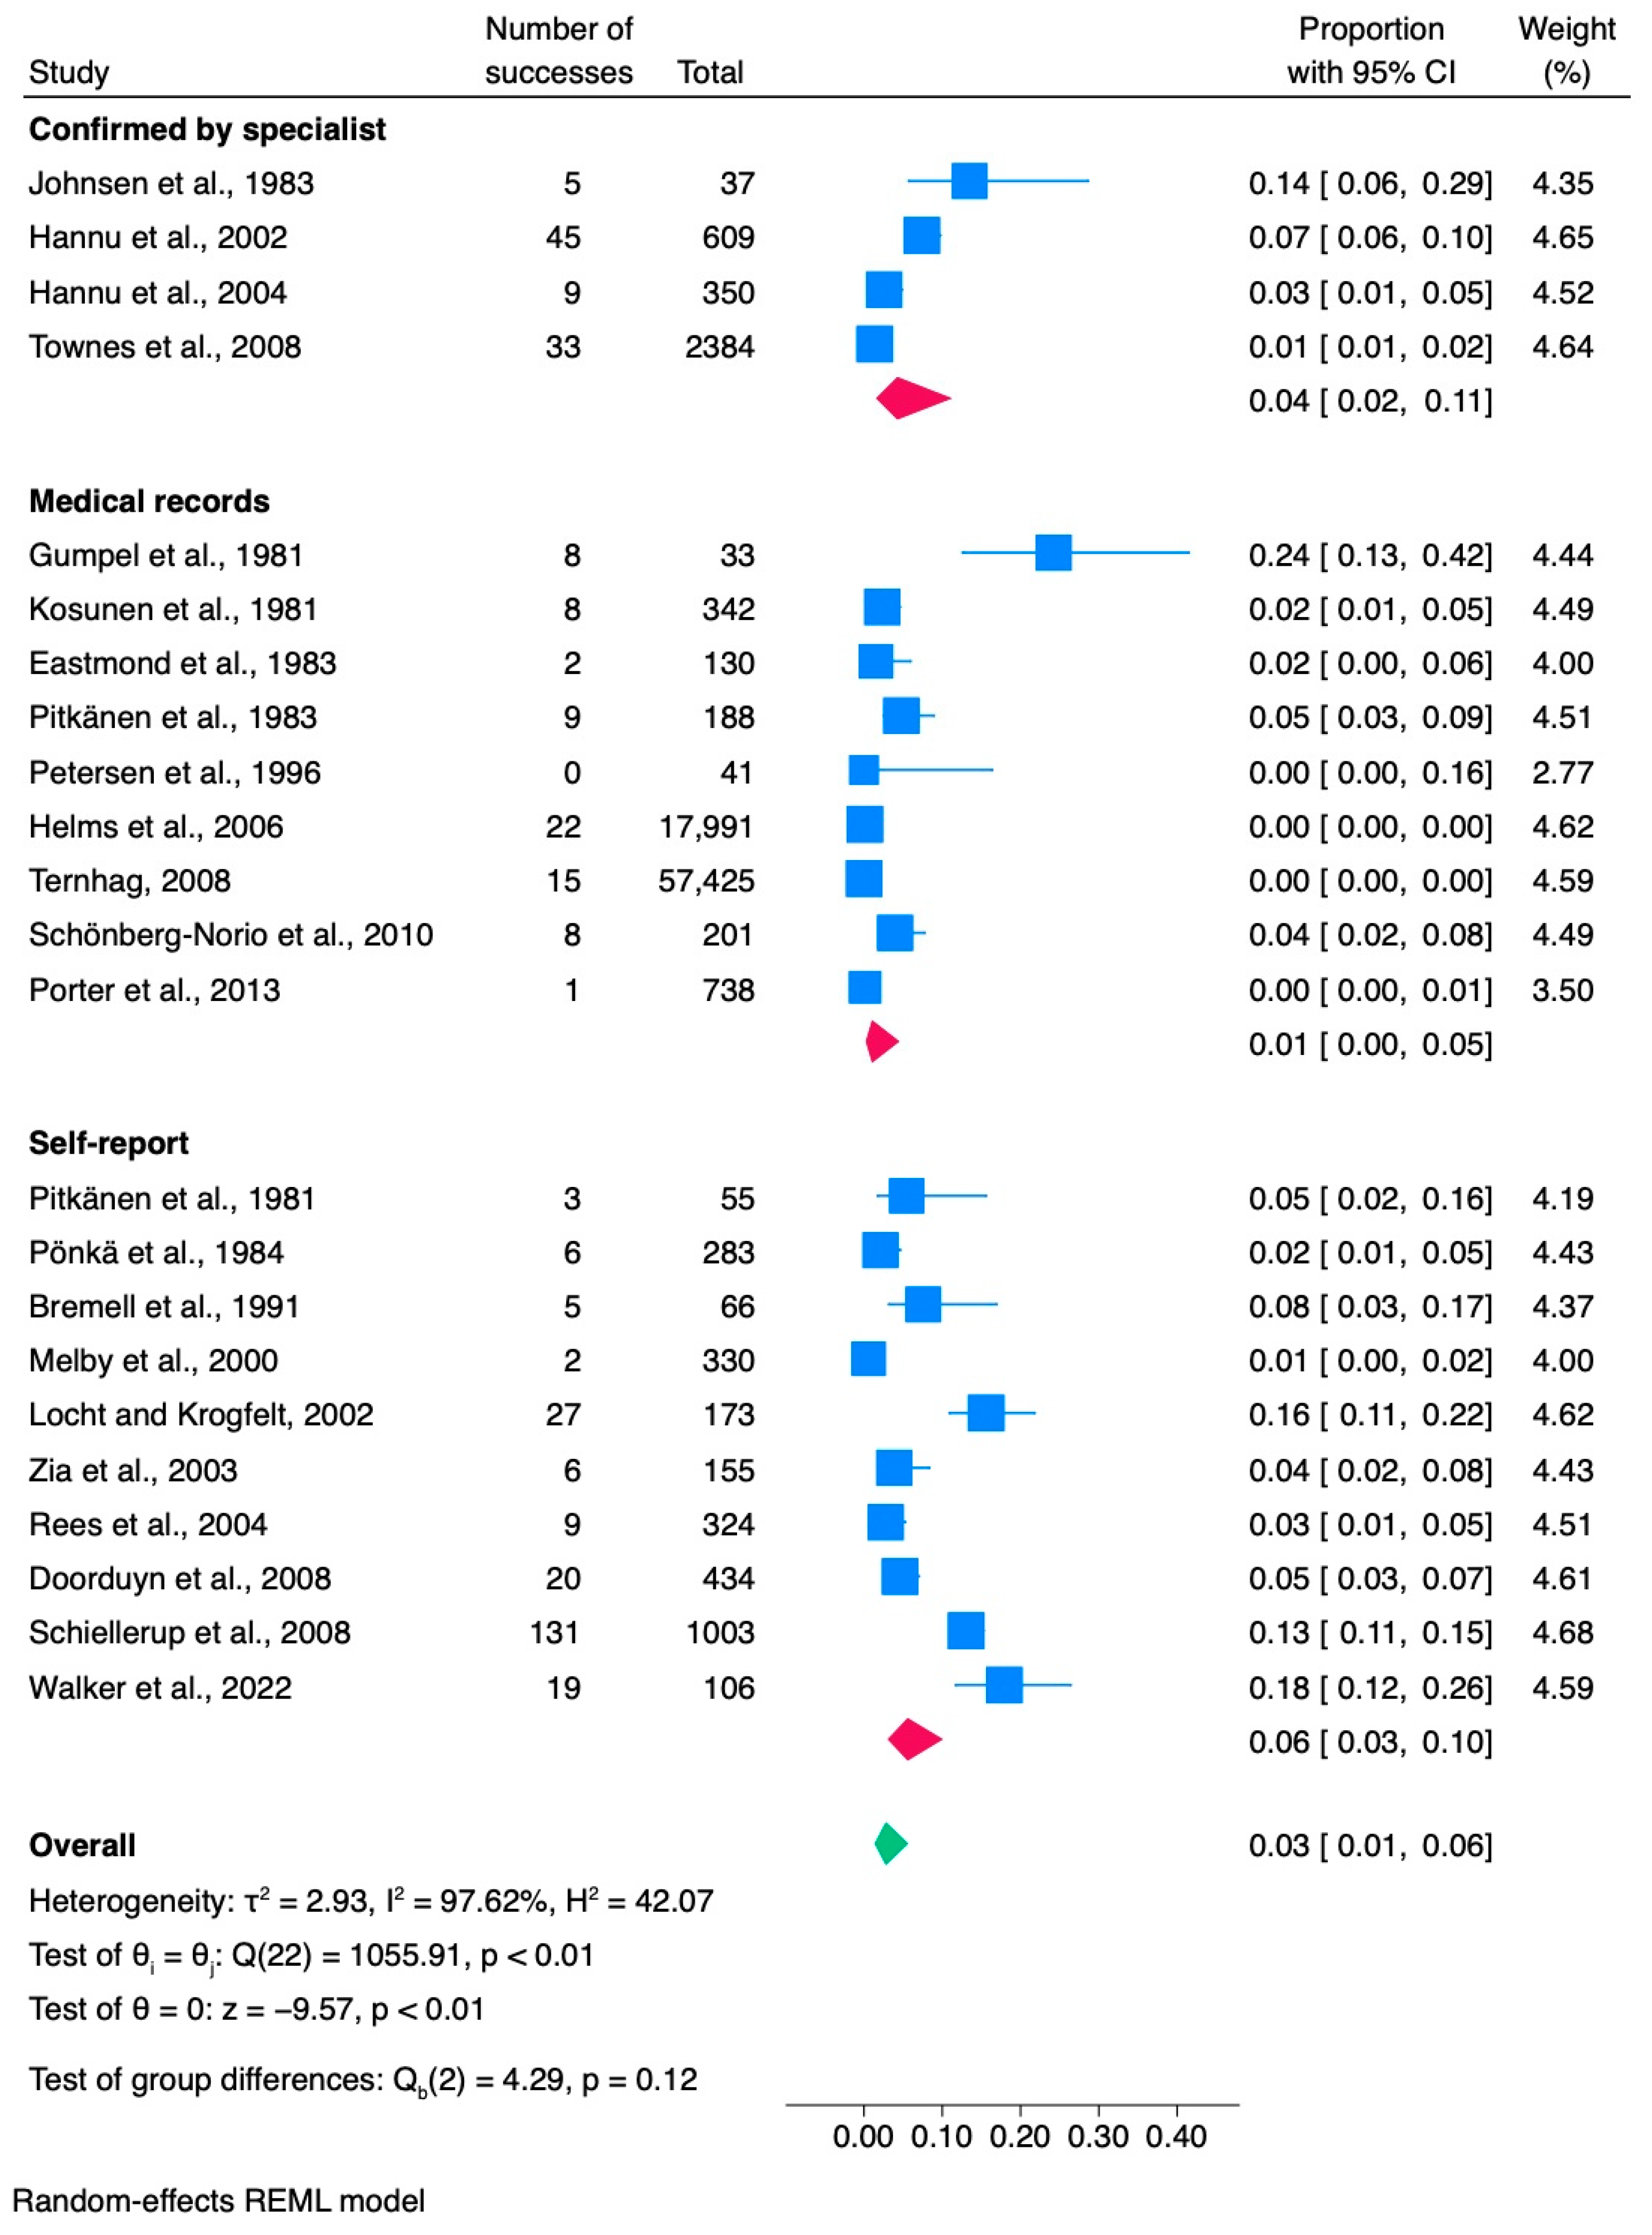
3.1.1. Meta-Analysis of Campylobacter Studies
3.1.2. Assessment of Publication Bias
3.1.3. Cumulative Analysis

| Source, First Author, Year | Country | Cohort Source | Species | Study Design | Study Duration | Mean Age (of Whole Cohort) | Subjects with Campylobacter Infection | Subjects Developed ReA | Proportion (%)/Occurrence | Campylobacteriosis Diagnosis | ReA Diagnosis | N of Women Developed ReA | N of HLA-B27 Positive |
|---|---|---|---|---|---|---|---|---|---|---|---|---|---|
| Bremell et al., 1991 [31] | Sweden | Foodborne outbreak | C. jejuni | Retrospective cohort | 1986–1987 | 26.9 | 66 | 5 | 7.6 | ELISA/stool culture | Self-report | 4/5 | 1/5 |
| Doorduyn et al., 2008 [32] | Netherlands | Population registry | Multiple | Case-control study | 2002–2003 | Median—60 | 434 | 20 | 4.6 | Stool culture | Self-report | 18/20 | N/D |
| Gumpel et al., 1981 [33] | UK | Patients’ records | Multiple | Prospective cohort | 1978 | 5–16; >16 | 33 | 8 | 24.2 | Stool culture | Medical records | N/D | N/D |
| Eastmond et al., 1983 [34] | Scotland | Foodborne outbreak | C. jejuni | Prospective cohort | 1979 | N/D | 130 | 2 | 0.8 | Stool culture | Medical records | 0/2 | 0/1 |
| Hannu et al., 2002 [35] | Finland | Campylobacter-positive subjects | C. coli, C. jejuni | Case-control study | 1997–1998 | 37.1 | 609 | 45 | 7.4 | Stool culture | Confirmed by specialist | 34/45 | 6/45 |
| Hannu et al., 2004 [36] | Finland | Waterborne outbreak | C. jejuni | Prospective cohort | 2000 | 58 | 350 | 9 | 2.6 | Enzyme immunoassay | Confirmed by specialist | 6/9 | 3/9 |
| Helms et al., 2006 [37] | Denmark | Three National registries | Multiple | Retrospective cohort | 1991–1999 | Median—26 | 17,991 | 22 | 0.1 | Stool culture | Medical records | N/D | N/D |
| Johnsen et al., 1983 [38] | Norway | Campylobacter-positive subjects | C. jejuni | Prospective cohort | 1980–1981 | N/D | 37 | 5 | 13.5 | Stool culture | Confirmed by specialist | 1/5 | 0/5 |
| Kosunen et al., 1981 [39] | Finland | Campylobacter-positive subjects | C. jejuni | Prospective cohort | 1978–1979 | N/D | 342 | 8 | 2.3 | Stool culture, agglutination test | Medical records | 2/8 | 5/7 |
| Locht and Krogfelt, 2002 [40] | Denmark | Campylobacter-positive subjects | C. coli, C. jejuni | Retrospective cohort | 1997–1999 | Median—36 | 173 | 27 | 15.6 | Stool culture/ELISA | Self-report | 17/27 | N/D |
| Melby et al., 2000 [41] | Norway | Waterborne outbreak | C. coli, C. jejuni | Retrospective cohort | 1988 | 40.9 | 330 | 2 | 0.6 | Stool culture | Self-report | N/D | N/D |
| Petersen et al., 1996 [42] | Denmark | Bacterial gastroenteritis patients | C. coli, C. jejuni | Retrospective cohort | 1991–1993 | Median—33 | 41 | 0 | 0 | Blood/stool culture | Medical records | 0 | N/D |
| Pitkänen et al., 1981 [43] | Finland | Diarrheal patients | C. jejuni | Retrospective cohort | 1978–1980 | 11–76 | 55 | 3 | 5.4 | Stool culture | Self-report | 1/2 | N/D |
| Pitkänen et al., 1983 [44] | Finland | Campylobacter-positive subjects | C. jejuni | Retrospective cohort | 1978–1981 | 0–89 | 188 | 9 | 4.8 | Stool culture | Medical records | N/D | N/D |
| Pönkä et al., 1984 [45] | Finland | Campylobacter-positive subjects | C. jejuni | Retrospective cohort | 1978–1981 | 0–70+ | 283 | 6 | 2.1 | Stool culture | Self-reported | N/D | N/D |
| Porter et al., 2013 [46] | USA | US military medical database | Multiple | Retrospective cohort | 1998–2009 | N/D | 738 | 1 | 0.13 | Positive culture | Medical records | N/D | N/D |
| Rees et al., 2004 [25] | USA | Active Surveillance Network | Multiple | Retrospective cohort | 1998–1999 | N/D | 324 | 9 | 2.8 | Laboratory-confirmed | Self-report | 6/9 | N/D |
| Schiellerup et al., 2008 [47] | Denmark | Campylobacter-positive subjects | Multiple | Prospective cohort | 2002–2003 | Median—40 | 1003 | 131 | 13.1 | Stool culture | Self-report | N/D | 12/91 |
| Schönberg-Norio et al., 2010 [48] | Finland | Campylobacter-positive patients | C. jejuni | Prospective cohort | 2002 | Median—50 | 201 | 8 | 4 | Stool culture | Medical records | 4/8 | N/D |
| Ternhag, 2008 [49] | Sweden | Patients with GI infections | Multiple | Retrospective cohort | 1997–2007 | 37 | 57,425 | 15 | 0.02 | Stool culture | Medical records | N/D | N/D |
| Townes et al., 2008 [6] | USA | Culture-confirmed infections | C. coli, C. jejuni | Prospective cohort | 2002–2004 | Median—35 | 2384 | 33 | 1.4 | Stool culture | Confirmed by specialist | 36/52 | 6/52 |
| Walker et al., 2022 [50] | New Zealand | Waterborne outbreak | Multiple | Retrospective cohort | 2016 | Median—47 | 106 | 19 | 17.9 | Stool culture | Self-report | 8/19 | N/D |
| Zia et al., 2003 [51] | UK | Culture-confirmed C. jejuni enteritis | C. jejuni | Retrospective cohort | 1999 | 47.7 | 155 | 6 | 3.9 | Stool culture | Self-report | N/D | N/D |
3.2. Escherichia
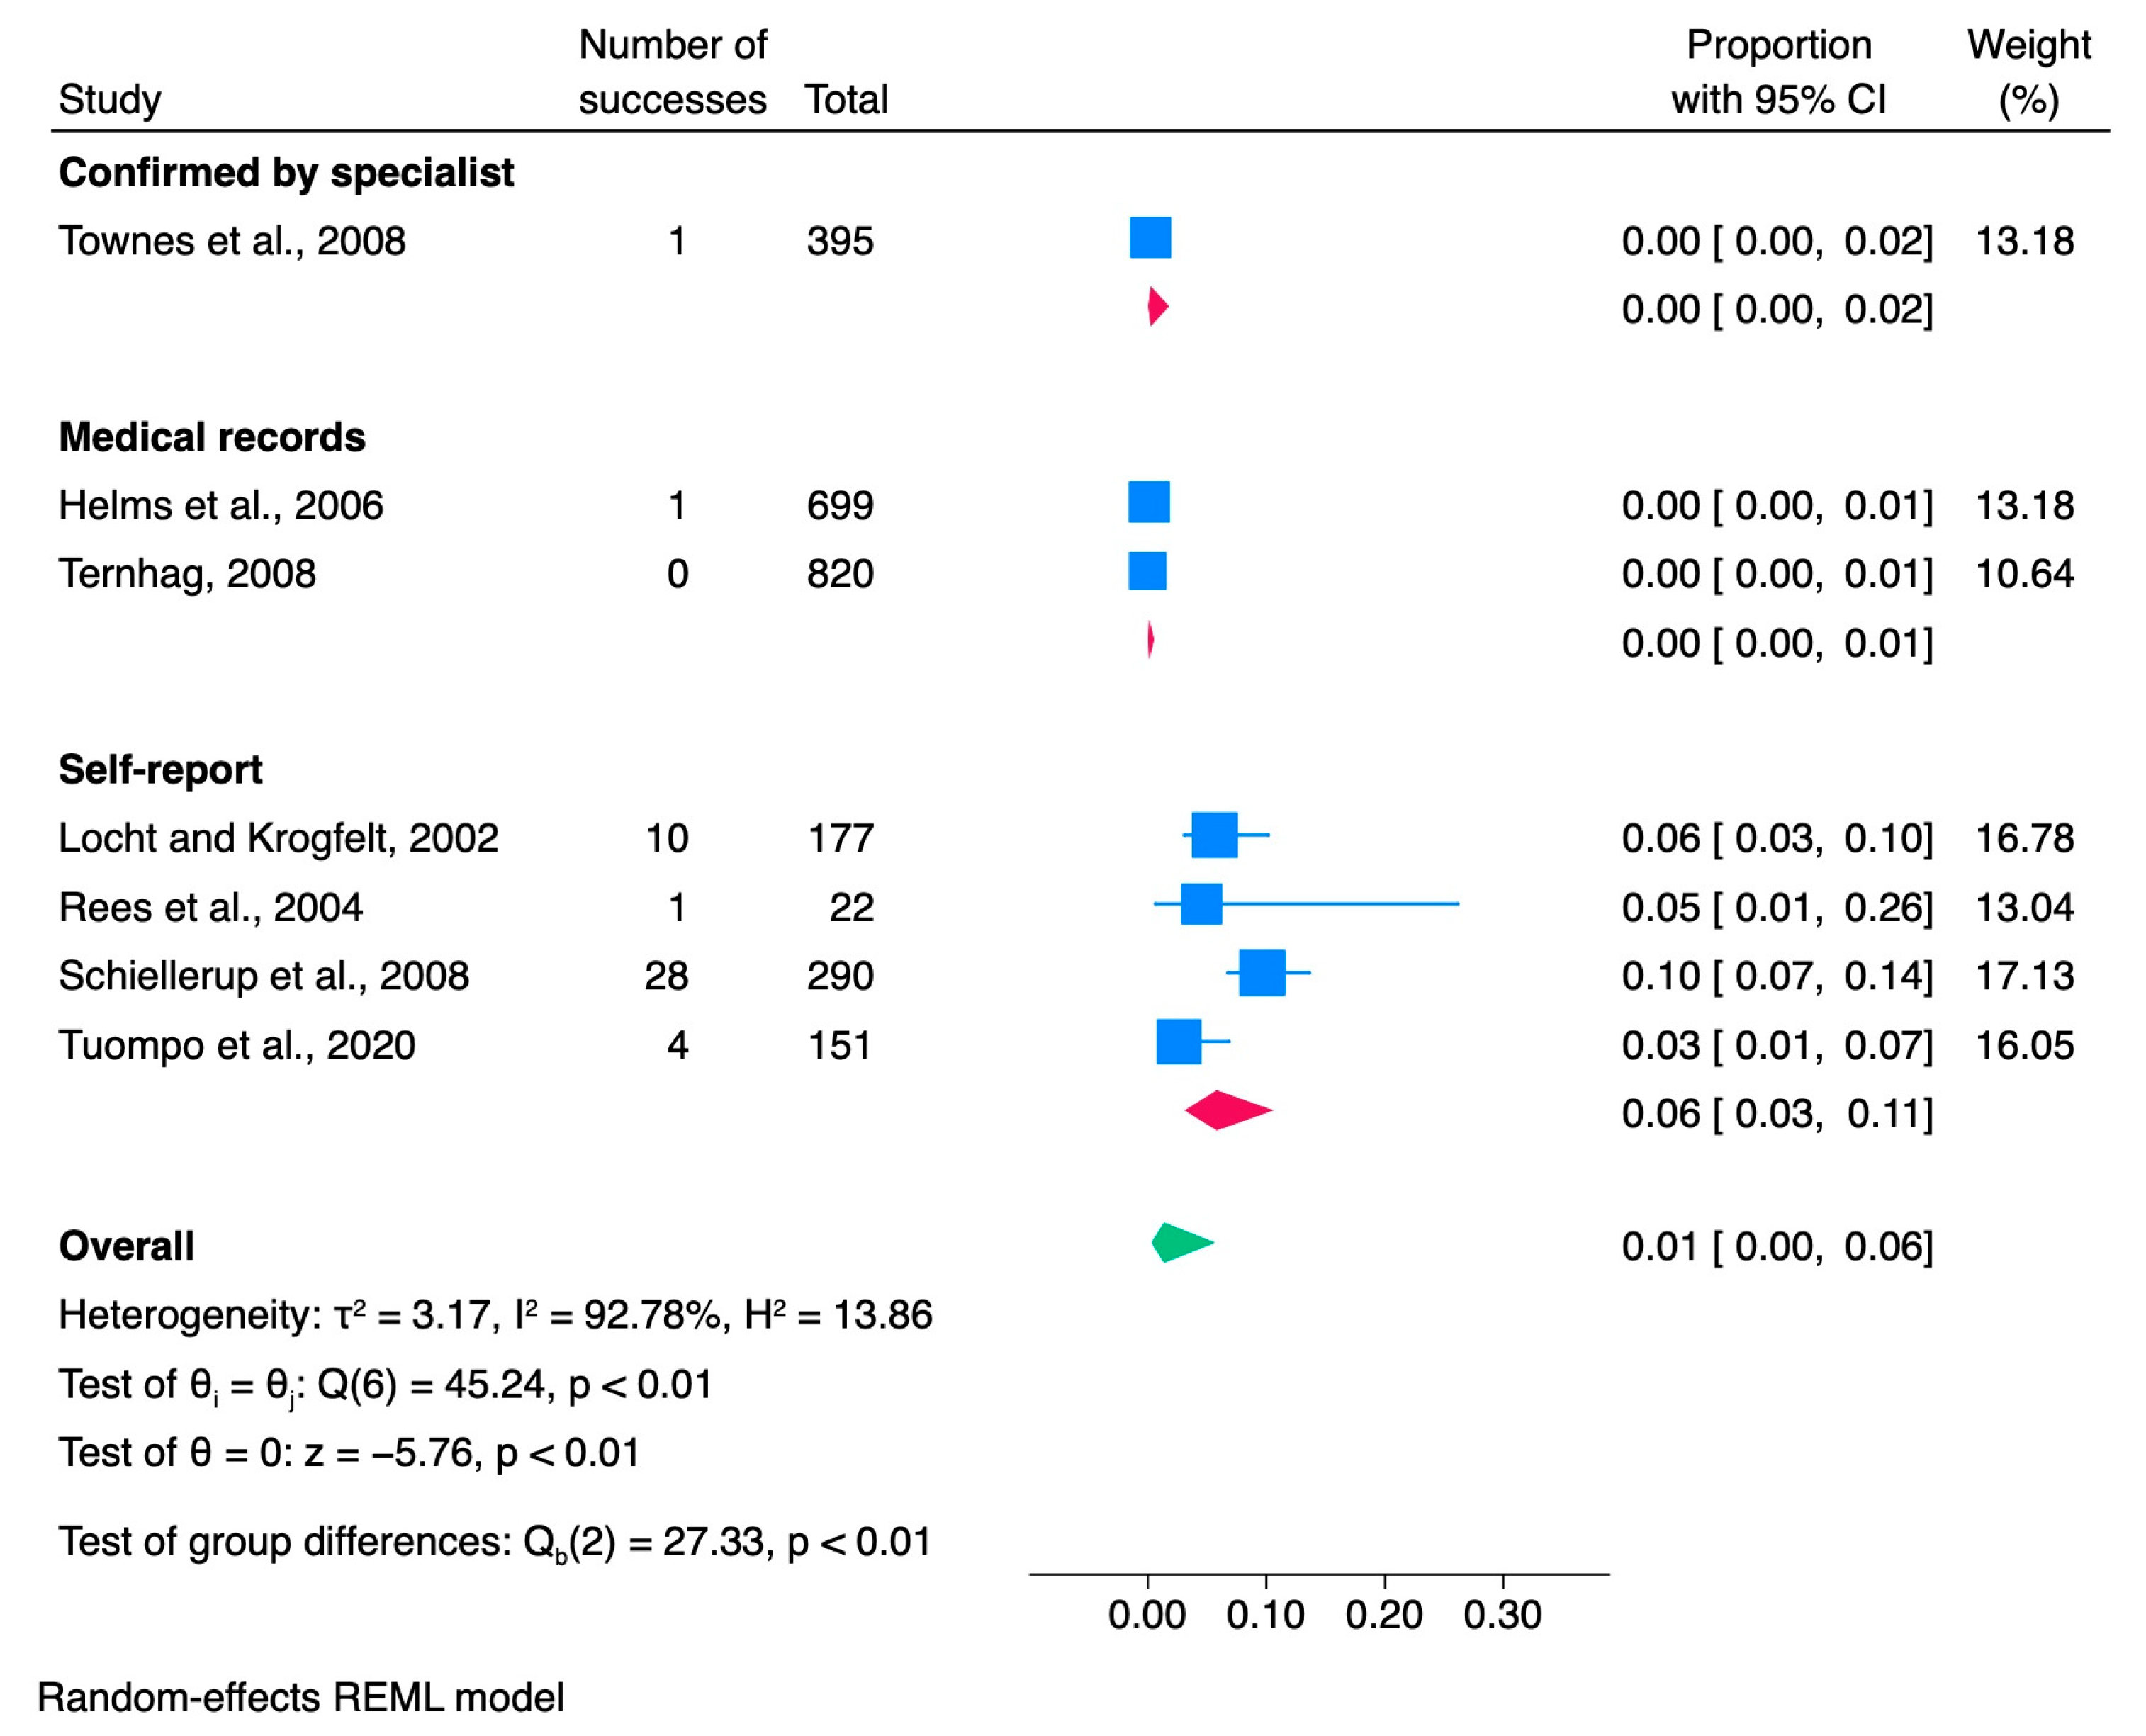
3.2.1. Meta-Analysis of Escherichia Studies
3.2.2. Assessment of Publication Bias
3.2.3. Cumulative Analysis
| Source, First Author, Year | Country | Cohort Source | Species | Study Design | Study Duration | Mean Age (of Whole Cohort) | Subjects with Escherichia Infection | Subjects Developed ReA | Proportion (%)/Occurrence | Escherichia Diagnosis | ReA Diagnosis | N of Women Developed ReA | N of HLA-B27 Positive |
|---|---|---|---|---|---|---|---|---|---|---|---|---|---|
| Helms et al., 2006 [37] | Denmark | 3 National registries | DEC 1 (EHEC 2, ETEC 3, EPEC 4, EIEC 5) | Retrospective cohort | 1991–1999 | Median—1 | 699 | 1 | 0.14 | Stool culture | Medical records | N/D | N/D |
| Locht and Krogfelt, 2002 [40] | Denmark | E. coli—positive subjects | DEC 1 (ETEC 3) | Retrospective cohort | 1997–1999 | Median—43 | 177 | 10 | 5.64 | Stool culture | Self-report | 5/10 | N/D |
| Rees et al., 2004 [25] | United States | Active Surveillance Network | DEC 1 (STEC 9, E. coli O157:H7) | Retrospective cohort | 1998–1999 | N/D | 22 | 1 | 4.5 | Laboratory-confirmed | Self-report | 1/1 | N/D |
| Schiellerup et al., 2008 [47] | Denmark | Escherichia—positive subjects | DEC 1 (ETEC 2, A/EEC 7, EPEC 4, VTEC 8) | Prospective cohort | 2002–2003 | Median—40 | 290 | 28 | 9.7 | Stool culture | Self-report | N/D | 2/20 |
| Ternhag, 2008 [49] | Sweden | Patients with GI infections | DEC 1(EHEC 2) | Retrospective cohort | 1997–2004 | F—25, M—19 | 820 | 0 | 0 | Stool culture | Medical records | N/D | N/D |
| Townes et al., 2008 [6] | United States | Culture-confirmed infections | DEC 1 (STEC 9, E. coli O157) | Prospective cohort | 2002–2004 | Median—15 | 395 | 1 | 0.2 | Stool culture | Confirmed by specialist | 26/52 | N/D |
| Tuompo et al., 2020 [53] | Finland | Travel Clinic Volunteers | DEC 1 (EHEC 2, ETEC 3, EPEC 4, EIEC 5, EAEC 6) | Prospective cohort | 2009–2010 | 39.5 | 151 | 4 | 2.6 | qPCR | Self-report | 3/4 | 0/4 |
3.3. Salmonella
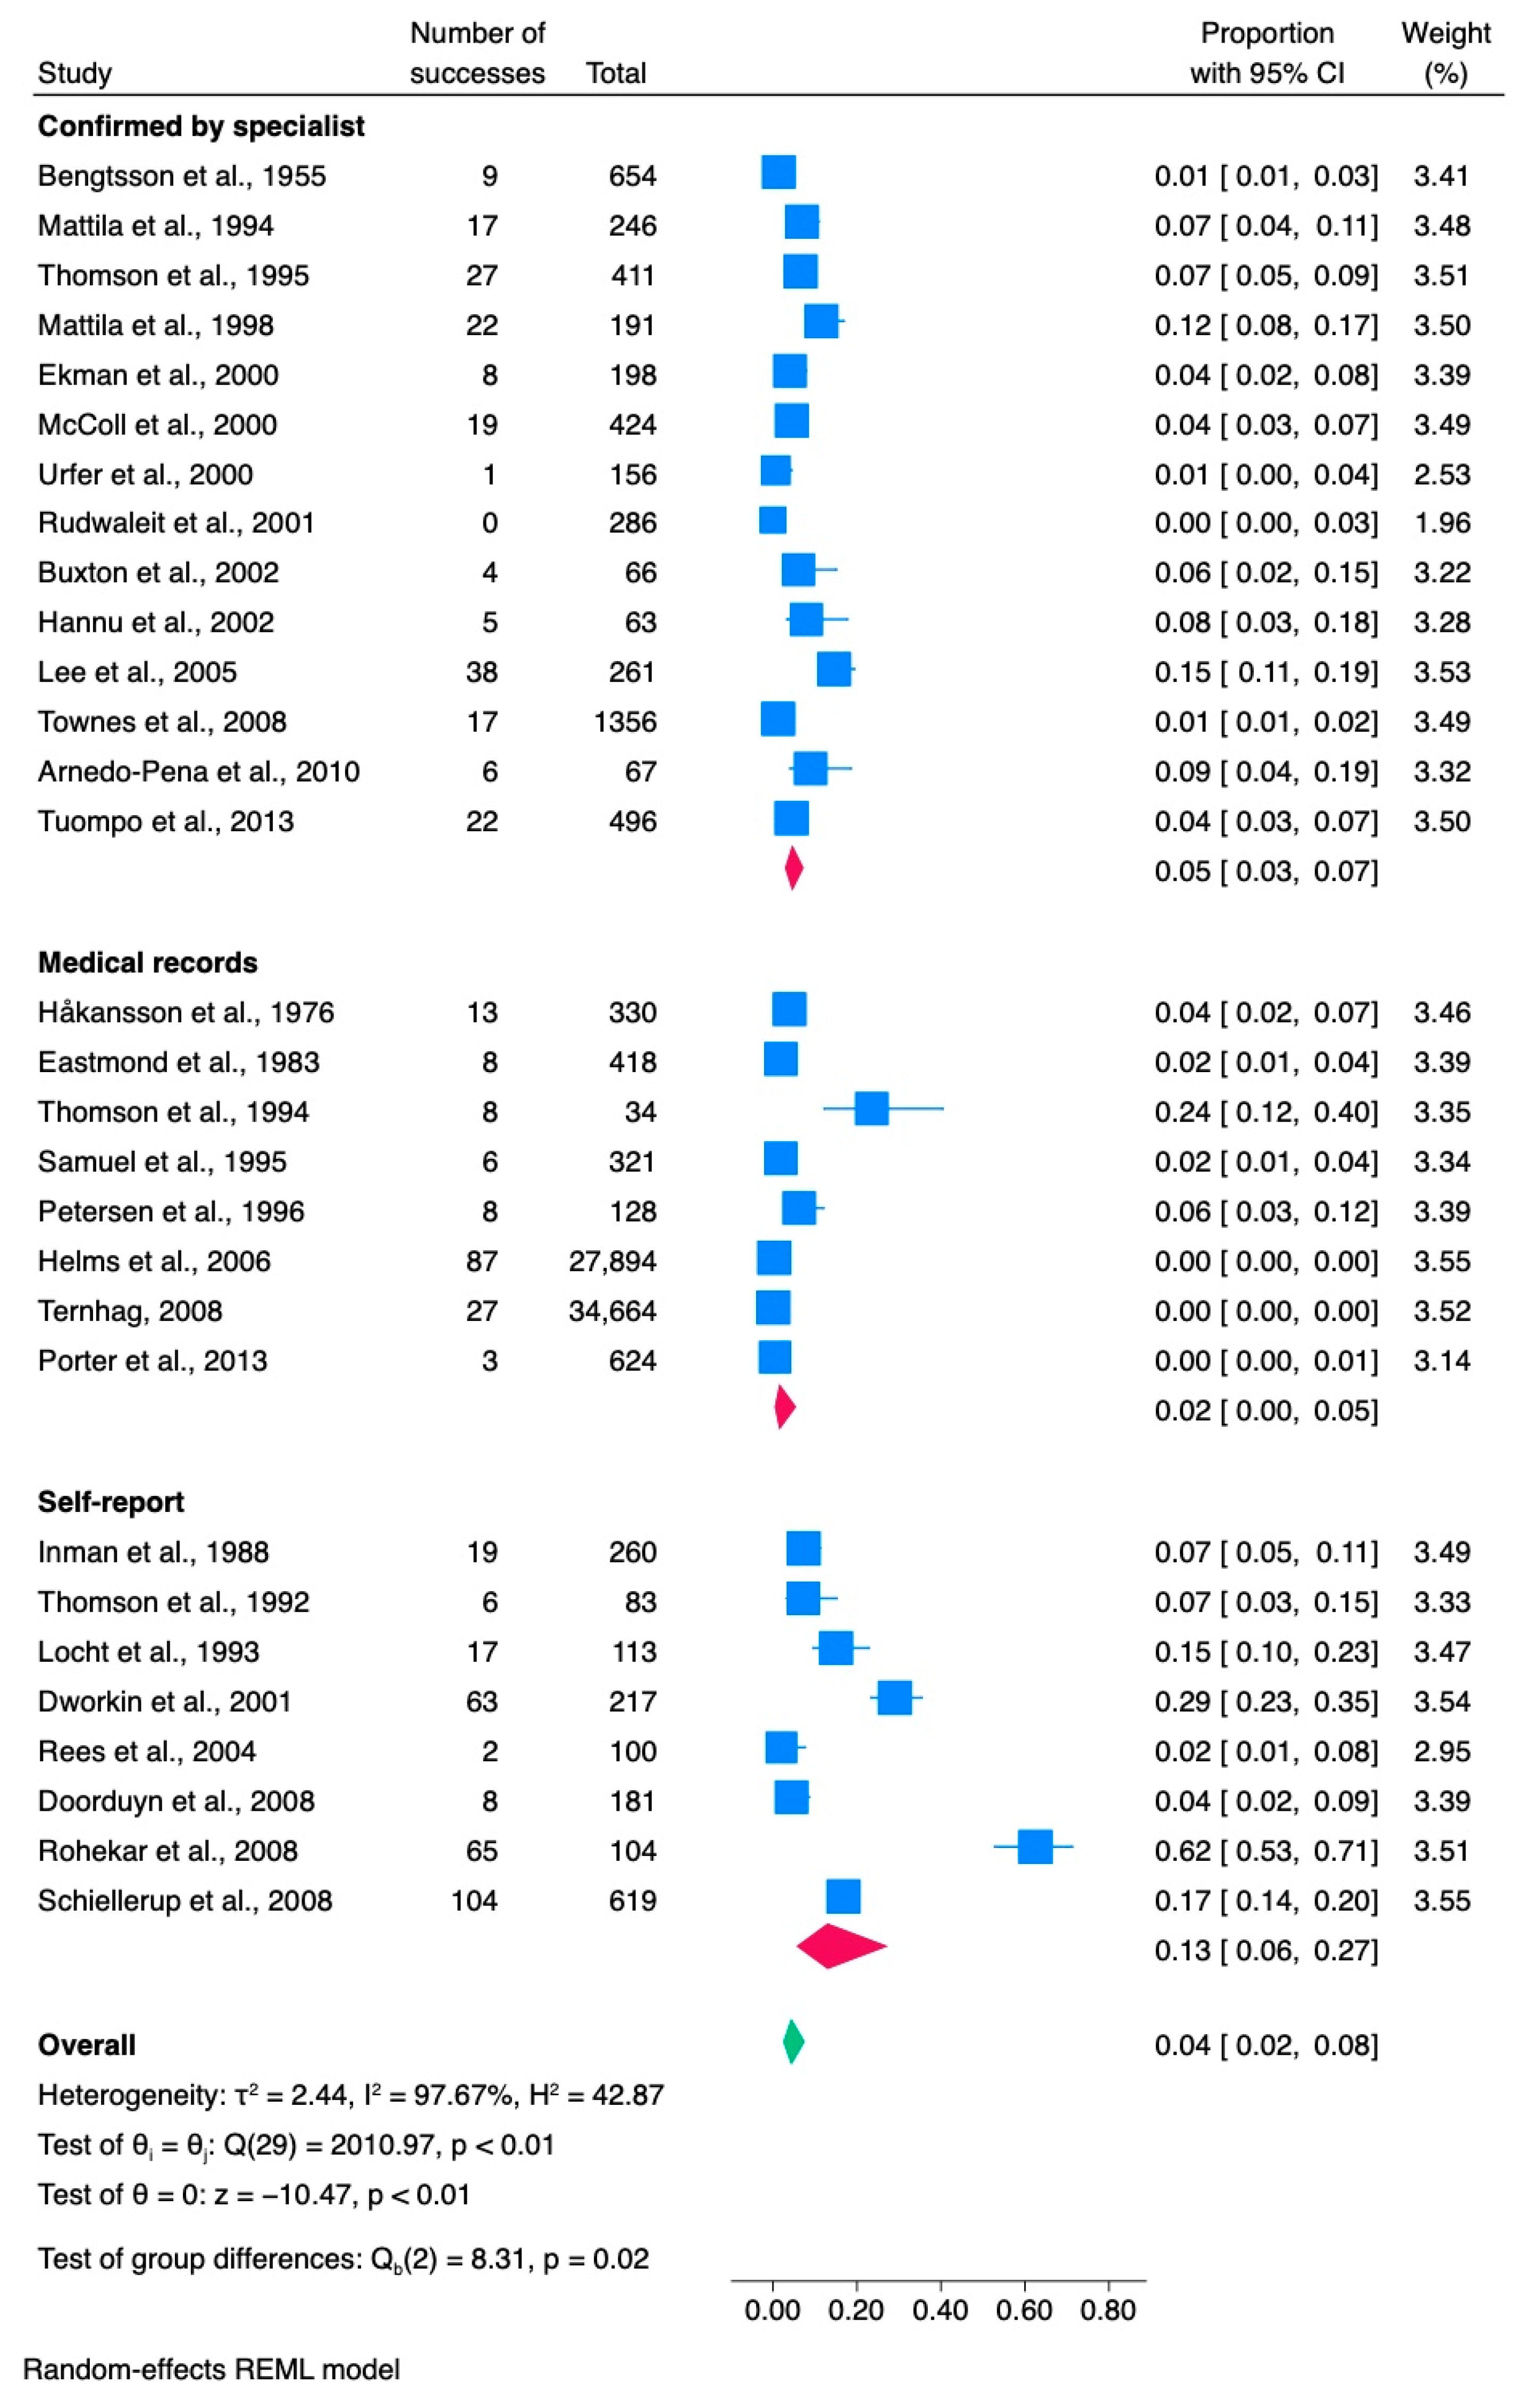
3.3.1. Meta-Analysis of Salmonella Studies
3.3.2. Assessment of Publication Bias
3.3.3. Cumulative Analysis
| Source, First Author, Year | Country | Cohort Source | Species | Study Design | Study Duration | Mean Age (of Whole Cohort) | Subjects with Salmonella Infection | Subjects Developed ReA | Proportion (%)/Occurrence | Salmonellosis Diagnosis | ReA Diagnosis | N of Women Developed ReA | N of HLA-B27 Positive |
|---|---|---|---|---|---|---|---|---|---|---|---|---|---|
| Arnedo-Pena et al., 2010 [55] | Spain | Foodborne outbreak | S. hadar | Prospective cohort | 2005 | 34.5 | 67 | 6 | 9 | Stool culture | Confirmed by specialist | 1/6 | N/D |
| Bengtsson et al., 1955 [56] | Sweden | Foodborne outbreak | S. typhimurium | Retrospective cohort | 1953–1955 | N/D | 654 | 9 | 1.3 | Stool culture, agglutination test | Confirmed by specialist | 3/9 | N/D |
| Buxton et al., 2002 [57] | Canada | S. Typhimurium—confirmed cases | S. typhimurium | Case-control study | 1999–2000 | N/D | 66 | 4 | 6 | Stool culture | Confirmed by specialist | 1/4 | N/D |
| Doorduyn et al., 2008 [32] | Netherlands | Population registry | S. enteritidis, S. typhimurium | Case-control study | 2002–2003 | N/D | 181 | 8 | 4.4 | Stool culture | Self-report | 7/8 | N/D |
| Dworkin et al., 2001 [58] | United States | Foodborne outbreak | S. enteritidis | Retrospective cohort | 1994 | Median—35 | 217 | 63 | 29 | Diarrhea | Self-report | N/D | N/D |
| Eastmond et al., 1983 [33] | Scotland | Foodborne outbreak | S. typhimurium | Prospective cohort | 1981 | N/D | 418 | 8 | 1.9 | Stool culture | Medical records | 3/8 | 3/8 |
| Ekman et al., 2000 [59] | Finland | Salmonella—infected patients | S. enteritidis, S. hadar, S. typhimurium, S. infantis, S. stanley | Prospective cohort | 1998–1999 | 39.1 | 198 | 8 | 4 | Stool culture | Confirmed by specialist | 4/8 | 6/8 |
| Håkansson et al., 1976 [60] | Sweden | Salmonellosis outbreak | S. typhimurium | Retrospective cohort | 1974 | Range 17–61 | 330 | 13 | 3.9 | N/D | Medical records | 4/13 | 9/13 |
| Hannu et al., 2002 [35] | Finland | Salmonellosis outbreak | S. typhimurium | Retrospective cohort | 1999 | Median—30.7 | 63 | 5 | 7.9 | Stool culture | Confirmed by specialist | 3/5 | 2/4 |
| Helms et al., 2006 [37] | Denmark | 3 National registries | S. enteritidis, S. typhimurium | Retrospective cohort | 1991–1999 | Median—34 | 27,894 | 87 | 0.3 | Stool culture | Medical records | N/D | N/D |
| Inman et al., 1988 [61] | Canada | Foodborne outbreak | S. typhimurium | Retrospective cohort | 1984 | 39.3 | 260 | 19 | 7.3 | Stool culture | Self-report | 0/19 | 4/11 |
| Lee et al., 2005 [62] | Australia | Foodborne outbreak | S. typhimurium | Retrospective cohort | 1999–2001 | 15 | 261 | 38 | 14.6 | Stool culture | Confirmed by specialist | N/D | 5/30 |
| Locht et al., 1993 [63] | Sweden | Foodborne outbreak | S. enteritidis | Retrospective cohort | 1990 | F—49.4, M—52.6 | 113 | 17 | 15 | Stool culture | Self-report | 8/17 | N/D |
| Mattila et al., 1994 [64] | Finland | Foodborne outbreak | S. enterica | Prospective cohort | 1992 | Median—14 | 246 | 17 | 6.9 | Stool culture, enzyme immunoassay | Confirmed by specialist | 15/17 | 4/13 |
| Mattila et al., 1998 [65] | Finland | Foodborne outbreak | S. bovismorbificans | Retrospective cohort | 1994 | Median—32 | 191 | 22 | 11.5 | Stool culture, enzyme immunoassay | Confirmed by specialist | 15/22 | 10/22 |
| McColl et al., 2000 [66] | Australia | Foodborne outbreak | S. typhimurium | Retrospective cohort | 1997 | 28 | 424 | 19 | 4.5 | Stool culture | Confirmed by specialist | 11/19 | 2/19 |
| Petersen et al., 1996 [42] | Denmark | Bacterial gastroenteritis patients | S. paratyphi, S. typhi, S. enteriditis | Retrospective cohort | 1991–1993 | Median—33 | 128 | 8 | 5.9 | Blood/stool culture | Medical records | N/D | N/D |
| Porter et al., 2013 [46] | United States | US Department of Defense medical database | Multiple | Retrospective cohort | 1998–2009 | N/D | 624 | 3 | 0.5 | Positive culture | Medical records | N/D | N/D |
| Rees et al., 2004 [25] | United States | Active Surveillance Network | Multiple | Retrospective cohort | 1998–1999 | N/D | 100 | 2 | 2 | Laboratory-confirmed | Self-report | 0/2 | N/D |
| Rohekar et al., 2008 [54] | Canada | Foodborne outbreak | S. enteriditis | Prospective cohort | 2005 | 46 | 104 | 65 | 62.5 | Stool culture | Self-report | N/D | 5/37 |
| Rudwaleit et al., 2001 [67] | Germany | Salmonella-positive subjects | S. enteriditis | Retrospective cohort | 1998 | Range (11 months—9 years) | 286 | 0 | 0 | Stool culture | Confirmed by specialist | 0 | 0 |
| Samuel et al., 1995 [68] | United States | Foodborne outbreak | S. typhimurium | Retrospective cohort | 1993 | N/D | 321 | 6 | 1.8 | Stool culture | Medical records | N/D | 3/5 |
| Schiellerup et al., 2008 [47] | Denmark | Salmonella-positive subjects | S. typhimurium, S. enteritidis; other | Prospective cohort | 2002–2003 | Median—40 | 619 | 104 | 16.8 | Stool culture | Self-report | N/D | 19/86 |
| Ternhag, 2008 [49] | Sweden | Patients with GI infections | Nontyphoidal Salmonella spp. (S. enteritidis, S. typhimurium, S. virchow, S. hadar, and others) | Retrospective cohort | 1997–2004 | F—37, M—36 | 34,664 | 27 | 0.08 | Stool culture | Medical records | N/D | N/D |
| Thomson et al., 1992 [69] | Canada | Foodborne outbreak | S. heidelberg, S. hadar, S. thomson | Case–control study | 1992 | 40.6 | 83 | 6 | 7.2 | Immunoblotting/ELISA | Self-report | 5/6 | 0/6 |
| Thomson et al., 1994 [70] | Canada | Foodborne outbreak | S. enteritidis | Case–control study | 1990–1992 | N/D | 29 | 8 | 27.5 | Stool culture/ELISA | Medical records | 3/8 | 3/8 |
| Thomson et al., 1995 [71] | Foodborne outbreak | S. typhimurium | Retrospective cohort | 1989 | 39 | 411 | 27 | 6.3 | Stool culture | Confirmed by specialist | N/D | 6/27 | |
| Townes et al., 2008 [6] | United States | Culture-confirmed infections | S. typhimurium, S. enteritidis, S. newport, S. Heidelberg, and others | Prospective cohort | 2002–2004 | Median—29 | 1356 | 17 | 1.25 | Stool culture | Confirmed by specialist | N/D | N/D |
| Tuompo et al., 2013 [72] | Finland | Salmonella-positive subjects | S. typhimurium, S. enteritidis, S. paratyphi, and others | Prospective cohort | 2003–2005 | 40.5 | 496 | 22 | 4.4 | Stool culture | Confirmed by specialist | 9/22 | 5/12 |
| Urfer et al., 2000 [73] | Switzerland | Foodborne outbreak | S. braenderup | Retrospective cohort | 1993–1994 | Median—32 | 156 | 1 | 0.6 | Stool culture | Confirmed by specialist | 1/1 | N/D |
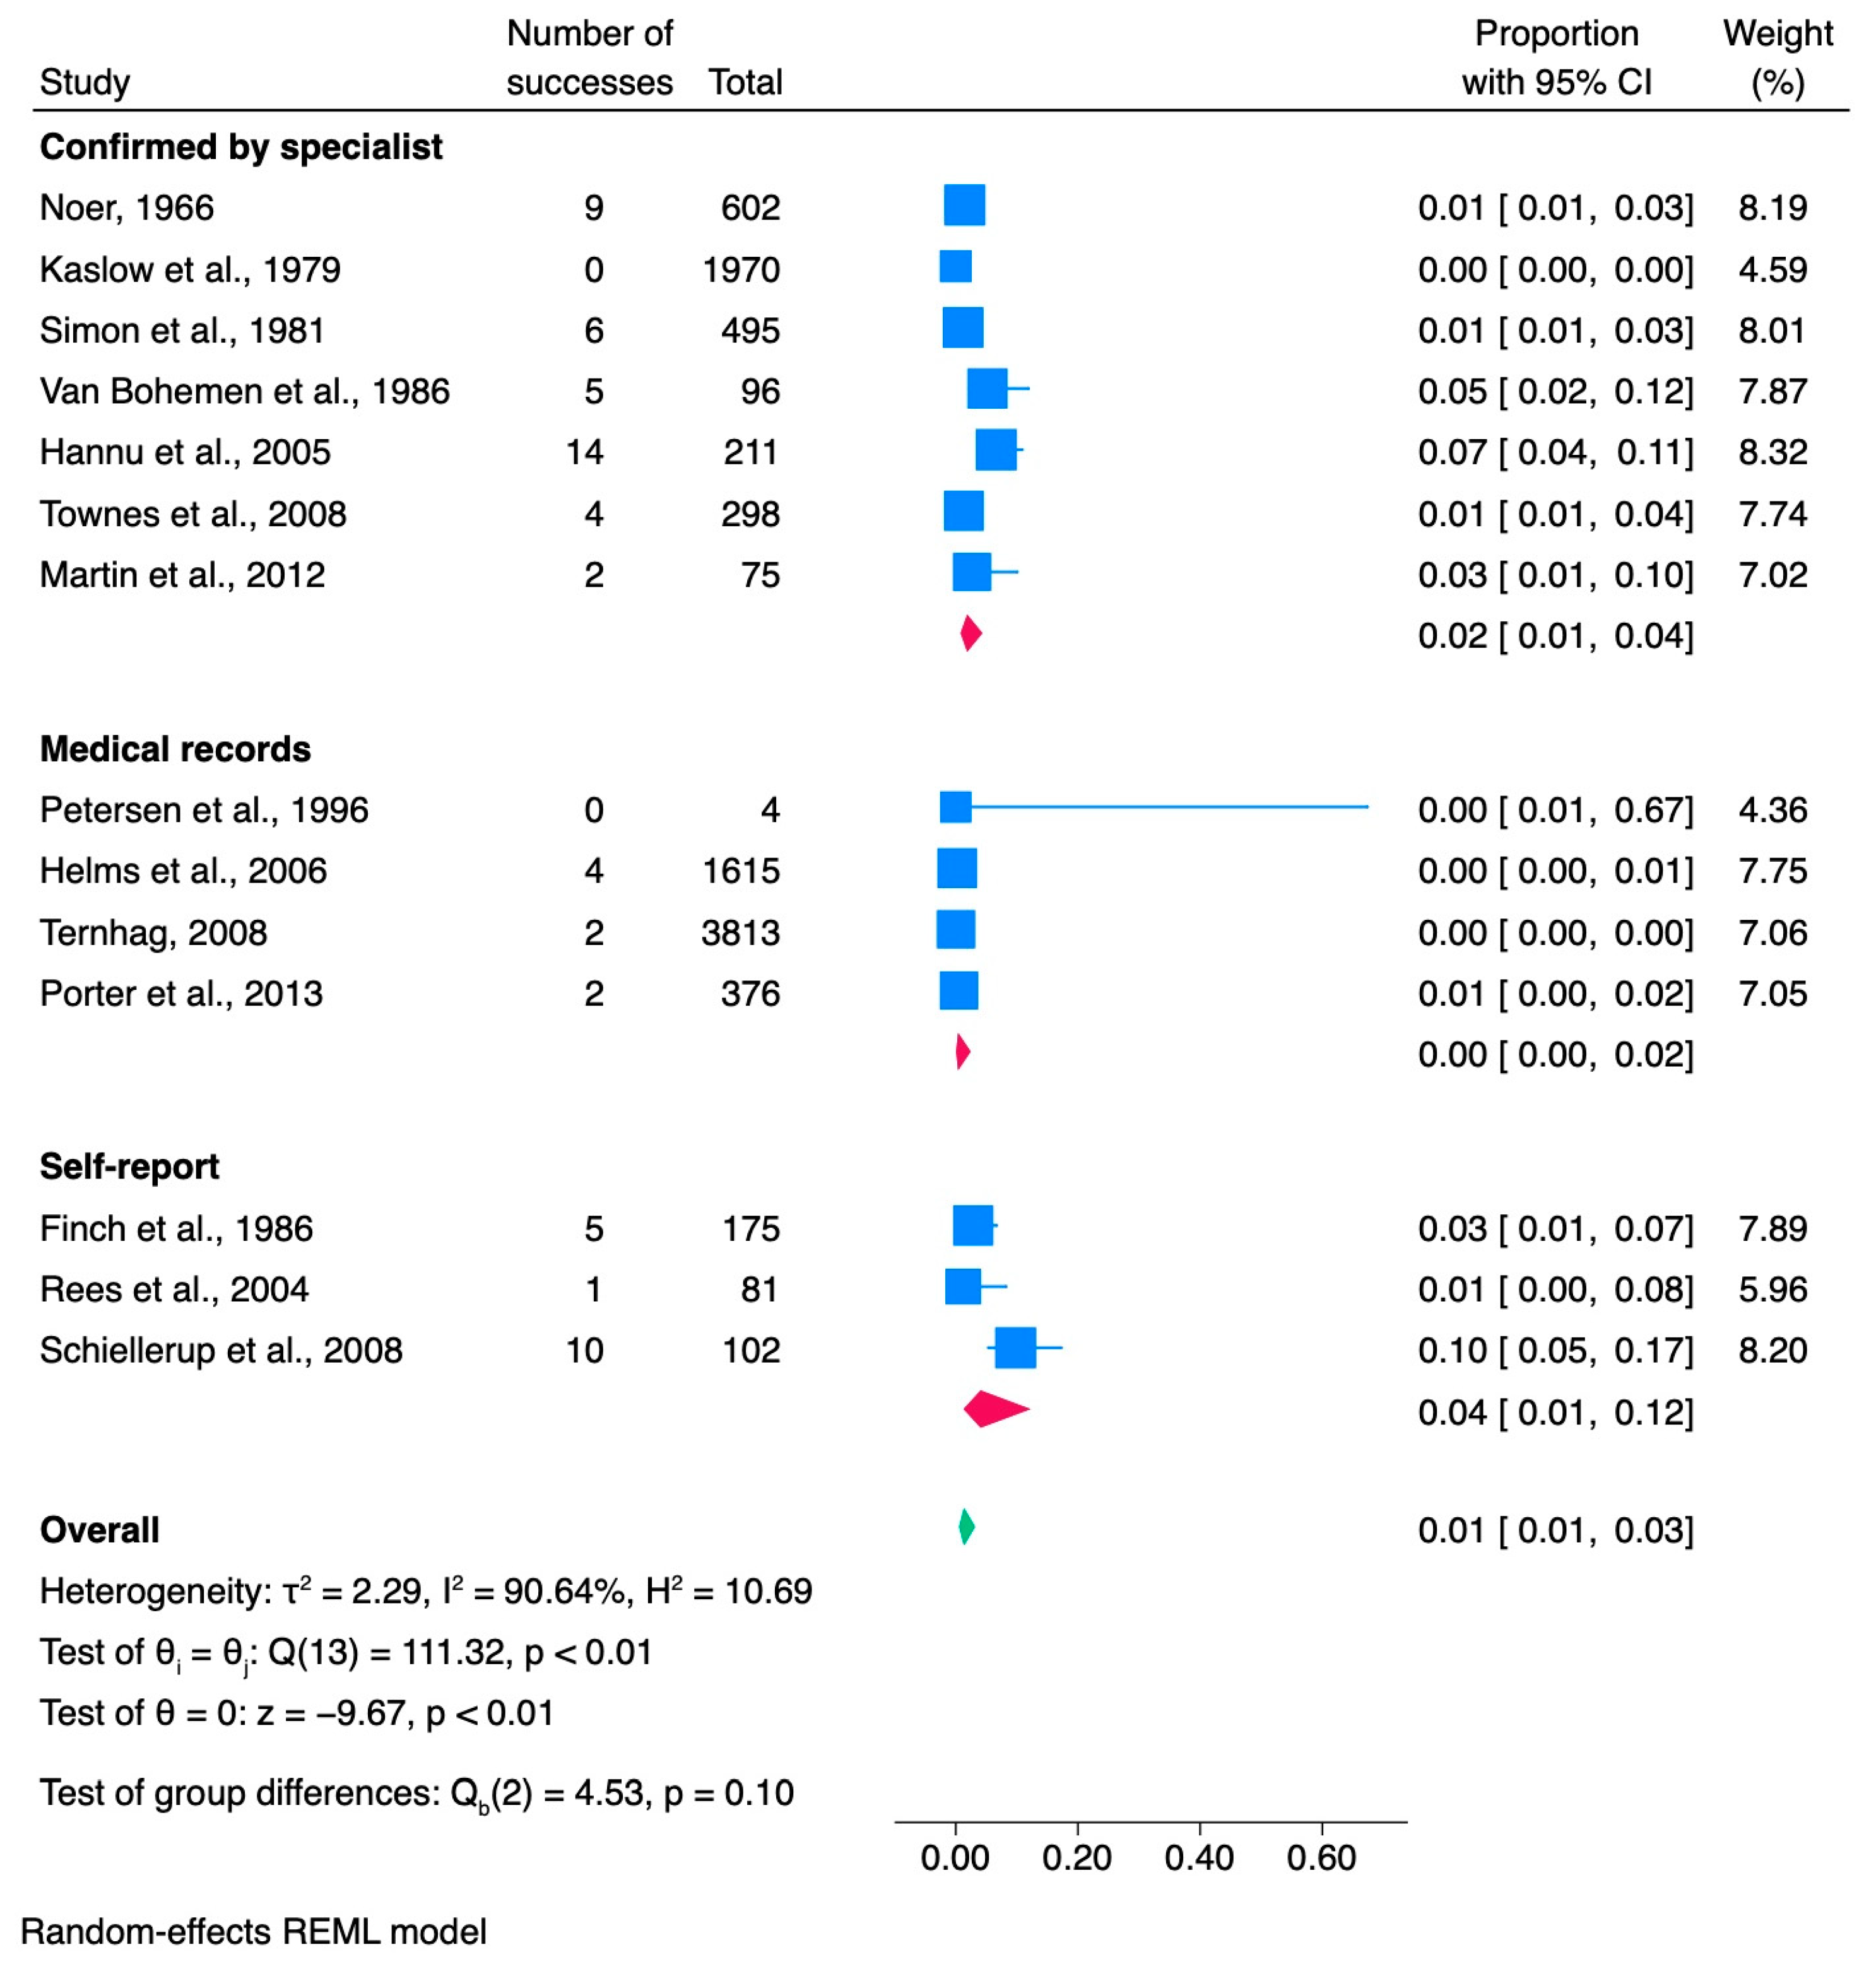
3.4. Shigella
3.4.1. Meta-Analysis of Shigella Studies
3.4.2. Assessment of Publication Bias
3.4.3. Cumulative Analysis
| Source, First Author, Year | Country | Cohort Source | Species | Study Design | Study Duration | Mean Age (of Whole Cohort) | Subjects with Shigella Infection | Subjects Developed ReA | Proportion (%)/Occurrence | Shigellosis Diagnosis | ReA Diagnosis | N of Women Developed ReA | N of HLA-B27 Positive |
|---|---|---|---|---|---|---|---|---|---|---|---|---|---|
| Finch et al., 1986 [74] | United States | Foodborne outbreak | S. flexneri | Prospective cohort | 1982 | N/D | 175 | 5 | 2.8 | Stool culture | Self-report | 2/5 | 4/5 |
| Hannu et al., 2005 [75] | Finland | Shigella—positive subjects | S. sonnei, S. flexneri, S. dysenteriae, S. boydii | Case—control study | 1996–2000 | 37.8 | 211 | 14 | 6.6 | Stool culture | Self-report/Confirmed by specialist | 9/14 | 5/14 |
| Helms et al., 2006 [37] | Denmark | 3 National registries | Multiple | Retrospective cohort | 1991–1999 | Median—29 | 1615 | 4 | 0.24 | Stool culture | Medical records | N/D | N/D |
| Kaslow et al., 1979 [76] | Puerto Rico | Large outbreak in local community | S. sonnei | Prospective cohort | 1979 | N/D | 1970 | 0 | 0 | Stool culture | Confirmed by specialist | 0 | 0 |
| Martin et al., 2012 [77] | Afghanistan | Foodborne outbreak | Multiple | Prospective cohort | 2011 | N/D | 75 | 2 | 2.66 | Stool culture | Confirmed by specialist | 0/2 | 1/2 |
| Noer, 1966 [78] | United States | Foodborne outbreak | Multiple | Retrospective cohort | 1962 | N/D | 602 | 9 | 1.5 | Stool culture | Confirmed by specialist | 0/9 | N/D |
| Petersen et al., 1996 [42] | Denmark | Bacterial gastroenteritis patients | S. sonnei | Retrospective cohort | 1991–1993 | Median—33 | 4 | 0 | 0 | Blood/stool culture | Medical records | N/D | N/D |
| Porter et al., 2013 [46] | United States | US Department of Defense medical database | Multiple | Retrospective cohort | 1998–2009 | N/D | 376 | 2 | 0.5 | Positive culture | Medical records | N/D | N/D |
| Rees et al., 2004 [25] | United States | Active Surveillance Network | Multiple | Retrospective cohort | 1998–1999 | N/D | 81 | 1 | 1.2 | Laboratory-confirmed | Self-report | 1/1 | N/D |
| Schiellerup et al., 2008 [47] | Denmark | Shigella—positive subjects | S. sonnei, S. flexneri, other | Prospective cohort | 2002–2003 | Median—40 | 102 | 10 | 9.8 | Stool culture | Self-report | (M/F 36.4%/63.6%) | 2/6 |
| Simon et al., 1981 [79] | United States | 3 foodborne outbreaks | S. sonnei, S. flexneri | Prospective cohort | 1978 | N/D | 495 | 6 | 1.2 | Stool culture | Confirmed by specialist | 6/6 | 5/6 |
| Ternhag, 2008 [49] | Sweden | Patients with GI infections | Multiple | Retrospective cohort | 1997–2004 | 33 | 3813 | 2 | 0.05 | Stool culture | Medical records | N/D | N/D |
| Townes et al., 2008 [6] | United States | Culture-confirmed infections | S. sonnei, S. flexneri, S. boydii, S. dysenteriae | Prospective cohort | 2002–2004 | Median—21 | 298 | 4 | 1.3 | Stool culture | Confirmed by specialist | N/D | N/D |
| van Bohemen et al., 1986 [80] | The Netherlands | Foodborne outbreak | S. flexneri | Retrospective cohort | 1985 | Range 10–100 | 96 | 5 | 5.2 | Stool culture | Confirmed by specialist | N/D | 5/5 |
3.5. Yersinia
3.5.1. Meta-Analysis of Yersinia Studies
3.5.2. Assessment of Publication Bias
3.5.3. Cumulative Analysis
| Source, First Author, Year | Country | Cohort Source | Species | Study Design | Study Duration | Mean Age (of Whole Cohort) | Subjects with Yersinia Infection | Subjects Developed ReA | Proportion (%)/Occurrence | Yersiniosis Diagnosis | ReA Diagnosis | N of Women Developed ReA | N of HLA-B27 Positive |
|---|---|---|---|---|---|---|---|---|---|---|---|---|---|
| Hannu et al., 2003 [81] | Finland | Foodborne outbreak | Y. pseudotuberculosis | Retrospective cohort | 1998 | 24.7 | 33 | 4 | 12.1 | Stool culture | Self-report | 2/4 | 3/3 |
| Helms et al., 2006 [37] | Denmark | 3 National registries | Y. enterocolitica | Retrospective cohort | 1991–1999 | Median—4.3 | 3922 | 16 | 0.4 | Stool culture | Medical records | N/D | N/D |
| Huovinen et al., 2010 [82] | Finland | Yersinia—positive subjects | Y. enterocolitica | Case—control study | 2006 | 32 | 61 | 6 | 9.8 | Stool culture | Self-report | N/D | N/D |
| Petersen et al., 1996 [42] | Denmark | Bacterial gastroenteritis patients | Y. enterocolitica | Retrospective cohort | 1991–1993 | Median—33 | 27 | 2 | 7.4 | Blood/stool culture | Medical records | N/D | N/D |
| Porter et al., 2013 [46] | United States | US Department of Defense medical database | Y. enterocolitica | Retrospective cohort | 1998–2009 | N/D | 17 | 0 | 0 | Positive culture | Medical records | 0 | 0 |
| Rees et al., 2004 [25] | United States | Active Surveillance Network | Multiple | Retrospective cohort | 1998–1999 | N/D | 8 | 0 | 0 | Laboratory-confirmed | Self-report | 0 | 0 |
| Rosner et al., 2013 [83] | Germany | Foodborne outbreak | Y. enterocolitica | Case—control study | 2009–2010 | 8 | 351 | 41 | 11.7 | Stool culture | Self-report | N/D | N/D |
| Schiellerup et al., 2008 [47] | Denmark | Yersinia—positive subjects | Y. enterocolitica, other | Prospective cohort | 2002–2003 | Median—40 | 91 | 21 | 23 | Stool culture | Self-report | N/D | 4/18 |
| Ternhag, 2008 [49] | Sweden | Patients with GI infections | Y. enterocolitica | Retrospective cohort | 1997–2004 | F—28, M—27 | 5133 | 9 | 0.2 | Stool culture | Medical records | N/D | N/D |
| Tertti et al., 1984 [84] | Finland | Unknown etiology outbreak | Y. pseudotuberculosis | Retrospective cohort | 1981–1982 | 23 | 19 | 4 | 21 | Stool culture | Confirmed by specialist | 1/4 | 3/4 |
| Tertti et al., 1989 [85] | Finland | Foodborne outbreak | Y. pseudotuberculosis | Retrospective cohort | 1987–1988 | 9 | 34 | 1 | 2.9 | Stool culture | Self-report | 0/1 | 1/1 |
| Townes et al., 2008 [6] | United States | Culture-confirmed infections | Multiple | Prospective cohort | 2002–2004 | Median—31 | 35 | 1 | 2.8 | Stool culture | Confirmed by specialist | N/D | N/D |
| Vasala et al., 2014 [86] | Finland | Foodborne outbreak | Y. pseudotuberculosis | Retrospective cohort | 2008 | Median—49 | 37 | 8 | 21.6 | Stool culture | Self-report | N/D | 6/9 |
4. Discussion
Supplementary Materials
Author Contributions
Funding
Institutional Review Board Statement
Informed Consent Statement
Data Availability Statement
Conflicts of Interest
References
- Generali, E.; Bose, T.; Selmi, C.; Voncken, J.W.; Damoiseaux, J.G.M.C. Nature versus Nurture in the Spectrum of Rheumatic Diseases: Classification of Spondyloarthritis as Autoimmune or Autoinflammatory. Autoimmun. Rev. 2018, 17, 935–941. [Google Scholar] [CrossRef] [PubMed]
- Bentaleb, I.; Abdelghani, K.; Ben; Rostom, S.; Amine, B.; Laatar, A.; Bahiri, R. Reactive Arthritis: Update. Curr. Clin. Microbiol. Rep. 2020, 7, 124. [Google Scholar] [CrossRef] [PubMed]
- Wright, V. Seronegative Polyarthritis. a Unified Concept. Arthritis Rheum. 1978, 21, 619–633. [Google Scholar] [CrossRef] [PubMed]
- Pope, J.E.; Krizova, A.; Garg, A.X.; Thiessen-Philbrook, H.; Ouimet, J.M. Campylobacter Reactive Arthritis: A Systematic Review. Semin. Arthritis Rheum. 2007, 37, 48–55. [Google Scholar] [CrossRef] [PubMed]
- Carter, J.D. Reactive Arthritis: Defined Etiologies, Emerging Pathophysiology, and Unresolved Treatment. Infect. Dis. Clin. North Am. 2006, 20, 827–847. [Google Scholar] [CrossRef] [PubMed]
- Townes, J.M.; Deodhar, A.A.; Laine, E.S.; Smith, K.; Krug, H.E.; Barkhuizen, A.; Thompson, M.E.; Cieslak, P.R.; Sobel, J. Reactive Arthritis Following Culture-Confirmed Infections with Bacterial Enteric Pathogens in Minnesota and Oregon: A Population-Based Study. Ann. Rheum. Dis. 2008, 67, 1689–1696. [Google Scholar] [CrossRef] [PubMed]
- García-Kutzbach, A.; Chacón-Súchite, J.; García-Ferrer, H.; Iraheta, I. Reactive Arthritis: Update 2018. Clin. Rheumatol. 2018, 37, 869–874. [Google Scholar] [CrossRef] [PubMed]
- Colmegna, I.; Cuchacovich, R.; Espinoza, L.R. HLA-B27-Associated Reactive Arthritis: Pathogenetic and Clinical Considerations. Clin. Microbiol. Rev. 2004, 17, 348. [Google Scholar] [CrossRef] [PubMed]
- Houshmand, H.; Abounoori, M.; Ghaemi, R.; Bayat, S.; Houshmand, G. Ten-year-old Boy with Atypical COVID-19 Symptom Presentation: A Case Report. Clin. Case Rep. 2021, 9, 304. [Google Scholar] [CrossRef]
- Sinaei, R.; Pezeshki, S.; Parvaresh, S.; Sinaei, R.; Shiari, R.; Hassas Yeganeh, M.; Bazargn, N.; Gharaei, N. Post SARS-CoV-2 Infection Reactive Arthritis: A Brief Report of Two Pediatric Cases. Pediatr. Rheumatol. 2021, 19, 1–5. [Google Scholar] [CrossRef]
- Gasparotto, M.; Framba, V.; Piovella, C.; Doria, A.; Iaccarino, L. Post-COVID-19 Arthritis: A Case Report and Literature Review. Clin. Rheumatol. 2021, 40, 3357. [Google Scholar] [CrossRef] [PubMed]
- Liew, I.Y.; Mak, T.M.; Cui, L.; Vasoo, S.; Liew, I.Y.; Cui, L.; Vasoo, S.; Lim, X.R. A Case of Reactive Arthritis Secondary to Coronavirus Disease 2019 Infection. J. Clin. Rheumatol. 2020, 26, 233. [Google Scholar] [CrossRef] [PubMed]
- Ono, K.; Kishimoto, M.; Shimasaki, T.; Uchida, H.; Kurai, D.; Deshpande, G.A.; Komagata, Y.; Kaname, S. Reactive Arthritis after COVID-19 Infection. RMD Open 2020, 6, e001350. [Google Scholar] [CrossRef] [PubMed]
- Saricaoglu, E.M.; Hasanoglu, I.; Guner, R. The First Reactive Arthritis Case Associated with COVID-19. J. Med. Virol. 2021, 93, 192. [Google Scholar] [CrossRef] [PubMed]
- Tinazzi, E.; Ficarra, V.; Simeoni, S.; Artibani, W.; Lunardi, C. Reactive Arthritis Following BCG Immunotherapy for Urinary Bladder Carcinoma: A Systematic Review. Rheumatol. Int. 2006, 26, 481–488. [Google Scholar] [CrossRef] [PubMed]
- ECDC Campylobacteriosis—Annual Epidemiological Report for 2022. Available online: https://www.ecdc.europa.eu/en/publications-data/campylobacteriosis-annual-epidemiological-report-2022 (accessed on 11 April 2024).
- ECDC STEC Infection—Annual Epidemiological Report for 2022. Available online: https://www.ecdc.europa.eu/en/publications-data/stec-infection-annual-epidemiological-report-2022 (accessed on 11 April 2024).
- ECDC Salmonellosis—Annual Epidemiological Report for 2022. Available online: https://www.ecdc.europa.eu/en/publications-data/salmonellosis-annual-epidemiological-report-2022 (accessed on 11 April 2024).
- ECDC Shigellosis—Annual Epidemiological Report for 2022. Available online: https://www.ecdc.europa.eu/en/publications-data/shigellosis-annual-epidemiological-report-2022 (accessed on 11 April 2024).
- ECDC Yersiniosis—Annual Epidemiological Report for 2022. Available online: https://www.ecdc.europa.eu/en/publications-data/yersiniosis-annual-epidemiological-report-2022 (accessed on 11 April 2024).
- Muilu, P.; Rantalaiho, V.; Kautiainen, H.; Virta, L.J.; Eriksson, J.G.; Puolakka, K. Increasing Incidence and Shifting Profile of Idiopathic Inflammatory Rheumatic Diseases in Adults during This Millennium. Clin. Rheumatol. 2019, 38, 555–562. [Google Scholar] [CrossRef] [PubMed]
- Kim, P.S.; Klausmeier, T.L.; Orr, D.P. Reactive Arthritis: A Review. J. Adolesc. Health 2009, 44, 309–315. [Google Scholar] [CrossRef] [PubMed]
- Lahu, A.; Backa, T.; Ismaili, J.; Lahu, V.; Saiti, V. Modes of Presentation of Reactive Arthritis Based on the Affected Joints. Med. Arch. 2015, 69, 42. [Google Scholar] [CrossRef] [PubMed]
- Selmi, C.; Gershwin, M.E. Diagnosis and Classification of Reactive Arthritis. Autoimmun. Rev. 2014, 13, 546–549. [Google Scholar] [CrossRef]
- Rees, J.R.; Pannier, M.A.; McNees, A.; Shallow, S.; Angulo, F.J.; Vugia, D.J. Persistent Diarrhea, Arthritis, and Other Complications of Enteric Infections: A Pilot Survey Based on California FoodNet Surveillance, 1998–1999. Clin. Infect. Dis. 2004, 38, S311–S317. [Google Scholar] [CrossRef]
- Pogreba-Brown, K.; Austhof, E.; Tang, X.; Trejo, M.J.; Owusu-Dommey, A.; Boyd, K.; Armstrong, A.; Schaefer, K.; Bazaco, M.C.; Batz, M.; et al. Enteric Pathogens and Reactive Arthritis: Systematic Review and Meta-Analyses of Pathogen-Associated Reactive Arthritis. Foodborne Pathog. Dis. 2021, 18, 627–639. [Google Scholar] [CrossRef] [PubMed]
- Greenland, S. Interpretation and Choice of Effect Measures in Epidemiologic Analyses. Am. J. Epidemiol. 1987, 125, 761–768. [Google Scholar] [CrossRef] [PubMed]
- Viechtbauer, W. Bias and Efficiency of Meta-Analytic Variance Estimators in the Random-Effects Model. J. Educ. Behav. Stat. 2005, 30, 261–293. [Google Scholar] [CrossRef]
- Cochran, W.G. The Combination of Estimates from Different Experiments. Biometrics 1954, 10, 101. [Google Scholar] [CrossRef]
- Egger, M.; Smith, G.D.; Schneider, M.; Minder, C. Bias in Meta-Analysis Detected by a Simple, Graphical Test. BMJ 1997, 315, 629–634. [Google Scholar] [CrossRef] [PubMed]
- Bremell, T.; Bjelle, A.; Svedhem, A. Rheumatic symptoms following an outbreak of campylobacter enteritis: A five year follow up. Ann Rheum Dis. 1991, 50, 934. [Google Scholar] [CrossRef] [PubMed]
- Doorduyn, Y.; Van Pelt, W.; Siezen, C.L.E.; Van der Horst, F.; Van Duynhoven, Y.T.H.P.; Hoebee, B.; Janssen, R. Novel Insight in the Association between Salmonellosis or Campylobacteriosis and Chronic Illness, and the Role of Host Genetics in Susceptibility to These Diseases. Epidemiol. Infect. 2008, 136, 1225–1234. [Google Scholar] [CrossRef] [PubMed]
- Gumpel, J.M.; Martin, C.; Sanderson, P.J. Reactive Arthritis Associated with Campylobacter Enteritis. Ann. Rheum. Dis. 1981, 40, 64. [Google Scholar] [CrossRef] [PubMed]
- Eastmond, C.J.; Rennie, J.A.; Reid, T.M. An Outbreak of Campylobacter Enteritis--a Rheumatological Followup Survey—PubMed. J. Rheumatol. 1983, 10, 107–108. [Google Scholar]
- Hannu, T.; Mattila, L.; Rautelin, H.; Pelkonen, P.; Lahdenne, P.; Siitonen, A.; Leirisalo-Repo, M. Campylobacter-triggered Reactive Arthritis: A Population-based Study. Rheumatology 2002, 41, 312–318. [Google Scholar] [CrossRef]
- Hannu, T.; Kauppi, M.; Tuomala, M.; Laaksonen, I.; Klemets, P.; Kuusi, M. Reactive Arthritis Following an Outbreak of Campylobacter Jejuni Infection. J. Rheumatol. 2004, 31, 528–530. [Google Scholar] [PubMed]
- Helms, M.; Simonsen, J.; Mølbak, K. Foodborne Bacterial Infection and Hospitalization: A Registry-Based Study. Clin. Infect. Dis. 2006, 42, 498–506. [Google Scholar] [CrossRef] [PubMed]
- Johnsen, K.; Østensen, M.; Christine, A.; Melbye, S.; Melby, K. HLA-B27-Negative Arthritis Related to Campylobacter Jejuni Enteritis in Three Children and Two Adults. Acta. Med. Scand. 1983, 214, 165–168. [Google Scholar] [CrossRef] [PubMed]
- Kosunen, T.U.; Pönkä, A.; Kauranen, O.; Martio, J.; Pitkänen, T.; Hortling, L.; Aittoniemi, S.; Penttilä, O.; Koskimies, S. Arthritis Associated with Campylobacter Jejuni Enteritis. Scand. J. Rheumatol. 1981, 10, 77–80. [Google Scholar] [CrossRef] [PubMed]
- Locht, H.; Krogfelt, K.A. Comparison of Rheumatological and Gastrointestinal Symptoms after Infection with Campylobacter Jejuni/Coli and Enterotoxigenic Escherichia Coli. Ann. Rheum. Dis. 2002, 61, 448. [Google Scholar] [CrossRef] [PubMed]
- Melby, K.K.; Svendby, J.G.; Eggebø, T.; Holmen, L.A.; Andersen, B.M.; Lind, L.; Sjøgren, E.; Kaijser, B. Outbreak of Campylobacter Infection in a Subartic Community. Eur. J. Clin. Microbiol. Infect. Dis. 2000, 19, 542–544. [Google Scholar] [CrossRef] [PubMed]
- Petersen, A.; Vinther Nielsen, S.; Meyer, D.; Ganer, P.; Ladefoged, K. Bacterial Gastroenteritis among Hospitalized Patients in a Danish County, 1991–1993. Scand. J. Gastroenterol. 1996, 31, 906–911. [Google Scholar] [CrossRef] [PubMed]
- Pitkänen, T.; Pettersson, T.; Pönkä, A.; Kosunen, T.U. Clinical and Serological Studies in Patients with Campylobacter Fetus Ssp. Jejuni Infection: I. Clinical Findings. Infection 1981, 9, 274–278. [Google Scholar] [CrossRef] [PubMed]
- Pitkänen, T.; Pönkä, A.; Pettersson, T.; Kosunen, T.U. Campylobacter Enteritis in 188 Hospitalized Patients. Arch. Intern. Med. 1983, 143, 215–219. [Google Scholar] [CrossRef]
- Pönkä, A.; Pitkänen, T.; Sarna, S.; Kosunen, T.U. Infection Due to Campylobacter Jejuni: A Report of 524 Outpatients. Infection 1984, 12, 175–178. [Google Scholar] [CrossRef]
- Porter, C.K.; Choi, D.; Riddle, M.S. Pathogen-Specific Risk of Reactive Arthritis from Bacterial Causes of Foodborne Illness. J. Rheumatol. 2013, 40, 712–714. [Google Scholar] [CrossRef] [PubMed]
- Schiellerup, P.; Krogfelt, K.A.; Locht, H. A Comparison of Self-Reported Joint Symptoms Following Infection with Different Enteric Pathogens: Effect of HLA-B27. J. Rheumatol. 2008, 35, 480–487. [Google Scholar] [PubMed]
- Schönberg-Norio, D.; Mattila, L.; Lauhio, A.; Katila, M.L.; Kaukoranta, S.S.; Koskela, M.; Pajarre, S.; Uksila, J.; Eerola, E.; Sarna, S.; et al. Patient-Reported Complications Associated with Campylobacter Jejuni Infection. Epidemiol. Infect. 2010, 138, 1004–1011. [Google Scholar] [CrossRef] [PubMed]
- Ternhag, A.; Törner, A.; Svensson, Å.; Ekdahl, K.; Giesecke, J. Short- and Long-Term Effects of Bacterial Gastrointestinal Infections. Emerg. Infect. Dis. 2008, 14, 143. [Google Scholar] [CrossRef] [PubMed]
- Walker, T.A.; Grainger, R.; Quirke, T.; Roos, R.; Sherwood, J.; MacKereth, G.; Kiedrzynski, T.; Eyre, R.; Paine, S.; Wood, T.; et al. Reactive Arthritis Incidence in a Community Cohort Following a Large Waterborne Campylobacteriosis Outbreak in Havelock North, New Zealand. BMJ Open 2022, 12, e060173. [Google Scholar] [CrossRef]
- Zia, S.; Wareing, D.; Sutton, C.; Bolton, E.; Mitchell, D.; Goodcare, J.A. Health Problems Following Campylobacter Jejuni Enteritis in a Lancashire Population. Rheumatology 2003, 42, 1083–1088. [Google Scholar] [CrossRef] [PubMed]
- Croxen, M.A.; Law, R.J.; Scholz, R.; Keeney, K.M.; Wlodarska, M.; Finlay, B.B. Recent Advances in Understanding Enteric Pathogenic Escherichia Coli. Clin. Microbiol. Rev. 2013, 26, 822–880. [Google Scholar] [CrossRef]
- Tuompo, R.; Lääveri, T.; Hannu, T.; Pakkanen, S.H.; Kirveskari, J.; Leirisalo-Repo, M.; Kantele, A. Reactive Arthritis and Other Musculoskeletal Symptoms Associated with Acquisition of Diarrhoeagenic Escherichia Coli (DEC). Ann. Rheum. Dis. 2020, 79, 605. [Google Scholar] [CrossRef] [PubMed]
- Rohekar, S.; Tsui, F.W.; Tsui, H.W.; Xi, N.; Riarh, R.; Bilotta, R.; Inman, R.D. Symptomatic Acute Reactive Arthritis after An Outbreak of Salmonella. J. Rheumatol. 2008, 35, 1599–1602. [Google Scholar]
- Arnedo-Pena, A.; Beltrán-Fabregat, J.; Vila-Pastor, B.; Tirado-Balaguer, M.D.; Herrero-Carot, C.; Bellido-Blasco, J.B.; Romeu-Garcia, M.A.; Safont-Adsuara, L.; Pac-Sa, M.R.; Guillen-Grima, F. Reactive Arthritis and Other Musculoskeletal Sequelae Following an Outbreak of Salmonella Hadar in Castellon, Spain. J. Rheumatol. 2010, 37, 1735–1742. [Google Scholar] [CrossRef]
- Bengtsson, E.; Hedlund, P.; Nisell, A.; Nordenstam, H. An Epidemic Due to Salmonella Typhimurium (Breslau) Occurring in Sweden in 1953; with Special Reference to Clinical Complications, Bacteriology, Serology, Antibiotic Treatment, and Morbid Anatomy—PubMed. Acta. Med. Scand. 1955, 153, 1–20. [Google Scholar] [CrossRef]
- Buxton, J.A.; Murray, F.; Berger, S.; Cox, M.B.; Northcott, K.A. Multiprovincial Salmonella typhimurium Case-Control Study Group Reactive Arthritis and Other Sequelae Following Sporadic Salmonella Typhimurium Infection in British Columbia, Canada: A Case Control Study. J. Rheumatol. 2002, 29, 2154–2158. [Google Scholar] [PubMed]
- Dworkin, M.S.; Shoemaker, P.C.; Goldoft, M.J.; Kobayashi, J.M. Reactive Arthritis and Reiter’s Syndrome Following an Outbreak of Gastroenteritis Caused by Salmonella Enteritidis. Clin. Infect. Dis. 2001, 33, 1010–1014. [Google Scholar] [CrossRef] [PubMed]
- Ekman, P.; Kirveskari, J.; Granfors, K. Modification of Disease Outcome in Salmonella-infected Patients by HLA–B27-Ekman-2000-Arthritis & Rheumatism-Wiley Online Library. Arthritis Rheum. Off. J. Am. Coll. Rheumatol. 2001, 43, 1527–1534. [Google Scholar]
- Håkansson, U.; Eitrem, R.; Low, B.; Winblad, S. HLA-Antigen B27 in Cases with Joint Affections in an Outbreak of Salmonellosis. Scand. J. Infect. Dis. 1976, 8, 245–248. [Google Scholar] [CrossRef] [PubMed]
- Inman, R.D.; Johnston, M.E.A.; Hodge, M.; Falk, J.; Helewa, A. Postdysenteric Reactive Arthritis. Arthritis Rheum. 1988, 31, 1377–1383. [Google Scholar] [CrossRef] [PubMed]
- Lee, W.S.; Hafeez, A.; Hassan, H.; Raja, N.S.; Puthucheary, S.D. Focal Non-Typhoidal Salmonella Infections from a Single Center in Malaysia-PubMed. Southeast Asian J. Trop. Med. Public Health 2005, 36, 678–682. [Google Scholar]
- Locht, H.; Kihlstrom, E.; Lindstrom, F.D. Reactive Arthritis after Salmonella among Medical Doctors-Study of an Outbreak. J. Rheumatol. 1993, 20, 845–848. [Google Scholar]
- Mattila, L.; Leirisalo-repo, M.; Koskimies, S.; Granfors, K.; Siitonen, A. Reactive Arthritis Following an Outbreak of Salmonella Infection in Finland. Br. J. Rheumatol. 1994, 33, 1136–1141. [Google Scholar] [CrossRef]
- Mattila, L.; Leirisalo-Repo, M.; Pelkonen, P.; Koskimies, S.; Granfors, K.; Siitonen, A. Reactive Arthritis Following an Outbreak of Salmonella Bovismorbificans Infection. J. Infect. 1998, 36, 289–295. [Google Scholar] [CrossRef]
- McColl, G.J.; Diviney, M.B.; Holdsworth, R.F.; McNair, P.D.; Carnie, J.; Hart, W.; McCluskey, J. HLA-B27 Expression and Reactive Arthritis Susceptibility in Two Patient Cohorts Infected with Salmonella Typhimurium. Aust. N. Z. J. Med. 2000, 30, 28–32. [Google Scholar] [CrossRef] [PubMed]
- Rudwaleit, M.; Richter, S.; Braun, J.; Sieper, J. Low Incidence of Reactive Arthritis in Children Following a Salmonella Outbreak. Ann. Rheum. Dis. 2001, 60, 1055. [Google Scholar] [CrossRef] [PubMed]
- Samuel, M.P.; Zwillich, S.H.; Thomson, G.T.; Alfa, M.; Orr, K.B.; Britain, D.C.; Miller, J.R.; Phillips, P.E. Fast Food Arthritis—A Clinico-Pathologic Study of Post-Salmonella Reactive Arthritis-PubMed. J. Rheumatol. 1995, 22, 1947–1952. [Google Scholar] [PubMed]
- Thomson, G.T.D.; Chiu, B.; De Rubeis, D.; Falk, J.; Inman, R.D. Immunoepidemiology of Post-Salmonella Reactive Arthritis in a Cohort of Women. Clin. Immunol. Immunopathol. 1992, 64, 227–232. [Google Scholar] [CrossRef] [PubMed]
- Thomson, G.T.; Alfa, M.; Orr, K.; Thomson, B.R.; Olson, N. Secretory Immune Response and Clinical Sequelae of Salmonella Infection in a Point Source Cohort-PubMed. J. Rheumatol. 1994, 21, 132–137. [Google Scholar] [PubMed]
- Thomson, G.T.D.; DeRubeis, D.A.; Hodge, M.A.; Rajanayagam, C.; Inman, R.D. Post-Salmonella Reactive Arthritis: Late Clinical Sequelae in a Point Source Cohort. Am. J. Med. 1995, 98, 13–21. [Google Scholar] [CrossRef] [PubMed]
- Tuompo, R.; Hannu, T.; Mattila, L.; Siitonen, A.; Leirisalo-Repo, M. Reactive Arthritis Following Salmonella Infection: A Population-Based Study. Scand. J. Rheumatol. 2013, 42, 196–202. [Google Scholar] [CrossRef] [PubMed]
- Urfer, E.; Rossier, P.; Méan, F.; Krending, M.J.; Burnens, A.; Bille, J.; Francioli, P.; Zwahlen, A. Outbreak of Salmonella Braenderup Gastroenteritis Due to Contaminated Meat Pies: Clinical and Molecular Epidemiology. Clin. Microbiol. Infect. 2000, 6, 536–542. [Google Scholar] [CrossRef] [PubMed]
- Finch, M.; Rodey, G.; Lawrence, D.; Blake, P. Epidemic Reiter’s Syndrome Following an Outbreak of Shigellosis. Eur. J. Epidemiol. 1986, 2, 26–30. [Google Scholar] [CrossRef]
- Hannu, T.; Mattila, L.; Siitonen, A.; Leirisalo-Repo, M. Reactive Arthritis Attributable to Shigella Infection: A Clinical and Epidemiological Nationwide Study. Ann. Rheum. Dis. 2005, 64, 594. [Google Scholar] [CrossRef]
- Kaslow, R.A.; Ryder, R.W.; Calin, A. Search for Reiter’s Syndrome after an Outbreak of Shigella Sonnei Dysentery. J. Rheumatol. 1979, 6, 562–566. [Google Scholar] [PubMed]
- Martin, D.J.; White, B.K.; Rossman, M.G. Reactive Arthritis after Shigella Gastroenteritis in American Military in Afghanistan. J. Clin. Rheumatol. 2012, 18, 257–258. [Google Scholar] [CrossRef] [PubMed]
- Noer, H.R. An Experimental Epidemic of Reiter’s Syndrome. JAMA 1966, 198, 693–698. [Google Scholar] [CrossRef] [PubMed]
- Simon, D.G.; Kaslow, R.A.; Rosenbaum, J.; Kaye, R.L.; Calin, A. Reiter’s Syndrome Following Epidemic Shigellosis. J. Rheumatol. 1981, 8, 969–973. [Google Scholar] [PubMed]
- van Bohemen, C.G.; Nabbe, A.J.J.M.; Landheer, J.E.; Grumet, F.C.; Mazurkiewicz, E.S.; Dinant, H.J.; Lionarons, R.J.; van Bodegom, P.C.; Zanen, H.C. HLA-B27M1M2 and High Immune Responsiveness to Shigella Flexneri in Post-Dysenteric Arthritis. Immunol. Lett 1986, 13, 71–74. [Google Scholar] [CrossRef]
- Hannu, T.; Mattila, L.; Nuorti, J.P.; Ruutu, P.; Mikkola, J.; Siitonen, A.; Leirisalo-Repo, M. Reactive Arthritis after an Outbreak of Yersinia Pseudotuberculosis Serotype O:3 Infection. Ann. Rheum. Dis. 2003, 62, 866. [Google Scholar] [CrossRef] [PubMed]
- Huovinen, E.; Sihvonen, L.M.; Virtanen, M.J.; Haukka, K.; Siitonen, A.; Kuusi, M. Symptoms and Sources of Yersinia Enterocolitica-Infection: A Case-Control Study. BMC Infect. Dis. 2010, 10, 1–9. [Google Scholar] [CrossRef]
- Rosner, B.M.; Werber, D.; Höhle, M.; Stark, K. Clinical Aspects and Self-Reported Symptoms of Sequelae of Yersinia Enterocolitica Infections in a Population-Based Study, Germany 2009–2010. BMC Infect. Dis. 2013, 13, 1–8. [Google Scholar] [CrossRef]
- Tertti, R.; Granfors, K.; Lehtonen, O.P.; Mertsola, J.; Mäkelä, A.L.; Välimäki, I.; Hänninen, P.; Toivanen, A. An Outbreak of Yersinia Pseudotuberculosis Infection. J. Infect. Dis. 1984, 149, 245–250. [Google Scholar] [CrossRef]
- Tertti, R.; Vuento, R.; Mikkola, P.; Granfors, K.; Mäkelä, A.L.; Toivanen, A. Clinical Manifestations of Yersinia Pseudotuberculosis Infection in Children. Eur. J. Clin. Microbiol. Infect. Dis. 1989, 8, 587–591. [Google Scholar] [CrossRef]
- Vasala, M.; Hallanvuo, S.; Ruuska, P.; Suokas, R.; Siitonen, A.; Hakala, M. High Frequency of Reactive Arthritis in Adults after Yersinia Pseudotuberculosis O:1 Outbreak Caused by Contaminated Grated Carrots. Ann. Rheum. Dis. 2014, 73, 1793–1796. [Google Scholar] [CrossRef] [PubMed]
- Hess, D.R. Retrospective Studies and Chart Reviews. Respir. Care 2004, 49, 1171–1174. [Google Scholar] [PubMed]
- Ajene, A.N.; Fischer Walker, C.L.; Black, R.E. Enteric Pathogens and Reactive Arthritis: A Systematic Review of Campylobacter, Salmonella and Shigella-Associated Reactive Arthritis. J. Health Popul. Nutr. 2013, 31, 299. [Google Scholar] [CrossRef] [PubMed]
- Keithlin, J.; Sargeant, J.; Thomas, M.K.; Fazil, A. Systematic Review and Meta-Analysis of the Proportion of Campylobacter Cases That Develop Chronic Sequelae. BMC Public Health 2014, 14, 1203. [Google Scholar] [CrossRef]
- Fendler, C.; Laitko, S.; Sörensen, H.; Gripenberg-Lerche, C.; Groh, A.; Uksila, J.; Granfors, K.; Braun, J.; Sieper, J. Frequency of Triggering Bacteria in Patients with Reactive Arthritis and Undifferentiated Oligoarthritis and the Relative Importance of the Tests Used for Diagnosis. Ann. Rheum. Dis. 2001, 60, 337–343. [Google Scholar] [CrossRef]
- Zeidler, H.; Hudson, A.P. Reactive Arthritis Update: Spotlight on New and Rare Infectious Agents Implicated as Pathogens. Curr. Rheumatol. Rep. 2021, 23, 1–14. [Google Scholar] [CrossRef]

Disclaimer/Publisher’s Note: The statements, opinions and data contained in all publications are solely those of the individual author(s) and contributor(s) and not of MDPI and/or the editor(s). MDPI and/or the editor(s) disclaim responsibility for any injury to people or property resulting from any ideas, methods, instructions or products referred to in the content. |
© 2024 by the authors. Licensee MDPI, Basel, Switzerland. This article is an open access article distributed under the terms and conditions of the Creative Commons Attribution (CC BY) license (https://creativecommons.org/licenses/by/4.0/).
Share and Cite
Shafiee, D.; Salpynov, Z.; Gusmanov, A.; Khuanbai, Y.; Mukhatayev, Z.; Kunz, J. Enteric Infection-Associated Reactive Arthritis: A Systematic Review and Meta-Analysis. J. Clin. Med. 2024, 13, 3433. https://doi.org/10.3390/jcm13123433
Shafiee D, Salpynov Z, Gusmanov A, Khuanbai Y, Mukhatayev Z, Kunz J. Enteric Infection-Associated Reactive Arthritis: A Systematic Review and Meta-Analysis. Journal of Clinical Medicine. 2024; 13(12):3433. https://doi.org/10.3390/jcm13123433
Chicago/Turabian StyleShafiee, Darya, Zhandos Salpynov, Arnur Gusmanov, Yerkhanat Khuanbai, Zhussipbek Mukhatayev, and Jeannette Kunz. 2024. "Enteric Infection-Associated Reactive Arthritis: A Systematic Review and Meta-Analysis" Journal of Clinical Medicine 13, no. 12: 3433. https://doi.org/10.3390/jcm13123433
APA StyleShafiee, D., Salpynov, Z., Gusmanov, A., Khuanbai, Y., Mukhatayev, Z., & Kunz, J. (2024). Enteric Infection-Associated Reactive Arthritis: A Systematic Review and Meta-Analysis. Journal of Clinical Medicine, 13(12), 3433. https://doi.org/10.3390/jcm13123433