Abstract
Background/Objectives: Anemia is a frequent multifactorial co-morbidity in end-stage kidney disease (ESKD) associated with morbidity and poor QoL. Apart from insufficient erythropoietin formation, iron deficiency (ID) contributes to anemia development. Identifying patients in need of iron supplementation with current ID definitions is difficult since no good biomarker is available to detect actual iron needs. Therefore, new diagnostic tools to guide therapy are needed. Methods: We performed a prospective cohort study analyzing tissue iron content with MRI-based R2*-relaxometry in 20 anemic ESKD patients and linked it with iron biomarkers in comparison to 20 otherwise healthy individuals. Results: ESKD patients had significantly higher liver (90.1 s−1 vs. 36.1 s−1, p < 0.001) and spleen R2* values (119.8 s−1 vs. 19.3 s−1, p < 0.001) compared to otherwise healthy individuals, while their pancreas and heart R2* values did not significantly differ. Out of the 20 ESKD patients, 17 had elevated spleen and 12 had elevated liver R2* values. KDIGO guidelines (focusing on serum iron parameters) would recommend iron supplementation in seven patients with elevated spleen and four patients with elevated liver R2* values. Conclusions: These findings highlight that liver and especially spleen iron concentrations are significantly higher in ESKD patients compared to controls. Tissue iron overload diverged from classical iron parameters suggesting need of iron supplementation. Measurement of MRI-guided tissue iron distribution might help guide treatment of anemic ESKD patients.
1. Introduction
Anemia is a frequent comorbidity in patients with end-stage kidney disease (ESKD) and is associated with poor quality of life [1] and increased morbidity and mortality [2,3]. The prevalence of anemia increases with declining kidney function and reaches a prevalence of more than 50% in ESKD patients [4,5].
Several mechanisms are involved in the pathogenesis of this type of anemia [6]. Primarily, the reduced erythropoietin production as a consequence of kidney damage and dysfunction reduces erythropoietic bone marrow activity [7,8]. Reduced kidney blood flow in chronic kidney disease (CKD) alters oxygen delivery, with adaptation of the kidney tissue, subsequently consuming less oxygen with maintenance of a normal tissue oxygen gradient. Therefore, Epo production is not upregulated despite systemic hypoxia due to anemia [9]. In addition, inflammation inhibits the proliferation and differentiation of erythroid progenitor cells, raises their resistance to Epo and reduces the circulatory erythrocyte lifespan due to increased erythrophagocytosis by activated macrophages. In addition, the liver-derived iron hormone hepcidin was shown to inhibit erythroid progenitor proliferation and survival [10,11,12,13].
A further contributor to anemia in CKD is the reduced availability of iron, which is obligatory for an adequate erythropoietic response following stimulation by erythropoietin [14]. Moreover, iron is crucial for numerous biologic functions including cell respiration, energy production, and cell proliferation [15]. Actually, iron deficiency (ID) is associated with an adverse outcome in CKD even independently of anemia [16]. The origin of ID in CKD is multifactorial and caused by blood losses (blood left in the hemodialysis circuit, uremia-induced platelet dysfunction) [8] and reduced intestinal iron absorption together with inflammation-driven iron restriction in macrophages [17,18]. The latter is largely caused by increased circulating levels of hepcidin as a consequence of cytokine mediated induction of hepcidin but also reduced excretion of the peptide by the kidney [17,18,19]. Hepcidin binds to the iron exporter ferroportin, resulting in its degradation and the blockage of iron transfer from macrophages or enterocytes to the circulation [20]. Moreover, circulating cytokines, which have been found to be increased specifically in advanced or hemodialysis-dependent ESDR, induce the expression of transcellular iron uptake molecules, thereby enforcing macrophage iron storage, which is also reflected by increased ferritin levels [16,21].
Intravenous iron has been shown to reduce the needs of erythropoiesis-stimulating agents (ESAs) and blood transfusions, while increasing cognitive function and QoL in ESKD patients [22,23]. The PIVOTAL trial demonstrated that proactive intravenous iron administration in patients with ferritin < 700 mg/L and transferrin saturation (TfS) ≤40% not only decreases ESA use but also lowers the risk of all-cause death and cardiovascular events when compared to a reactive treatment strategy with low-dose intravenous iron administration in patients with ferritin < 200 mg/L and TfS < 20% [22]. Anemia correction with ESAs alone is associated with adverse outcomes [24]. Therefore, both the KDIGO and NICE guidelines recommend intravenous iron formulations for the treatment of anemia in ESKD patients, subsequently resulting in a change of practice patterns toward increased iron supplementation and reduced ESA use in the last several years [24,25].
Moreover, the response rates to intravenous iron therapy vary greatly, which may be traced back to the underlying type of ID. While it is suggestive that in subjects with true ID, even in the setting of chronic inflammatory diseases iron supplementation will be effective, this may not be the case in functional ID, as recently demonstrated in a pre-clinical model of inflammatory anemia where iron supplementation in the later setting resulted in accumulation of the metal in the liver and spleen without ameliorating the anemia [26].
As we lack good biomarkers to indicate true ID in the setting of inflammation [27], novel diagnostic tools are needed to guide therapy. Excess iron can cause radical formation and molecular damage and promote cell death and tissue injury, which is why it is important to avoid overtreatment of iron repleted or already overloaded patients [28]. A recent meta-analysis demonstrated a high risk of iron overload in patients with ESKD [29], which can cause intravascular oxidative stress and increase the risk of cardiovascular events and infections [27,30].
The aim of this study was (i) to evaluate tissue iron distribution in the spleen, liver, pancreas, and heart with MRI-based R2* relaxometry in anemic ESKD patients; (ii) to compare tissue iron distribution with otherwise healthy controls and a small group of patients with transfusion-related iron overload (TRIO); and (iii) to correlate tissue iron loading with biomarkers of iron metabolism and inflammation as well as premedication. A proper definition of ID that can be used for identifying patients with a need for iron supplementation is lacking since no good biomarker is available for detecting actual iron needs. Therefore, new diagnostic tools to guide iron therapy are warranted.
2. Materials and Methods
2.1. Study Population
We performed a prospective cohort pilot study of 20 patients with dialysis-dependent ESKD and anemia at the Nephrology Department of the Medical University of Innsbruck treated between May 2020–January 2022. Inclusion criteria were age > 18 years, hemoglobin < 130 g/L in men and <120 g/L in women and exclusion criterion general contraindications for MRI. The control group (already used in another analysis) consisted of otherwise healthy individuals without signs of inflammation (CRP < 0.5 mg/dL, n = 20), who were recruited at our outpatient department, together with a cohort of TRIO patients (ferritin > 500 µg/L) with hemato-oncologic disease classed as “stable disease” (n = 10). The control group of otherwise healthy individuals without signs of inflammation included 9 mildly anemic and 11 non-anemic patients.
Patients’ data were extracted from the local clinical information system and anonymized. This study conformed to the ethical principles outlined in the Declaration of Helsinki and was approved by the ethics committee of the Medical University of Innsbruck (ethical vote ID: UN5093, session number 325/4.14). All patients gave written informed consent to participate in this study. The data that support the findings of this study are available from the corresponding author upon reasonable request.
2.2. Laboratory Measurements and Classifications
Blood sampling was routinely performed at the time of imaging (±2 days) and analyzed with fully automated tests. Laboratory parameters were then extracted from the local clinical information system. Immunoturbidimetry tests were used for measuring ferritin, transferrin (Tf), soluble transferrin receptor (sTfR) and C-reactive protein (CRP) (Roche Diagnostics GmbH, Mannheim, Germany). The FerroZineTM method without deproteinization was used to measure serum iron concentrations (Roche Diagnostics GmbH, Mannheim, Germany). The TfS was calculated as iron/transferrin × 70.9 and the sTfR/ferritin index (sTfR-F) as sTfR/log (ferritin). An enzyme-linked immunosorbent assay was used to measure hepcidin (Siemens Healthcare Diagnostics Products GmbH, Marburg, Germany) and neopterin levels (IBL International GmbH, Hamburg, Germany), while flow cytometry was used to detect the blood count (Sysmex GmbH, Norderstedt, Germany). Finally, an electrochemiluminescence immunoassay was used to measure interleukin 6 (IL-6) and N-terminal prohormone of brain natriuretic peptide (NT-proBNP) levels (Roche Diagnostics GmbH, Mannheim, Germany).
We defined anemia according to the World Health Organization (WHO) definition as Hb < 130 g/L in men and Hb < 120 g/L in women and further classified it into severe (Hb < 80 g/L), moderate (Hb 80–109 g/L) and mild anemia (Hb 110–129 g/L in men, Hb 110–119 g/L in women) [31]. The KDIGO defines ID in ESKD patients as TfS ≤ 30% and ferritin ≤ 500 ng/mL [32].
2.3. Procedures of Magnetic Resonance Imaging
We referred study participants to the radiology department for MRI-based R2* relaxometry of the spleen, liver, pancreas, and T2* mapping of the heart. MRI of the upper abdominal organs (liver, spleen, and pancreas) was performed with a 1.5 T scanner (MAGNETOM AvantoFit, Siemens Healthineers, Erlangen, Germany) using an 18-element body matrix coil and 12–16 elements of the integrated 32-channel spine matrix coil. R2* values were acquired by means of a fat-saturated biopsy-calibrated [33] 2D multi-gradient echo (ME-GRE) sequence. Two transversal 10 mm thick single slices with 12 echoes were acquired at the hilar level of the liver. The sequence parameters were as follows: 0.99 ms initial TE, 1.41 ms delta TE, 16.5 ms max. TE, 200 ms TR, 20° flip angle, 128 × 128 matrix, 380 mm × 380 mm field of view, chemical shift selective fat saturation as provided by the manufacturer, and 16.8 s acquisition time. Images were taken in the supine position and at the end of expiration in one breath-hold per slice. The R2* maps were calculated by a blinded physicist, an expert in MRI post-processing. A plugin that was written specifically for ImageJ (Wayne Rasband, National Institutes of Health) was used for pixel-wise fitting with a mono-exponential truncation model [34]. The R2* maps were analyzed by a radiologist who carefully placed three approximately 8 mm in diameter “regions of interest (ROIs)” in the subcapsular liver parenchyma, positioning two in the right and one in the left lobe, two within the pancreas and one with about 13 mm in the center of the spleen. The liver surface, focal liver lesions and larger vessels as well as the artefacts were spared accordingly. For the liver and pancreas, the mean R2* values of the individual ROIs were used for further analysis. In addition, the proton density fraction (PDFF) was calculated by performing a commercial 3D multigradient-echo sequence (q-Dixon) with advanced in-line processing and automatic calculation of T1 weighted fat-saturated images and corresponding PDFF maps. The following sequence parameters were used: 64 slices, parallel imaging acceleration factor 4, acquisition time 18.5 s, 6 echoes, a 160 × 120 matrix, and FOV of 380 mm × 380 mm with a slice thickness of 3.5 mm. Tissue fat content of the liver, pancreas and spleen was determined from the ROIs manually co-registered to the R2* maps. To quantify the myocardial iron load, short-axis T2* maps were generated, and the largest possible ROI was placed within the mid-myocardial septum using the routine picture archiving and communication system (IMPACS, Agfa-Gevaert, Mortsel, Belgium). Cardiac R2* values were derived from the obtained T2* values by calculating the reciprocal value [35].
After defining the maximum organ length and height as well as the hilar thickness on the T1-weighted, fat-saturated q-Dixon images in the IMPACS system, the spleen volume was calculated using the following formula: spleen volume = 0.601 × (maximal length × vertical height × hilum thickness) + 18.889) [36].
Elevation of iron content was defined as R2* > 70 s−1 in the liver and as >50 s−1 in the spleen, pancreas, and heart according to the literature [35,37].
2.4. Statistical Analysis
We depicted parameters as n (%) or medians (25th, 75th percentile) since most parameters did not have a normal distribution as tested with Shapiro–Wilk. To test for significant differences between two or more unpaired groups we used the Mann-Whitney-U, Kruskal–Wallis or Pearson chi-square test. Correlations of the continuous variables were analyzed with Spearman-rank correlation analysis. Univariate and multivariate linear regression analysis was performed to analyze the predictive values of specific variables for the spleen and liver R2* values. Skewed variables were log-transformed by the natural logarithm for regression analysis. Statistical tests were two tailed and p-values < 0.05 were regarded as statistically significant. Statistical analysis was performed with SPSS Statistics Version 29 (IBM Corporation, Armonk, NY, USA).
3. Results
3.1. Patient Characteristics
We enrolled 20 ESKD patients with anemia of whom 16 were men and four women. The control group comprised 20 otherwise healthy individuals (ten men, ten women) and ten patients with TRIO (seven men, three women). The patients’ characteristics are depicted in Table 1. The R2* values in our control group were similar to healthy controls from recent studies [38,39,40]. The median time from. dialysis initiation until inclusion in this study was 18 months (2–41 months).

Table 1.
Patients’ characteristics.
3.2. Tissue Iron Distribution Measured by MRI R2* Sequence
Patients with ESKD and anemia had significantly higher spleen (119.8 s−1 vs. 19.3 s−1, p < 0.001) and liver R2* values (90.1 s−1 vs. 36.1 s−1, p < 0.001) compared to healthy controls, while pancreas (31.0 s−1 vs. 24.9 s−1, p = 0.149) and heart R2* values (27.4 s−1 vs. 28.6 s−1, p = 0.583) did not significantly differ between the groups (Figure 1 and Figure 2). When applying the reference values used at our clinic [35], 85% of the ESKD patients (n = 17) had elevated spleen and 60% (n = 12) elevated liver R2* values, while their pancreas and heart iron R2* values were within the normal range.
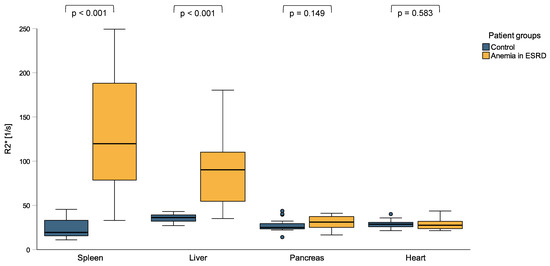
Figure 1.
R2* values of spleen, liver, pancreas, and heart in patients with anemia in end-stage kidney disease (ESKD) and a control group of individuals without signs of inflammation. ESKD patients with anemia had significantly higher spleen and liver R2* values compared to otherwise healthy controls, while their pancreas and heart R2* values did not significantly differ.
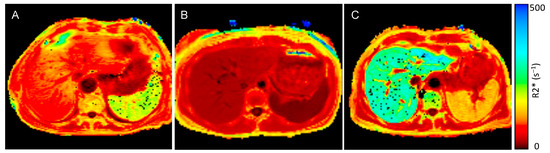
Figure 2.
MRI R2* map of a patient with anemia and end-stage kidney disease (ESKD), control individual, and a patient with transfusion-related iron overload: (A) R2* maps of an anemic ESKD patient (spleen R2* value 189.7 s−1, liver R2* value 88.4 s−1), (B) R2* map of an otherwise healthy control individual without inflammation (spleen R2* value 15.3 s−1, liver R2* value 29.1 s−1) and (C) a patient with transfusion-related iron overload (spleen R2* value 126.0 s−1, liver R2* value 290.3 s−1)—dark red represents low R2* values and low iron concentrations, bright red and orange represents higher R2* values and higher iron concentrations, yellow and green represent the highest iron concentrations.
The duration from the initiation of first hemodialysis was positively associated with spleen (rs = 0.618, p = 0.004) and liver R2* values (rs = 0.535, p = 0.015) but not with pancreas (rs = 0.233, p = −0.279) and heart R2* values (rs = 0.401, p = 0.080). We then analyzed the fat content of the spleen and liver by MRI-proton density fat fraction (MRI-PDFF), which accurately measures the fat fraction of tissue by correcting factors influencing the magnetic resonance signal intensity. We found that anemic ESKD patients had significantly higher spleen PDFF-values compared to controls (3.4% vs. 1.8%, p = 0.005), while there was also a trend for higher liver PDFF-values (2.3% vs. 1.7%, p = 0.086). Finally, the spleen volume was also significantly higher in anemic ESKD patients compared to controls (351.8 cm3 vs. 223.7 cm3, p = 0.001) (Table 1).
R2* values of liver (90.1 s−1 vs. 135.7 s−1, p = 0.169), spleen (119.8 s−1 vs. 79.7 s−1, p = 0.169), pancreas (31.0 s−1 vs. 30.8 s−1, p = 0.231) and heart (27.4 s−1 vs. 27.0 s−1, p = 0.650), and the spleen volume of anemic ESKD patients did not significantly differ when compared to a small cohort of patients with mild TRIO (a median of 10 RBC transfusions within the last year). Conversely, patients with TRIO had a significantly higher spleen volume compared to anemic ESKD patients (572.3 cm3 vs. 351.8 cm3, p = 0.001), while they tended to have lower spleen PDFF-values (1.5% vs. 3.4%, p = 0.055).
3.3. Peripheral Iron Measurements Do Not Reflect Tissue Iron Distribution Appropriately
Ten patients with ESDR had ID (TfS ≤ 30% and ferritin ≤ 500 ng/mL) and received iron supplementation as recommended in the KDIGO guidelines [32]. Although these patients had significantly lower spleen (110.4 s−1 vs. 188.1 s−1, p = 0.029) and liver R2* values (63.0 s−1 vs. 99.5 s−1, p = 0.043) compared to those without ID, three patients had elevated spleen and liver R2* values, four patients had only elevated spleen R2* values and one patient had an elevated liver R2* value. Interestingly, all 10 patients without ID (KDIGO guidelines) had elevated spleen R2* values and 8 patients also had elevated liver R2* values.
When comparing patients with ferritin < 200 ng/mL (absolute ID, n = 3) and ferritin 200–500 ng/dL together with a TfS < 30% (combined ID, n = 7) we found that patients with absolute ID had lower liver (42.7 s−1 vs. 81.4 s−1) and spleen R2* values (40.5 s−1 vs. 140.3 s−1); yet, the low number of patients not allow for appropriate statistical analysis. Only one patient with absolute ID had elevated spleen R2* values, while no one had elevated liver R2* values. In the ROC analysis, a ferritin of 340 ng/mL was best to discriminate between normal and elevated spleen R2* values (sensitivity 87.5%, specificity 100%, AUC 0.958 [95%CI 0.862–1.055]), while a ferritin of 490 ng/mL was best to discriminate between normal and elevated liver R2* values (sensitivity 58.3%, specificity 85.7%, AUC 0.738 [95% CI 0.497–0.979]). For TfS, the ROC analysis revealed a cut-off of 19.5% to discriminate between normal and elevated spleen R2* values (sensitivity 62.5%, specificity 66.7%, AUC 0.635 [95% CI 0.259–1.012]), while a cut-off of 15.0% was best to discriminate between normal and elevated liver R2* values (sensitivity 100%, specificity 28.6%, AUC 0.601 [95% CI 0.330–0.873]).
3.4. Tissue Iron Distribution, Serum Iron Homeostasis and Inflammatory Biomarkers
In anemic ESKD patients, spleen R2* values correlated with ferritin (rs = 0.602, p = 0.005, Figure 3A), transferrin (rs = −0.468, p = 0.038), hepcidin (rs = 0.481, p = 0.032) and neopterin concentrations (rs = 0.612, p = 0.004, Figure 3B) but not with CRP (rs = 0.144, p = 0.543) or IL-6 levels (rs = 0.139, p = 0.558), while liver R2* values correlated with ferritin (rs = 0.624, p = 0.003, Figure 3C), transferrin (rs = −0.567, p = 0.009) and the sTfR-F (rs = −0.489, p = 0.029, Figure 3D) and insignificantly with neopterin (rs = 0.436, p = 0.055) and hepcidin levels (rs = 0.395, p = 0.085). Pancreatic R2* values correlated only weakly with hepcidin levels (rs = −0.476, p = 0.034) and heart R2* values with transferrin levels (rs = −0.447, p = 0.048). Interestingly, the spleen volume correlated with CRP (rs = 0.537, p = 0.015), IL-6 (rs = 0.738, p < 0.001), Hb (rs = −0.624, p = 0.003) and Hk (rs = −0.534, p = 0.015), while no correlations with parameters of iron metabolism were found.
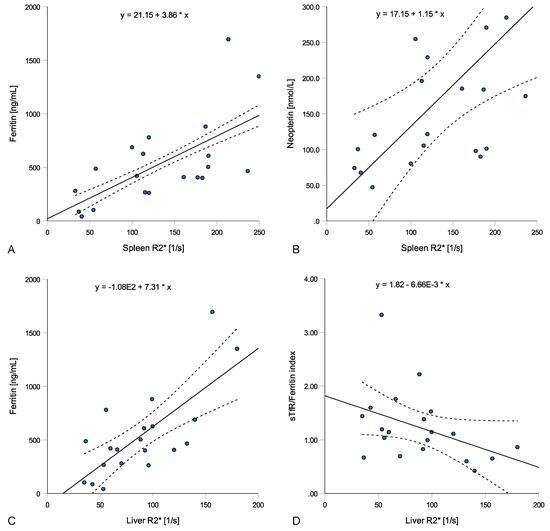
Figure 3.
Relations of spleen and liver R2* values with laboratory parameters in patients with anemia in end-stage kidney disease (ESKD). Spleen R2* positively correlated with ferritin ((A); rs = 0.602, p = 0.005) and neopterin ((B); rs = 0.612, p = 0.004), while liver R2* positively correlated with ferritin ((C); rs = 0.624, p = 0.003) and negatively with the sTfR/ferritin index ((D); rs = −0.489, p = 0.029).
Since neopterin is excreted by the kidney, we also calculated the neopterin/creatinine ratio. The neopterin/creatinine ratio correlated with spleen (rs = 0.447, p = 0.048) and liver R2*-value* values (rs = 0.547, p = 0.012) but not with pancreas (rs = 0.005, p = 0.985) orand heart R2*-value* values (rs = 0.366, p = 0.112).
We performed linear regression analysis adjusted for age and stratified for sex, and we found that ferritin, Tf, hepcidin and neopterin, but not TfS, sTfR, sTfR-F, CRP or IL-6, predict spleen R2* values in anemic ESKD patients. When performing multivariate linear regression analysis stratified for sex and adjusted for age, ferritin, Tf, hepcidin and neopterin, only ferritin and neopterin were remaining remained as significant predictors offor spleen R2* values (Table 2).
Table 2.
Linear regression analysis.
In terms of liver R2* values, we found that ferritin, hepcidin, CRP and neopterin predicted liver R2* values in linear regression analysis adjusted for age and stratified for sex, while Tf, TfS, sTfR, sTfR-F and IL-6 did not. Again, when performing multivariate linear regression analysis stratified for sex and adjusted for age, ferritin, hepcidin, CRP and neopterin, only ferritin remained as a significant predictor offor liver R2* values (Table 2).
3.5. Iron Supplementation, ESA Therapy and Tissue Iron Distribution
Out of 20 ESKD patients, 14 patients received intravenous iron supplementation with FerMed® and 19 patients received ESA therapy with Eporatio® at the time of inclusion. The median iron dosage within the last year was 3550 mg (1500–4900 mg) and the median ESA dosage within the last year was 395,000 IU (296,000–705,000 IU). Patients with iron supplementation had higher liver R2* values compared to patients without iron supplementation, while spleen, pancreas, and heart R2* values as well as ferritin, TfS, hepcidin, sTfR, sTfR-F, and Hb did not differ (Table 3). However, the patient numbers were too small to perform appropriate statistical processing. Interestingly, no statistically significant correlation was found between iron dosage within the last year (in 19 patients with available dosing within the last year) and R2* values of liver (rs = 0.291, p = 0.226) and spleen (rs = 0.206, p = 0.397), while there was a negative correlation with hepcidin levels (rs = −0.471, p = 0.042) and parameters of iron metabolism.
Table 3.
Characteristics of patients with iron supplementation.
ESA dose within the last year correlated with spleen R2* values (rs = 0.566, p = 0.012) but not with liver (rs = 0.292, p = 0.225), pancreas (rs = −0.136, p = 0.579) or heart R2* values (rs = −0.324, p = 0.175). ESA dose further correlated with Ret-Hb (rs = −0.476, p = 0.039), neopterin (rs = 0.494, p = 0.032) and the neopterin/creatinine ratio (rs = 0.497, p = 0.031), while again no correlation was found with parameters of iron metabolism or inflammation.
4. Discussion
Herein, we demonstrated that liver and especially spleen iron concentrations were significantly higher in anemic ESKD patients compared to healthy controls. According to the reference ranges, 85% had elevated spleen iron concentrations (SIC) and 60% elevated liver iron concentrations (LIC). SIC positively correlated with ferritin, transferrin, hepcidin, and neopterin, while LIC positively correlated with ferritin and transferrin. However, in multivariate linear regression analysis only ferritin remained a significant predictor for SIC and LIC. Of note, no increased iron load was detected in pancreas and heart. Iron can accumulate following continuous iron supplementation or due to recycled iron from damaged red blood cells (RBC) [41]. As a consequence, hemodialysis for a longer period of time would result in a higher risk for tissue iron accumulation. Actually, spleen and to a lesser extend liver R2* values were positively correlating with the duration since first hemodialysis.
Serum ferritin and TfS can be similar to those seen in patients with TRIO [42]. Accordingly, tissue iron concentrations did not significantly differ when compared to a small cohort of hemato-oncologic patients with mild TRIO.
Current guidelines recommend iron supplementation for treatment of anemia in ESKD based on cut-offs for serum iron biomarkers (TfS ≤ 30% and ferritin ≤ 500 ng/mL) [32]. Application of these guidelines to our cohort of ESKD patients identified 10 patients with a need for iron supplementation. However, 70% of these patients already had increased SIC and 40% already had increased LIC, suggesting an overtreatment with potentially more harmful effects including cell death, fibrosis, and carcinogenesis [43]. Thus, additional indicators of body iron status and tissue iron retention may help to better guide iron supplementation [44]. This could include MRI-based evaluation of body iron stores as our investigation indicated that a more restrictive ID definition in ESDR (e.g., ferritin < 350 ng/mL and TfS < 20%) may better identify patients who benefit from iron supplementation and are not at risk for iron overload. Also, other iron biomarkers including sTfR, hepcidin, erythroferrone or soluble hemojuvelin (sHJV) might be useful to better identify patients with a need for iron supplementation [45,46].
In the scientific literature, data on tissue iron distributions in ESKD patients are rare. Actually, a recent systemic review and meta-analysis could identify only seven studies that investigated tissue iron content by MRI-relaxometry in ESKD patients [29]. While six studies investigated LIC (heart iron concentrations were additionally measured in two studies), there was only one comparable study investigating the iron content of the liver, spleen, pancreas and heart in 21 patients with ESKD, whereas 100% had elevated SIC and 95% elevated LIC (when using the same reference ranges) [47]. However, the evaluated cohorts differed, especially concerning the Hb and ferritin levels, limiting the comparability of these results: Ghoti et al. included ESKD patients with intravenous iron therapy and ferritin >1000 ng/mL, while our study included ESKD patients with anemia with median ferritin levels of 444 ng/mL. This suggests that iron primarily accumulates in the spleen before being redistributed to the liver when iron overload progresses. Actually, erythrophagocytosis of damaged RBCs accumulating following chronic hemolysis during hemodialysis [48] primarily occurs in macrophages resident in the spleen [49]. The positive correlation of ESA dosage and SIC would support this finding since a shortened RBC lifespan was shown to be associated with ESA dose [50,51].
Nevertheless, transfused iron–carbohydrate complexes are taken up by macrophages and Kupffer cells [52], while studies using positron emission tomography demonstrated a slightly higher uptake in the liver [53]. Actually, patients who received iron supplementation within the last year had significantly higher liver but not spleen iron concentrations compared to patients without iron supplementation. These results suggest that intravenous iron might be primarily stored in the liver, while iron recycled from damaged RBCs might primarily accumulate in the spleen.
Neopterin, reflecting activation of monocytes and macrophages, and also hepcidin levels were correlated with spleen R2* values, while there was only a trend for correlation with liver R2* values, suggesting that inflammation-related iron restriction might primarily occur in the spleen. This is supported by animal models that demonstrated that macrophages withholding iron primarily accumulate in the spleen under inflammatory conditions [54,55], which could also be confirmed by a recent MRI investigation showing that patients with inflammatory anemia primarily accumulate iron in the spleen [56].
Limitations: We performed a pilot study that intended to investigate tissue iron distribution in a small cohort of anemic ESKD patients with preliminary results. Further studies with a higher number of patients are needed to verify these results with higher statistical power. The results of this study do not allow unrestricted generalization to the heterogenic group of ESKD patients. Although R2*-relaxometry is an established method for detecting iron concentrations in different tissues [40], there was no histologically verification by concomitant biopsies of the spleen until now. Previous studies used conversion formulas for liver iron concentrations to obtain spleen iron concentrations [39,57].
5. Conclusions
We demonstrated that liver and especially spleen iron concentrations were significantly higher in anemic ESKD patients compared to healthy controls, while elevated iron concentrations in pancreas and heart were not detected. A substantial proportion of ESKD patients with spleen and/or liver iron overload should receive iron supplementation when applying the current serum biomarker cut-offs according to the KDIGO guidelines. The duration since first hemodialysis was associated with both spleen and liver iron concentrations while the ESA dosage was associated with spleen iron concentrations and iron supplementation was associated with liver iron concentrations. Measurement of tissue iron distribution by MRI in addition to serum iron parameters might help guide iron supplementation therapy in some patients with ESKD in order to identify those who have already developed tissue iron overload, thus preventing overtreatment with potentially toxic effects.
Author Contributions
Conceptualization, methodology and supervision, B.H. and G.W.; software and formal analysis, L.L. and C.K.; investigation and data curation, L.L., M.P., J.F., V.P., S.D., D.H., H.N., K.S. and M.R.; resources, M.P., C.K. and B.H.; writing—original draft preparation, L.L.; writing—review and editing, M.P., J.F., V.P., S.D., D.H., H.N., K.S., M.R., C.K., B.H. and G.W.; visualization, L.L. All authors have read and agreed to the published version of the manuscript.
Funding
This research received no external funding.
Institutional Review Board Statement
This study was conducted in accordance with the Declaration of Helsinki and approved by the Ethics Committee of the Medical University of Innsbruck (ethical vote ID: UN5093, session number 325/4.14, approval date 27 March 2020).
Informed Consent Statement
Informed consent was obtained from all subjects involved in this study.
Data Availability Statement
The data that support the findings of this study are available from the corresponding author upon reasonable request.
Conflicts of Interest
The authors declare no conflicts of interest.
References
- Moreno, F.; Gomez, J.M.L.; Sanz-Guajardo, D.; Jofre, R.; Valderrábano, F.; Spanish Cooperative Renal Patients Quality of Life Study Group4. Quality of life in dialysis patients. A Spanish multicentre study. Nephrol. Dial. Transplant. 1996, 11, 125–129. [Google Scholar] [CrossRef] [PubMed]
- Astor, B.C.; Coresh, J.; Heiss, G.; Pettitt, D.; Sarnak, M.J. Kidney function and anemia as risk factors for coronary heart disease and mortality: The Atherosclerosis Risk in Communities (ARIC) Study. Am. Heart J. 2006, 151, 492–500. [Google Scholar] [CrossRef] [PubMed]
- Kovesdy, C.P.; Trivedi, B.K.; Kalantar-Zadeh, K.; Anderson, J.E. Association of anemia with outcomes in men with moderate and severe chronic kidney disease. Kidney Int. 2006, 69, 560–564. [Google Scholar] [CrossRef] [PubMed]
- St Peter, W.L.; Guo, H.; Kabadi, S.; Gilbertson, D.T.; Peng, Y.; Pendergraft, T.; Li, S. Prevalence, treatment patterns, and healthcare resource utilization in Medicare and commercially insured non-dialysis-dependent chronic kidney disease patients with and without anemia in the United States. BMC Nephrol. 2018, 19, 67. [Google Scholar] [CrossRef]
- Inker, L.A.; Grams, M.E.; Levey, A.S.; Coresh, J.; Cirillo, M.; Collins, J.F.; Gansevoort, R.T.; Gutierrez, O.M.; Hamano, T.; Heine, G.H.; et al. Relationship of Estimated GFR and Albuminuria to Concurrent Laboratory Abnormalities: An Individual Participant Data Meta-analysis in a Global Consortium. Am. J. Kidney Dis. 2019, 73, 206–217. [Google Scholar] [CrossRef] [PubMed]
- Portolés, J.; Martín, L.; Broseta, J.J.; Cases, A. Anemia in Chronic Kidney Disease: From Pathophysiology and Current Treatments, to Future Agents. Front. Med. 2021, 8, 642296. [Google Scholar] [CrossRef] [PubMed]
- Shih, H.-M.; Wu, C.-J.; Lin, S.-L. Physiology and pathophysiology of renal erythropoietin-producing cells. J. Formos. Med. Assoc. 2018, 117, 955–963. [Google Scholar] [CrossRef]
- Babitt, J.L.; Lin, H.Y. Mechanisms of anemia in CKD. J. Am. Soc. Nephrol. 2012, 23, 1631–1634. [Google Scholar] [CrossRef]
- Wenger, R.H.; Hoogewijs, D. Regulated oxygen sensing by protein hydroxylation in renal erythropoietin-producing cells. Am. J. Physiol. Ren. Physiol. 2010, 298, F1287–F1296. [Google Scholar] [CrossRef]
- Dallalio, G.; Law, E.; Means, R.T., Jr. Hepcidin inhibits in vitro erythroid colony formation at reduced erythropoietin concentrations. Blood 2006, 107, 2702–2704. [Google Scholar] [CrossRef]
- Libregts, S.F.; Gutiérrez, L.; de Bruin, A.M.; Wensveen, F.M.; Papadopoulos, P.; van Ijcken, W.; Ozgür, Z.; Philipsen, S.; Nolte, M.A. Chronic IFN-γ production in mice induces anemia by reducing erythrocyte life span and inhibiting erythropoiesis through an IRF-1/PU.1 axis. Blood 2011, 118, 2578–2588. [Google Scholar] [CrossRef] [PubMed]
- Mitlyng, B.L.; Singh, J.A.; Furne, J.K.; Ruddy, J.; Levitt, M.D. Use of breath carbon monoxide measurements to assess erythrocyte survival in subjects with chronic diseases. Am. J. Hematol. 2006, 81, 432–438. [Google Scholar] [CrossRef] [PubMed]
- Theurl, I.; Hilgendorf, I.; Nairz, M.; Tymoszuk, P.; Haschka, D.; Asshoff, M.; He, S.; Gerhardt, L.M.; Holderried, T.A.; Seifert, M.; et al. On-demand erythrocyte disposal and iron recycling requires transient macrophages in the liver. Nat. Med. 2016, 22, 945–951. [Google Scholar] [CrossRef] [PubMed]
- Macdougall, I.C.; Bock, A.; Carrera, F.; Eckardt, K.U.; Gaillard, C.; Van Wyck, D.; Roubert, B.; Cushway, T.; Roger, S.D. The FIND-CKD study--a randomized controlled trial of intravenous iron versus oral iron in non-dialysis chronic kidney disease patients: Background and rationale. Nephrol. Dial. Transpl. 2014, 29, 843–850. [Google Scholar] [CrossRef] [PubMed]
- Hentze, M.W.; Muckenthaler, M.U.; Galy, B.; Camaschella, C. Two to tango: Regulation of Mammalian iron metabolism. Cell 2010, 142, 24–38. [Google Scholar] [CrossRef]
- Batchelor, E.K.; Kapitsinou, P.; Pergola, P.E.; Kovesdy, C.P.; Jalal, D.I. Iron Deficiency in Chronic Kidney Disease: Updates on Pathophysiology, Diagnosis, and Treatment. J. Am. Soc. Nephrol. 2020, 31, 456–468. [Google Scholar] [CrossRef] [PubMed]
- Ganz, T.; Nemeth, E. Hepcidin and iron homeostasis. Biochim. Biophys. Acta 2012, 1823, 1434–1443. [Google Scholar] [CrossRef]
- Theurl, I.; Aigner, E.; Theurl, M.; Nairz, M.; Seifert, M.; Schroll, A.; Sonnweber, T.; Eberwein, L.; Witcher, D.R.; Murphy, A.T.; et al. Regulation of iron homeostasis in anemia of chronic disease and iron deficiency anemia: Diagnostic and therapeutic implications. Blood 2009, 113, 5277–5286. [Google Scholar] [CrossRef]
- Weiss, G.; Theurl, I.; Eder, S.; Koppelstaetter, C.; Kurz, K.; Sonnweber, T.; Kobold, U.; Mayer, G. Serum hepcidin concentration in chronic haemodialysis patients: Associations and effects of dialysis, iron and erythropoietin therapy. Eur. J. Clin. Investig. 2009, 39, 883–890. [Google Scholar] [CrossRef]
- Nemeth, E.; Tuttle, M.S.; Powelson, J.; Vaughn, M.B.; Donovan, A.; Ward, D.M.; Ganz, T.; Kaplan, J. Hepcidin regulates cellular iron efflux by binding to ferroportin and inducing its internalization. Science 2004, 306, 2090–2093. [Google Scholar] [CrossRef]
- Sonnweber, T.; Theurl, I.; Seifert, M.; Schroll, A.; Eder, S.; Mayer, G.; Weiss, G. Impact of iron treatment on immune effector function and cellular iron status of circulating monocytes in dialysis patients. Nephrol. Dial. Transplant. 2010, 26, 977–987. [Google Scholar] [CrossRef] [PubMed]
- Macdougall, I.C.; White, C.; Anker, S.D.; Bhandari, S.; Farrington, K.; Kalra, P.A.; McMurray, J.J.V.; Murray, H.; Tomson, C.R.V.; Wheeler, D.C.; et al. Intravenous Iron in Patients Undergoing Maintenance Hemodialysis. N. Engl. J. Med. 2019, 380, 447–458. [Google Scholar] [CrossRef] [PubMed]
- Freburger, J.K.; Ellis, A.R.; Wang, L.; Butler, A.M.; Kshirsagar, A.V.; Winkelmayer, W.C.; Brookhart, M.A. Comparative Effectiveness of Iron and Erythropoiesis-Stimulating Agent Dosing on Health-Related Quality of Life in Patients Receiving Hemodialysis. Am. J. Kidney Dis. 2016, 67, 271–282. [Google Scholar] [CrossRef] [PubMed]
- Babitt, J.L.; Eisenga, M.F.; Haase, V.H.; Kshirsagar, A.V.; Levin, A.; Locatelli, F.; Małyszko, J.; Swinkels, D.W.; Tarng, D.C.; Cheung, M.; et al. Controversies in optimal anemia management: Conclusions from a Kidney Disease: Improving Global Outcomes (KDIGO) Conference. Kidney Int. 2021, 99, 1280–1295. [Google Scholar] [CrossRef] [PubMed]
- Ratcliffe, L.E.K.; Thomas, W.; Glen, J.; Padhi, S.; Pordes, B.A.J.; Wonderling, D.; Connell, R.; Stephens, S.; Mikhail, A.I.; Fogarty, D.G.; et al. Diagnosis and Management of Iron Deficiency in CKD: A Summary of the NICE Guideline Recommendations and Their Rationale. Am. J. Kidney Dis. 2016, 67, 548–558. [Google Scholar] [CrossRef] [PubMed]
- De Souza, L.V.; Hoffmann, A.; Fischer, C.; Petzer, V.; Asshoff, M.; Theurl, I.; Tymoszuk, P.; Seifert, M.; Brigo, N.; Hilbe, R.; et al. Comparative analysis of oral and intravenous iron therapy in rat models of inflammatory anemia and iron deficiency. Haematologica 2023, 108, 135–149. [Google Scholar] [CrossRef] [PubMed]
- Macdougall, I.C.; Bircher, A.J.; Eckardt, K.U.; Obrador, G.T.; Pollock, C.A.; Stenvinkel, P.; Swinkels, D.W.; Wanner, C.; Weiss, G.; Chertow, G.M. Iron management in chronic kidney disease: Conclusions from a “Kidney Disease: Improving Global Outcomes” (KDIGO) Controversies Conference. Kidney Int. 2016, 89, 28–39. [Google Scholar] [CrossRef] [PubMed]
- Fleming, R.E.; Ponka, P. Iron Overload in Human Disease. N. Engl. J. Med. 2012, 366, 348–359. [Google Scholar] [CrossRef]
- Nashwan, A.J.; Yassin, M.A.; Abd-Alrazaq, A.; Shuweihdi, F.; Othman, M.; Abdul Rahim, H.F.; Shraim, M. Hepatic and cardiac iron overload quantified by magnetic resonance imaging in patients on hemodialysis: A systematic review and meta-analysis. Hemodial. Int. 2023, 27, 3–11. [Google Scholar] [CrossRef]
- Ribeiro Júnior, R.F.; Marques, V.B.; Nunes, D.O.; Stefanon, I.; Dos Santos, L. Chronic iron overload induces functional and structural vascular changes in small resistance arteries via NADPH oxidase-dependent O2− production. Toxicol. Lett. 2017, 279, 43–52. [Google Scholar] [CrossRef]
- World Health, O. Haemoglobin Concentrations for the Diagnosis of Anaemia and Assessment of Severity; World Health Organization: Geneva, Switzerland, 2011. [Google Scholar]
- Mcmurray, J.; Parfrey, P.S.; Adamson, J.W.; Aljama, P.; Berns, J.S.; Bohlius, J.; Drüeke, T.B.; Finkelstein, F.O.; Fishbane, S.; Ganz, T.; et al. KDIGO Clinical Practice Guideline for Anemia in Chronic Kidney Disease. Off. J. Int. Soc. Nephrol. 2012, 2, 279–335. [Google Scholar] [CrossRef]
- Henninger, B.; Zoller, H.; Rauch, S.; Finkenstedt, A.; Schocke, M.; Jaschke, W.; Kremser, C. R2* relaxometry for the quantification of hepatic iron overload: Biopsy-based calibration and comparison with the literature. Rofo 2015, 187, 472–479. [Google Scholar] [CrossRef] [PubMed]
- He, T.; Gatehouse, P.D.; Smith, G.C.; Mohiaddin, R.H.; Pennell, D.J.; Firmin, D.N. Myocardial T measurements in iron-overloaded thalassemia: An in vivo study to investigate optimal methods of quantification. Magn. Reson. Med. 2008, 60, 1082–1089. [Google Scholar] [CrossRef] [PubMed]
- Henninger, B.; Alustiza, J.; Garbowski, M.; Gandon, Y. Practical guide to quantification of hepatic iron with MRI. Eur. Radiol. 2020, 30, 383–393. [Google Scholar] [CrossRef] [PubMed]
- Kucybała, I.; Ciuk, S.; Tęczar, J. Spleen enlargement assessment using computed tomography: Which coefficient correlates the strongest with the real volume of the spleen? Abdom. Radiol. 2018, 43, 2455–2461. [Google Scholar] [CrossRef] [PubMed]
- Kawel-Boehm, N.; Hetzel, S.J.; Ambale-Venkatesh, B.; Captur, G.; Francois, C.J.; Jerosch-Herold, M.; Salerno, M.; Teague, S.D.; Valsangiacomo-Buechel, E.; van der Geest, R.J.; et al. Reference ranges (“normal values”) for cardiovascular magnetic resonance (CMR) in adults and children: 2020 update. J. Cardiovasc. Magn. Reson. 2020, 22, 87. [Google Scholar] [CrossRef] [PubMed]
- Schwenzer, N.F.; Machann, J.; Haap, M.M.; Martirosian, P.; Schraml, C.; Liebig, G.; Stefan, N.; Häring, H.U.; Claussen, C.D.; Fritsche, A.; et al. T2* relaxometry in liver, pancreas, and spleen in a healthy cohort of one hundred twenty-nine subjects-correlation with age, gender, and serum ferritin. Investig. Radiol. 2008, 43, 854–860. [Google Scholar] [CrossRef] [PubMed]
- Sorokin, E.P.; Basty, N.; Whitcher, B.; Liu, Y.; Bell, J.D.; Cohen, R.L.; Cule, M.; Thomas, E.L. Analysis of MRI-derived spleen iron in the UK Biobank identifies genetic variation linked to iron homeostasis and hemolysis. Am. J. Hum. Genet. 2022, 109, 1092–1104. [Google Scholar] [CrossRef]
- Kromrey, M.L.; Röhnert, A.; Blum, S.; Winzer, R.; Hoffman, R.T.; Völzke, H.; Kacprowski, T.; Kühn, J.P. Whole-body R2∗ mapping to quantify tissue iron in iron storage organs: Reference values and a genotype. Clin. Radiol. 2021, 76, 863.e11–863.e17. [Google Scholar] [CrossRef]
- Coyne, D.W. Iron Overload in Dialysis Patients: Rust or Bust? Kidney Int. Rep. 2017, 2, 995–997. [Google Scholar] [CrossRef]
- Rostoker, G.; Vaziri, N.D.; Fishbane, S. Iatrogenic Iron Overload in Dialysis Patients at the Beginning of the 21st Century. Drugs 2016, 76, 741–757. [Google Scholar] [CrossRef] [PubMed]
- Kohgo, Y.; Ikuta, K.; Ohtake, T.; Torimoto, Y.; Kato, J. Body iron metabolism and pathophysiology of iron overload. Int. J. Hematol. 2008, 88, 7–15. [Google Scholar] [CrossRef] [PubMed]
- Lanser, L.; Fuchs, D.; Kurz, K.; Weiss, G. Physiology and Inflammation Driven Pathophysiology of Iron Homeostasis—Mechanistic Insights into Anemia of Inflammation and Its Treatment. Nutrients 2021, 13, 3732. [Google Scholar] [CrossRef] [PubMed]
- Styczyński, J.; Słomka, A.; Łęcka, M.; Albrecht, K.; Romiszewski, M.; Pogorzała, M.; Kubicka, M.; Kuryło-Rafińska, B.; Tejza, B.; Gadomska, G.; et al. Soluble Hemojuvelin and Ferritin: Potential Prognostic Markers in Pediatric Hematopoietic Cell Transplantation. Cancers 2023, 15, 1041. [Google Scholar] [CrossRef] [PubMed]
- Weiss, G. Anemia of Chronic Disorders: New Diagnostic Tools and New Treatment Strategies. Semin. Hematol. 2015, 52, 313–320. [Google Scholar] [CrossRef] [PubMed]
- Ghoti, H.; Rachmilewitz, E.A.; Simon-Lopez, R.; Gaber, R.; Katzir, Z.; Konen, E.; Kushnir, T.; Girelli, D.; Campostrini, N.; Fibach, E.; et al. Evidence for tissue iron overload in long-term hemodialysis patients and the impact of withdrawing parenteral iron. Eur. J. Haematol. 2012, 89, 87–93. [Google Scholar] [CrossRef] [PubMed]
- Tharmaraj, D.; Kerr, P.G. Haemolysis in haemodialysis. Nephrology 2017, 22, 838–847. [Google Scholar] [CrossRef]
- Klei, T.R.L.; Meinderts, S.M.; van den Berg, T.K.; van Bruggen, R. From the Cradle to the Grave: The Role of Macrophages in Erythropoiesis and Erythrophagocytosis. Front. Immunol. 2017, 8, 73. [Google Scholar] [CrossRef] [PubMed]
- Matsumura, K.; Okumiya, T.; Sugiura, T.; Takahashi, N.; Yamamoto, Y.; Kikuchi, S.; Fujii, K.; Otagaki, M.; Shiojima, I. Shortened red blood cell age in patients with end-stage renal disease who were receiving haemodialysis: A cross-sectional study. BMC Nephrol. 2020, 21, 418. [Google Scholar] [CrossRef]
- Sato, Y.; Mizuguchi, T.; Shigenaga, S.; Yoshikawa, E.; Chujo, K.; Minakuchi, J.; Kawashima, S. Shortened red blood cell lifespan is related to the dose of erythropoiesis-stimulating agents requirement in patients on hemodialysis. Ther. Apher. Dial. 2012, 16, 522–528. [Google Scholar] [CrossRef]
- Koskenkorva-Frank, T.S.; Weiss, G.; Koppenol, W.H.; Burckhardt, S. The complex interplay of iron metabolism, reactive oxygen species, and reactive nitrogen species: Insights into the potential of various iron therapies to induce oxidative and nitrosative stress. Free Radic. Biol. Med. 2013, 65, 1174–1194. [Google Scholar] [CrossRef] [PubMed]
- Beshara, S.; Sörensen, J.; Lubberink, M.; Tolmachev, V.; Långström, B.; Antoni, G.; Danielson, B.G.; Lundqvist, H. Pharmacokinetics and red cell utilization of 52Fe/59Fe-labelled iron polymaltose in anaemic patients using positron emission tomography. Br. J. Haematol. 2003, 120, 853–859. [Google Scholar] [CrossRef] [PubMed]
- Theurl, I.; Mattle, V.; Seifert, M.; Mariani, M.; Marth, C.; Weiss, G. Dysregulated monocyte iron homeostasis and erythropoietin formation in patients with anemia of chronic disease. Blood 2006, 107, 4142–4148. [Google Scholar] [CrossRef] [PubMed]
- Tilg, H.; Ulmer, H.; Kaser, A.; Weiss, G. Role of IL-10 for induction of anemia during inflammation. J. Immunol. 2002, 169, 2204–2209. [Google Scholar] [CrossRef] [PubMed]
- Lanser, L.; Plaikner, M.; Schroll, A.; Burkert, F.R.; Seiwald, S.; Fauser, J.; Petzer, V.; Bellmann-Weiler, R.; Fritsche, G.; Tancevski, I.; et al. Tissue iron distribution in patients with anemia of inflammation: Results of a pilot study. Am. J. Hematol. 2023, 98, 890–899. [Google Scholar] [CrossRef]
- Maximova, N.; Gregori, M.; Boz, G.; Simeone, R.; Zanon, D.; Schillani, G.; Zennaro, F. MRI-based evaluation of multiorgan iron overload is a predictor of adverse outcomes in pediatric patients undergoing allogeneic hematopoietic stem cell transplantation. Oncotarget 2017, 8, 79650–79661. [Google Scholar] [CrossRef]
Disclaimer/Publisher’s Note: The statements, opinions and data contained in all publications are solely those of the individual author(s) and contributor(s) and not of MDPI and/or the editor(s). MDPI and/or the editor(s) disclaim responsibility for any injury to people or property resulting from any ideas, methods, instructions or products referred to in the content. |
© 2024 by the authors. Licensee MDPI, Basel, Switzerland. This article is an open access article distributed under the terms and conditions of the Creative Commons Attribution (CC BY) license (https://creativecommons.org/licenses/by/4.0/).