
Fully Automated Measurement of Cobb Angles in Coronal Plane Spine Radiographs
 , , , and
Abstract
1. Introduction
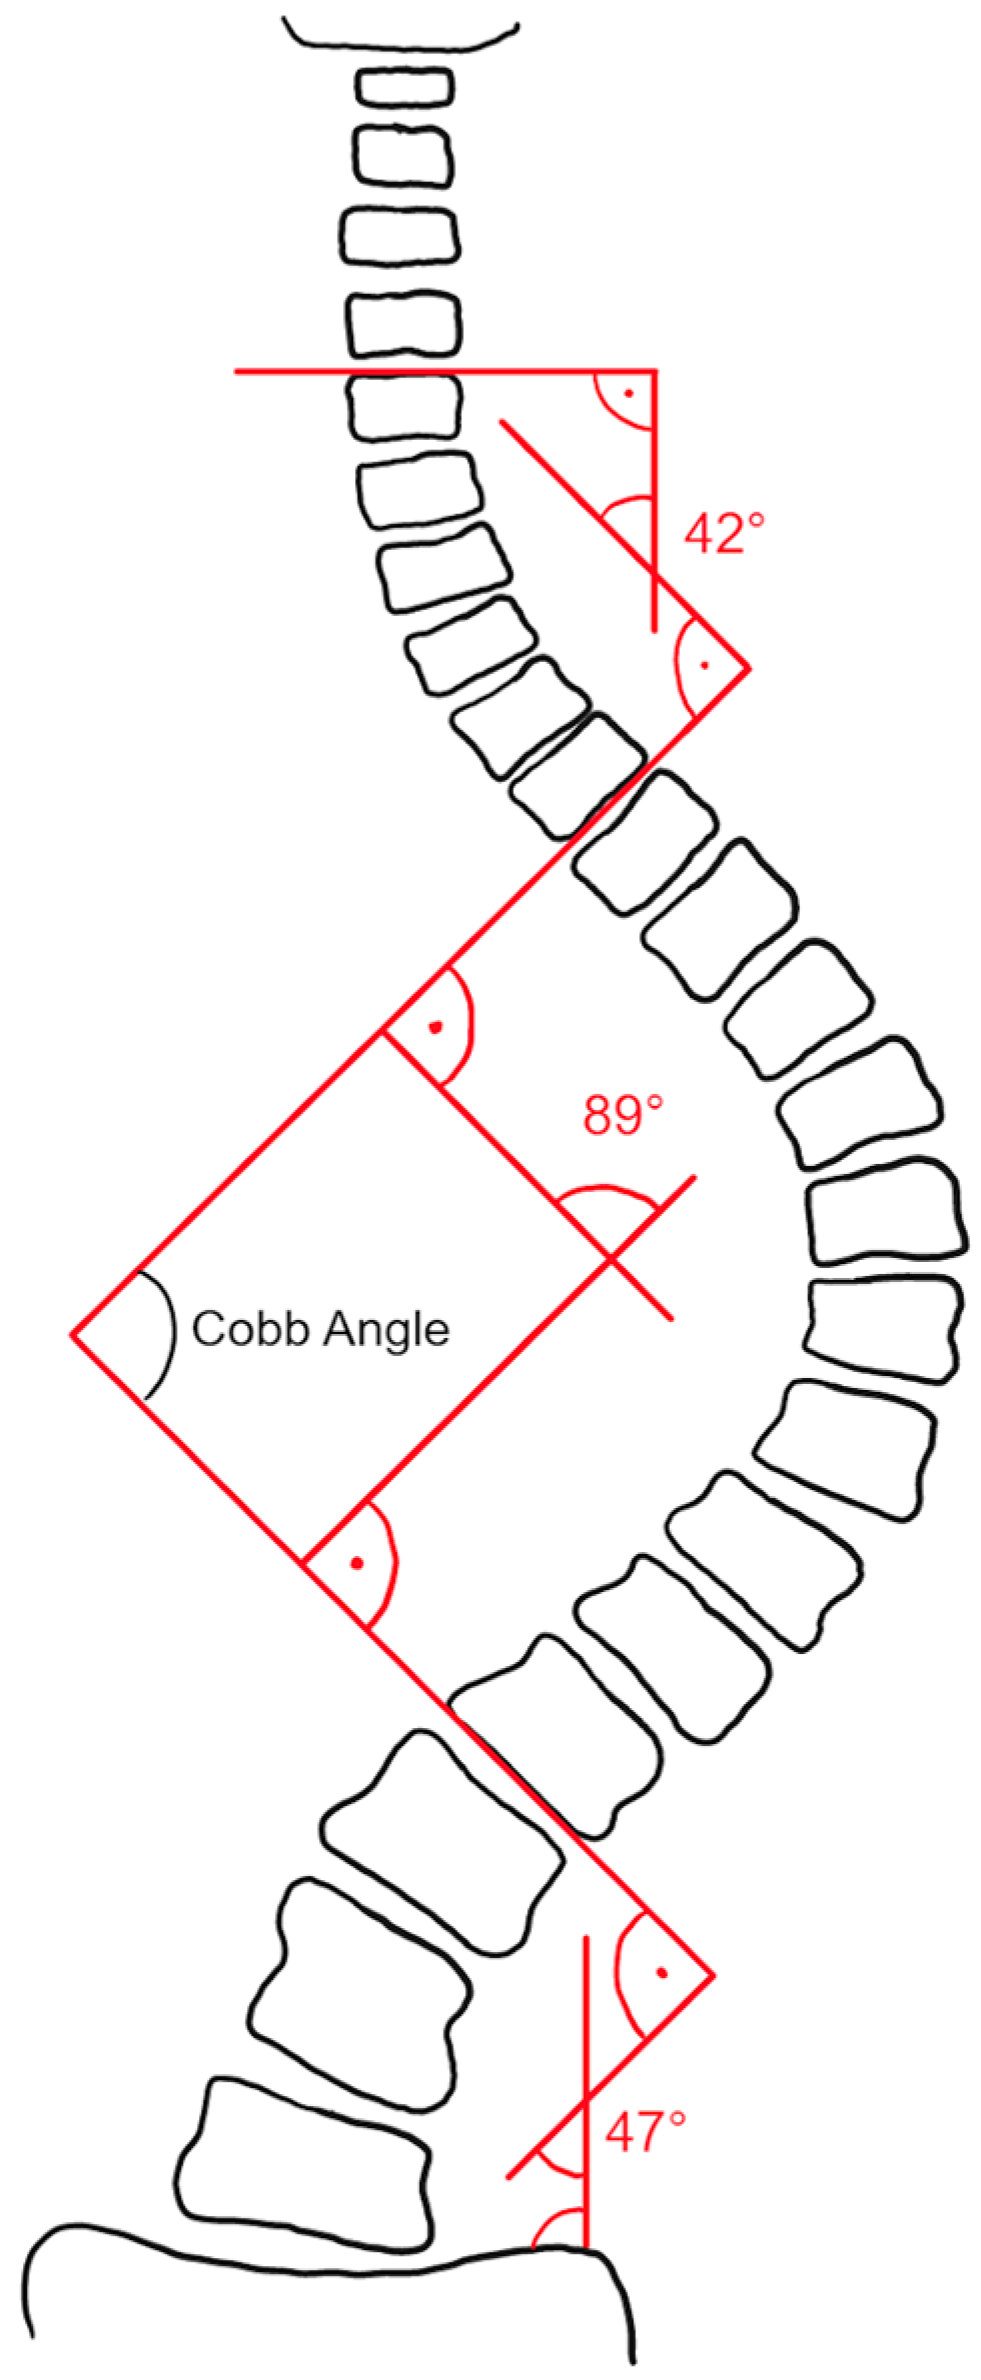
2. Materials and Methods
2.1. Dataset
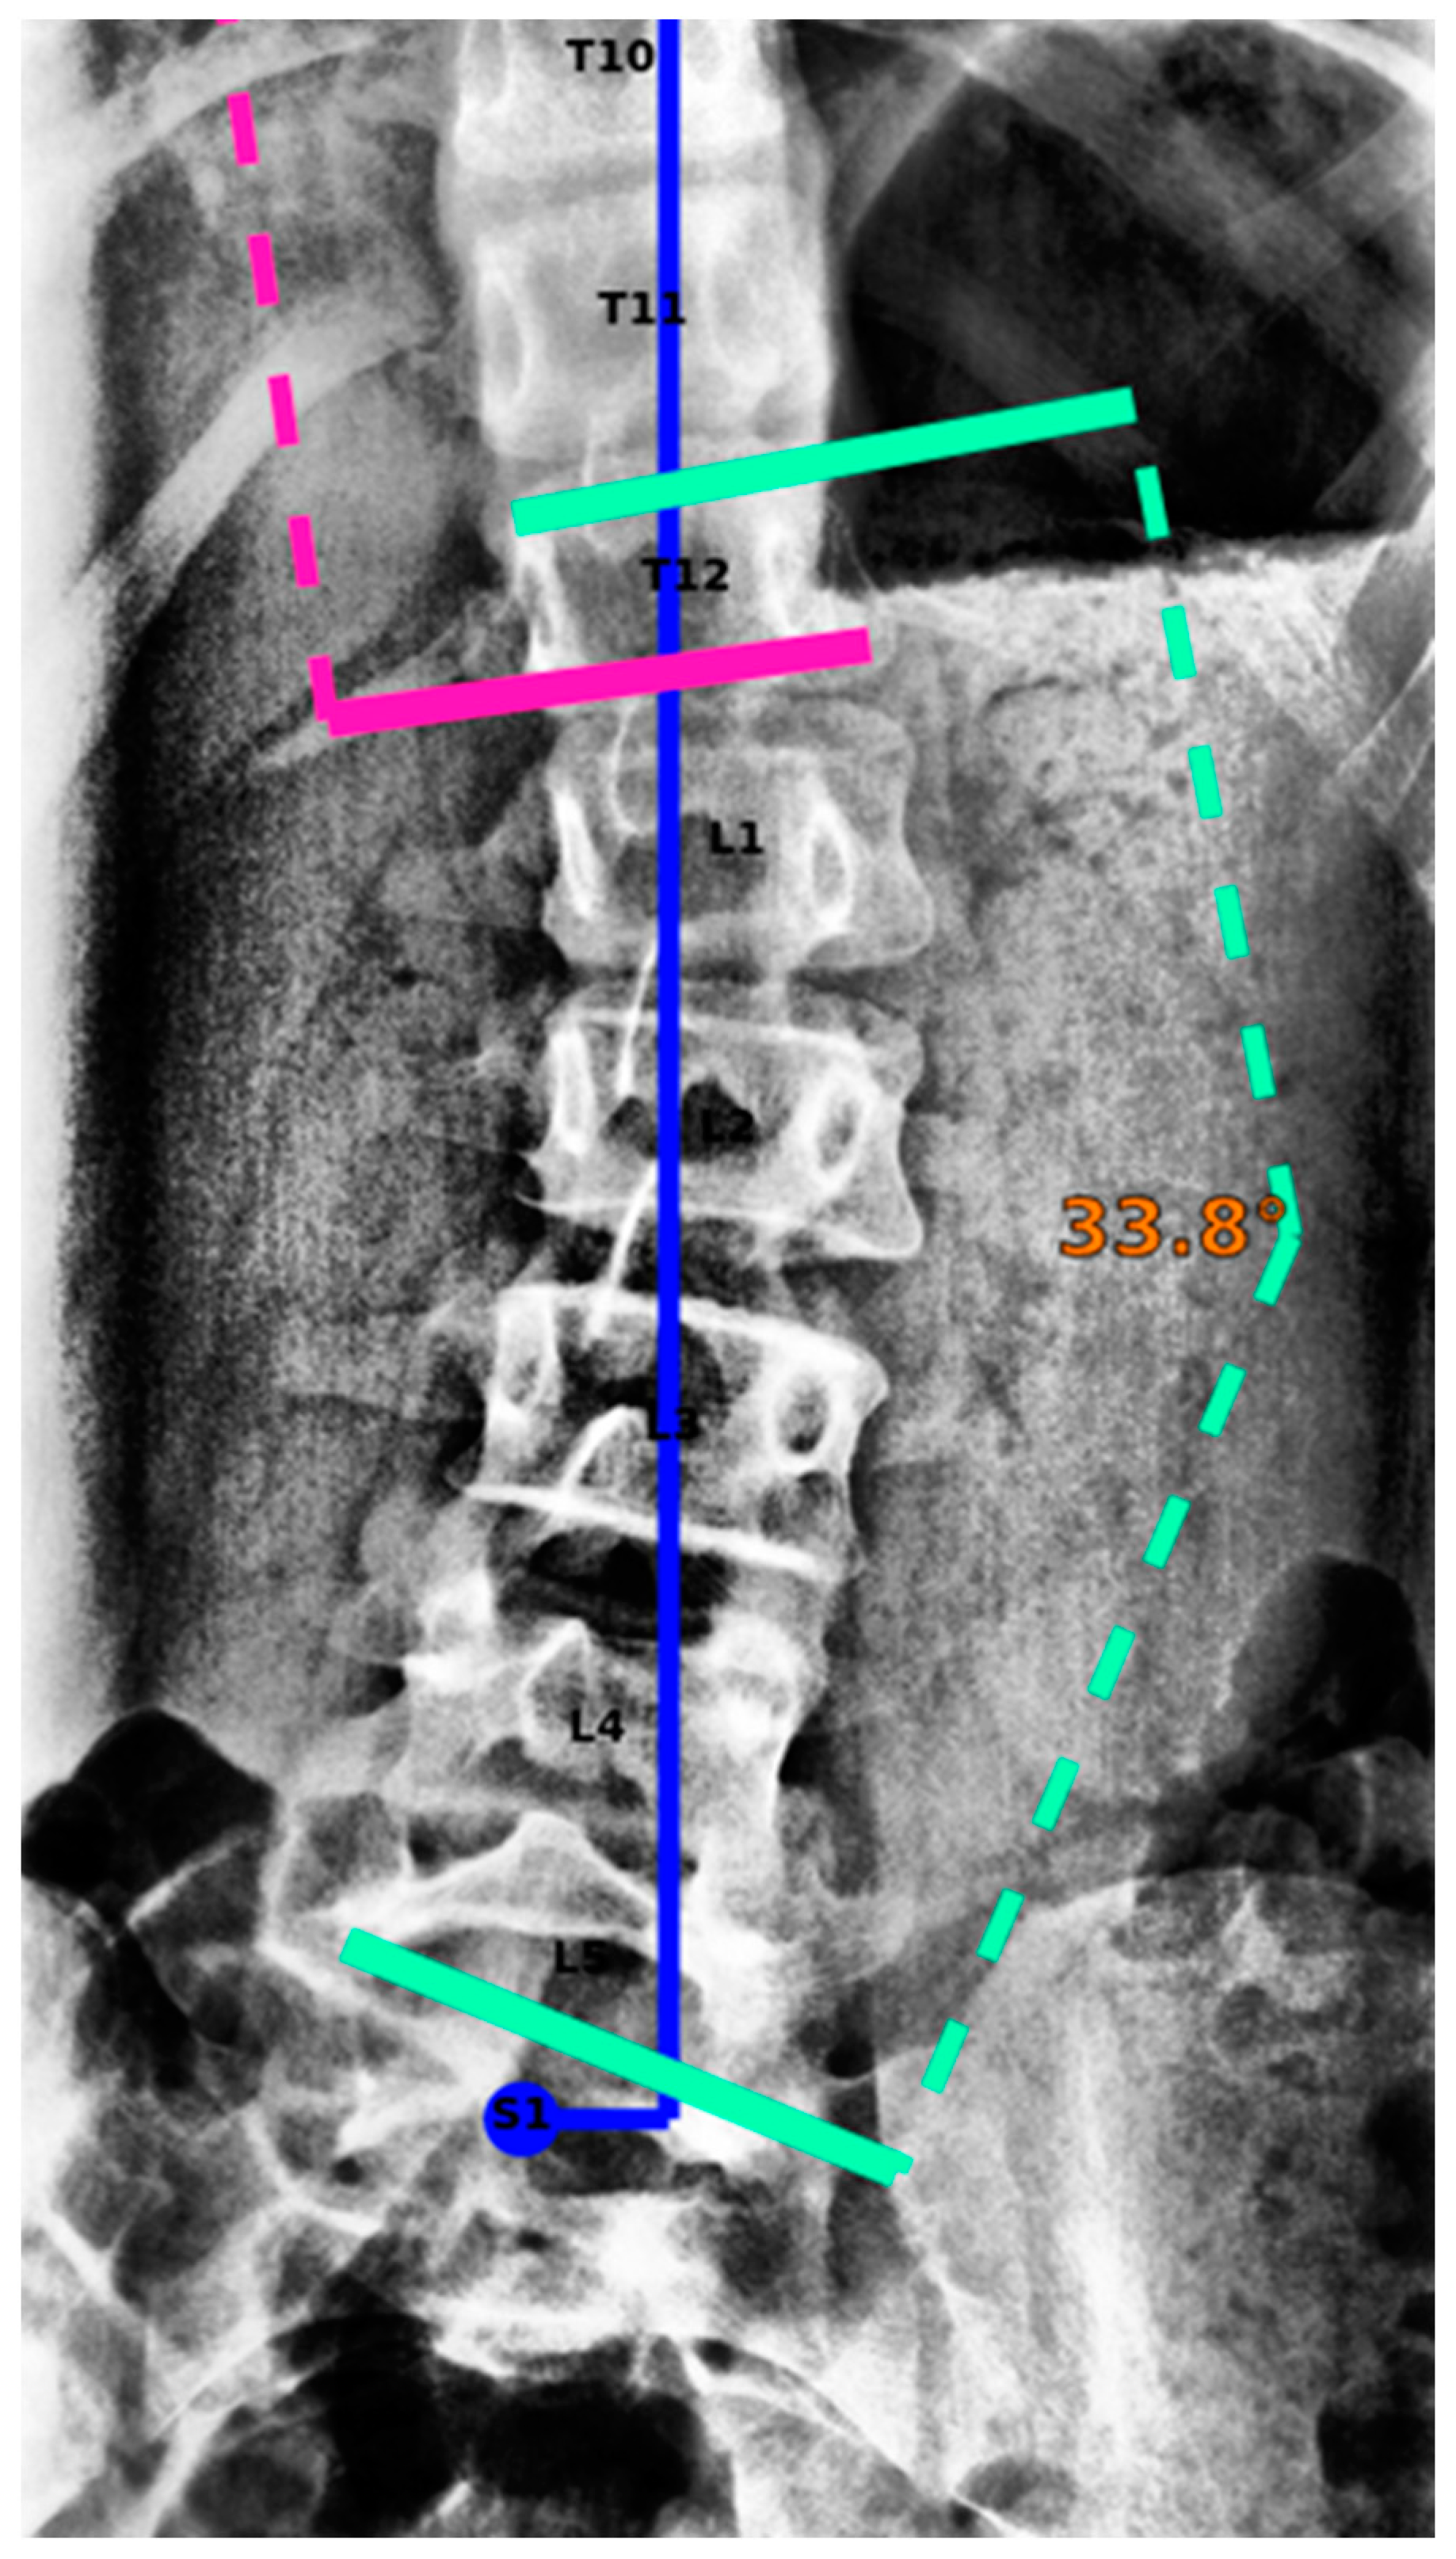
2.2. Reference Standard
- Vertebral labeling from C7 to S1 was compared between the readers. Only images where expert readers agreed on the labeling of vertebrae were used for the study.
- In order to perform Cobb angle measurements, expert readers needed to define spinal curvatures by choosing appropriate superior/inferior end vertebrae. Small deviations in end vertebrae selection were tolerated; specifically, end vertebrae selection of the readers may extend over three consecutive vertebrae. Curvatures were only included in the study if matching superior/inferior end vertebrae could be determined for all readers.
- A spinal curvature was only included in the study if the direction of the curve (levo/dextro) matches for all readers.
- For the remaining curvatures, the reference standard was defined as the median of the readers’ measurements.
- Vertebral labeling from C7 to S1 was compared between the RS and IB Lab SQUIRREL. Only images where IB Lab SQUIRREL agreed with the RS on the labeling of vertebrae were used for the study.
- A spinal curvature was only included in the study if the end vertebrae of IB Lab SQUIRREL matched one of the superior/inferior end vertebrae of the respective RS end vertebrae. As described above, RS superior/inferior end vertebrae of a curvature were allowed to extend over three consecutive vertebrae. In order to give IB Lab SQUIRREL the same flexibility as the readers regarding end vertebrae selection, IB Lab SQUIRREL’s end vertebrae selections were also allowed to deviate slightly from the RS. However, IB Lab SQUIRREL was only permitted to deviate in such a way that the combination of the RS and IB Lab SQUIRREL superior/inferior end vertebrae of a curvature did not include more than three consecutive vertebrae.
- A spinal curvature was only included in the study if the direction of the curve (levo/dextro) matched for IB Lab SQUIRREL and RS.
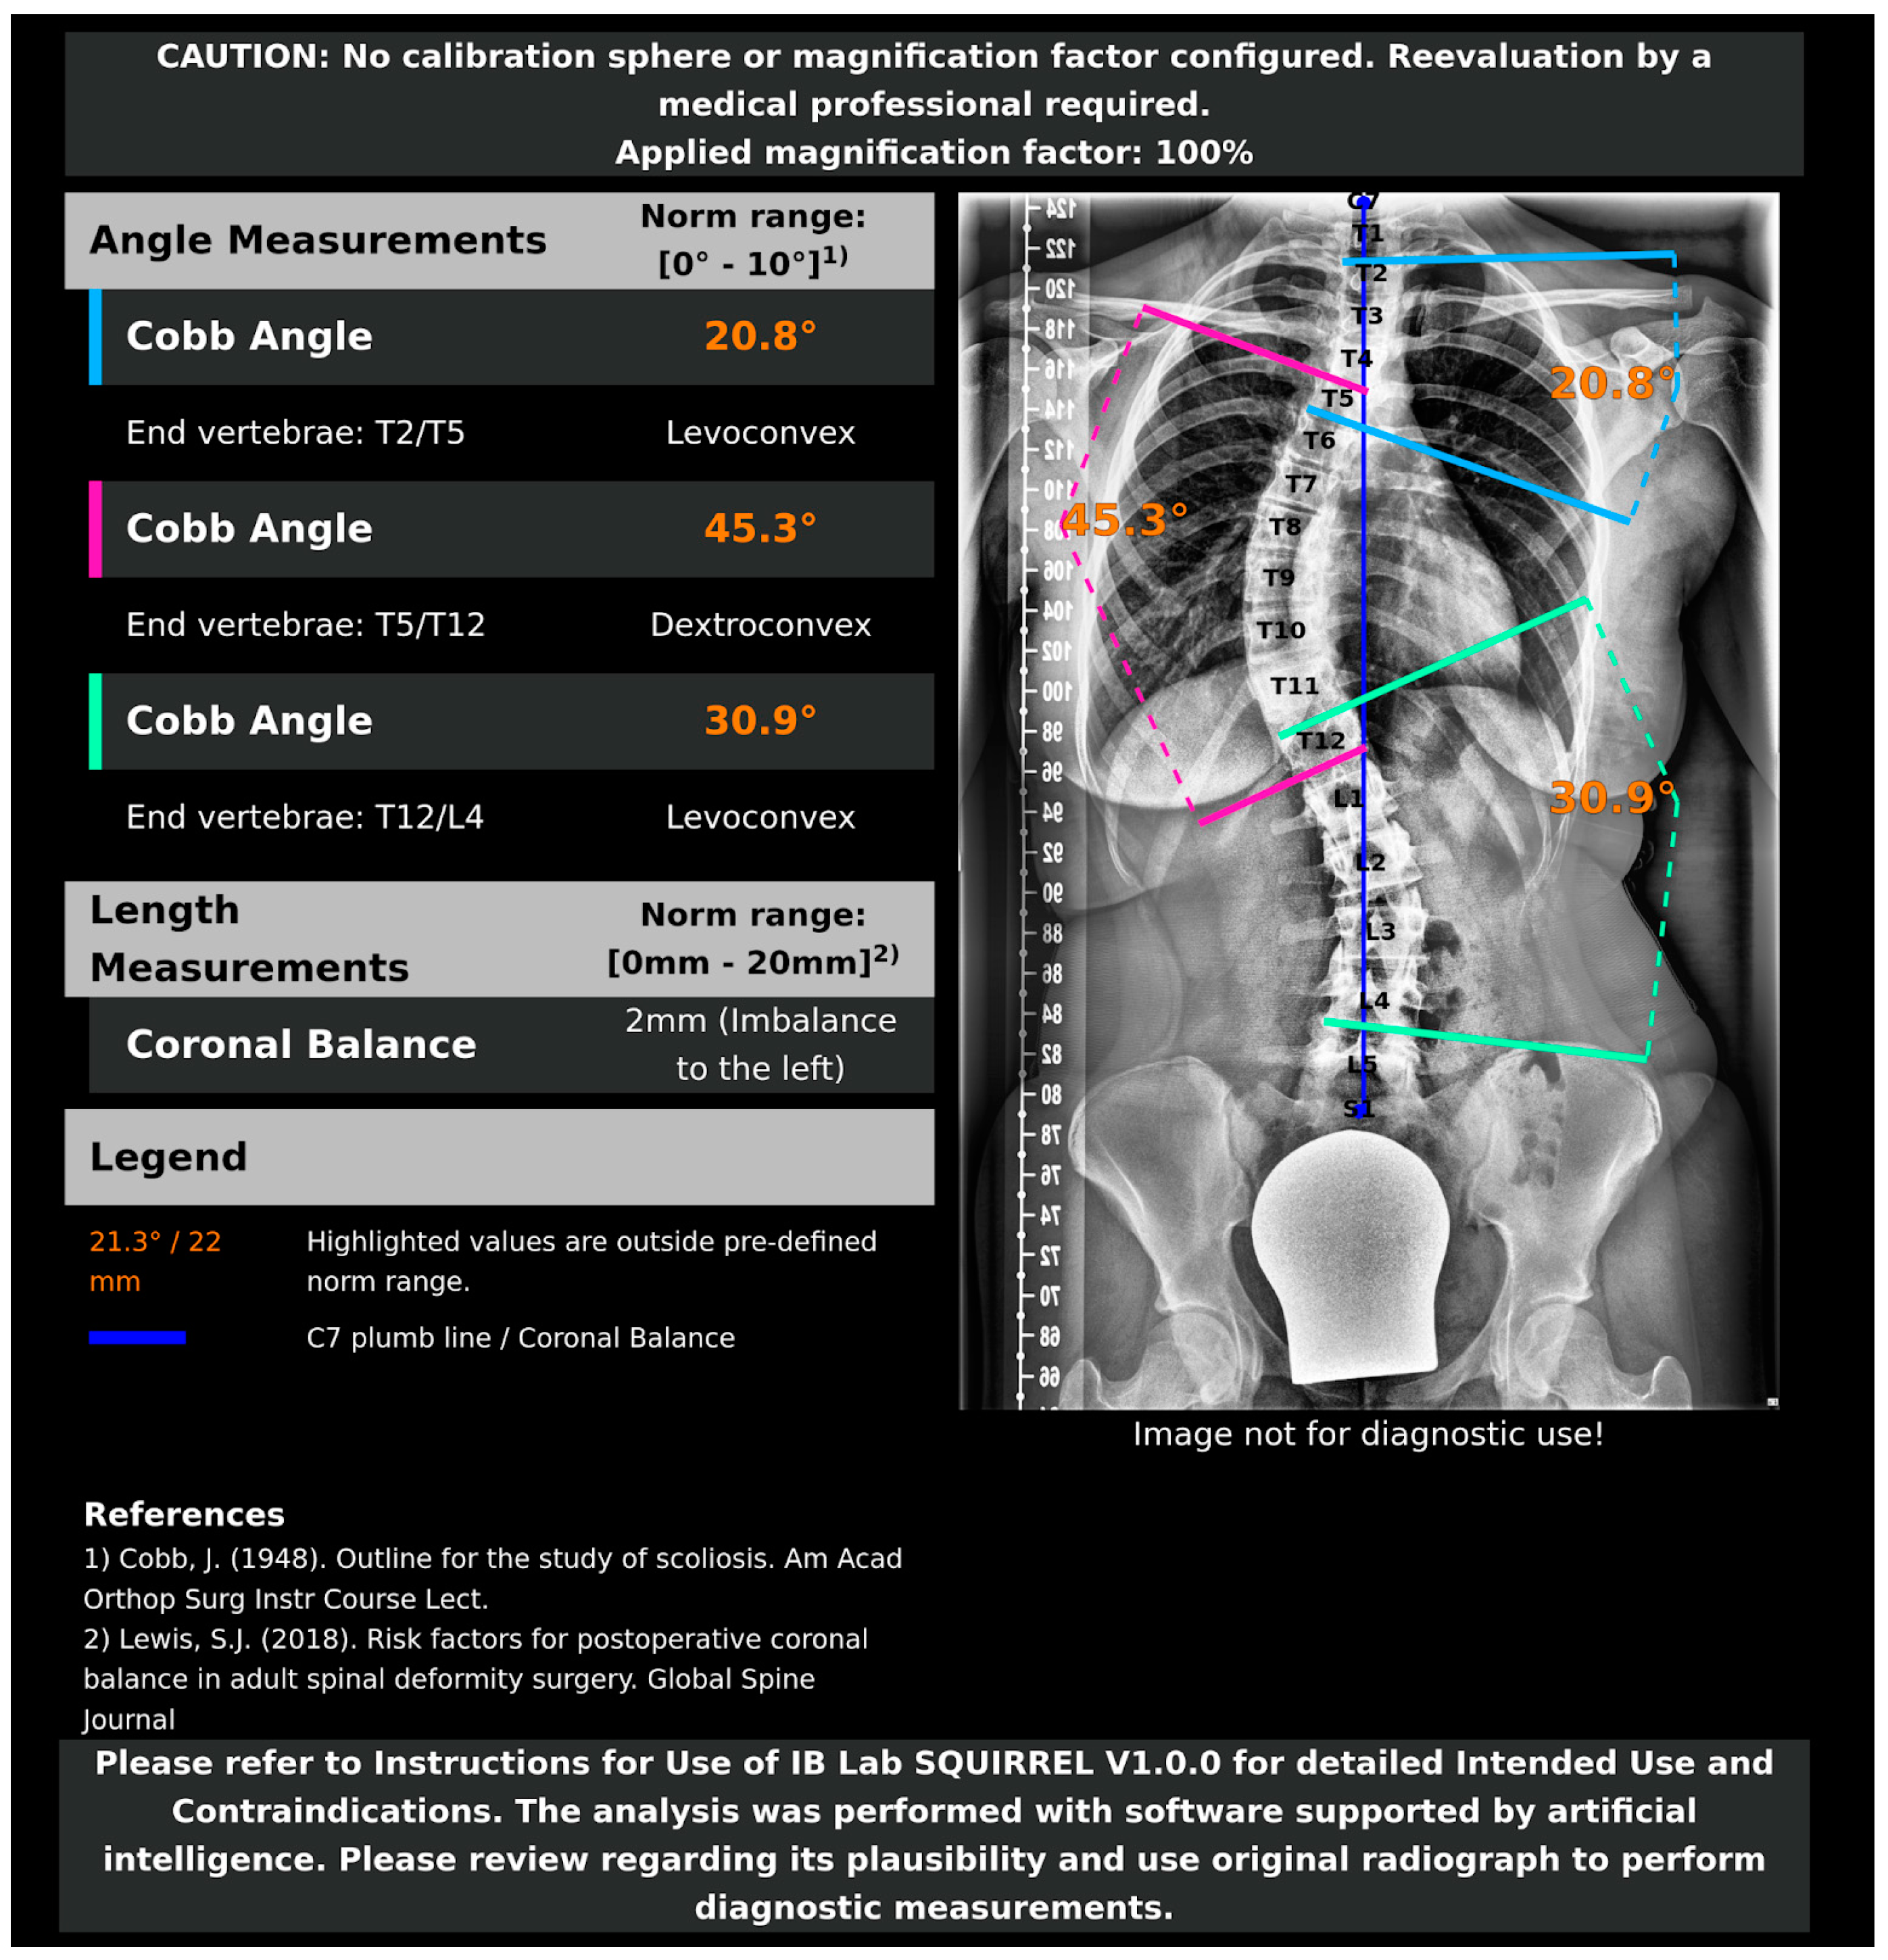
2.3. AI Model and Algorithms
2.4. Statistical Analysis
3. Results
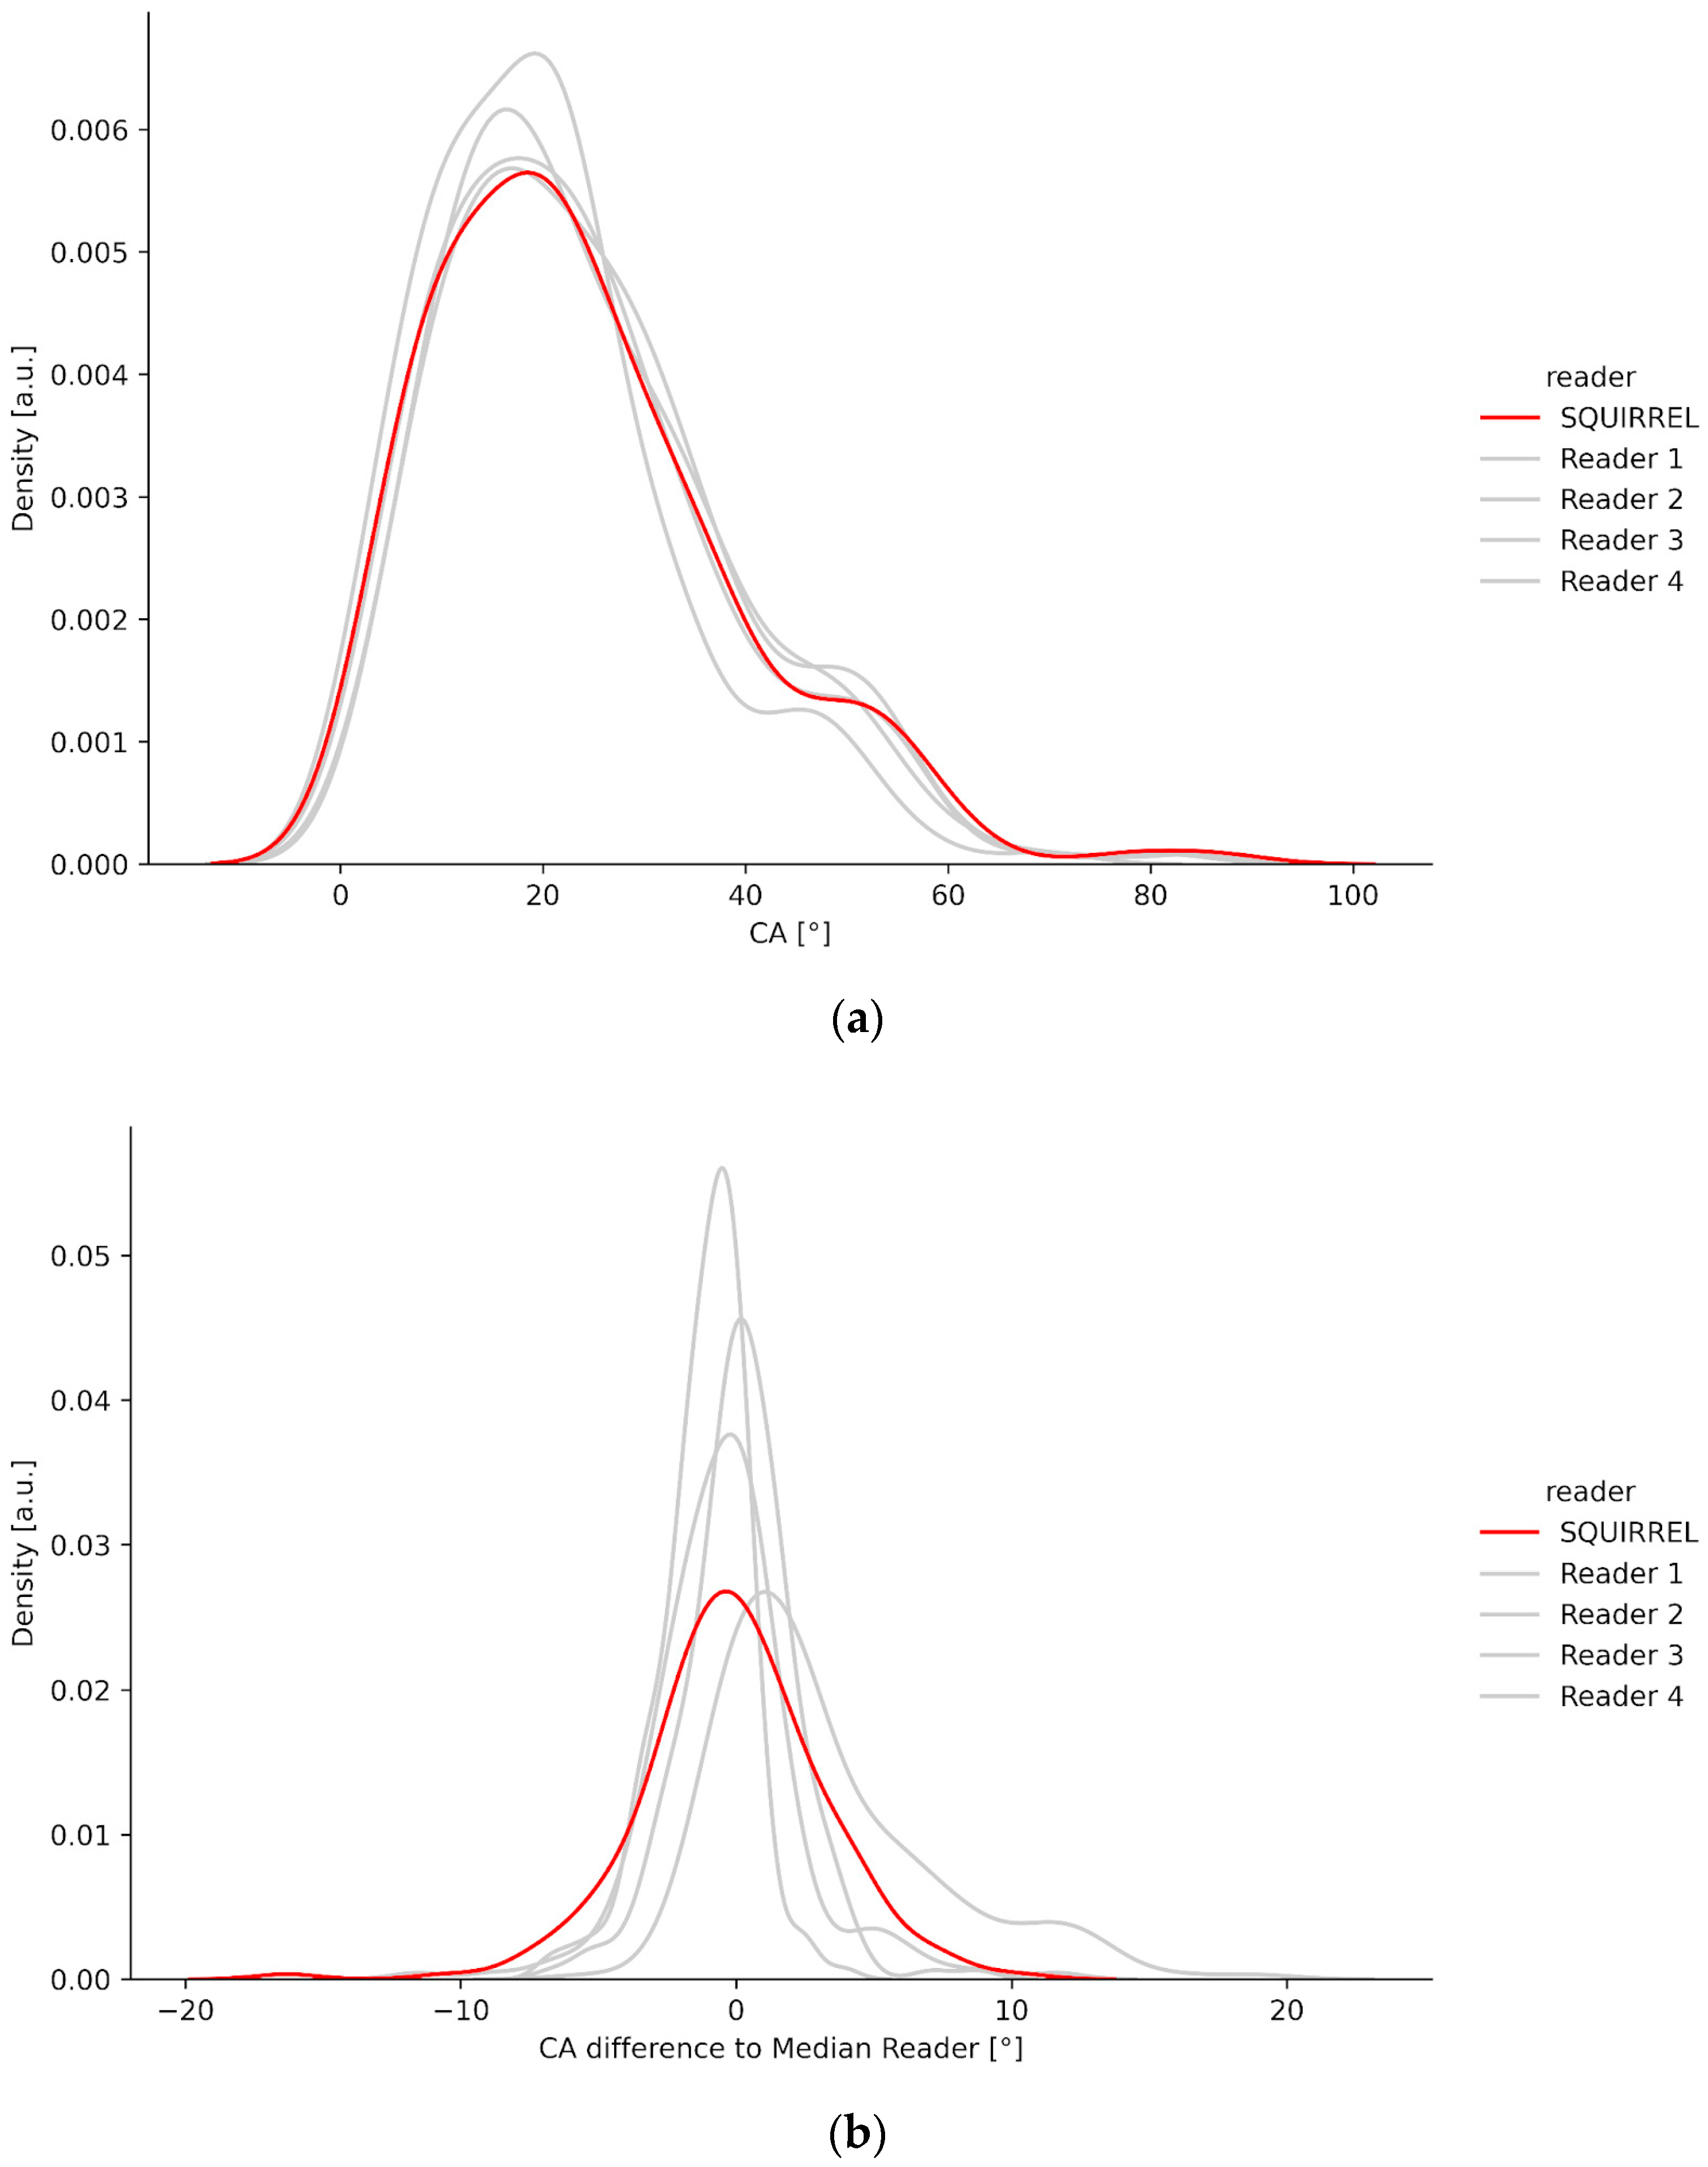
3.1. Density Plots
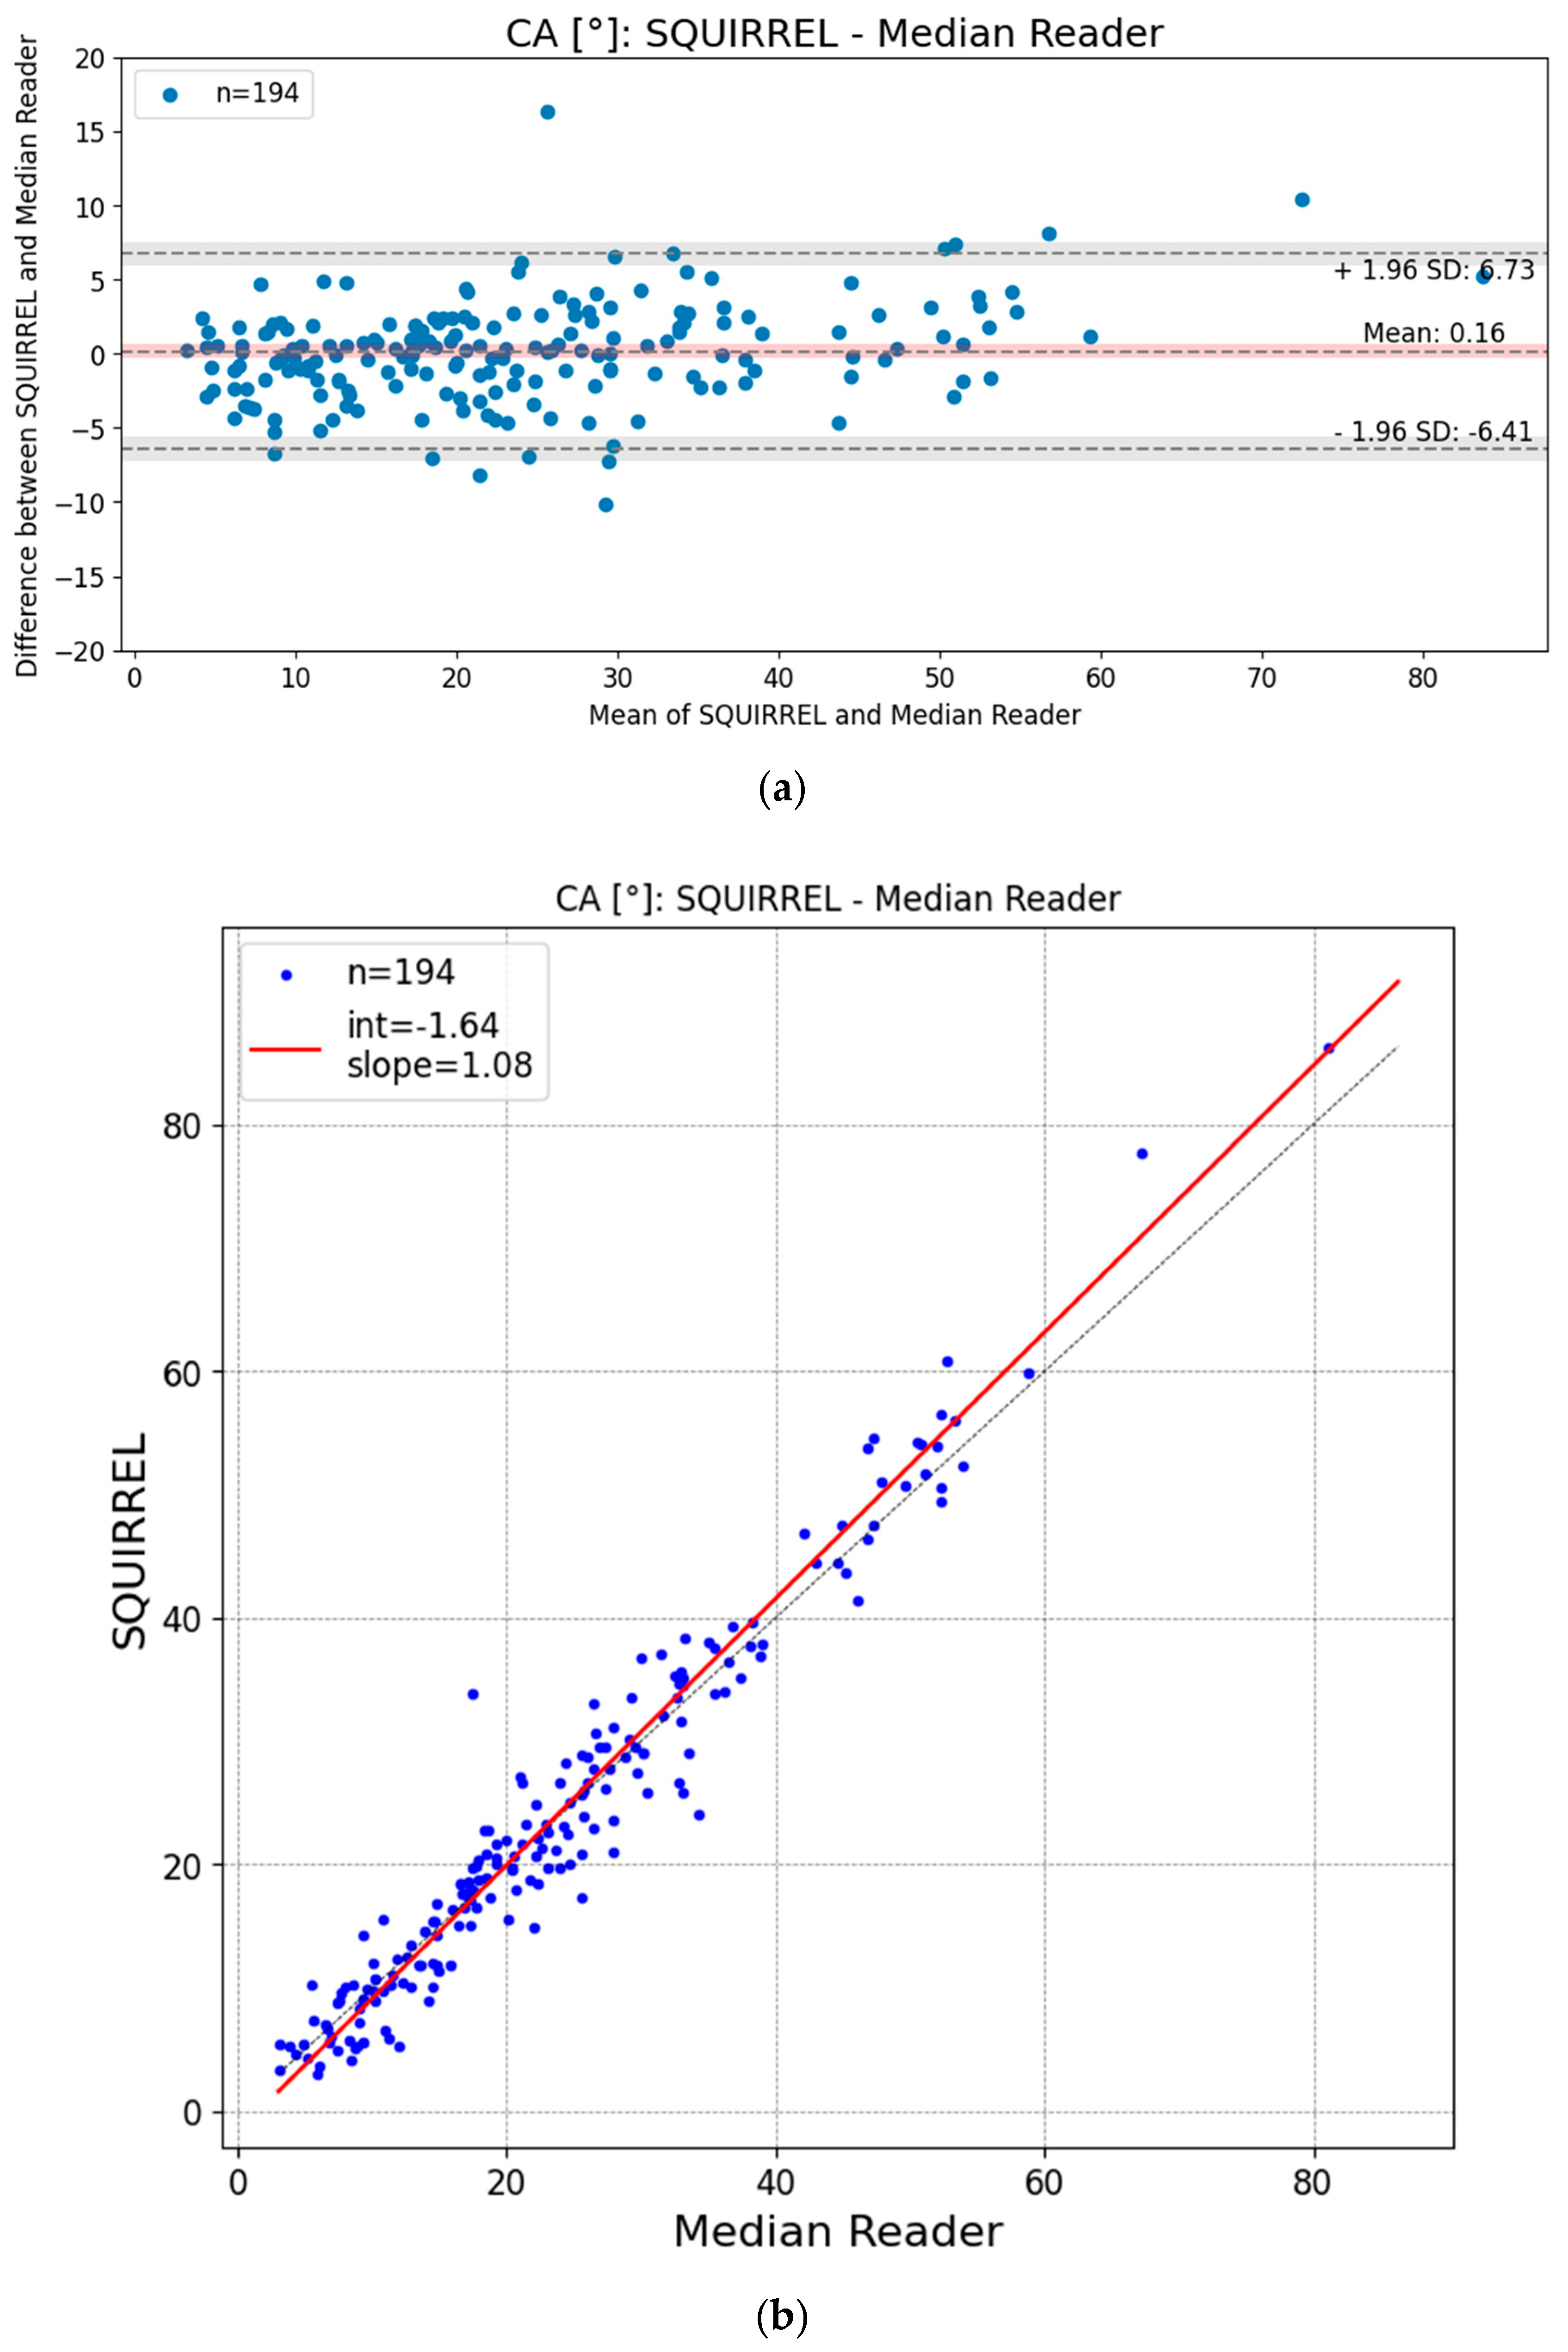
3.2. Bland–Altman and Regression Plots
3.3. Intrarater Agreement IB Lab SQUIRREL
3.4. Outliers
4. Discussion
4.1. Issues Comparing Human and AI-Based Measurements
4.2. Limitations
5. Conclusions
Supplementary Materials
Author Contributions
Funding
Institutional Review Board Statement
Informed Consent Statement
Data Availability Statement
Acknowledgments
Conflicts of Interest
Appendix A. Auxiliary Tables

| Quality Assurance Criteria | Initial Quality Assurance (Images Excluded) | Reader Quality Assurance (Images Excluded) | Total |
|---|---|---|---|
| PixelSpacing DICOM header tag missing | 12 | 0 | 12 |
| Implants/spinal metalwork are present in the image | 10 | 1 | 11 |
| Bone contours of the vertebrae are not fully visible and/or overlapped (e.g., by calibration devices, radiographic protections, or image artifacts) | 6 | 1 | 7 |
| Calibration device is not positioned properly | 6 | 0 | 6 |
| Image is not cropped to the region of interest | 4 | 0 | 4 |
| Image stitching-related issues (e.g., stitching is not continuous, image stitching artifacts obscure anatomical features, or contrast of stitched images differs too greatly between sub-parts) | 3 | 1 | 4 |
| Image is of poor radiographic image quality (e.g., noisy images, poor contrast on all or part of the image) | 0 | 1 | 1 |
| Image is no AP/PA full-spine radiograph | 0 | 0 | 0 |
| Other (burnt in clinical reads) | 0 | 1 | 1 |
| Total | 41 | 5 | 46 |
| Manufacturer | Model | Modality | Number of Images |
|---|---|---|---|
| Siemens | Fluorospot Compact FD | CR | 18 |
| Siemens | Fluorospot Compact FD | DX | 71 |
| Siemens | syngoMMWP | CR | 84 |
| Siemens Healthineers | YSIO X.pree | DX | 23 |
References
- Shakil, H.; Iqbal, Z.A.; Al-Ghadir, A.H. Scoliosis: Review of types of curves, etiological theories and conservative treatment. J. Back Musculoskelet. Rehabil. 2014, 27, 111–115. [Google Scholar] [CrossRef]
- Janicki, J.A.; Alman, B. Scoliosis: Review of diagnosis and treatment. Paediatr. Child Health 2007, 12, 771–776. [Google Scholar] [CrossRef] [PubMed]
- Shaw, M.; Adam, C.J.; Izatt, M.T.; Licina, P.; Askin, G.N. Use of the iPhone for Cobb angle measurement in scoliosis. Eur. Spine 2012, 21, 1062–1068. [Google Scholar] [CrossRef] [PubMed]
- Roggio, F.; Petrigna, L.; Filetti, V.; Vitale, E.; Rapisarda, V.; Musumeci, G. Infrared thermography for the evaluation of adolescent and juvenile idiopathic scoliosis: A systematic review. J. Therm. Biol. 2023, 113, 103524. [Google Scholar] [CrossRef] [PubMed]
- Trac, S.; Zheng, R.; Hill, D.L.; Lou, E. Intra- and Interrater Reliability of Cobb Angle Measurements on the Plane of Maximum Curvature Using Ultrasound Imaging Method. Spine Deform. 2019, 7, 18–26. [Google Scholar] [CrossRef] [PubMed]
- Vendeuvre, T.; Tabard-Fougère, A.; Armand, S.; Dayer, R. Test characteristics of rasterstereography for the early diagnosis of adolescent idiopathic scoliosis. Bone Jt. J. 2023, 105, 431–438. [Google Scholar] [CrossRef] [PubMed]
- Ha, A.Y.; Do, B.H.; Bartret, A.L.; Fang, C.X.; Hsiao, A.; Lutz, A.M.; Banerjee, I.; Riley, G.M.; Rubin, D.L.; Stevens, K.J.; et al. Automating Scoliosis Measurements in Radiographic Studies with Machine Learning: Comparing Artificial Intelligence and Clinical Reports. J. Digit. Imaging 2022, 35, 524–533. [Google Scholar] [CrossRef] [PubMed]
- Kuznia, A.L.; Hernandez, A.K.; Lee, L.U. Adolescent Idiopathic Scoliosis: Common Questions and Answers. Am. Fam. Physician 2020, 101, 19–23. [Google Scholar] [PubMed]
- Cheng, J.C.; Castelein, R.M.; Chu, W.C.; Danielsson, A.J.; Dobbs, M.B.; Grivas, T.B.; Gurnett, C.A.; Luk, K.D.; Moreau, A.; Newton, P.O.; et al. Adolescent idiopathic scoliosis. Nat. Rev. Dis. Primers 2015, 1, 15030. [Google Scholar] [CrossRef] [PubMed]
- Weinstein, S.L.; Dolan, L.A.; Cheng, J.C.Y.; Danielsson, A.; Morcuende, J.A. Adolescent idiopathic scoliosis. Lancet 2008, 371, 1527–1537. [Google Scholar] [CrossRef]
- Arlet, V.; Odent, T.; Aebi, M. Congenital scoliosis. Eur. Spine J. 2003, 12, 456–463. [Google Scholar] [CrossRef] [PubMed]
- Pérez-Machado, G.; Berenguer-Pascual, E.; Bovea-Marco, M.; Rubio-Belmar, P.A.; García-López, E.; Garzón, M.J.; Mena-Mollá, S.; Pallardó, F.V.; Bas, T.; Viña, J.R.; et al. From genetics to epigenetics to unravel the etiology of adolescent idiopathic scoliosis. Bone 2020, 140, 115563. [Google Scholar] [CrossRef] [PubMed]
- Montemurro, N.; Ricciardi, L.; Scerrati, A.; Ippolito, G.; Lofrese, G.; Trungu, S.; Stoccoro, A. The Potential Role of Dysregulated miRNAs in Adolescent Idiopathic Scoliosis and 22q11.2 Deletion Syndrome. J. Pers. Med. 2022, 12, 1925. [Google Scholar] [CrossRef] [PubMed]
- Cobb, J.R. Outline for the study of scoliosis. Instr. Course Lect. 1948, 5, 261–275. [Google Scholar]
- Prestigiacomo, F.G.; Hulsbosch, M.H.H.M.; Bruls, V.E.J.; Nieuwenhuis, J.J. Intra- and inter-observer reliability of Cobb angle measurements in patients with adolescent idiopathic scoliosis. Spine Deform. 2022, 10, 79–86. [Google Scholar] [CrossRef] [PubMed]
- Carman, D.L.; Browne, R.H.; Birch, J.G. Measurement of scoliosis and kyphosis radiographs. Intraobserver and interobserver variation. J. Bone Jt. Surg. 1990, 72, 328–333. [Google Scholar] [CrossRef]
- Gstoettner, M.; Sekyra, K.; Walochnik, N.; Winter, P.; Wachter, R.; Bach, C.M. Inter- and intraobserver reliability assessment of the Cobb angle: Manual versus digital measurement tools. Eur. Spine J. 2007, 16, 1587–1592. [Google Scholar] [CrossRef]
- Tanure, M.C.; Pinheiro, A.P.; Oliveira, A.S. Reliability assessment of Cobb angle measurements using manual and digital methods. Spine J. 2010, 10, 769–774. [Google Scholar] [CrossRef]
- Weinstein, S.L.; Dolan, L.A.; Wright, J.G.; Dobbs, M.B. Effects of bracing in adolescents with idiopathic scoliosis. N. Engl. J. Med. 2013, 369, 1512–1521. [Google Scholar] [CrossRef]
- Weinstein, S.L.; Ponseti, I.V. Curve progression in idiopathic scoliosis. J. Bone Jt. Surg. 1983, 65, 447–455. [Google Scholar] [CrossRef]
- Chen, K.; Stotter, C.; Klestil, T.; Nehrer, S. Artificial Intelligence in Orthopedic Radiography Analysis: A Narrative Review. Diagnostics 2022, 12, 2235. [Google Scholar] [CrossRef]
- Pan, Y.; Chen, Q.; Chen, T.; Wang, H.; Zhu, X.; Fang, Z.; Lu, Y. Evaluation of a computer-aided method for measuring the Cobb angle on chest X-rays. Eur. Spine J. 2019, 28, 3035–3043. [Google Scholar] [CrossRef] [PubMed]
- Meng, N.; Cheung, J.P.Y.; Wong, K.-Y.K.; Dokos, S.; Li, S.; Choy, R.W.; To, S.; Li, R.J.; Zhang, T. An artificial intelligence powered platform for auto-analyses of spine alignment irrespective of image quality with prospective validation. EClinicalMedicine 2022, 43, 101252. [Google Scholar] [CrossRef]
- Liu, J.; Yuan, C.; Sun, X.; Sun, L.; Dong, H.; Peng, Y. The measurement of Cobb angle based on spine X-ray images using multi-scale convolutional neural network. Phys. Eng. Sci. Med. 2021, 44, 809–821. [Google Scholar] [CrossRef]
- Caesarendra, W.; Rahmaniar, W.; Mathew, J.; Thien, A. Automated Cobb Angle Measurement for Adolescent Idiopathic Scoliosis Using Convolutional Neural Network. Diagnostics 2022, 12, 396. [Google Scholar] [CrossRef]
- Horng, M.-H.; Kuok, C.-P.; Fu, M.-J.; Lin, C.-J.; Sun, Y.-N. Cobb Angle Measurement of Spine from X-ray Images Using Convolutional Neural Network. Comput. Math. Methods Med. 2019, 2019, 6357171. [Google Scholar] [CrossRef] [PubMed]
- Sun, Y.; Xing, Y.; Zhao, Z.; Meng, X.; Xu, G.; Hai, Y. Comparison of manual versus automated measurement of Cobb angle in idiopathic scoliosis based on a deep learning keypoint detection technology. Eur. Spine J. 2022, 31, 1969–1978. [Google Scholar] [CrossRef]
- Berlin, C.; Adomeit, S.; Grover, P.; Dreischarf, M.; Halm, H.; Dürr, O.; Obid, P. Novel AI-Based Algorithm for the Automated Computation of Coronal Parameters in Adolescent Idiopathic Scoliosis Patients: A Validation Study on 100 Preoperative Full Spine X-rays. Glob. Spine J. 2023, 14, 21925682231154543. [Google Scholar] [CrossRef] [PubMed]
- Shea, K.G.; Stevens, P.M.; Nelson, M.; Smith, J.T.; Masters, K.S.; Yandow, S. A comparison of manual versus computer-assisted radiographic measurement. Intraobserver Meas. Var. Cobb Angl. Spine 1998, 23, 551–555. [Google Scholar] [CrossRef]
- Kokabu, T.; Kanai, S.; Kawakami, N.; Uno, K.; Kotani, T.; Suzuki, T.; Tachi, H.; Abe, Y.; Iwasaki, N.; Sudo, H. An algorithm for using deep learning convolutional neural networks with three dimensional depth sensor imaging in scoliosis detection. Spine J. 2021, 21, 980–987. [Google Scholar] [CrossRef]
- Nault, M.-L.; Beauséjour, M.; Roy-Beaudry, M.; Mac-Thiong, J.-M.; de Guise, J.; Labelle, H.; Parent, S. A Predictive Model of Progression for Adolescent Idiopathic Scoliosis Based on 3D Spine Parameters at First Visit. Spine 2020, 45, 605–611. [Google Scholar] [CrossRef] [PubMed]
- Yahara, Y.; Tamura, M.; Seki, S.; Kondo, Y.; Makino, H.; Watanabe, K.; Kamei, K.; Futakawa, H.; Kawaguchi, Y. A deep convolutional neural network to predict the curve progression of adolescent idiopathic scoliosis: A pilot study. BMC Musculoskelet. Disord. 2022, 23, 610. [Google Scholar] [CrossRef] [PubMed]
- Tu, Y.; Wang, N.; Tong, F.; Chen, H. Automatic measurement algorithm of scoliosis Cobb angle based on deep learning. J. Phys. Conf. Ser. 2019, 1187, 42100. [Google Scholar] [CrossRef]
- Zhao, Y.; Zhang, J.; Li, H.; Gu, X.; Li, Z.; Zhang, S. Automatic Cobb angle measurement method based on vertebra segmentation by deep learning. Med. Biol. Eng. Comput. 2022, 60, 2257–2269. [Google Scholar] [CrossRef] [PubMed]
- Lu, M.-J.; Zhong, W.-H.; Liu, Y.-X.; Miao, H.-Z.; Li, Y.-C.; Ji, M.-H. Sample Size for Assessing Agreement between Two Methods of Measurement by Bland-Altman Method. Int. J. Biostat. 2016, 12, 20150039. [Google Scholar] [CrossRef] [PubMed]
- Ronneberger, O.; Fischer, P.; Brox, T. U-Net: Convolutional Networks for Biomedical Image Segmentation. In Proceedings of the Medical Image Computing and Computer-Assisted Intervention–MICCAI 2015: 18th International Conference, Munich, Germany, 5–9 October 2015; Springer International Publishing: Berlin/Heidelberg, Germany, 2015; pp. 234–241. [Google Scholar]
- Abadi, M.; Agarwal, A.; Barham, P.; Brevdo, E.; Chen, Z.; Citro, C.; Corrado, G.S.; Davis, A.; Dean, J.; Devin, M.; et al. TensorFlow: Large-Scale Machine Learning on Heterogeneous Distributed Systems. arXiv 2016, arXiv:1603.04467. [Google Scholar]
- Bland, J.M.; Altman, D.G. Measuring agreement in method comparison studies. Stat. Methods Med. Res. 1999, 8, 135–160. [Google Scholar] [CrossRef] [PubMed]
- Obuchowski, N.A.; Subhas, N.; Schoenhagen, P. Testing for interchangeability of imaging tests. Acad. Radiol. 2014, 21, 1483–1489. [Google Scholar] [CrossRef]
- Kottner, J.; Audigé, L.; Brorson, S.; Donner, A.; Gajewski, B.J.; Hróbjartsson, A.; Roberts, C.; Shoukri, M.; Streiner, D.L. Guidelines for Reporting Reliability and Agreement Studies (GRRAS) were proposed. J. Clin. Epidemiol. 2011, 64, 96–106. [Google Scholar] [CrossRef]
- Iglewicz, B.; Hoaglin, D.C. How to Detect and Handle Outliers; ASQC Quality Press: Milwaukee, WI, USA, 1993. [Google Scholar]
- Lewis, S.J.; Keshen, S.G.; Kato, S.; Dear, T.E.; Gazendam, A.M. Risk factors for postoperative coronal balance in adult spinal deformity surgery. Glob. Spine J. 2018, 8, 690–697. [Google Scholar] [CrossRef]
- Beauchamp, M.; Labelle, H.; Grimard, G.; Stanciu, C.; Poitras, B.; Dansereau, J. Diurnal variation of Cobb angle measurement in adolescent idiopathic scoliosis. Spine 1993, 18, 1581–1583. [Google Scholar] [CrossRef] [PubMed]
- Koo, T.K.; Li, M.Y. A Guideline of Selecting and Reporting Intraclass Correlation Coefficients for Reliability Research. J. Chiropr. Med. 2016, 15, 155–163. [Google Scholar] [CrossRef] [PubMed]


| Measurement | Accuracy (%) |
|---|---|
| Vertebral labeling | 83.13 |
| End vertebrae | 88.58 |
| Curvature laterality | 100.00 |
| Statistic | Result | |
|---|---|---|
| Mean Difference [95% CI] | 0.16° [−0.31°; 0.64°] | |
| Standard Deviation [95% CI] | 3.35° [2.86°; 3.87°] | |
| Mean Absolute Deviation [95% CI] | 2.47° [2.17°; 2.81°] | |
| Median Absolute Deviation [95% CI] | 1.89° [1.58°; 2.21°] | |
| Root Mean Square Error (RMSE) [95% CI] | 3.35° [2.86°; 3.87°] | |
| ICC (inter-reader) [95% CI] (Two-way mixed, single measure, agreement) | 0.94 [0.89; 0.96] | |
| ICC (all reads) [95% CI] (Two-way mixed, single measure, agreement) | 0.94 [0.92; 0.96] | |
| ICC (SQUIRREL vs. Median Reader) [95% CI] (Two-way mixed, single measure, agreement) | 0.97 [0.96; 0.98] | |
| Equivalence index ɣ [95% CI] (Interchangeability) | −2.05° [−3.36°; −1.35°] | |
| OLR Intercept [95% CI] | −1.64° [−2.46°; −0.83°] | |
| OLR Slope [95% CI] | 1.08 [1.04; 1.11] | |
| Bland–Altman 95% Limits of Agreement (LoA) [95% CI] | Lower: | −6.41° [−7.22°; −5.59°] |
| Upper: | 6.73° [5.91°; 7.54°] | |
| Outlier ID | Measurement | z-Score |
|---|---|---|
| 1 | Cobb angle | 5.84 |
| 2 | Cobb angle | 3.70 |
| 3 | Cobb angle | −3.81 |
Disclaimer/Publisher’s Note: The statements, opinions and data contained in all publications are solely those of the individual author(s) and contributor(s) and not of MDPI and/or the editor(s). MDPI and/or the editor(s) disclaim responsibility for any injury to people or property resulting from any ideas, methods, instructions or products referred to in the content. |
© 2024 by the authors. Licensee MDPI, Basel, Switzerland. This article is an open access article distributed under the terms and conditions of the Creative Commons Attribution (CC BY) license (https://creativecommons.org/licenses/by/4.0/).
Share and Cite
Chen, K.; Stotter, C.; Klestil, T.; Mitterer, J.A.; Lepenik, C.; Nehrer, S. Fully Automated Measurement of Cobb Angles in Coronal Plane Spine Radiographs. J. Clin. Med. 2024, 13, 4122. https://doi.org/10.3390/jcm13144122
Chen K, Stotter C, Klestil T, Mitterer JA, Lepenik C, Nehrer S. Fully Automated Measurement of Cobb Angles in Coronal Plane Spine Radiographs. Journal of Clinical Medicine. 2024; 13(14):4122. https://doi.org/10.3390/jcm13144122
Chicago/Turabian StyleChen, Kenneth, Christoph Stotter, Thomas Klestil, Jennyfer A. Mitterer, Christopher Lepenik, and Stefan Nehrer. 2024. "Fully Automated Measurement of Cobb Angles in Coronal Plane Spine Radiographs" Journal of Clinical Medicine 13, no. 14: 4122. https://doi.org/10.3390/jcm13144122
APA StyleChen, K., Stotter, C., Klestil, T., Mitterer, J. A., Lepenik, C., & Nehrer, S. (2024). Fully Automated Measurement of Cobb Angles in Coronal Plane Spine Radiographs. Journal of Clinical Medicine, 13(14), 4122. https://doi.org/10.3390/jcm13144122