

A Novel Tool for the Rapid and Transparent Verification of Reference Intervals in Clinical Laboratories

 ,
,  and
and 
Abstract
1. Introduction
2. Materials and Methods
- Group 1: ri_hist, permissible_uncertainty, interpretation
- Group 2: lognorm, iboxplot, truncated_qqplot
- Group 3: adjust_digits, bowley, conf_int95

- result1 <- findRI (x)
- result2 <- getRI (result 1)
3. Results
3.1. Step-by-Step Explanation of the reflimR Algorithm


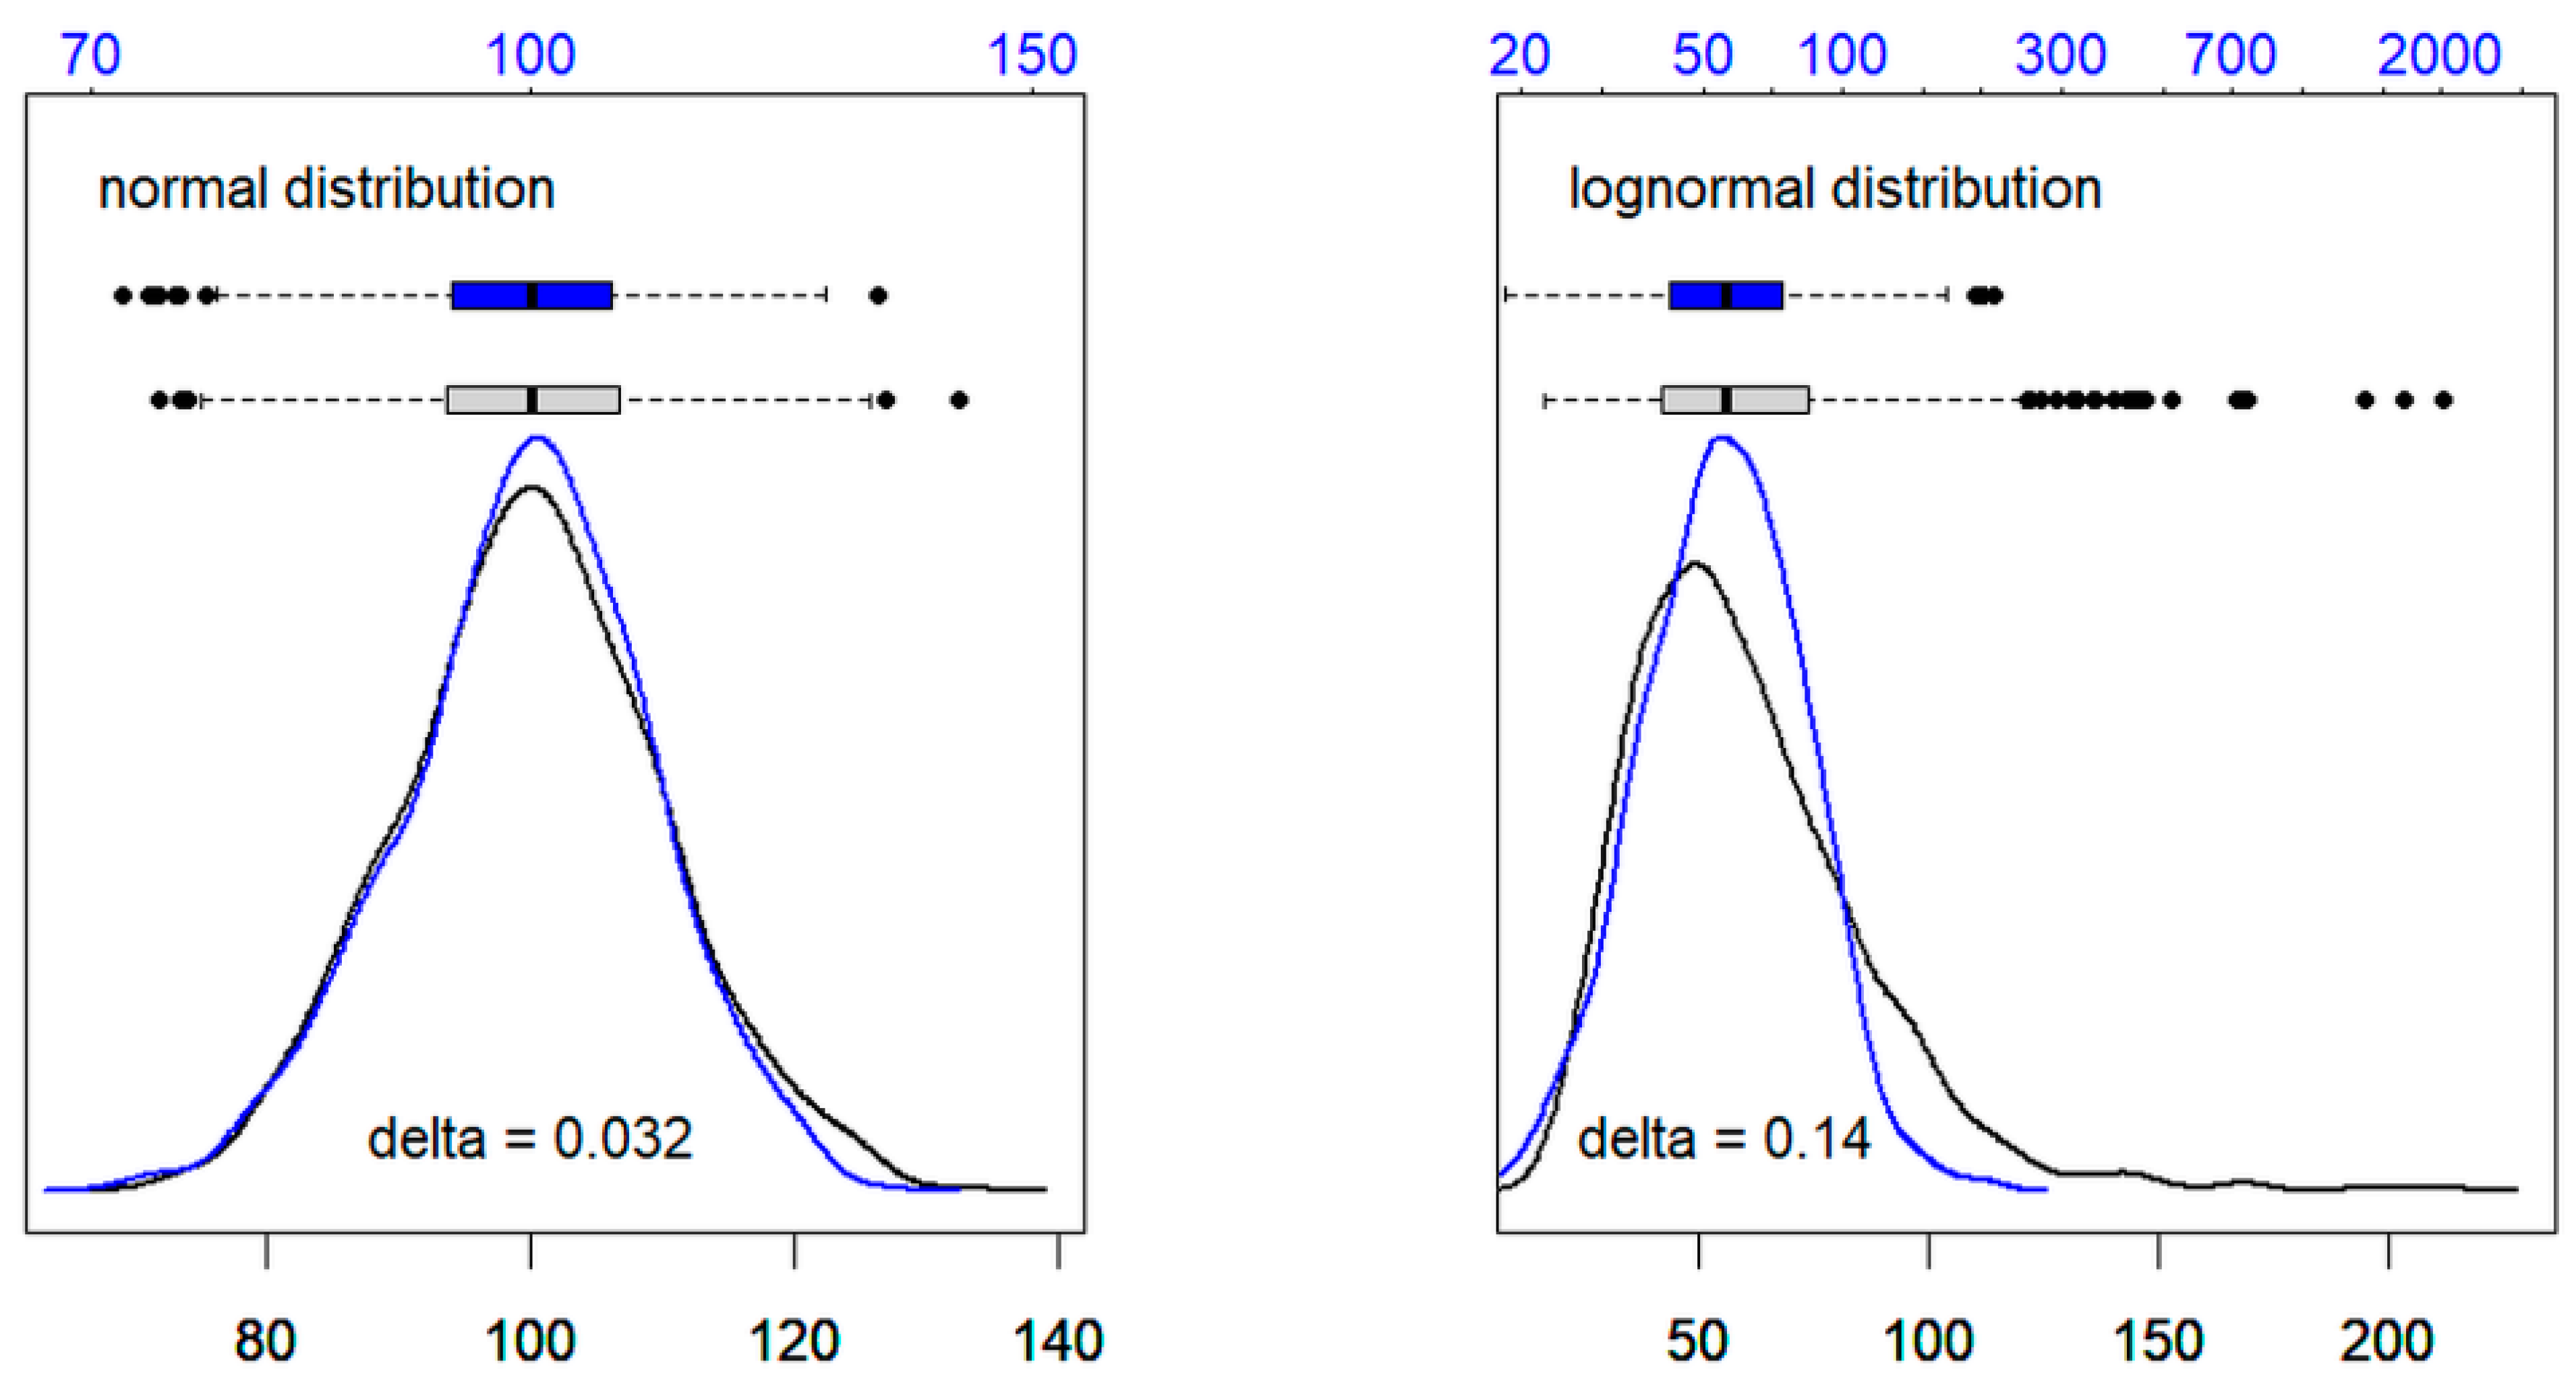
| Normal Distribution | Lognormal Distribution | |
|---|---|---|
| original values | 0.014 | 0.133 |
| logarithms | −0.018 | −0.007 |
| delta 1 | 0.032 | 0.140 |
3.2. Verification of Reference Limits and Method Comparison
4. Discussion
Limitations of the Study and Outlook
5. Conclusions
Author Contributions
Funding
Institutional Review Board Statement
Informed Consent Statement
Data Availability Statement
Conflicts of Interest
Abbreviations
| ALB | albumin |
| ALT | alanine aminotransferase (GPT) |
| AST | aspartate aminotransferase (GOT) |
| BIL | bilirubin |
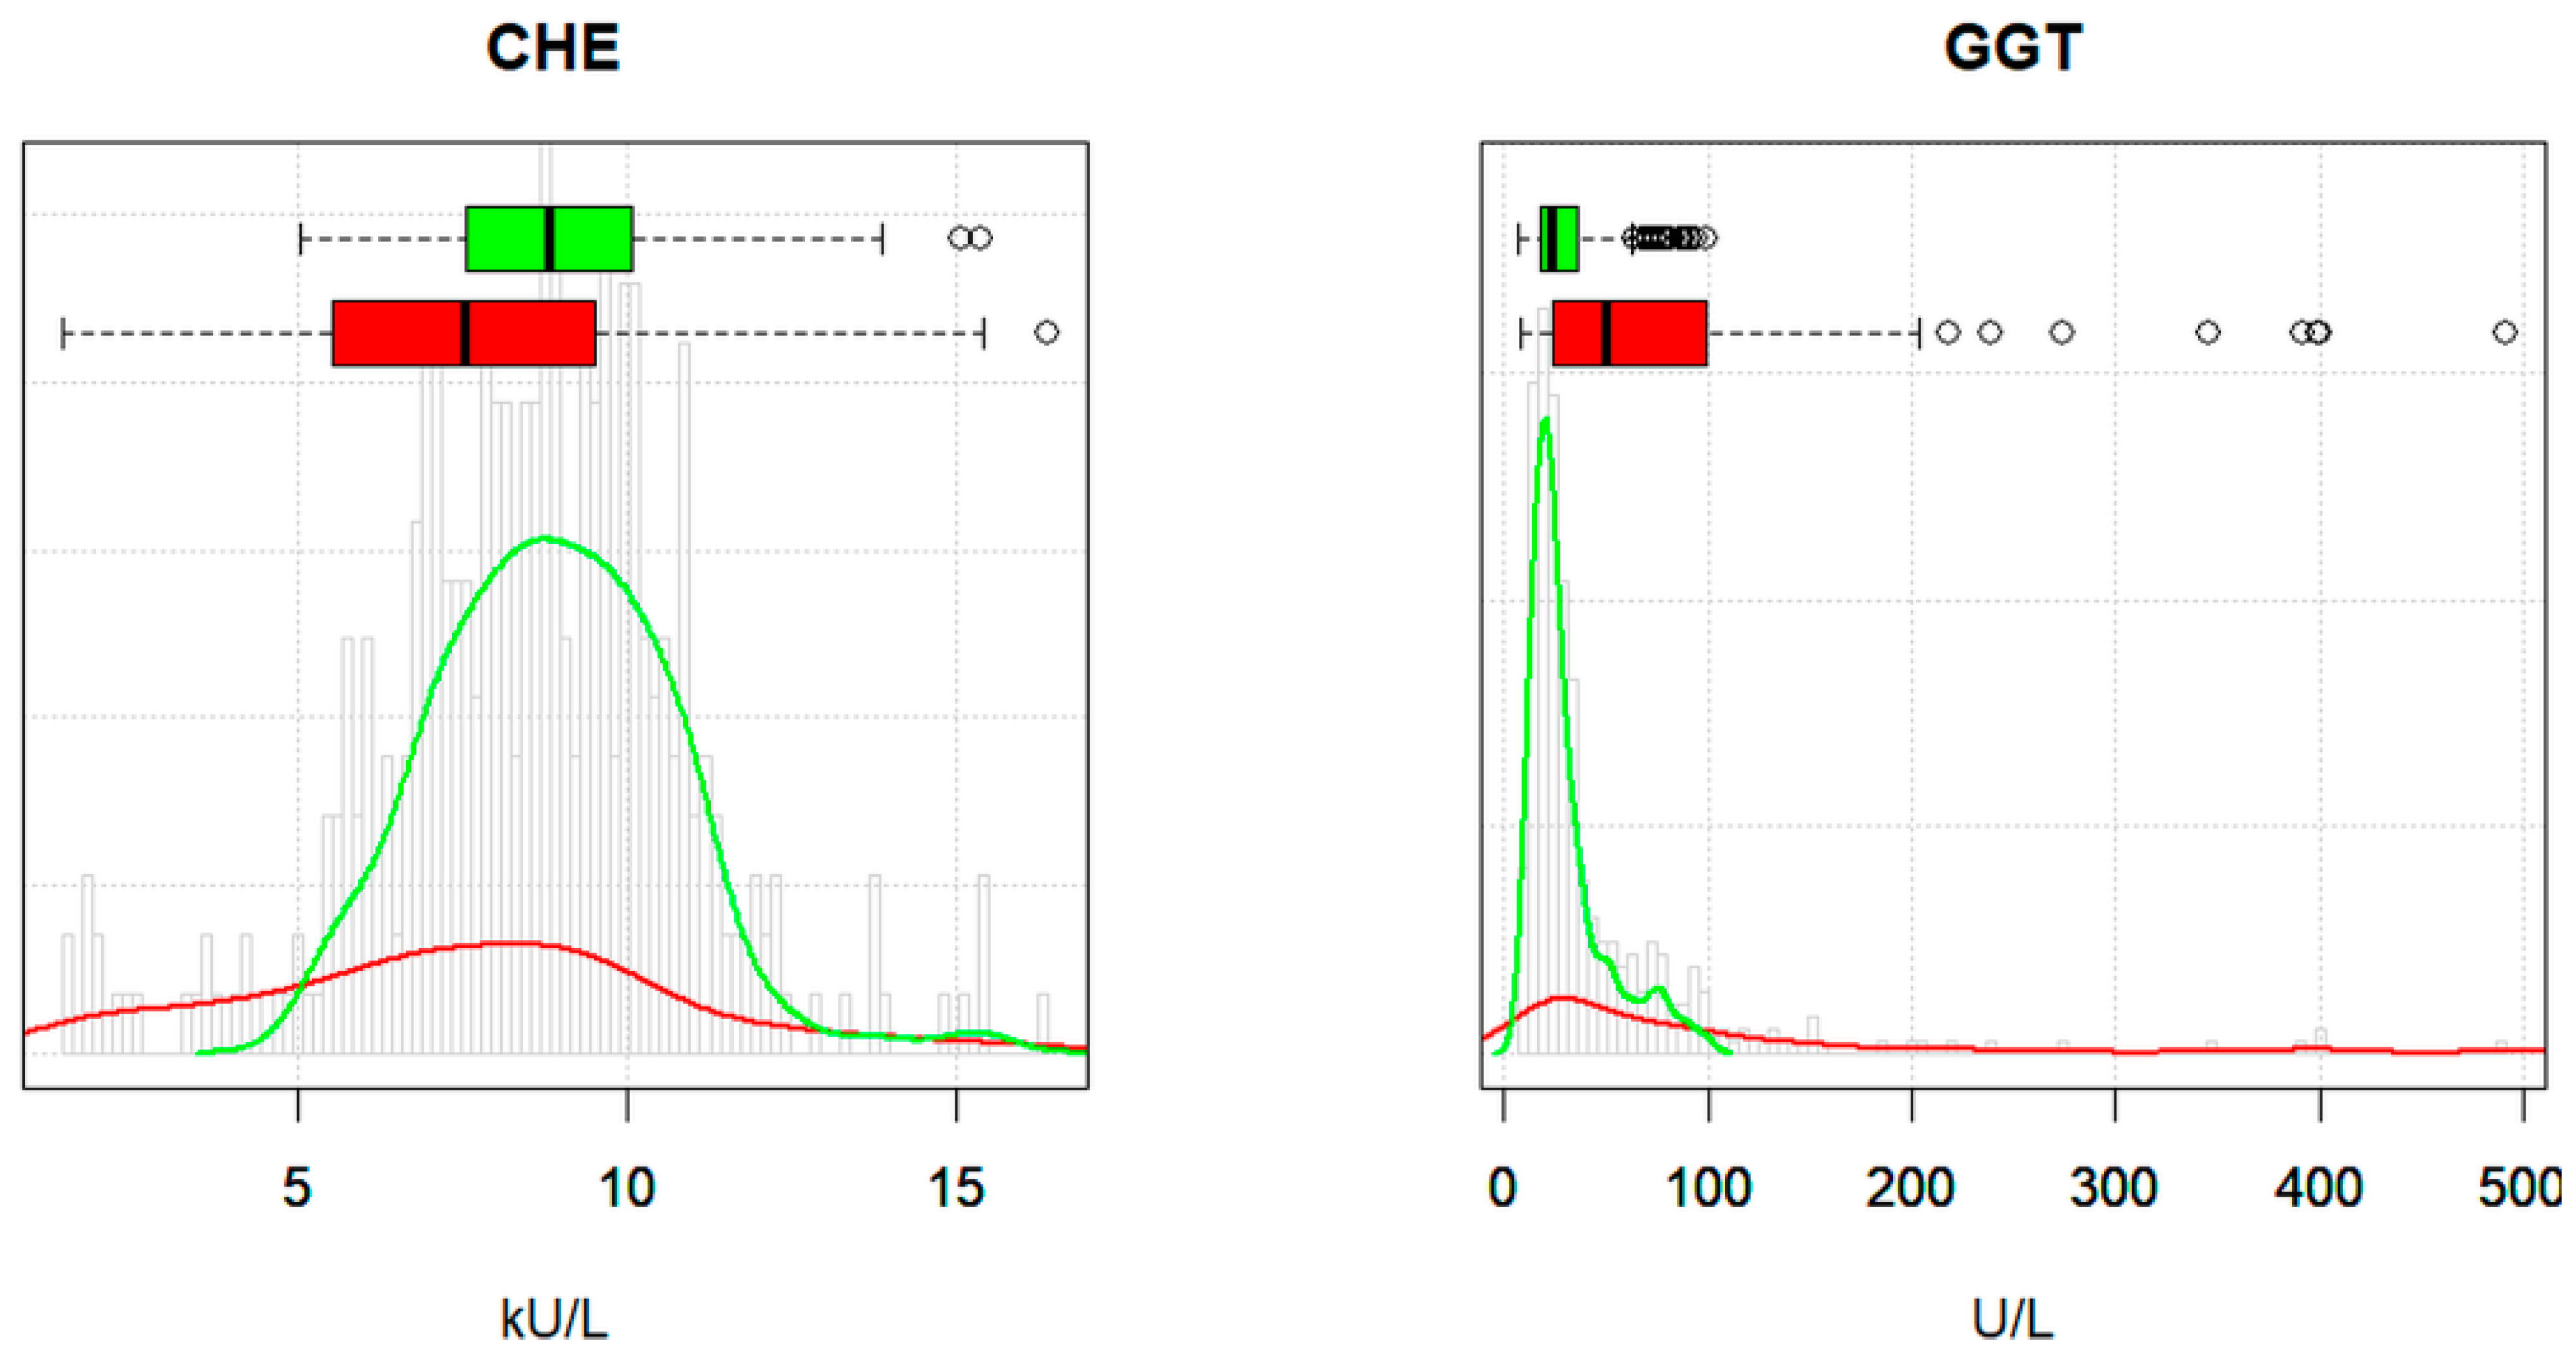
| CHE | choline esterase |
| CLSI | Clinical Laboratory Standards Institute |
| CREA | creatinine |
| GGT | gamma-glutamyl transferase |
| IFCC | International Federation of Clinical Chemistry and Laboratory Medicine |
| PROT | total protein |
| sd | standard deviation |
References
- Graesbeck, R. The evolution of the reference value concept. Clin. Chem. Lab. Med. 2004, 42, 692–697. [Google Scholar] [CrossRef]
- CLSI Document EP28-A3C: Defining, Establishing, and Verifying Reference Intervals in the Clinical Laboratory; Technical Reports; Clinical & Laboratory Standards Institute: Malvern, Japan, 2010.
- Jones, G.; Haeckel, R.; Loh, T.; Sikaris, K.; Streichert, T.; Katayev, A.; Barth, J.H.; Ozarda, Y. Indirect methods for reference interval determination: Review and recommendations. Clin. Chem. Lab. Med. 2018, 57, 20–29. [Google Scholar] [CrossRef]
- Ozarda, Y.; Higgins, V.; Adeli, K. Verification of reference intervals in routine clinical laboratories: Practical challenges and recommendations. Clin. Chem. Lab. Med. 2018, 57, 30–37. [Google Scholar] [CrossRef] [PubMed]
- Haeckel, R.; Wosniok, W.; Streichert, T. Review of potentials and limitations of indirect approaches for estimating reference limits/intervals of quantitative procedures in laboratory medicine. J. Lab. Med. 2021, 45, 35–53. [Google Scholar] [CrossRef]
- Arzideh, F.; Brandhorst, G.; Gurr, E.; Hinsch, W.; Hoff, T.; Roggenbruck, L.; Rothe, G.; Schumann, G.; Wolters, B.; Wosniok, W.; et al. An improved indirect approach for determining reference limits from intra-laboratory data bases exemplified by concentrations of electrolytes. J. Lab. Med. 2009, 33, 52–66. [Google Scholar]
- Hoffmann, G.; Lichtinghagen, R.; Wosniok, W. Simple estimation of reference intervals from routine laboratory data. J. Lab. Med. 2015, 39, 389–402. [Google Scholar] [CrossRef]
- Wosniok, W.; Haeckel, R. A new indirect estimation of reference intervals: Truncated minimum chi-square (TMC) approach. Clin. Chem. Lab. Med. 2019, 57, 1933–1957. [Google Scholar] [CrossRef] [PubMed]
- Ammer, T.; Schützenmeister, A.; Prokosch, H.U.; Rauh, M.; Rank, C.; Zierk, J. refineR: A novel algorithm for reference interval estimation from real-world data. Nat. Sci. Rep. 2021, 11, 16023. [Google Scholar] [CrossRef]
- Anker, S.; Morgenstern, J.; Adler, J.; Brune, M.; Brings, S.; Fleming, T.; Kliemank, E.; Zorn, M.; Fischer, A.; Szendroedi, J.; et al. Verification of sex- and age-specific reference intervals for 13 serum steroids determined by mass spectrometry: Evaluation of an indirect statistical approach. Clin. Chem. Lab. Med. 2022, 61, 452–463. [Google Scholar] [CrossRef]
- Meyer, A.; Müller, R.; Hoffmann, M.; Skadberg, O.; Ladang, A.; Dieplinger, B.; Huf, W.; Stankovic, S.; Kapoula, G.; Orth, M.; et al. Comparison of three indirect methods for verification and validation of reference intervals at eight medical laboratories: A European multicenter study. J. Lab. Med. 2023, 47, 155–163. [Google Scholar] [CrossRef]
- Lichtinghagen, R.; Pietsch, D.; Bantel, H.; Manns, M.; Brand, K.; Bahr, M. The Enhanced Liver Fibrosis (ELF) score: Normal values, influence factors and proposed cut-off values. J. Hepatol. 2013, 59, 236–242. [Google Scholar] [CrossRef] [PubMed]
- Holmes, D.; Buhr, K. Widespread incorrect implementation of the Hoffmann method, the correct approach, and modern alternatives. Am. J. Clin. Pathol. 2019, 151, 328–336. [Google Scholar] [CrossRef] [PubMed]
- Shaw, J.; Cohen, A.; Konforte, D.; Binesh-Marvasti, T.; Colantino, D.; Adeli, K. Validity of establishing pediatric reference intervals based on hospital patient data: A comparison of the modified Hoffmann approach to CALIPER reference intervals obtained in healthy children. Clin. Biochem. 2014, 47, 166–172. [Google Scholar] [CrossRef] [PubMed]
- Hoffmann, R.G. Statistics in the practice of medicine. J. Am. Med. Assoc. 1963, 185, 864–873. [Google Scholar] [CrossRef] [PubMed]
- Haeckel, R.; Wosniok, W. A new concept to derive permissible limits for analytical imprecision and bias considering diagnostic requirements and technical state-of-the-art. Clin. Chem. Lab. Med. 2011, 49, 623–635. [Google Scholar] [CrossRef] [PubMed]
- Haeckel, R.; Wosniok, W.; Arzideh, F. Equivalence limits of reference intervals for partitioning of population data. Relevant differences of reference limits. J. Lab. Med. 2016, 40, 199–205. [Google Scholar] [CrossRef]
- Klawonn, F.; Hoffmann, G.; Orth, M. Quantitative laboratory results: Normal or lognormal distribution. J. Lab. Med. 2020, 44, 143–150. [Google Scholar] [CrossRef]
- Haeckel, R.; Wosniok, W. Observed, unknown distributions of clinical chemical quantities should be considered to be log-normal: A proposal. Clin. Chem. Lab. Med. 2010, 48, 1393–1396. [Google Scholar] [CrossRef] [PubMed]
- Klawonn, F.; Hoffmann, G. Using fuzzy cluster analysis to find interesting clusters. In Building Bridges between Soft and Statistical Methodologies for Data Science; Garcia-Escudero, L.A., Gordaliza, A., Mayo, A., Lubiano Gomez, M.A., Gil, M.A., Grzegorzewski, P., Hryniewicz, O., Eds.; Springer: Cham, Switzerland, 2023; pp. 231–239. [Google Scholar]
- Weaving, G.; Batstone, F.; Jones, R. Age and sex variation in serum albumin concentration: An observational study. Ann. Clin. Biochem. 2016, 53, 106–111. [Google Scholar] [CrossRef]
- Zucker, S.; Horn, P.; Sherman, K. Serum bilirubin levels in the U.S. population: Gender effect and inverse correlation with colorectal cancer. Hepatology 2004, 40, 827–835. [Google Scholar] [CrossRef]
- Bhattacharya, C. A simple method of resolution of a distribution into gaussian components. Biometrics 1967, 23, 115–135. [Google Scholar] [CrossRef] [PubMed]
- Ozarda, Y.; Ichihara, K.; Jones, G.; Streichert, T.; Ahmadian, R. Comparison of reference intervals derived by direct and indirect methods based on compatible datasets obtained in Turkey. Clin. Chim. Acta 2021, 520, 186–195. [Google Scholar] [CrossRef] [PubMed]
- Geffré, A.; Friedrichs, K.; Harr, K.; Concordet, D.; Trumel, C.; Braun, J.-P. Reference values: A review. Vet. Clin. Pathol. 2009, 38, 288–298. [Google Scholar] [CrossRef] [PubMed]
- Henny, J.; Vassault, A.; Boursier, G.; Vukasovic, I.; Brguljan, M.; Lohmander, M.; Ghita, I.; Bernabeu Andreu, F.A.; Kroupis, C.; Sprongl, L.; et al. Recommendation for the review of biological reference intervals in medical laboratories. Clin. Chem. Lab. Med. 2016, 54, 1893–1900. [Google Scholar] [CrossRef]
- Ichihara, K.; Boyd, C. An appraisal of statistical procedures used in derivation of reference intervals. Clin. Chem. Lab. Med. 2010, 48, 1537–1551. [Google Scholar] [CrossRef]


| Row | Category | Age | Sex | ALB | ALT | AST | BIL | CHE | CREA | GGT | PROT |
|---|---|---|---|---|---|---|---|---|---|---|---|
| 1 | reference | 32 | f | 39.9 | 22.0 | 29.8 | 6.3 | 8.16 | 60 | 4.5 | 72.5 |
| 200 | patient | 51 | f | 41.4 | 33.2 | 20.0 | 5.0 | 10.27 | 77.0 | 106.7 | 72.2 |
| 444 | reference | 54 | m | 46.4 | 54.1 | 39.6 | 10.6 | 6.59 | 85 | 73.2 | 75.2 |
| 610 | patient | 59 | m | 31.0 | 5.4 | 95.4 | 117.0 | 1.57 | 60.5 | 53.6 | 68.5 |
| Reference Interval | reflimR | Guideline Method | ||||||||||
|---|---|---|---|---|---|---|---|---|---|---|---|---|
| f | m | ll f | ul f | ll m | ul m | f1 | f2 | f3 | m1 | m2 | m3 | |
| ALB (g/L) | 35–53 | 35–53 | c | r | a | a | a | r | a | a | a | a |
| ALT (U/L) | 10–35 | 10–50 | a | c | a | r | r | a | a | a | r | a |
| AST (U/L) | 10–35 | 10–50 | r | a | r | r | a | a | a | a | a | a |
| BIL (µmol/L) | 2–21 | 2–21 | a | r | r | a | a | a | a | a | a | a |
| CHE (kU/L) | 3.9–10.8 | 4.6–11.5 | r | c | a | c | a | a | a | a | a | a |
| CREA (µmol/L) | 41–88 | 50–104 | r | c | r | r | a | a | a | a | a | a |
| GGT (U/L) | 6–40 | 10–60 | c | a | a | a | a | r | a | a | r | r |
| PROT (g/L) | 66–83 | 66–83 | a | c | a | a | a | a | a | a | a | r |
Disclaimer/Publisher’s Note: The statements, opinions and data contained in all publications are solely those of the individual author(s) and contributor(s) and not of MDPI and/or the editor(s). MDPI and/or the editor(s) disclaim responsibility for any injury to people or property resulting from any ideas, methods, instructions or products referred to in the content. |
© 2024 by the authors. Licensee MDPI, Basel, Switzerland. This article is an open access article distributed under the terms and conditions of the Creative Commons Attribution (CC BY) license (https://creativecommons.org/licenses/by/4.0/).
Share and Cite
Hoffmann, G.; Klawitter, S.; Trulson, I.; Adler, J.; Holdenrieder, S.; Klawonn, F. A Novel Tool for the Rapid and Transparent Verification of Reference Intervals in Clinical Laboratories. J. Clin. Med. 2024, 13, 4397. https://doi.org/10.3390/jcm13154397
Hoffmann G, Klawitter S, Trulson I, Adler J, Holdenrieder S, Klawonn F. A Novel Tool for the Rapid and Transparent Verification of Reference Intervals in Clinical Laboratories. Journal of Clinical Medicine. 2024; 13(15):4397. https://doi.org/10.3390/jcm13154397
Chicago/Turabian StyleHoffmann, Georg, Sandra Klawitter, Inga Trulson, Jakob Adler, Stefan Holdenrieder, and Frank Klawonn. 2024. "A Novel Tool for the Rapid and Transparent Verification of Reference Intervals in Clinical Laboratories" Journal of Clinical Medicine 13, no. 15: 4397. https://doi.org/10.3390/jcm13154397
APA StyleHoffmann, G., Klawitter, S., Trulson, I., Adler, J., Holdenrieder, S., & Klawonn, F. (2024). A Novel Tool for the Rapid and Transparent Verification of Reference Intervals in Clinical Laboratories. Journal of Clinical Medicine, 13(15), 4397. https://doi.org/10.3390/jcm13154397