
Retinal Microvasculature Changes Linked to Executive Function Impairment after COVID-19

 ,
,  , , , ,
  and
and
Abstract
1. Introduction
2. Materials and Methods
2.1. Participants
2.2. Procedure
2.3. Statistical Analyses
3. Results
3.1. Demographic and Clinical Characteristics
3.2. Optical Coherence Tomography Angiography Results
3.3. Cognitive Results
3.4. Correlation Results
4. Discussion
5. Conclusions
Author Contributions
Funding
Institutional Review Board Statement
Informed Consent Statement
Data Availability Statement
Acknowledgments
Conflicts of Interest
References
- Soriano, J.B.; Murthy, S.; Marshall, J.C.; Relan, P.; Diaz, J.V. A Clinical Case Definition of Post-COVID-19 Condition by a Delphi Consensus. Lancet Infect. Dis. 2022, 22, e102–e107. [Google Scholar] [CrossRef] [PubMed]
- ECDC. Prevalence of Post COVID-19 Condition Symptoms: A Systematic Review and Meta-Analysis of Cohort Study Data, Stratified by Recruitment Setting; Europe Centre For Disease Prevention and Control: Solna, Sweden, 2022. [Google Scholar]
- Ballering, A.V.; van Zon, S.K.R.; olde Hartman, T.C.; Rosmalen, J.G.M. Persistence of Somatic Symptoms after COVID-19 in the Netherlands: An Observational Cohort Study. Lancet 2022, 400, 452–461. [Google Scholar] [CrossRef] [PubMed]
- Quan, M.; Wang, X.; Gong, M.; Wang, Q.; Li, Y.; Jia, J. Post-COVID Cognitive Dysfunction: Current Status and Research Recommendations for High Risk Population. Lancet Reg. Health West. Pac. 2023, 38, 100836. [Google Scholar] [CrossRef] [PubMed]
- Matias-Guiu, J.A.; Herrera, E.; González-Nosti, M.; Krishnan, K.; Delgado-Alonso, C.; Díez-Cirarda, M.; Yus, M.; Martínez-Petit, Á.; Pagán, J.; Matías-Guiu, J.; et al. Development of Criteria for Cognitive Dysfunction in Post-COVID Syndrome: The IC-CoDi-COVID Approach. Psychiatry Res. 2023, 319, 115006. [Google Scholar] [CrossRef]
- Ariza, M.; Cano, N.; Segura, B.; Adan, A.; Bargalló, N.; Caldú, X.; Campabadal, A.; Sala-llonch, R.; Barrué, C.; Bejar, J.; et al. Neuropsychological Impairment in Post-COVID Condition Individuals with and without Cognitive Complaints. Front. Aging Neurosci. 2022, 14, 1029842. [Google Scholar] [CrossRef]
- Asadi-Pooya, A.A.; Akbari, A.; Emami, A.; Lotfi, M.; Rostamihosseinkhani, M.; Nemati, H.; Barzegar, Z.; Kabiri, M.; Zeraatpisheh, Z.; Farjoud-Kouhanjani, M.; et al. Long COVID Syndrome-Associated Brain Fog. J. Med. Virol. 2022, 94, 979–984. [Google Scholar] [CrossRef]
- Miskowiak, K.W.; Pedersen, J.K.; Gunnarsson, D.V.; Roikjer, T.K.; Podlekareva, D.; Hansen, H.; Dall, C.H.; Johnsen, S. Cognitive Impairments among Patients in a Long-COVID Clinic: Prevalence, Pattern and Relation to Illness Severity, Work Function and Quality of Life. J. Affect. Disord. 2023, 324, 162–169. [Google Scholar] [CrossRef]
- Ariza, M.; Cano, N.; Segura, B.; Adan, A.; Bargalló, N.; Caldú, X.; Campabadal, A.; Jurado, M.A.; Mataró, M.; Pueyo, R.; et al. COVID-19 Severity Is Related to Poor Executive Function in People with Post-COVID Conditions. J. Neurol. 2023, 270, 2392–2408. [Google Scholar] [CrossRef]
- PHOSP-COVID Collaborative Group. Clinical Characteristics with Inflammation Profiling of Long COVID and Association with 1-Year Recovery Following Hospitalisation in the UK: A Prospective Observational Study. Lancet Respir. Med. 2022, 10, 761–775. [Google Scholar] [CrossRef]
- Ariza, M.; Béjar, J.; Barrué, C.; Cano, N.; Segura, B.; NAUTILUS Project Collaborative Group; Cortés, C.U.; Junqué, C.; Garolera, M. Cognitive Reserve, Depressive Symptoms, Obesity, and Change in Employment Status Predict Mental Processing Speed and Executive Function after COVID-19. Eur. Arch. Psychiatry Clin. Neurosci. 2024. [Google Scholar] [CrossRef]
- Tan, A.C.S.; Tan, G.S.; Denniston, A.K.; Keane, P.A.; Ang, M.; Milea, D.; Chakravarthy, U.; Cheung, C.M.G. An Overview of the Clinical Applications of Optical Coherence Tomography Angiography. Eye 2018, 32, 262–286. [Google Scholar] [CrossRef] [PubMed]
- Campbell, J.P.; Zhang, M.; Hwang, T.S.; Bailey, S.T.; Wilson, D.J.; Jia, Y.; Huang, D. Detailed Vascular Anatomy of the Human Retina by Projection-Resolved Optical Coherence Tomography Angiography. Sci. Rep. 2017, 7, 42201. [Google Scholar] [CrossRef] [PubMed]
- Nageeb Louz, R.E.; Salah Eddin, M.A.; Macky, T.A.; Tolba, D.A.A. Post COVID-19 Retinal Evaluation Using Optical Coherence Tomography Angiography: A Case Control Study. Ocul. Immunol. Inflamm. 2023, 31, 1175–1183. [Google Scholar] [CrossRef]
- González-Zamora, J.; Bilbao-Malavé, V.; Gándara, E.; Casablanca-Piñera, A.; Boquera-Ventosa, C.; Landecho, M.F.; Zarranz-Ventura, J.; García-Layana, A. Retinal Microvascular Impairment in COVID-19 Bilateral Pneumonia Assessed by Optical Coherence Tomography Angiography. Biomedicines 2021, 9, 247. [Google Scholar] [CrossRef] [PubMed]
- Cosmo, E.; Frizziero, L.; Schiavon, S.; Cattelan, A.M.; Leoni, D.; Capizzi, A.; Torresin, T. The Neurovascular Retinal Involvement in a Large Population of Patients Recovered from COVID-19: An OCT and OCT Angiography Study. Eye 2024, 38, 1674–1680. [Google Scholar] [CrossRef]
- Bilbao-Malavé, V.; González-Zamora, J.; De Viteri, M.S.; De La Puente, M.; Gándara, E.; Casablanca-Piñera, A.; Boquera-Ventosa, C.; Zarranz-Ventura, J.; Landecho, M.F.; García-Layana, A. Persistent Retinal Microvascular Impairment in COVID-19 Bilateral Pneumonia at 6-Months Follow-up Assessed by Optical Coherence Tomography Angiography. Biomedicines 2021, 9, 502. [Google Scholar] [CrossRef]
- Turker, I.C.; Dogan, C.U.; Dirim, A.B.; Guven, D.; Kutucu, O.K. Evaluation of Early and Late COVID-19-Induced Vascular Changes with OCTA. Can. J. Ophthalmol. 2022, 57, 236–241. [Google Scholar] [CrossRef]
- Kal, M.; Winiarczyk, M.; Zarębska-Michaluk, D.; Odrobina, D.; Cieśla, E.; Płatkowska-Adamska, B.; Biskup, M.; Pabjan, P.; Głuszek, S.; Mackiewicz, J. Long-Term Effect of SARS-CoV-2 Infection on the Retinal and Choroidal Microvasculature. J. Clin. Med. 2023, 12, 2528. [Google Scholar] [CrossRef]
- Zapata, M.Á.; García, S.B.; Sánchez-Moltalvá, A.; Falcó, A.; Otero-Romero, S.; Arcos, G.; Velazquez-Villoria, D.; García-Arumí, J. Retinal Microvascular Abnormalities in Patients after COVID-19 Depending on Disease Severity. Br. J. Ophthalmol. 2022, 106, 559–563. [Google Scholar] [CrossRef]
- Banderas García, S.; Aragón, D.; Azarfane, B.; Trejo, F.; Garrell-Salat, X.; Sánchez-Montalvá, A.; Otero-Romero, S.; Garcia-Arumi, J.; Zapata, M.A. Persistent Reduction of Retinal Microvascular Vessel Density in Patients with Moderate and Severe COVID-19 Disease. BMJ Open Ophthalmol. 2022, 7, e000867. [Google Scholar] [CrossRef]
- Hohberger, B.; Ganslmayer, M.; Lucio, M.; Kruse, F.; Hoffmanns, J.; Moritz, M.; Rogge, L.; Heltmann, F.; Szewczykowski, C.; Fürst, J.; et al. Retinal Microcirculation as a Correlate of a Systemic Capillary Impairment After Severe Acute Respiratory Syndrome Coronavirus 2 Infection. Front. Med. 2021, 8, 676554. [Google Scholar] [CrossRef] [PubMed]
- Kalaw, F.G.P.; Warter, A.; Cavichini, M.; Knight, D.; Li, A.; Deussen, D.; Galang, C.; Heinke, A.; Mendoza, V.; Borooah, S.; et al. Retinal Tissue and Microvasculature Loss in COVID-19 Infection. Sci. Rep. 2023, 13, 5100. [Google Scholar] [CrossRef] [PubMed]
- Noor, M.; McGrath, O.; Drira, I.; Aslam, T. Retinal Microvasculature Image Analysis Using Optical Coherence Tomography Angiography in Patients with Post-COVID-19 Syndrome. J. Imaging 2023, 9, 234. [Google Scholar] [CrossRef] [PubMed]
- London, A.; Benhar, I.; Schwartz, M. The Retina as a Window to the Brain-From Eye Research to CNS Disorders. Nat. Rev. Neurol. 2013, 9, 44–53. [Google Scholar] [CrossRef]
- Patton, N.; Aslam, T.; MacGillivray, T.; Pattie, A.; Deary, I.J.; Dhillon, B. Retinal Vascular Image Analysis as a Potential Screening Tool for Cerebrovascular Disease: A Rationale Based on Homology between Cerebral and Retinal Microvasculatures. J. Anat. 2005, 206, 319–348. [Google Scholar] [CrossRef]
- Dumitrascu, O.M.; Demaerschalk, B.M.; Valencia Sanchez, C.; Almader-Douglas, D.; O’Carroll, C.B.; Aguilar, M.I.; Lyden, P.D.; Kumar, G. Retinal Microvascular Abnormalities as Surrogate Markers of Cerebrovascular Ischemic Disease: A Meta-Analysis. J. Stroke Cerebrovasc. Dis. 2018, 27, 1960–1968. [Google Scholar] [CrossRef]
- Ikram, M.K.; De Jong, F.J.; Van Dijk, E.J.; Prins, N.D.; Hofman, A.; Breteler, M.M.B.; De Jong, P.T.V.M. Retinal Vessel Diameters and Cerebral Small Vessel Disease: The Rotterdam Scan Study. Brain 2006, 129, 182–188. [Google Scholar] [CrossRef]
- Mitchell, P.; Wang, J.J.; Wong, T.Y.; Smith, W.; Klein, R.; Leeder, S.R. Retinal Microvascular Signs and Risk of Stroke and Stroke Mortality. Neurology 2005, 65, 1005–1009. [Google Scholar] [CrossRef]
- Yeh, T.C.; Kuo, C.T.; Chou, Y.B. Retinal Microvascular Changes in Mild Cognitive Impairment and Alzheimer’s Disease: A Systematic Review, Meta-Analysis, and Meta-Regression. Front. Aging Neurosci. 2022, 14, 860759. [Google Scholar] [CrossRef]
- Fang, M.; Strand, K.; Zhang, J.; Totillo, M.; Signorile, J.F.; Galvin, J.E.; Wang, J.; Jiang, H. Retinal Vessel Density Correlates with Cognitive Function in Older Adults. Exp. Gerontol. 2021, 152, 111433. [Google Scholar] [CrossRef]
- Giuliani, G.; Sborgia, G.; Niro, A.; Castellana, F.; Lampignano, L.; Puzo, P.; Pascale, A.; Pastore, V.; Buonamassa, R.; Galati, R.; et al. Correlation between Retinal Vessel Rarefaction and Psychometric Measures in an Older Southern Italian Population. Front. Aging Neurosci. 2022, 14, 999796. [Google Scholar] [CrossRef] [PubMed]
- Wang, X.; Wei, Q.; Wu, X.; Cao, S.; Chen, C.; Zhang, J.; Yan, Y.; Geng, Z.; Tian, Y.; Wang, K. The Vessel Density of the Superficial Retinal Capillary Plexus as a New Biomarker in Cerebral Small Vessel Disease: An Optical Coherence Tomography Angiography Study. Neurol. Sci. 2021, 42, 3615–3624. [Google Scholar] [CrossRef] [PubMed]
- Zhang, Y.S.; Zhou, N.; Knoll, B.M.; Samra, S.; Ward, M.R.; Weintraub, S.; Fawzi, A.A. Parafoveal Vessel Loss and Correlation between Peripapillary Vessel Density and Cognitive Performance in Amnestic Mild Cognitive Impairment and Early Alzheimer’s Disease on Optical Coherence Tomography Angiography. PLoS ONE 2019, 14, e0214685. [Google Scholar] [CrossRef] [PubMed]
- Bulut, M.; Kurtuluş, F.; Gözkaya, O.; Erol, M.K.; Cengiz, A.; Akldan, M.; Yaman, A. Evaluation of Optical Coherence Tomography Angiographic Findings in Alzheimer’s Type Dementia. Br. J. Ophthalmol. 2018, 102, 233–237. [Google Scholar] [CrossRef] [PubMed]
- Peng, S.Y.; Wu, I.W.; Sun, C.C.; Lee, C.C.; Liu, C.F.; Lin, Y.Z.; Yeung, L. Investigation of Possible Correlation Between Retinal Neurovascular Biomarkers and Early Cognitive Impairment in Patients With Chronic Kidney Disease. Transl. Vis. Sci. Technol. 2021, 10, 9. [Google Scholar] [CrossRef]
- Wang, R.; Kwapong, W.R.; Tao, W.; Cao, L.; Ye, C.; Liu, J.; Zhang, S.; Wu, B. Association of Retinal Thickness and Microvasculature with Cognitive Performance and Brain Volumes in Elderly Adults. Front. Aging Neurosci. 2022, 14, 1010548. [Google Scholar] [CrossRef]
- Faul, F.; Erdfelder, E.; Lang, A.-G.; Buchner, A. G*Power 3: A Flexible Statistical Power Analysis Program for the Social, Behavioral, and Biomedical Sciences. Behav. Res. Methods 2007, 39, 175–191. [Google Scholar] [CrossRef]
- Reitan, R.M.M. Validity of the Trail Making Test as an Indicator of Organic Brain Damage. Percept. Motos Ski. 1958, 8, 271–276. [Google Scholar] [CrossRef]
- Lezak, M.D.; Howieson, D.B.; Bigler, E.D.; Tranel, D. Neuropsychological Assessment, 5th ed.; Press, O.U., Ed.; Oxford University Press: New York, NY, USA, 2012. [Google Scholar]
- Wechsler, D. Wais III. Escala de Inteligencia de Wechsler para Adultos. Manual de Aplicación; TEA Ediciones. Departamento I+D.: Barcelona, Spain, 2001; ISBN 84-7174-575-5. [Google Scholar]
- Peña-Casanova, J.; Quiñones-Úbeda, S.; Gramunt-Fombuena, N.; Quintana-Aparicio, M.; Aguilar, M.; Badenes, D.; Cerulla, N.; Molinuevo, J.L.; Ruiz, E.; Robles, A.; et al. Spanish Multicenter Normative Studies (NEURONORMA Project): Norms for Verbal Fluency Tests. Arch. Clin. Neuropsychol. 2009, 24, 395–411. [Google Scholar] [CrossRef]
- Golden, C.J. Test de Colores y Palabras (Stroop); TEA Ediciones, Ed.; TEA Ediciones: Madrid, Spain, 2005; ISBN 9788416231782. [Google Scholar]
- Cysique, L.A.; Łojek, E.; Cheung, T.C.K.; Cullen, B.; Egbert, A.R.; Evans, J.; Garolera, M.; Gawron, N.; Gouse, H.; Hansen, K.; et al. Assessment of Neurocognitive Functions, Olfaction, Taste, Mental, and Psychosocial Health in COVID-19 in Adults: Recommendations for Harmonization of Research and Implications for Clinical Practice. J. Int. Neuropsychol. Soc. 2021, 28, 642–660. [Google Scholar] [CrossRef]
- Vakani, K.; Ratto, M.; Sandford-James, A.; Antonova, E.; Kumari, V. COVID-19 and Cognitive Function: Evidence for Increased Processing Speed Variability in COVID-19 Survivors and Multifaceted Impairment with Long-COVID Symptoms. Eur. Psychiatry 2023, 66, e43. [Google Scholar] [CrossRef] [PubMed]
- Becker, J.H.; Lin, J.J.; Twumasi, A.; Goswami, R.; Carnavali, F.; Stone, K.; Rivera-mindt, M.; Kale, M.S.; Naasan, G.; Festa, J.R.; et al. Greater Executive Dysfunction in Patients Post-COVID-19 Compared to Those Not Infected. Brain Behav. Immun. 2023, 114, 111–117. [Google Scholar] [CrossRef] [PubMed]
- Ojeda, N.; del Pino, R.; Ibarretxe-Bilbao, N.; Schretlen, D.J.; Peña, J. [Montreal Cognitive Assessment Test: Normalization and Standardization for Spanish Population]. Rev. Neurol. 2016, 63, 488–496. [Google Scholar] [CrossRef] [PubMed]
- Nasreddine, Z.S.; Phillips, N.A.; Bédirian, V.; Charbonneau, S.; Whitehead, V.; Collin, I.; Cummings, J.L.; Chertkow, H. The Montreal Cognitive Assessment, MoCA: A Brief Screening Tool for Mild Cognitive Impairment. J. Am. Geriatr. Soc. 2005, 53, 695–699. [Google Scholar] [CrossRef]
- Gates, T.M.; Cysique, L.A. The Chronicity of HIV Infection Should Drive the Research Strategy of NeuroHIV Treatment Studies: A Critical Review. CNS Drugs 2016, 30, 53–69. [Google Scholar] [CrossRef]
- Marshall, J.C.; Murthy, S.; Diaz, J.; Adhikari, N.; Angus, D.C.; Arabi, Y.M.; Baillie, K.; Bauer, M.; Berry, S.; Blackwood, B.; et al. A Minimal Common Outcome Measure Set for COVID-19 Clinical Research. Lancet Infect. Dis. 2020, 20, e192–e197. [Google Scholar] [CrossRef]
- Lamers, M.M.; Haagmans, B.L. SARS-CoV-2 Pathogenesis. Nat. Rev. Microbiol. 2022, 20, 270–284. [Google Scholar] [CrossRef]
- Varga, Z.; Flammer, A.J.; Steiger, P.; Haberecker, M.; Andermatt, R.; Zinkernagel, A.S.; Mehra, M.R.; Schuepbach, R.A.; Ruschitzka, F.; Moch, H. Endothelial Cell Infection and Endotheliitis in COVID-19. Lancet 2020, 395, 1417–1418. [Google Scholar] [CrossRef]
- Abou-Ismail, M.Y.; Diamond, A.; Kapoor, S.; Arafah, Y.; Nayak, L. The Hypercoagulable State in COVID-19: Incidence, Pathophysiology, and Management. Thromb. Res. 2020, 194, 101–115. [Google Scholar] [CrossRef]
- Jose, R.J.; Manuel, A. COVID-19 Cytokine Storm: The Interplay between Inflammation and Coagulation. Lancet Respir. Med. 2020, 8, e46–e47. [Google Scholar] [CrossRef]
- Ma, L.; Sahu, S.K.; Cano, M.; Kuppuswamy, V.; Bajwa, J.; McPhatter, J.; Pine, A.; Meizlish, M.L.; Goshua, G.; Chang, C.H.; et al. Increased Complement Activation Is a Distinctive Feature of Severe SARS-CoV-2 Infection. Sci. Immunol. 2021, 6, eabh2259. [Google Scholar] [CrossRef] [PubMed]
- Tsampasian, V.; Elghazaly, H.; Chattopadhyay, R.; Debski, M.; Naing, T.K.P.; Garg, P.; Clark, A.; Ntatsaki, E.; Vassiliou, V.S. Risk Factors Associated With Post-COVID-19 Condition A Systematic Review and Meta-Analysis. JAMA Intern. Med. 2023, 183, 566–580. [Google Scholar] [CrossRef] [PubMed]
- Cervia, C.; Zurbuchen, Y.; Taeschler, P.; Ballouz, T.; Menges, D.; Hasler, S.; Adamo, S.; Raeber, M.E.; Bächli, E.; Rudiger, A.; et al. Immunoglobulin Signature Predicts Risk of Post-Acute COVID-19 Syndrome. Nat. Commun. 2022, 13, 446. [Google Scholar] [CrossRef] [PubMed]
- Mizrahi, B.; Sudry, T.; Flaks-Manov, N.; Yehezkelli, Y.; Kalkstein, N.; Akiva, P.; Ekka-Zohar, A.; Ben David, S.S.; Lerner, U.; Bivas-Benita, M.; et al. Long Covid Outcomes at One Year after Mild SARS-CoV-2 Infection: Nationwide Cohort Study. BMJ 2023, 380, e072529. [Google Scholar] [CrossRef]
- Taeschler, P.; Cervia, C.; Zurbuchen, Y.; Hasler, S.; Pou, C.; Tan, Z.; Adamo, S.; Raeber, M.E.; Bächli, E.; Rudiger, A.; et al. Autoantibodies in COVID-19 Correlate with Antiviral Humoral Responses and Distinct Immune Signatures. Allergy Eur. J. Allergy Clin. Immunol. 2022, 77, 2415–2430. [Google Scholar] [CrossRef]
- Cervia-Hasler, C.; Brüningk, S.C.; Hoch, T.; Fan, B.; Muzio, G.; Thompson, R.C.; Ceglarek, L.; Meledin, R.; Westermann, P.; Emmenegger, M.; et al. Persistent Complement Dysregulation with Signs of Thromboinflammation in Active Long Covid. Science 2024, 383, eadg7942. [Google Scholar] [CrossRef]
- Park, D.H.; Connor, K.M.; Lambris, J.D. The Challenges and Promise of Complement Therapeutics for Ocular Diseases. Front. Immunol. 2019, 10, 1007. [Google Scholar] [CrossRef]
- Peterson, S.L.; Krishnan, A.; Patel, D.; Khanehzar, A.; Lad, A.; Shaughnessy, J.; Ram, S.; Callanan, D.; Kunimoto, D.; Genead, M.A.; et al. PolySialic Acid Nanoparticles Actuate Complement-Factor-H-Mediated Inhibition of the Alternative Complement Pathway: A Safer Potential Therapy for Age-Related Macular Degeneration. Pharmaceuticals 2024, 17, 517. [Google Scholar] [CrossRef]
- Dalakas, M.C.; Alexopoulos, H.; Spaeth, P.J. Complement in Neurological Disorders and Emerging Complement-Targeted Therapeutics. Nat. Rev. Neurol. 2020, 16, 601–617. [Google Scholar] [CrossRef]
- Carpanini, S.M.; Torvell, M.; Morgan, B.P. Therapeutic Inhibition of the Complement System in Diseases of the Central Nervous System. Front. Immunol. 2019, 10, 362. [Google Scholar] [CrossRef]
- Schlick, S.; Lucio, M.; Wallukat, G.; Bartsch, A.; Skornia, A.; Hoffmanns, J.; Szewczykowski, C.; Schröder, T.; Raith, F.; Rogge, L.; et al. Post-COVID-19 Syndrome: Retinal Microcirculation as a Potential Marker for Chronic Fatigue. Int. J. Mol. Sci. 2022, 23, 13683. [Google Scholar] [CrossRef] [PubMed]
- Gupta, A.; Madhavan, M.V.; Sehgal, K.; Nair, N.; Mahajan, S.; Sehrawat, T.S.; Bikdeli, B.; Ahluwalia, N.; Ausiello, J.C.; Wan, E.Y.; et al. Extrapulmonary Manifestations of COVID-19. Nat. Med. 2020, 26, 1017–1032. [Google Scholar] [CrossRef] [PubMed]
- Shao, Y.; Jiang, H.; Wei, Y.; Shi, Y.; Shi, C.; Wright, C.B.; Sun, X.; Vanner, E.A.; Rodriguez, A.D.; Lam, B.L.; et al. Visualization of Focal Thinning of the Ganglion Cell-Inner Plexiform Layer in Patients with Mild Cognitive Impairment and Alzheimer’s Disease. J. Alzheimer’s Dis. 2018, 64, 1261–1273. [Google Scholar] [CrossRef] [PubMed]
- Jindahra, P.; Petrie, A.; Plant, G.T. Retrograde Trans-Synaptic Retinal Ganglion Cell Loss Identified by Optical Coherence Tomography. Brain 2009, 132, 628–634. [Google Scholar] [CrossRef]
- Mutlu, U.; Ikram, M.K.; Roshchupkin, G.V.; Bonnemaijer, P.W.M.; Colijn, J.M.; Vingerling, J.R.; Niessen, W.J.; Ikram, M.A.; Klaver, C.C.W.; Vernooij, M.W. Thinner Retinal Layers Are Associated with Changes in the Visual Pathway: A Population-Based Study. Hum. Brain Mapp. 2018, 39, 4290–4301. [Google Scholar] [CrossRef]
- Liu, J.; Tao, W.; Guo, X.; Kwapong, W.R.; Ye, C.; Wang, A.; Wu, X.; Wang, Z.; Liu, M. The Association of Retinal Microvasculature With Gray Matter Changes and Structural Covariance Network: A Voxel-Based Morphometry Study. Investig. Opthalmology Vis. Sci. 2023, 64, 40. [Google Scholar] [CrossRef]
- Gazzaley, A.; Nobre, A.C. Top-down Modulation: Bridging Selective Attention and Working Memory. Trends Cogn. Sci. 2012, 16, 129–135. [Google Scholar] [CrossRef]
- Gatto, N.M.; Varma, R.; Torres, M.; Wong, T.Y.; Johnson, P.L.; Segal-Gidan, F.; MacK, W.J. Retinal Microvascular Abnormalities and Cognitive Function in Latino Adults in Los Angeles. Ophthalmic. Epidemiol. 2012, 19, 127–136. [Google Scholar] [CrossRef]


| H-PCC n = 59 | M-PCC n = 45 | ||
|---|---|---|---|
| Mean (SD) | Mean (SD) | p-Value | |
| Age | 51.64 (6.52) | 50.32 (8.16) | 0.36 |
| Education (years) | 12.84 (3.32) | 14.45 (3.79) | 0.05 |
| Evolution (months) † | 6 (5.8–11.45) | 14.81 (10.64–24.26) | <0.001 |
| Axial length (mm) | 23.95 (1.18) | 23.48 (0.88) | 0.03 |
| Corrected visual acuity | 0.975 (0.066) | 0.970 (0.803) | 0.39 |
| N (%) | N (%) | p-value | |
| Sex (% female) | 25 (39.1) | 39 (60.9) | <0.001 |
| Comorbidities | |||
| Heart disease | 1 (1.7) | 1 (2.3) | |
| Respiratory disease | 13 (22.4) | 8 (18.2) | 0.63 |
| High blood pressure | 13 (22.4) | 2 (4.5) | 0.01 |
| Dyslipidemia | 9 (15.5) | 5 (11.4) | 0.77 |
| Obesity | 19 (32.8) | 4 (9.1) | 0.005 |
| Thyroid disease | 5 (8.6) | 3 (6.8) | 0.74 |
| Chronic liver disease | 5 (8.6) | 0 | |
| Tobacco smoking | 5 (8.6) | 5 (11.4) | 0.65 |
| ICU management | 29 (50) | ||
| Endotracheal intubation | 9 (31) | ||
| High-flow oxygen therapy | 18 (62) | ||
| Non-invasive mechanical ventilation | 9 (31) | ||
| Corticosteroids (low doses) | 20 (68.9) | ||
| Corticosteroids (high doses) | 2 (6.89) | ||
| Dexmedetomidine | 8 (27.5) | ||
| Hydroxychloroquine | 5 (17.24) | ||
| Azithromycin | 4 (13.8) | ||
| Tocilizumab | 8 (27.5) | ||
| Ceftriaxone | 8 (27.5) |
| H-PCC n = 59 | M-PCC n = 45 | ||||
|---|---|---|---|---|---|
| Madj (SE) | Madj (SE) | F | p-Value | ηp2 | |
| Macular thickness (µm) | 258.71 (4.82) | 268.65 (3.34) | 2.552 | 0.12 | 0.044 |
| Choroidal thickness (µm) | 249.24 (12.58) | 312.39 (11.61) | 11.360 | 0.001 | 0.140 |
| Central VD | 10.74 (0.65) | 13.07 (0.68) | 5.127 | 0.03 | 0.064 |
| Internal VD † | 21.75 (19.10–22.73) | 22.20 (21.48–22.83) | 0.869 | 0.35 | |
| Full VD | 19.38 (0.42) | 20.82 (0.44) | 4.686 | 0.03 | 0.059 |
| Central PD (%) | 17.84 (1.06) | 21.65 (0.94) | 6.246 | 0.02 | 0.092 |
| Internal PD (%) † | 37.80 (0.66) | 39.76 (0.70) | 0.941 | 0.34 | |
| Full PD (%) † | 35.43 (0.63) | 37.71 (0.67) | 2.203 | 0.14 | |
| FAZ area (mm2) | 0.284 (0.018) | 0.218 (0.019) | 5.329 | 0.02 | 0.067 |
| FAZ perimeter (mm) † | 2.388 (0.086) | 2.065 (0.090) | 5.661 | 0.02 | 0.071 |
| H-PCC n = 59 | M-PCC n = 45 | ||||
|---|---|---|---|---|---|
| Madj (SE) | Madj (SE) | F | p-Value | ηp2 | |
| MoCA † | 26 (24.5–27) | 27 (24–28.5) | 1.393 | 0.24 | |
| Digit Span Forward (raw score) | 5.07 (0.26) | 5.92 (0.24) | 5.010 | 0.03 | 0.063 |
| Digit Span Backward (raw score) † | 4 (3–5) | 4 (4–5) | 0.172 | 0.68 | |
| Digit Symbol (raw score) | 54.12 (3.00) | 67.56 (2.79) | 9.424 | 0.003 | 0.113 |
| TMT A (time in s) † | 38 (22–51.50) | 33 (26.75 –) | 1.127 | 0.26 | |
| TMT B (time in s) † | 80 (53.50–143) | 72.50 (53.75–95) | 1.957 | 0.05 | |
| TMT B-A (time in s) † | 43 (25–73) | 34 (22.75–57) | 2.544 | 0.12 | |
| SCWT Word (raw score) | 88.63 (3.72) | 92.05 (3.34) | 0.403 | 0.53 | 0.006 |
| SCWT Color (raw score) | 60.05 (2.86) | 63.65 (2.57) | 0.750 | 0.39 | 0.010 |
| SCWT Color-Word (raw score) | 33.52 (1.73) | 38.91 (1.58) | 4.672 | 0.033 | 0.060 |
| COWAT (sum raw score) | 36.63 (2.13) | 40.49 (2.04) | 1.497 | 0.23 | 0.020 |
| OCTA Metric | Cognitive Variable | Pearson r Partial | p | Spearman rs Partial | p |
|---|---|---|---|---|---|
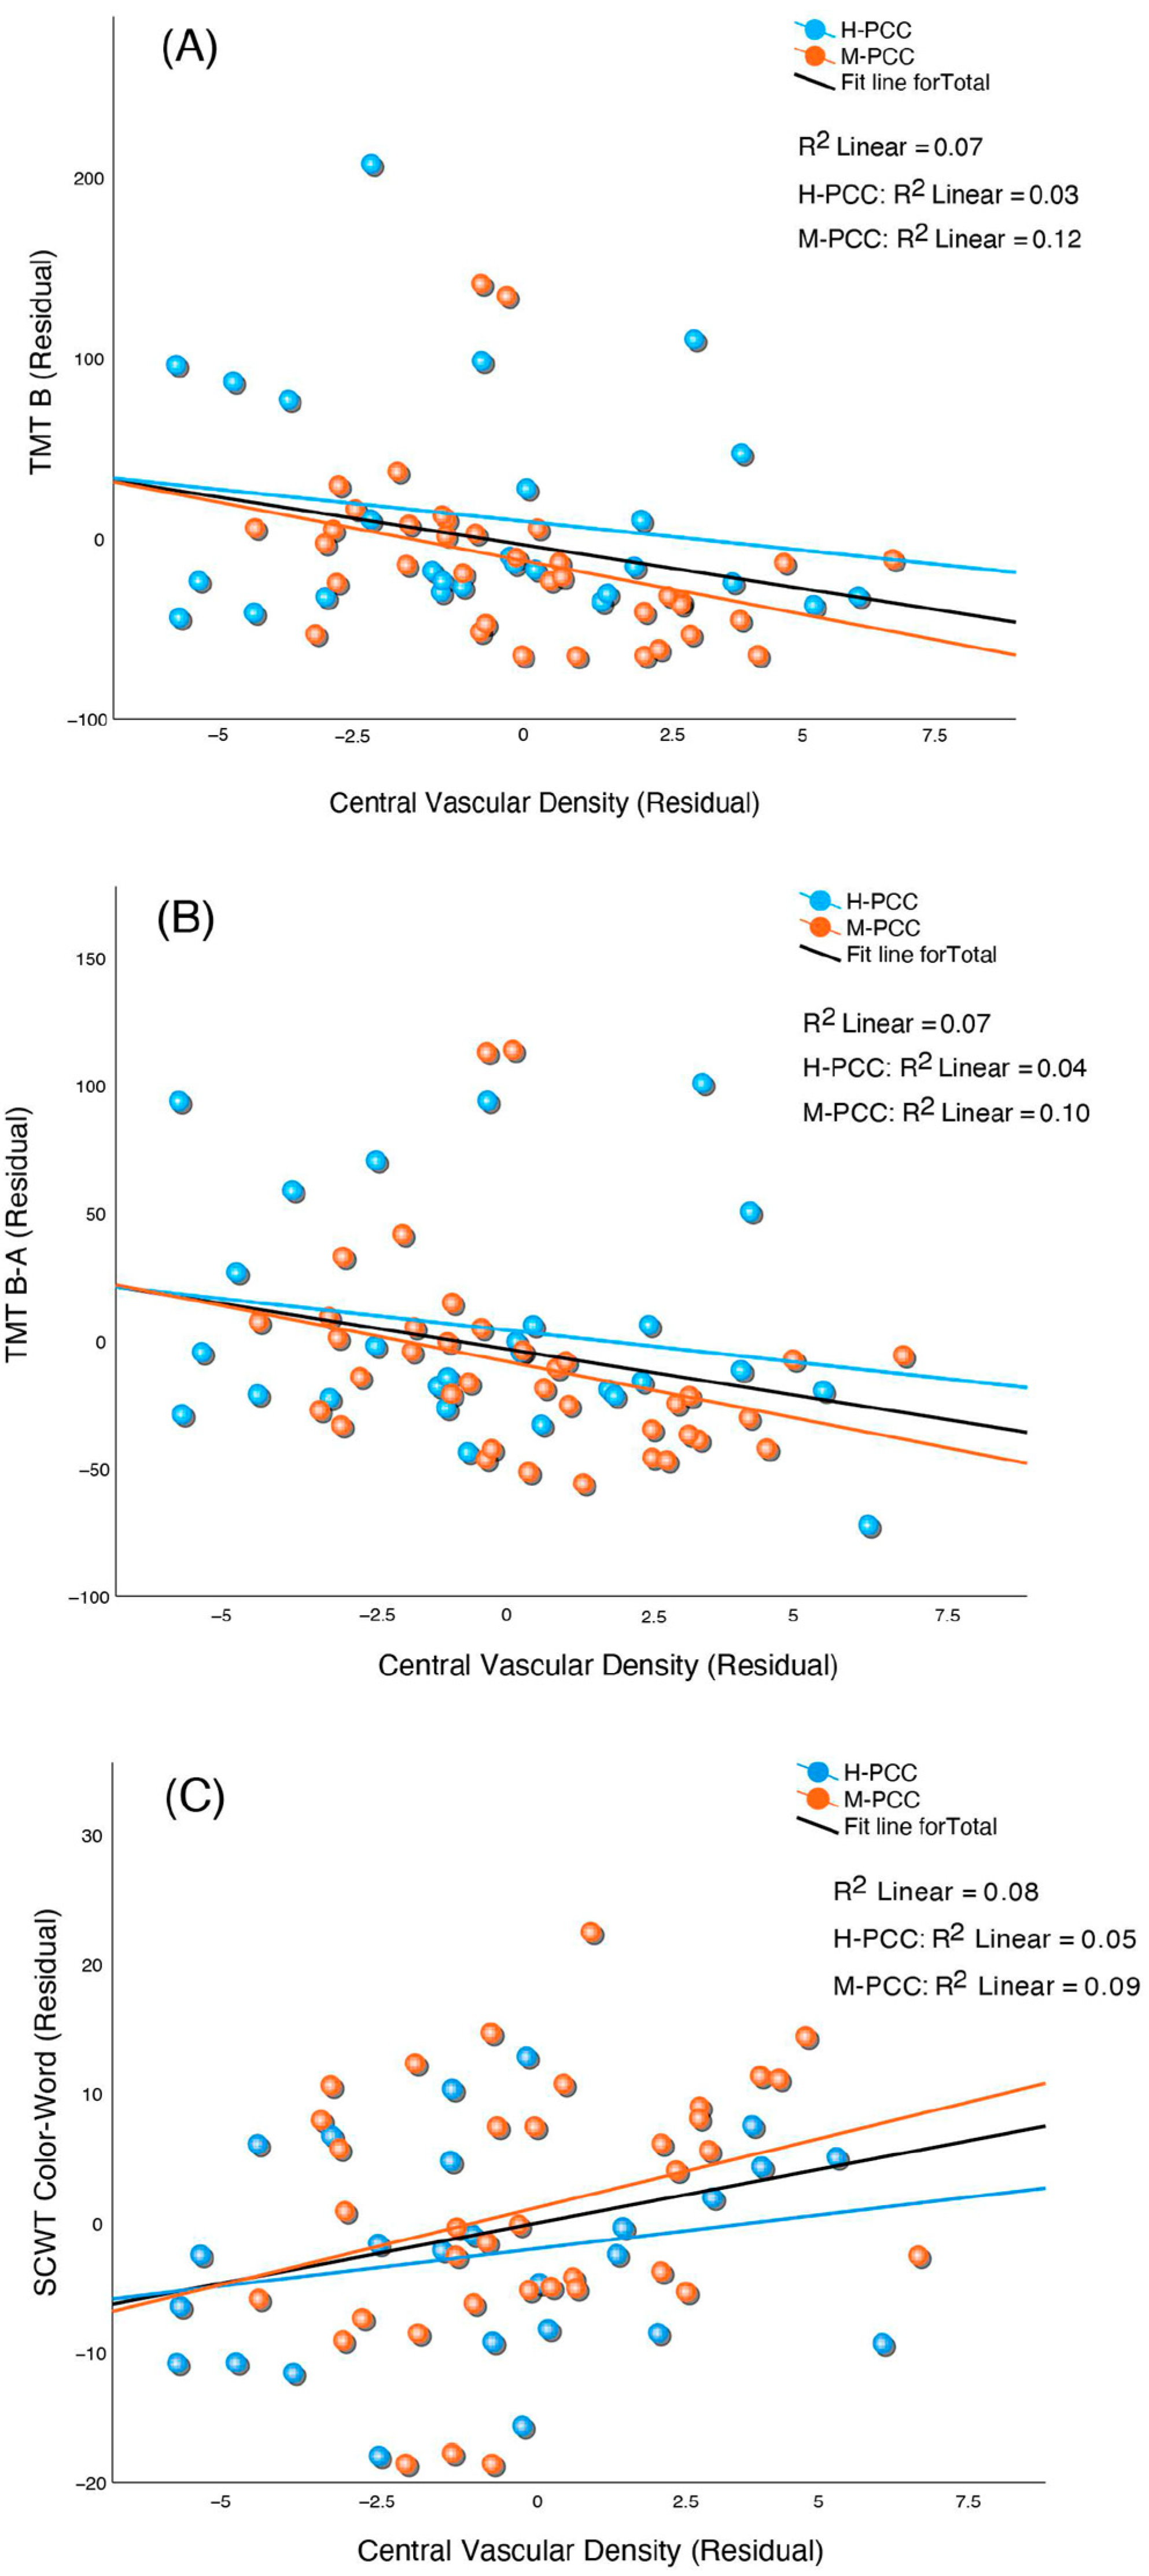
| CVD | TMT B | −0.324 | 0.009 | ||
| TMT B-A | −0.333 | 0.007 | |||
| SCWT CW | 0.321 | 0.020 | |||
| CPD | TMT B | −0.303 | 0.02 | ||
| TMT B-A | −0.313 | 0.01 | |||
| SCWT CW | 0.323 | 0.019 | |||
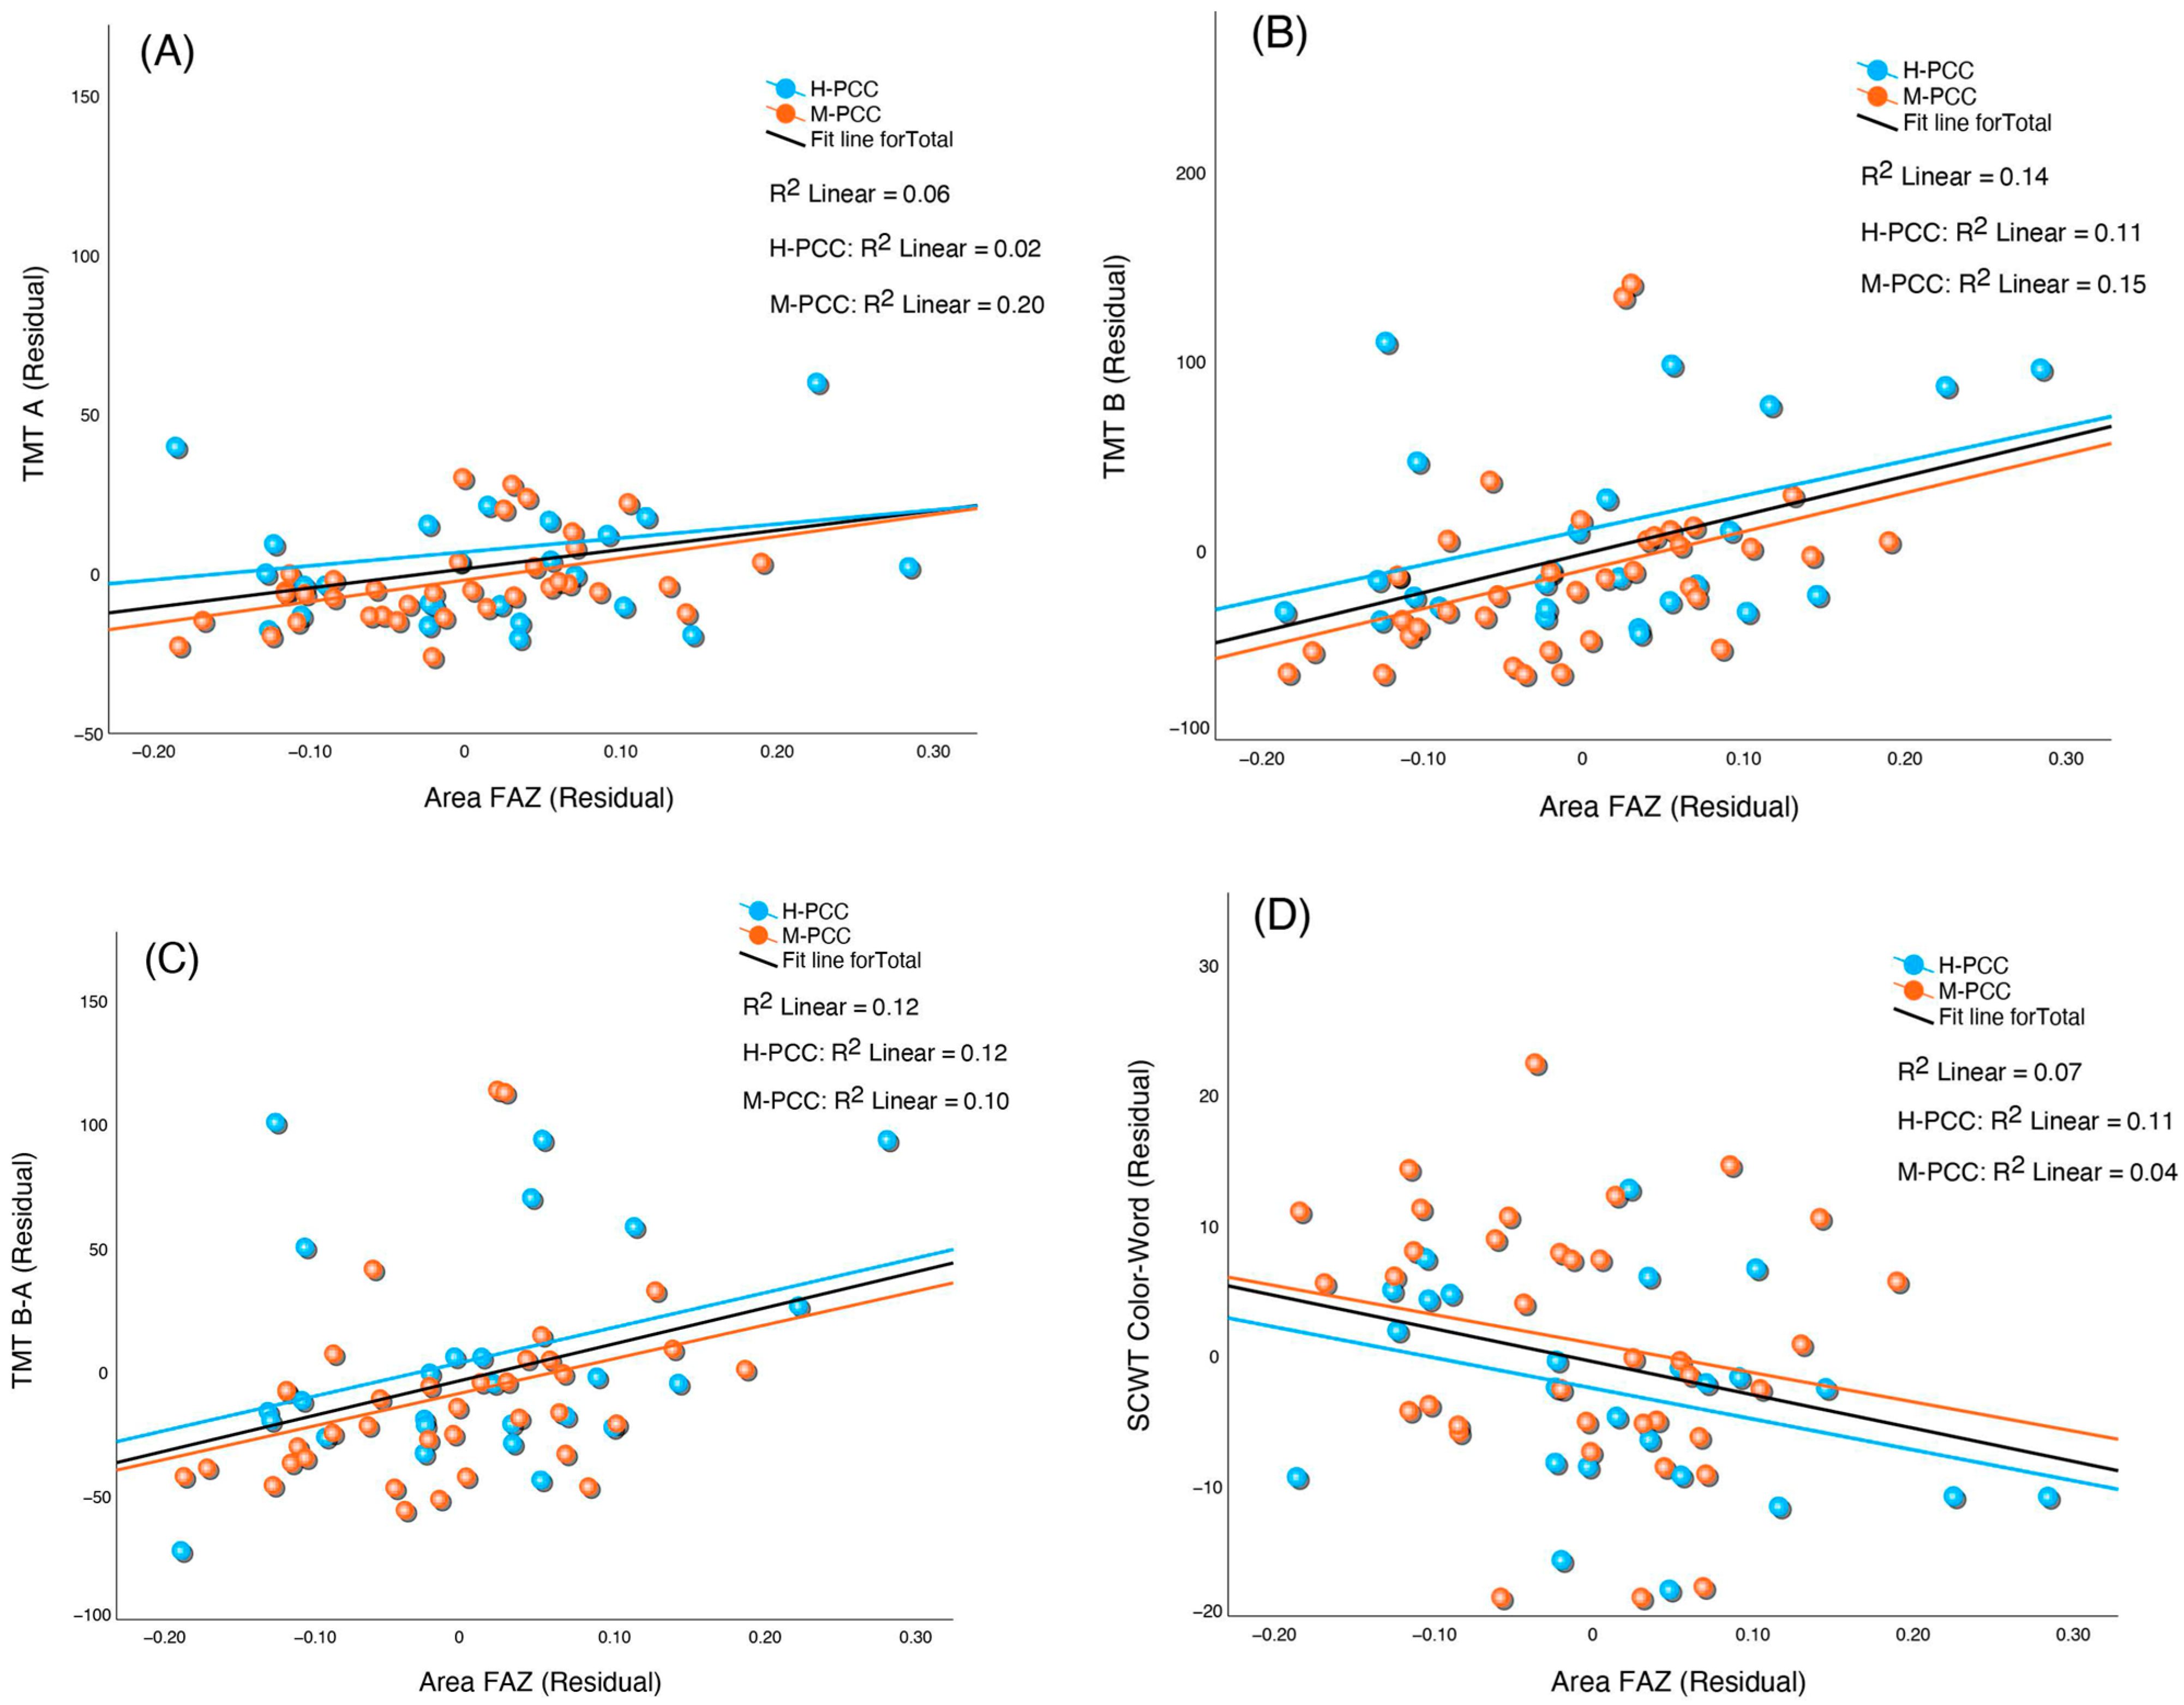
| FAZ Area | TMT A | 0.338 | 0.007 | ||
| TMT B | 0.420 | <0.001 | |||
| TMT B-A | 0.381 | 0.002 | |||
| SCWT CW | −0.284 | 0.041 | |||
| FAZ Perimeter | TMT A | 0.266 | 0.04 | ||
| TMT B | 0.387 | 0.002 | |||
| TMT B-A | 0.369 | 0.003 | |||
| SCWT CW | −0.309 | 0.026 |
| OCTA Metric | Cognitive Variable | Spearman rs Partial | p |
|---|---|---|---|
| CVD | TMT A | −0.427 | 0.008 |
| TMT B | −0.520 | <0.001 | |
| TMT B-A | −0.487 | 0.002 | |
| CPD | TMT A | −0.414 | 0.01 |
| TMT B | −0.494 | 0.002 | |
| TMT B-A | −0.464 | 0.004 | |
| FAZ Area | TMT A | 0.545 | <0.001 |
| TMT B | 0.501 | 0.002 | |
| TMT B-A | 0.408 | 0.01 | |
| FAZ Perimeter | TMT A | 0.559 | <0.001 |
| TMT B | 0.549 | <0.001 | |
| TMT B-A | 0.455 | 0.005 |
Disclaimer/Publisher’s Note: The statements, opinions and data contained in all publications are solely those of the individual author(s) and contributor(s) and not of MDPI and/or the editor(s). MDPI and/or the editor(s) disclaim responsibility for any injury to people or property resulting from any ideas, methods, instructions or products referred to in the content. |
© 2024 by the authors. Licensee MDPI, Basel, Switzerland. This article is an open access article distributed under the terms and conditions of the Creative Commons Attribution (CC BY) license (https://creativecommons.org/licenses/by/4.0/).
Share and Cite
Ariza, M.; Delas, B.; Rodriguez, B.; De Frutos, B.; Cano, N.; Segura, B.; Barrué, C.; Bejar, J.; Asaad, M.; Cortés, C.U.; et al. Retinal Microvasculature Changes Linked to Executive Function Impairment after COVID-19. J. Clin. Med. 2024, 13, 5671. https://doi.org/10.3390/jcm13195671
Ariza M, Delas B, Rodriguez B, De Frutos B, Cano N, Segura B, Barrué C, Bejar J, Asaad M, Cortés CU, et al. Retinal Microvasculature Changes Linked to Executive Function Impairment after COVID-19. Journal of Clinical Medicine. 2024; 13(19):5671. https://doi.org/10.3390/jcm13195671
Chicago/Turabian StyleAriza, Mar, Barbara Delas, Beatriz Rodriguez, Beatriz De Frutos, Neus Cano, Bàrbara Segura, Cristian Barrué, Javier Bejar, Mouafk Asaad, Claudio Ulises Cortés, and et al. 2024. "Retinal Microvasculature Changes Linked to Executive Function Impairment after COVID-19" Journal of Clinical Medicine 13, no. 19: 5671. https://doi.org/10.3390/jcm13195671
APA StyleAriza, M., Delas, B., Rodriguez, B., De Frutos, B., Cano, N., Segura, B., Barrué, C., Bejar, J., Asaad, M., Cortés, C. U., Junqué, C., Garolera, M., & NAUTILUS Project Collaborative Group. (2024). Retinal Microvasculature Changes Linked to Executive Function Impairment after COVID-19. Journal of Clinical Medicine, 13(19), 5671. https://doi.org/10.3390/jcm13195671