Abstract
Background: The incremental exercise test is commonly used to measure maximal oxygen uptake (VO2max), but an additional verification test is often recommended as the “gold standard” to confirm the true VO2max. Therefore, the aim of this study was to compare the peak oxygen uptake (VO2peak) obtained in the ramp incremental exercise test and that in the verification test performed on different days at submaximal intensity. Additionally, we examined the roles of anaerobic performance and respiratory muscle strength. Methods: Sixteen physically active men participated in the study, with an average age of 22.7 ± 2.4 (years), height of 178.0 ± 7.4 (cm), and weight of 77.4 ± 7.3 (kg). They performed the three following tests on a cycle ergometer: the Wingate Anaerobic Test (WAnT), the ramp incremental exercise test (IETRAMP), and the verification test performed at an intensity of 85% (VER85) maximal power, which was obtained during the IETRAMP. Results: No significant difference was observed in the peak oxygen uptake between the IETRAMP and VER85 (p = 0.51). The coefficient of variation was 3.1% and the Bland–Altman analysis showed a high agreement. We found significant correlations between the total work performed in the IETRAMP, the anaerobic peak power (r = 0.52, p ≤ 0.05), and the total work obtained in the WAnT (r = 0.67, p ≤ 0.01). There were no significant differences in post-exercise changes in the strength of the inspiratory and expiratory muscles after the IETRAMP and the VER85. Conclusions: The submaximal intensity verification test performed on different days provided reliable values that confirmed the real VO2max, which was not limited by respiratory muscle fatigue. This verification test may be suggested for participants with a lower anaerobic mechanical performance.
1. Introduction
Maximal oxygen uptake (VO2max) has been established as an important indicator of cardiopulmonary fitness and one of the most important determinants of endurance performance. It represents the upper limit for the transport and ability of the muscles to utilize oxygen [1]. VO2max measurements refer to aerobic capacity evaluation in the general population, talent identification in endurance sport disciplines, and the examination of the effectiveness of different training programs after long-term interventions (e.g., high-intensity interval training). The incremental exercise test (IET) for evaluating maximal oxygen uptake has many practical applications for healthy populations and athletes [2]. IETs with graded increases in intensity are commonly used in physiological laboratories, where individual stages can last from 1 to 5 min [3], or for ramp protocols with a constant slope of load increase [4,5,6,7]. These ramp protocols provide a constant linear increase in workload in every second [5]. Previous studies by Michalik et al. [5] showed that the peak power and VO2max in young road cyclists were higher in the ramp test (0.28 W·s−1) compared to the step test (50 W·min−1). Moreover, there was no significant difference in power at anaerobic threshold (AnT) between both tested protocols. In turn, Danek et al. [6] implemented a 15-min warm-up at a 60% VO2max intensity before the ramp protocol. They reported a greater VO2max, maximal power (Wmax), maximal lung ventilation (VEmax), and maximal heart rate (HRmax) [6]. Despite these findings, further studies are needed to verify linear ramp protocols to measure real VO2max.
Physiologists have developed various methodological criteria known as primary and secondary criteria to confirm measurements of real VO2max [2,4,8,9]. For instance, the primary criteria include reaching a plateau in oxygen uptake (no further increase in VO2 despite the increase in load). The secondary criteria include the following blood lactate concentration ([La−]), HRmax, respiratory exchange ratio (RER), and rate of perceived exertion (RPE). These criteria have been fully discussed in several studies [2,4,8,10]. Contrary, it was found that, during reaching VO2max, it is not possible to expose the VO2 plateau phase [9,11], and the occurrence of this phenomenon presents varied results in the available literature (17–100%) [5,12,13]. On the other hand, using the secondary criteria is problematic [10], because they can be achieved for a submaximal exercise intensity [4]. Additionally, these criteria are characterized by a high individual variability, which reflects the limitations in their application [12,14]. It was also proven that people with a lack of experience in performing these maximal exercise tests, those with low cardiovascular fitness, and those with insufficient motivation can finish incremental exercise tests before reaching VO2max due to different symptoms of fatigue [10]. These results can lead to an underestimation of individual physical capacity and lower values of VO2max.
In recent years, the concept of a verification test to confirm the actual VO2max has emerged. Many studies are summarized in the reviews published by Schaun [9] and Costa et al. [15]. This area of research is attracting attention due to the need to standardize verification protocols and the criteria for achieving real VO2max [9]. On the other hand, some authors have questioned whether this approach is appropriate, e.g., due to the proven high compliance of VO2max from the incremental exercise and verification tests [15,16,17]. Usually, verification tests last a few minutes [9,15,18] and are performed from 1 to 90 min with a passive or active break after finishing the IET [15,16,19] or on a different day [15,18,20,21]. The intensity of exercise during the VER relative to that achieved in the IET is one of the issues that needs to be considered [20], because there is no clear-cut understanding of the load intensity that should be used to provoke the maximal physiological responses [22]. The most frequently used verification phase is effort with maximal or supramaximal intensity, i.e., 100 ≤ 115% of the peak power obtained in the IET [15,19,20]. It has also been verified that protocols with submaximal intensity from 80 to <100% of peak power provide reliable agreement for VO2max [15,16,19,20]. Poole and Jones [10] suggested that the verification phase should be conducted with an intensity exceeding the peak power obtained in the incremental test. In particular, a verification phase with less than 100% peak power should be preferred, as this can be sustained adequately long to allow for the attainment of VO2max [22]. These observations were confirmed by the research of Murias et al. [16], who compared VER at intensities of 85% and 105% of peak power carried out 5 min after an IET in young and older participants. The study indicated that the verification phase provided no additional benefit to the VO2max measurement from the ramp test. However, there have been no studies assessing whether the use of a lower intensity, e.g., 85% of the maximal workload on another day, would lead to a similar VO2max result from the ramp test with a linear increased workload.
The critical requirement for a reliable measurement of VO2max is exercise duration, which justifies the implementation of loads above and below the peak power applied during the verification phase [23]. When the exercise time is long enough, due to the presence of a VO2 slow component, an exercise intensity exceeding AnT and/or the critical power (CP) should allow for reaching VO2max [22], as well as a plateau [15]. This justifies the use of the so-called open loop, i.e., an effort to refuse/volitional exhaustion, which is similar in nature to the incremental exercise test [24]. This also indicates the importance of anaerobic performance, where a high level enables tolerance to fatigue in conditions of metabolic acidosis and reaching a VO2 plateau [25,26]. The increasing level of the anaerobic metabolism during an IET [27] can be assessed using indirect markers of glycolysis (the concentrations of hydrogen and lactate ions) [28]. Astorino and White [29] conducted a study that determined the significance of the anaerobic performance measured by the Wingate Anaerobic Test (WAnT) in individuals who confirmed or did not confirm VO2max in a supramaximal-intensity verification test conducted 10 min after an IET. Interestingly, participants who did not verify the VO2max measured in the IET achieved a 10% higher peak and mean power during the WAnT, which can explain the higher homeostasis disturbances and level of fatigue after an IET. In order to explain these results, conducting a verification test on a different day and measuring the post-exercise lactate concentration and acid–base balance were proposed [29]. This is important, because it is known that increasing the anaerobic metabolism leads to increasing the acute response in lung ventilation and increasing the work of the respiratory muscles. This causes, in a metaboreflex response, a reduction in blood flow through the working limbs and fatigue of the locomotor muscles [30]. It can also be a factor causing fatigue of the respiratory muscles, limiting their performance (loss of strength) during maximum effort, as reported after an incremental treadmill test and a cycle ergometer test [31]. Therefore, further studies are needed to determine to what extent these factors determine the achievement of genuine VO2max.
To the best of our knowledge, no previous studies have assessed whether a verification phase with a constant, open-loop task performed on a different day confirms the reliability of the VO2max measured in the ramp test. Therefore, to fill this research gap, the main aim of this study was to determine whether the verification test performed on another day at an intensity of 85% of the maximal power obtained in a ramp IET confirms VO2max. The second goal was to determine the role of the anaerobic performance measured in the WAnT and compare it between individuals, depending on which test they obtained a higher VO2peak in. The third goal was to determine whether respiratory muscle strength decreases after an IET and VER. We formulated the following hypotheses: (1) the VO2max will not differ between the tests, (2) the anaerobic performance level will affect the possibility of continuing effort (the total work performed) until volitional exhaustion in these tests, and (3) a post-exercise decrease in respiratory muscle strength in both tests will occur.
2. Materials and Methods
2.1. Participants
This study involved sixteen healthy, physically active men. All participants were volunteers and declared a minimum five hours of physical exercise (sports classes at the university, gym, volleyball, football, and running) per week. None of the participants trained sports at a professional level or were classified as being at risk of cardiovascular, respiratory, or metabolic diseases. There were no smokers, drug use, or nutritional support use among the participants. All recruited participants were acquainted with the study procedure, gave their written informed consent to participate, and completed the study. The study was approved by the local Research Ethics Committee (1/2019) and was carried out following the Declaration of Helsinki in a laboratory with the certificate PN-EN ISO 9001:2015, Kobierzyce, Poland, 2022. Detailed characteristics of the study participants are presented in Table 1.

Table 1.
Participants’ characteristics (n = 16) ().
The sample size was established a priori using the G*Power 3.1 software (v.3.1.9.2, Heinrich-Heine-Universität Düsseldorf, Düsseldorf, Germany) [32], the expected effect size was set at (Cohen’s f) 0.8, the α level was set at 0.05, and the power (1-β) was set at 0.9 [33]. Sixteen participants in the group were necessarily recruited.
2.2. Study Design
The experimental study included four visits to the laboratory, with a minimum of 72 h between visits. During the first visit, anthropometric measurements, spirometry, hematological parameters, and familiarization with the research procedures were performed. During the second visit, the WAnT was performed for the lower limbs. On the third day, the ramp incremental increase test (IETRAMP) was conducted, and on the fourth day, the verification test (VER85). Gas analysis, arterial blood gas, lactate concentration, respiratory muscle strength, and rating of perceived exertion were examined during the IETRAMP and the VER85. All sessions were administered by the same group of researchers. The participants were asked not to undertake any strenuous effort or to give up training altogether within 24 h before each test. Likewise, they were supposed to avoid caffeine and alcohol consumption during this time. Both tests were performed at the same time of day (08:00 AM–11:00 AM) under laboratory conditions to avoid daily fluctuations in performance. The subjects consumed the same diet during the two days preceding each test to avoid any influence on metabolism. Figure 1 shows the experimental protocol.
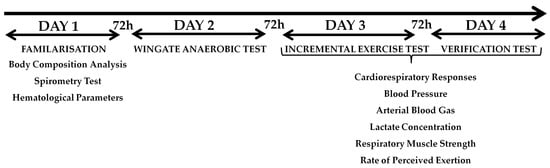
Figure 1.
Experimental protocol.
2.3. Body Composition Analysis
Measurements of height and body weight were made on a WPT 200 medical scale (RADWAG, Radom, Poland), and body composition was measured using the FUTREX analyzer 6100/XL (Futrex Tech, Inc., Gaithersburg, MD, USA). The software then calculated the percentage of body fat (%FAT) based on the near-infrared spectrophotometry (NIRS) method. Before the examination, the participants were instructed to empty their bladder. The probe was placed at the middle of the biceps brachia muscle or the dominant upper limb. All of anthropometry and body composition measurements were performed before the exercise test. The NIRS method has been approved to determine the %FAT in humans [34].
2.4. Hematological Parameters
Capillary blood was collected from the fingertip at rest for the determination of the following blood morphotic parameters: hemoglobin concentration (Hb) and hematocrit (Ht) using the ABX Micros OT.16 (Horiba Medical, Kyoto, Japan).
2.5. Pulmonary Function Procedure
Spirometry tests were performed using a Quark b2 analyzer (Cosmed, Milan, Italy). These tests were conducted in a manner consistent with previous research published by Szczepan et al. [35]. Each test was preceded by air flow calibration. It involved inspiration with a maximum volume preceded by 2–3 quiet breaths and ended with an intense exhalation with a maximum airflow, resulting in a minimum volume of residual air. Each participant performed three trials, and the one with higher FEV1 value was selected for further analysis. In the course of the respiratory test, the following parameters were recorded: forced vital capacity (FVC) and forced expiratory volume in 1 s (FEV1). The software calculated the Tiffeneau index (FEV1·FVC–1).
2.6. Wingate Anaerobic Test (WAnT)
In order to assess anaerobic performance, the WAnT for the lower limbs was performed [36]. The test was performed on an Ergomedic E894 cycle ergometer (Monark Exercise AB, Varberg, Sweden). The cycle ergometer was calibrated before starting the tests. Then, a warm-up was performed, as recommended by the Bar-Or [36]. This warm-up lasted 5 min and consisted of pedaling with a 2% body weight resistance, separated by three short 5 s maximal sprints. After warming up, the subjects remained in a sitting position on the cycle ergometer for five minutes. The flywheel load was 7.5% of the subject’s body weight. The effort lasted thirty seconds and the task of the participant was to perform the work with the maximum (possible) cadence to achieve the peak power output as quickly as possible, maintaining this until end of the test. The subjects were motivated by verbal encouragement in order to exercise as much effort as possible. The cycle ergometer was controlled by a computer and the MCE v.2.3 software (MCE, Wroclaw, Poland). The peak power output (PPO), relative peak power (rPPO), total work (TWWAnT), and fatigue index (FI) were calculated.
2.7. Incremental Exercise Test (IETRAMP)
The incremental exercise test was carried out on an Excalibur Sport cycle ergometer (Lode BV, Groningen, The Netherlands) according to the protocol described by Michalik et al. [5]. It started with a 0 W load, which increased every second by another ~0.278 W (corresponding to 50 W·3 min−1). The minimum cadence was set at 60 rpm. The effort continued until volitional exhaustion. The maximal workload (Wmax) was calculated as the multiplication of the test duration (s) and the load-increasing coefficient. The total work performed (TWIET) was calculated based on the obtained maximal power and the test duration [5].
2.8. Verification Test (VER85)
The verification test was performed on the same Excalibur Sport cycle ergometer (Lode BV, Groningen, The Netherlands). Before the test, a 10-min warm-up was performed with an intensity corresponding to 40% Wpeak with the IETRAMP. The task was to maintain the cadence in the range of 60–90 rpm−1. The subject then waited for 5 min in a sitting position to begin the main part of the test. The test was carried out at a constant load of 85% of the maximal power obtained in the ramp IET (85% Wmax) and continued until the cadence dropped to below 60 rpm−1. The work performed during the test (TWVER85) also was calculated.
2.9. Cardiorespiratory Response Analysis
The subjects breathed through a mask and the expired gas was analyzed by a Quark b2 device (Cosmed, Milan, Italy). The device was calibrated with atmospheric air and a gas mixture with the following composition: CO2—5%, O2—16%, and N2—79%, before starting the measurements. The breathing parameters were registered in each breath (breath by breath). Lung ventilation (VE) and its components, respiratory rate (Rf) and tidal volume (VT), oxygen uptake (VO2), and carbon dioxide output (VCO2), were measured. The results were averaged every 30 s and converted into minute values to exclude false breaths caused by coughing, gasping, or swallowing. Reducing “noise” and artefacts can improve data interpretation. VO2max was recorded as the highest 30 sec mean value during the VO2 plateau at the end of exercise or if at least two of the following criteria were met: (1) volitional exhaustion, (2) heart rate (HR) ≥ 95% of age-predicted maximal heart rate (HRmax) (208–0.7·age), and (3) respiratory exchange ratio ≥1.10. The oxygen uptake plateau was determined using predetermined methods and specified as the period during which the VO2 did not fluctuate ≤1.5 mL·kg−1·min−1 after reaching VO2max [5]. Heart rate measurements were carried out using the RS400 sport-tester (Polar Electro OY, Kempele, Finland) and were recorded by the software of the Quark b2 analyzer.
2.10. Blood Pressure and Stroke Volume
Arterial blood pressure was measured at rest before starting and immediately after completing the tests using an aneroid sphygmomanometer (Riester, Jungingen, Germany). Stroke volume (SV) was estimated by two independent methods. The first method (1) is based on post-exercise blood pressure measurements and the Jackson formula [37]:
where SV—stroke volume (mL), PP—pulse pressure, the difference between systolic and diastolic pressure (mm Hg), and DP—diastolic pressure (mm Hg), age (in years). The second method (2) is based on Fick’s law and is dependent on the VO2 and HR when VO2max is achieved during the incremental exercise test [38]:
where SV—stroke volume (mL), VO2peak—peak oxygen uptake in the incremental exercise test (mL min−1), and HR—heart rate at VO2peak in the graded exercise test (beats min−1). Both methods have previously been used to verify post-training changes in VO2max [39].
SV1 = 101 + (0.5·PP) − (0.59·DP) − (0.61·age)
SV2 = ((VO2peak·16.22−1)·HR−1)·100
2.11. Arterial Blood Gas and Lactate Concentration
Capillary blood was collected from the fingertip (before the test, at rest, and in the third minute after finishing, and in the case of VER85, also immediately after warm-up) to determine the acid–base balance using the RapidLab 348 analyzer (Bayer, Leverkusen, Germany). The results include blood pH data. The blood lactate concentration ([La−]) was also measured on the photometer LP 400 (Dr Lange, Berlin, Germany).
2.12. Respiratory Muscle Strength Analysis
Inspiratory muscle strength (maximal inspiratory pressure [PImax]) and expiratory muscle strength (maximal expiratory pressure [PEmax]) were measured in a test using a Micro RPM respiratory pressure meter (CareFusion, San Diego, CA, USA). Dimitriadis et al. [40] reported that Micro RPM reliably measured PImax and PEmax. To assess PImax, the tested person, in a standing position, performed maximum inspiration from the level of maximum expiration. Then, to evaluate PEmax, the individual exhaled starting from the maximum inspiration level. In both cases, a special stopper was fitted. The PImax and PEmax tests were conducted at rest (PImaxPRE and PEmaxPRE) and five minutes after finishing each test (PImaxPOST and PEmaxPOST). The participants performed two trials for maximum inspiration and maximum expiration each, and the higher values were selected for further analysis.
2.13. Rate of Perceived Exertion
The Borg scale [41], which consists of 15 levels (6–20), was used to assess the subjective feeling of effort described as the rate of perceived exertion (RPE). The subjects evaluated their perceived effort immediately after the warm-up and exercise tests. The indicated scale values were submitted for further statistical analysis.
2.14. Statistical Analysis
The IBM SPSS Statistics version 26 software package (IBM, Inc., Chicago, IL, USA) was used for statistical analysis. The results are presented as arithmetic mean ± standard deviation () and 95% confidence intervals (95% CI). The Shapiro–Wilk test was used to assess the normality of the distribution of the examined features and the homogeneity of variance was assessed using Levene’s test. The paired Student’s t-test was used to evaluate the differences between the protocols. The Mann–Whitney U test was used to evaluate the differences in the parameters measured with the WAnT between the groups that reached VO2peak in the IETRAMP or VER85, respectively. The Pearson’s correlation coefficient between the variables obtained in the WAnT and the work performed during the IET was calculated. To determine the practical implications, the effect size (ES) was calculated as Cohen’s d according to the following criteria: 0.1—trivial, 0.2—small, 0.5—medium, and 0.8—large [33]. A Bland–Altman plot analysis was performed if no significant difference in VO2peak was observed. Limits of agreement (LoA) were used to compare individual differences between variables. Mean differences ± 1.96 SD were provided for LoA lines. The coefficient of variation (CV) for VO2peak was calculated. A two-way analysis of variance (ANOVA) with repeated measurements was performed to determine the strength of the expiratory muscles. The post hoc Bonferroni test was performed when a significant F ratio was obtained. The effect size was calculated as partial eta-square (η2) (small ≥ 0.01 to ≤0.06, moderate ≥ 0.07 to ≤0.13, and large ≥ 0.14) [42]. A p ≤ 0.05 level was considered to be statistically significant.
3. Results
3.1. Maximal Oxygen Uptake Confirmation
The participants obtained a Wmax equal to 315.9 ± 38.9 (W) (95% CI 294.6–337.1 W) during the IETRAMP. The duration of the ramp test was 18:57 ± 2:03 (min:s) (95% CI 17:41–20:14 min:s, and for the VER85, was 7:31 ± 1:30 (min:s) (95% CI 6:43–8:19 min:s) (p < 0.001, t = 19.66, ES = 5.73). The work performed during the IETRAMP was 182.3 ± 46.8 (kJ) (95% CI 157.4–207.2 kJ). In the VER85, it was 60.1 ± 13.9 (kJ) (95% CI 52.6–67.5 kJ) (p < 0.001, t = 11.16, ES = 3.54), which was equal to 34.4 ± 10.2% of the total work performed during the IETRAMP.
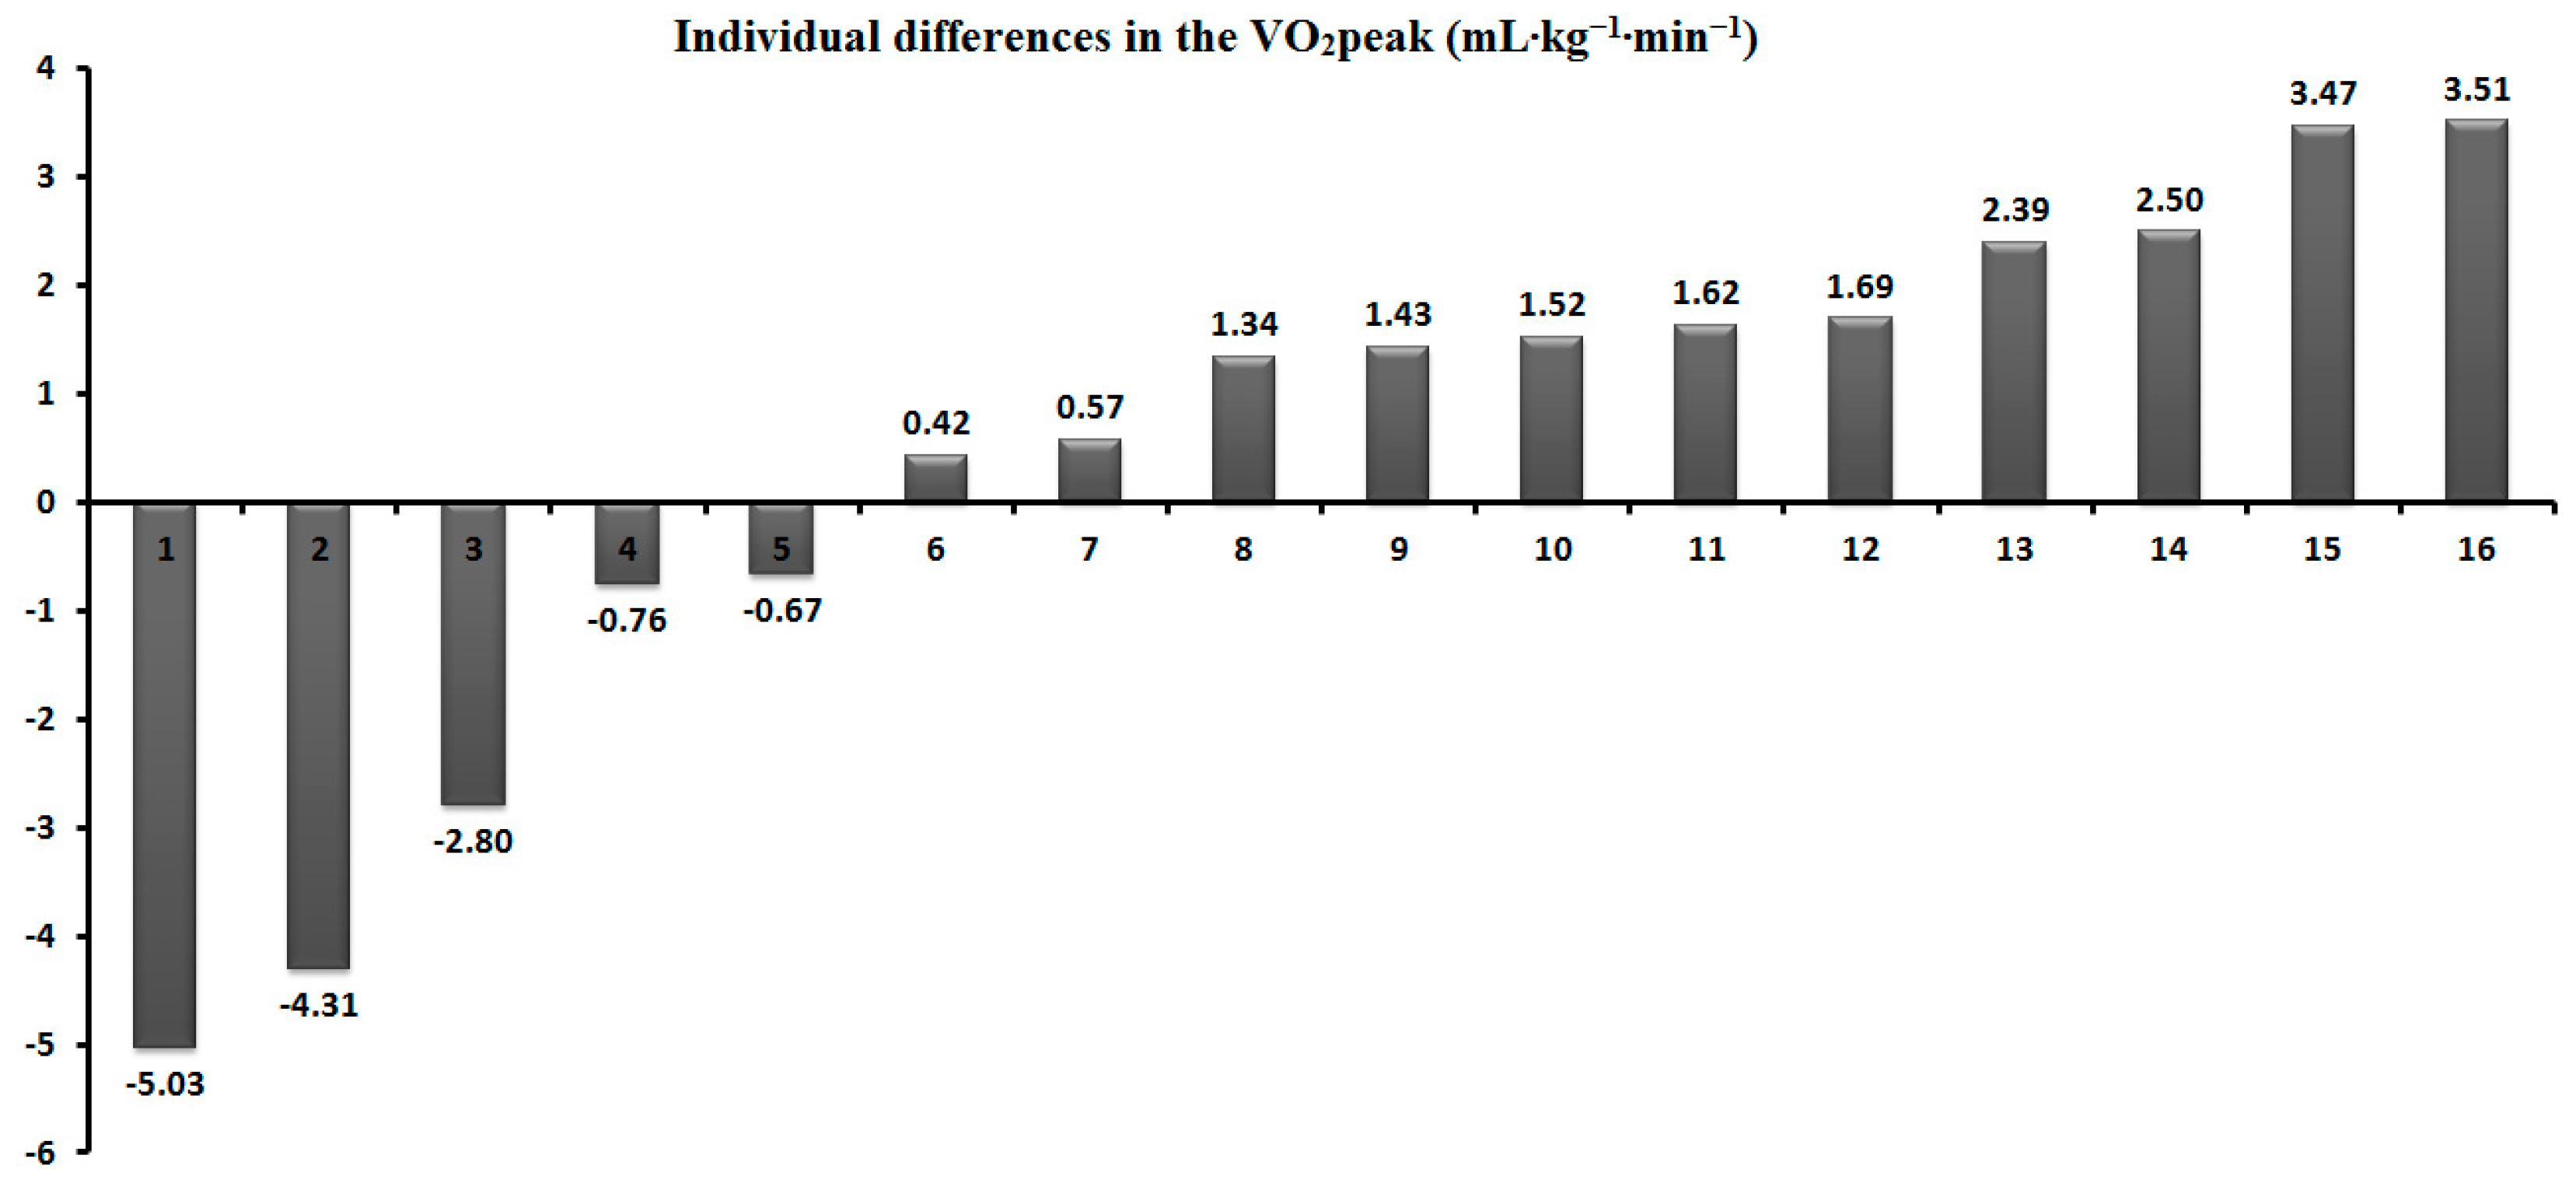
Table 2 shows that the peak oxygen uptake did not show significant differences between the tests (p = 0.51). During the VER85, the VCO2 was significantly lower (p < 0.05, t = 2.20, ES = 0.34), similar to HRmax (p < 0.05, t = 2.36, ES = 0.23). The CV was 3.1%, and the Bland–Altman analysis revealed a high agreement and a small bias for the VO2peak (0.43). One outlier was identified outside the lower limits of agreement (−4.59) (Figure 2). Moreover, five participants (31%) achieved a higher value during the VER85 (Figure 3). The peak oxygen uptake for the group that obtained it in the IETRAMP (n = 11) was 51.1 ± 4.8 mL kg–1 min–1 (95% CI 47.8–54.3), and in the verification test (n = 5), it was 48.8 ± 3.9 mL kg–1 min–1 (95% CI 43.9–53.7) (p = 0.50).
Table 2.
Comparison of the mean ( ± SD) and 95% CI physiological, biochemical, and psychological responses between both tests.
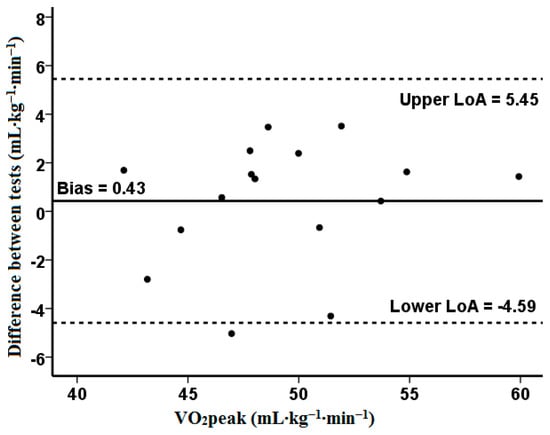
Figure 2.
The Bland–Altman plot was used to define standard deviation, precision, and limits of agreement between the measurements of VO2peak from the two tests. The measure differences (y-axis) are delineated as a two-measure mean function (x-axis) at VO2peak. The horizontal solid line represents the mean difference between two measures (i.e., deviation). The two horizontal dotted lines represent the upper and the lower limit of agreement (1.96·SD) of the mean difference between VO2peak in IETRAMP and VER85.
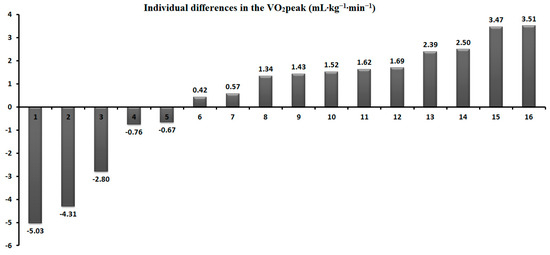
Figure 3.
Individual differences in the VO2peak between IETRAMP and VER85.
3.2. Anaerobic Performance
The PPO measured in the WAnT was 865.0 ± 94.6 (W) (95% CI 814.6–915.3 W) and the rPPO was equal to 11.2 ± 0.7 (W·kg−1) (95% CI 10.8–11.6 W·kg−1). The total work performed was 19.4 ± 1.9 (kJ) (95% CI 10.8–11.6 kJ), and the fatigue index was equal to 27.8 ± 5.4 (%) (95% CI 24.9–30.6%). The total work performed during the IETRAMP was correlated with TWWAnT (r = 0.67, p < 0.01) and the PPO (r = 0.52, p < 0.05). There were no correlations between the level of anaerobic performance in the WAnT and the total work performed in the verification test.
Table 3 shows a comparison of the anaerobic performances between two groups depending on where the individuals obtained a higher peak oxygen uptake (VO2peak in IETRAMP (n = 11) vs. VO2peak in VER85 (n = 5)). This division was used to test the second hypothesis and compare the anaerobic performances between these both groups. There were no significant differences in the PPO (p = 0.50), rPPO (p = 0.74), TWWAnT (p = 0.36), or FI (p = 0.74) between these groups (Table 3).
Table 3.
Comparison of the anaerobic performance of the group that obtained peak oxygen uptake in the IETRAMP and the VER85 ( ± SD) and 95% CI.
3.3. Respiratory Muscle Strength
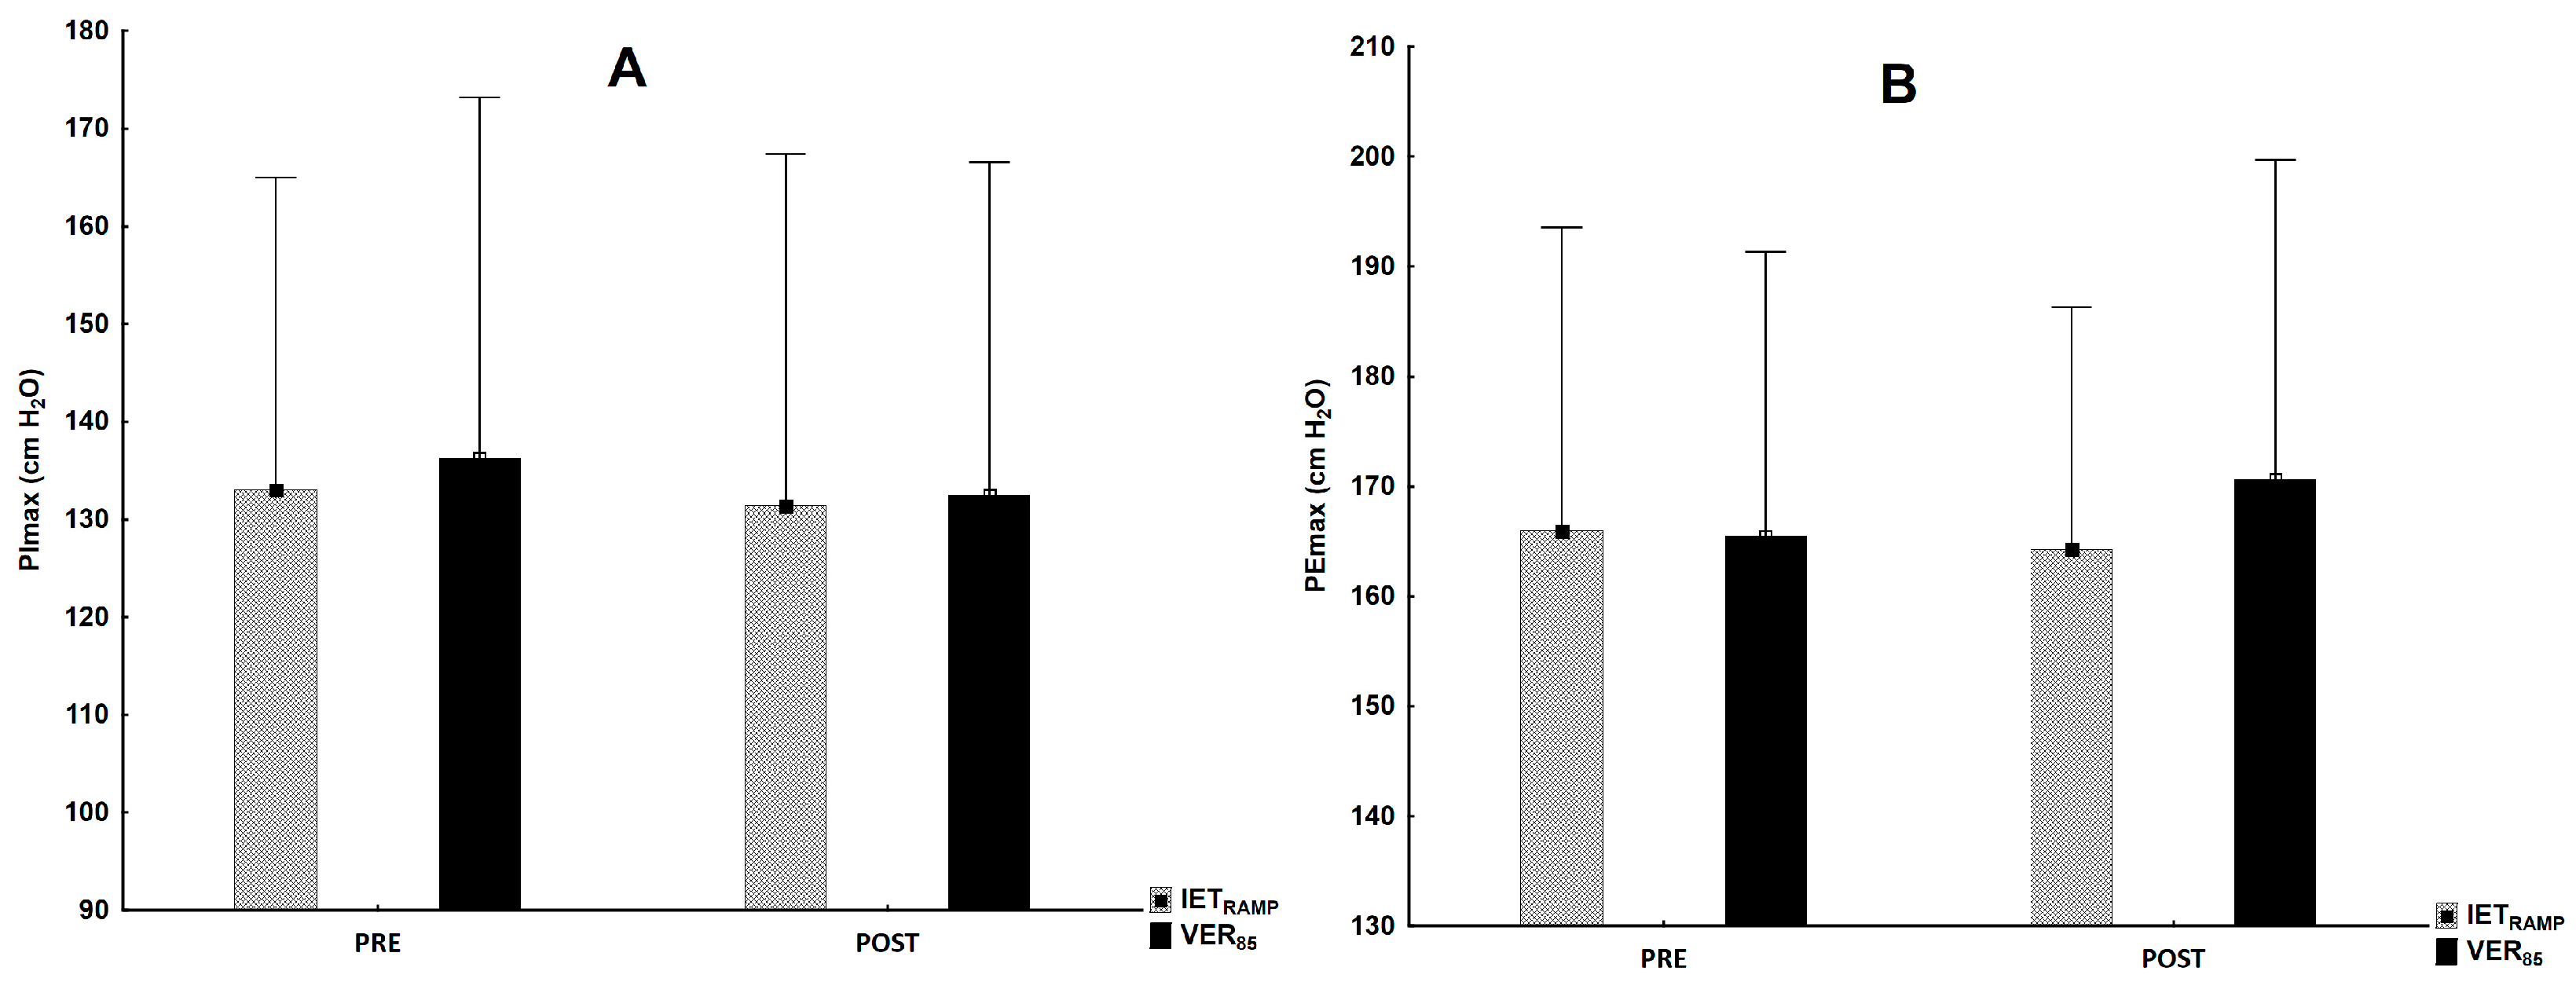
There were no post-exercise changes in the inspiratory (F1,30 = 1.13, p = 0.30) and expiratory muscle strength (F1,30 = 0.38, p = 0.54) in relation to rest in the IETRAMP and VER85 and between the tests for PImaxPOST (F1,30 = 0.18, p = 0.68) and PEmaxPOST (F1,30 = 41.0, p = 0.23) (Figure 4).

Figure 4.
The level of inspiratory (A) and expiratory (B) muscle strength at rest and after completion of IETRAMP and VER85.
4. Discussion
The findings of this study indicate that the verification test performed at submaximal intensity (85% Wmax) to volitional exhaustion, on a different day to the IETRAMP, confirms the VO2max expressed as group mean. Another finding revealed here was the acceptable individual variation in VO2peak, with five subjects achieving a higher VO2peak during the VER85. Moreover, for the second hypothesis, we reported equivocal results. The positive correlations between the peak power output, the work performed in the WAnT, and the work performed in IETRAMP indicate the importance of anaerobic performance. There were no differences in the anaerobic performance indicators between groups taking into account the test where individuals obtained a higher peak oxygen uptake, but a trend to lower mechanical indices occurred for the VER85 group. Thus, a verification test may be suggested for participants with a lower anaerobic mechanical performance. A lack of changes in the strength of the inspiratory and expiratory muscles indicates their marginal effect on VO2max measurements during the verification phase. This study is the first to provide the role of anaerobic mechanical performance and its influence on VO2max measurements during ramp incremental tests and verification tests with a simultaneous lack of post-test respiratory muscle fatigue.
Typically, in similar studies [16,17,18,19,20,21,22], the VO2peak between the incremental exercise test and verification test was compared as a group mean. Noakes [43] criticized this approach, stating that the verification of the VO2peak against that measured in an IET should be considered as an individual response. The use of the arithmetic mean for all participants in statistical analyses may not identify the individual variability in the VO2peak measurement between these tests. Our study confirms this statement, as the mean difference in the VO2peak between the IETRAMP and VER85 was only 0.8% and was not significant. The coefficient of variation for VO2peak was 3.1% and was close to the most commonly used CV measures, which assume differences of 2–3% [29,44]. In other studies, some authors have utilized less restrictive criteria of ≤5–5.5% for the acceptable differentiation of measurements of physiological response [45,46]. Moreover, Villanueva et al. [19] reported a more significant agreement between the peak VO2 obtained in the incremental exercise test and the submaximal verification test (85% IET peak power) compared to the supramaximal test (110% IET peak power), which was analyzed by examining the limits of agreement and bias presented in Bland–Altman plots. Similarly, this is confirmed by the Bland–Altman analysis carried out in our study, which indicates the existence of a high agreement between the verification phase and the ramp test for VO2max, evaluating with one outlier. Although the need for the verification test seems questionable according to some researchers, additional tests prove helpful in assessing the individual variability in VO2peak [21]. Murias et al. [16] concluded that performing an additional verification test may allow for measuring a higher VO2peak value, which, for some reason, cannot be achieved during the IET. This is consistent with our results, because the highest VO2peak (including both tests) was 1% higher than that measured only during the IETRAMP (50.3 vs. 49.5 mL·kg–1·min–1). Thus, this justifies conducting a test to verify the VO2max measured in an IET, as previously postulated by Poole and Jones [10].
The results from this study should also be evaluated considering the context of the day when the verification test was performed (after IET or on another day). Previous reports have shown that these tests at submaximal intensity (80–90% Wmax) were performed on the same day in groups of young and older people [16,19,45,46,47] or on a different day [20,48]. The results from our study are consistent with those published by Murias et al. [16] and Villanueva et al. [19], who also applied the submaximal load verification test with 85% of the maximal power obtained in the IET. Villanueva et al. [19] compared two verification phases with intensities of 85% and 110% Wmax from the ramp incremental test (with a linear increasing load) was performed 10 min after the IET. These authors suggested that submaximal exercise at a constant intensity (85% Wpeak) verifies VO2max more frequently in elderly participants [19]. However, in the studies mentioned above, verification tests were carried out several minutes after the completion of the incremental exercise test. The results from our study are consistent with those reported by Sawyer et al. [20] and Hebisz et al. [18], who also used verification tests on another day. This approach was suggested due to a lower level of fatigue, as the possibility of a longer effort and obtaining the actual VO2peak on a separate day may be preferable for participants with a lower physical capacity or those with overweight or obesity [18,49,50]. This justifies further research on the methodological aspects for the application of a verification phase and a detailed explanation of the impact of potential factors, e.g., the longer duration of the VER test [22] performed on a different day or the potential role of anaerobic performance.
Hill et al. [51] suggested that at least a 2 min time to exhaustion may be required to induce VO2max. Exercise at an intensity above the critical power should lead to the achievement of the VO2peak [16,52]. This justifies using a verification phase with submaximal intensity and an open-loop task [22,23]. The mean time of the verification phase measured by us was longer than that in the previously mentioned studies and amounted to 7:31 ± 1:30 (min:s) [15,16,19,20]. This may be related to the level of physical fitness and the implemented procedures, e.g., performing the VER on a different day. Additionally, the duration of our both tests was consistent with the suggestion of Midgley et al. [53] on measuring VO2max in cycle ergometer tests lasting from 7 to 26 min. The criteria for establishing the maximum effort and VO2max were executed in both tests, although the peak HR during the VER was significantly lower than that during the ramp IET. But it is noteworthy that, even if statistically different, the 2 (beats·min–1) found in our study might be seen as a clinically meaningful difference. Similar results were obtained when comparing two incremental ramp protocols, where a considerably lower HRmax was obtained in the shorter test [54]. According to Boudet et al. [55], more extended and high-intensity exercise generates an additional increase in catecholamines and sympathetic response. According to Astorino and White [29], the lack of differences in peak HR values indicates the usefulness of this criterion when verifying the peak oxygen uptake. On the other hand, it was considered that, if the difference between HRmax during the incremental and verification phases is ≤4 beats per minute, this is regarded as sufficient evidence for maximal effort [56]. Further research should consider other central and peripheral factors that determine the VO2max and their impact on the individual variability in VO2peak.
The incremental exercise test and some types of verification tests are open-loop tasks performed until exhaustion. Therefore, we assumed that the level of the anaerobic performance would determine the ability to tolerate the exercise intensity and achieve VO2max [24,25]. Our findings revealed similar post-exercise lactate concentrations and blood pHs measured in both tests, indicating the achievement of a limited anaerobic performance and level of acidosis, which is a factor causing skeletal muscle fatigue, leading to limitations in continuing exercise and voluntary exhaustion [57]. We also examined whether the participants who obtained VO2peak in the VER85 (n = 5) differed in their anaerobic performance and VO2peak compared to subjects who “preferred” the IETRAMP (n = 11). Interestingly, all measured parameters in the WAnT were similar, without any significant differences. Moreover, in this study, we used a novel approach and compared the parameters depending on the test type. In other studies, different approaches were carried out, e.g., Astorino and White [29] compared the anaerobic performances of participants who confirmed or did not confirm VO2max in the verification test. It was shown that subjects with a lower level of cardiovascular fitness, without experience in reaching maximal effort and not adapted to exceed the upper limits of their exercise tolerance, might interrupt the IET before reaching VO2max due to symptoms related to fatigue [10,58]. Alternatively, the central governor model of exercise regulation [59] explains that brain activity may weaken exercise tolerance by reducing motor unit recruitment during demanding exercise. Moreover, we found significant correlations between the work performed in the IETRAMP and the peak power output and total work performed in the WAnT. Similar relationships did not occur in the case of VER85, which indicates that anaerobic performance (expressed as power and the work measured in the WAnT), to a greater extent, determines the possibility of continuing effort until exhaustion, overcoming mechanical resistance and performing greater work in the ramp incremental test. It seems that subjects with a lower anaerobic performance (mechanical power) may prefer the submaximal verification test with a constant load than the increasing workload during the ramp incremental test. However, further research should comprehensively explain the role of anaerobic performance.
The third tested hypothesis was the examination of the occurrence of post-exercise respiratory muscle fatigue after the tests. Previously, it was well-documented that respiratory muscle fatigue occurs during heavy exercise (>80% VO2max) lasting 8–10 min [60,61], which may limit the possibility to continue strenuous exercise (like in the IET and VER tests). Oueslati et al. [31] reported post-exercise fatigue as decreased respiratory muscle strength after an incremental exercise test on a treadmill and cycle ergometer in runners and cyclists. The results of our study are contrary to these findings, because the respiratory muscle strength did not differ significantly after the IETRAMP and VER85. One of the possible explanations for these discrepancies is the baseline level, which was similar to runners but lower for cyclists than the level reported in our study. It is possible that the exercise modality, a standing posture, could induce a different recruitment pattern of the respiratory muscles between running and cycling [31]. For example, Tanner et al. [62] showed differences between the end-inspiratory (6.24 ± 0.88 vs. 5.90 ± 0.74 L) and end-expiratory (3.40 ± 0.53 vs. 3.21 ± 0.55 L) lung volumes for the same group of participants in a maximal cycling test compared to a running test. In summary, the maximal lung ventilation was very similar in both tests and there were no fatigue symptoms, so we conclude that these factors do not influence VO2peak during verification tests.
The limitation of our study is that its results are relevant to young, active men, not professional athletes or other groups (women, older people, and those with obesity). Therefore, further studies should include women as well as elderly people due to the importance of tests for assessing cardio-respiratory efficiency. The study’s limitations also include the fact that this test is specific for incremental exercise test on a cycle ergometer. We only assessed anaerobic mechanical performance, but metabolic indices should also be evaluated, such as maximal accumulated oxygen deficit. On the other hand, we implemented a resistance of 7.5% of body weight during the WAnT. However, mechanical anaerobic power could be evaluated by a more specific force–velocity test using the optimal load [63]. It is noteworthy that other methods could be implemented for respiratory muscle strength examination. Further analysis should include the above-mentioned suggestions.
5. Conclusions
These findings indicate that a verification test of submaximal intensity (85% Wmax) performed on a different day confirms VO2max and emphasized the individual inter-subject variability in the male subjects. It should be taken into account that nearly one-third of the participants had a higher peak oxygen uptake measured in the verification test. Scientists should further investigate which test protocols could minimize the differences between the VO2peak attained in IET and VER tests. Participants with higher levels of anaerobic performance may perform greater work and are likely to achieve a higher VO2peak during the ramp IET. Whether the role of anaerobic performance can explain individual variability should be comprehensively examined in the future investigations. We also concluded that the applied tests do not cause fatigue of the respiratory muscles and, therefore, have no effect on the diagnosed VO2peak. Thus, the proposed verification test can be an alternative that is less physically demanding in order to achieve the peak physiological parameters.
Author Contributions
Conceptualization, K.M.; methodology, K.M. and N.D.; software, K.M.; validation, K.M. and N.D.; formal analysis, K.M.; investigation, K.M.; resources, K.M. and N.D.; data curation, K.M. and N.D.; writing—original draft preparation, K.M.; writing—review and editing, K.M. and N.D.; visualization, K.M.; supervision, K.M.; project administration, K.M.; funding acquisition, K.M. and N.D. All authors have read and agreed to the published version of the manuscript.
Funding
This research received no external funding.
Institutional Review Board Statement
The study was conducted in accordance with the Declaration of Helsinki, and approved by the Institutional Review Board (the local Research Ethics Committee (1/2019, approved on 11 January 2019) of Wroclaw University of Health and Sport Sciences, Poland.
Informed Consent Statement
Informed consent was obtained from all subjects involved in the study.
Data Availability Statement
Data are available upon request to author KM.
Acknowledgments
We would like to thank all participants who engaged in this experiment.
Conflicts of Interest
The authors declare no conflicts of interest.
References
- Levine, B.D. VO2max: What do we know, and what do we still need to know? J. Physiol. 2008, 586, 25–34. [Google Scholar] [CrossRef] [PubMed]
- Beltz, N.M.; Gibson, A.L.; Janot, J.M.; Kravitz, L.; Mermier, C.M.; Dalleck, L.C. Graded Exercise Testing Protocols for the Determination of VO2max: Historical Perspectives, Progress, and Future Considerations. J. Sports Med. 2016, 2016, 3968393. [Google Scholar] [CrossRef] [PubMed]
- Bentley, D.J.; Newell, J.; Bishop, D. Incremental exercise test design and analysis: Implications for performance diagnostics in endurance athletes. Sports Med. 2007, 37, 575–586. [Google Scholar] [CrossRef]
- Poole, D.C.; Wilkerson, D.P.; Jones, A.M. Validity of criteria for establishing maximal O2 uptake during ramp exercise tests. Eur. J. Appl. Physiol. 2008, 102, 403–410. [Google Scholar] [CrossRef]
- Michalik, K.; Danek, N.; Zatoń, M. Assessment of the physical fitness of road cyclists in the step and ramp protocols of the incremental test. J. Sports Med. Phys. Fit. 2019, 59, 1285–1291. [Google Scholar] [CrossRef]
- Danek, N.; Michalik, K.; Hebisz, R.; Zatoń, M. Influence of warm-up prior to incremental exercise Test on aerobic performance in physically active men. Pol. J. Sport Tour. 2019, 26, 9–13. [Google Scholar] [CrossRef]
- Michalik, K.; Danek, N.; Zatoń, M. Comparison of the Ramp and Step Incremental Exercise Test Protocols in Assessing the Maximal Fat Oxidation Rate in Youth Cyclists. J. Hum. Kinet. 2021, 80, 163–172. [Google Scholar] [CrossRef]
- Sánchez-Otero, T.; Iglesias-Soler, E.; Boullosa, D.A.; Tuimil, J.L. Verification criteria for the determination of VO2 MAX in the field. J. Strength Cond. Res. 2014, 28, 3544–3551. [Google Scholar] [CrossRef]
- Schaun, G.Z. The Maximal Oxygen Uptake Verification Phase: A Light at the End of the Tunnel? Sports Med. Open 2017, 3, 44. [Google Scholar] [CrossRef]
- Poole, D.C.; Jones, A.M. Measurement of the maximum oxygen uptake o2max: o2peak is no longer acceptable. J. Appl. Physiol. 2017, 122, 997–1002. [Google Scholar] [CrossRef]
- Lucía, A.; Rabadán, M.; Hoyos, J.; Hernández-Capilla, M.; Pérez, M.; San Juan, A.F.; Earnest, C.P.; Chicharro, J.L. Frequency of the VO2max plateau phenomenon in world-class cyclists. Int. J. Sports Med. 2006, 27, 984–992. [Google Scholar] [CrossRef] [PubMed]
- Astorino, T.A.; Robergs, R.A.; Ghiasvand, F.; Marks, D.; Burns, S. Incidence of the oxygen plateau at VO2max during exercise testing to volitional fatigue. J. Exerc. Physiol. 2000, 3, 1–12. [Google Scholar]
- Day, J.R.; Rossiter, H.B.; Coats, E.M.; Skasick, A.; Whipp, B.J. The maximally attainable VO2 during exercise in humans: The peak vs. maximum issue. J. Appl. Physiol. 2003, 95, 1901–1907. [Google Scholar] [CrossRef] [PubMed]
- Midgley, A.W.; McNaughton, L.R.; Polman, R.; Marchant, D. Criteria for determination of maximal oxygen uptake: A brief critique and recommendations for future research. Sports Med. 2007, 37, 1019–1028. [Google Scholar] [CrossRef]
- Costa, V.; Midgley, A.W.; Carroll, S.; Astorino, T.A.; de Paula, T.; Farinatti, P.; Cunha, F.A. Is a verification phase useful for confirming maximal oxygen uptake in apparently healthy adults? A systematic review and meta-analysis. PLoS ONE 2021, 16, e0247057. [Google Scholar] [CrossRef]
- Murias, J.M.; Pogliaghi, S.; Paterson, D.H. Measurement of a True VO2max during a Ramp Incremental Test Is Not Confirmed by a Verification Phase. Front. Physiol. 2018, 9, 143. [Google Scholar] [CrossRef]
- Wagner, J.; Niemeyer, M.; Infanger, D.; Hinrichs, T.; Guerra, C.; Klenk, C.; Königstein, K.; Cajochen, C.; Schmidt-Trucksäss, A.; Knaier, R. Verification-phase tests show low reliability and add little value in determining VO2max in young trained adults. PLoS ONE 2021, 16, e0245306. [Google Scholar] [CrossRef] [PubMed]
- Hebisz, P.; Jastrzębska, A.D.; Hebisz, R. Real Assessment of Maximum Oxygen Uptake as a Verification After an Incremental Test Versus Without a Test. Front. Physiol. 2021, 12, 739745. [Google Scholar] [CrossRef]
- Villanueva, I.R.; Campbell, J.C.; Medina, S.M.; Jorgensen, T.M.; Wilson, S.L.; Angadi, S.S.; Gaesser, G.A.; Dickinson, J.M. Comparison of constant load exercise intensity for verification of maximal oxygen uptake following a graded exercise test in older adults. Physiol. Rep. 2021, 9, e15037. [Google Scholar] [CrossRef]
- Sawyer, B.J.; McMahon, N.; Thornhill, K.L.; Baughman, B.R.; Mahoney, J.M.; Pattison, K.L.; Freeberg, K.A.; Botts, R.T. Supra-Versus Submaximal Cycle Ergometer Verification of VO2max in Males and Females. Sports 2020, 8, 163. [Google Scholar] [CrossRef]
- Possamai, L.T.; Campos, F.S.; Salvador, P.; de Aguiar, R.A.; Guglielmo, L.; de Lucas, R.D.; Caputo, F.; Turnes, T. Similar maximal oxygen uptake assessment from a step cycling incremental test and verification tests on the same or different day. Appl. Physiol. Nutr. Metab. 2020, 45, 357–361. [Google Scholar] [CrossRef] [PubMed]
- Iannetta, D.; de Almeida, A.R.; Ingram, C.P.; Keir, D.A.; Murias, J.M. Evaluating the suitability of supra-POpeak verification trials after ramp-incremental exercise to confirm the attainment of maximum O2 uptake. Am. J. Physiol. Regul. Integr. Comp. Physiol. 2020, 319, R315–R322. [Google Scholar] [CrossRef] [PubMed]
- Rossiter, H.B.; Kowalchuk, J.M.; Whipp, B.J. A test to establish maximum O2 uptake despite no plateau in the O2 uptake response to ramp incremental exercise. J. Appl. Physiol. 2006, 100, 764–770. [Google Scholar] [CrossRef]
- Gordon, D.; Gernigon, M.; Baker, J.; Merzbach, V.; Scruton, A. The Effects of Non-Contingent Feedback on the Incidence of Plateau at V̇O2max. J. Sports Sci. Med. 2017, 16, 105–111. [Google Scholar]
- Gordon, D.; Hopkins, S.; King, C.; Keiller, D.; Barnes, R.J. Incidence of the plateau at VO2max is dependent on the anaerobic capacity. Int. J. Sports Med. 2011, 32, 1–6. [Google Scholar] [CrossRef]
- Gordon, D.; Caddy, O.; Merzbach, V.; Gernigon, M.; Baker, J.; Scruton, A.; Keiller, D.; Barnes, R. Prior Knowledge of Trial Number Influences the Incidence of Plateau at VO2max. J. Sports Sci. Med. 2015, 14, 47–53. [Google Scholar]
- Bertuzzi, R.; Nascimento, E.M.; Urso, R.P.; Damasceno, M.; Lima-Silva, A.E. Energy system contributions during incremental exercise test. J. Sports Sci. Med. 2013, 12, 454–460. [Google Scholar] [PubMed]
- Juel, C. Current aspects of lactate exchange: Lactate/H+ transport in human skeletal muscle. Eur. J. Appl. Physiol. 2001, 86, 12–16. [Google Scholar] [CrossRef]
- Astorino, T.A.; White, A.C. Assessment of anaerobic power to verify VO2max attainment. Clin. Physiol. Funct. Imaging 2010, 30, 294–300. [Google Scholar] [CrossRef]
- Dominelli, P.B.; Archiza, B.; Ramsook, A.H.; Mitchell, R.A.; Peters, C.M.; Molgat-Seon, Y.; Henderson, W.R.; Koehle, M.S.; Boushel, R.; Sheel, A.W. Effects of respiratory muscle work on respiratory and locomotor blood flow during exercise. Exp. Physiol. 2017, l102, 1535–1547. [Google Scholar] [CrossRef]
- Oueslati, F.; Berriri, A.; Boone, J.; Ahmaidi, S. Respiratory muscle strength is decreased after maximal incremental exercise in trained runners and cyclists. Respir. Physiol. Neurobiol. 2018, 248, 25–30. [Google Scholar] [CrossRef] [PubMed]
- Faul, F.; Erdfelder, E.; Lang, A.G.; Buchner, A. G*Power 3: A flexible statistical power analysis program for the social, behavioral, and biomedical sciences. Behav. Res. Methods 2007, 39, 175–191. [Google Scholar] [CrossRef]
- Cohen, J. Statistical Power Analysis for the Behavioral Sciences, 2nd ed.; LEA: Hillsdale, NJ, USA, 2008. [Google Scholar]
- Fukuda, D.H.; Wray, M.E.; Kendall, K.L.; Smith-Ryan, A.E.; Stout, J.R. Validity of near-infrared interactance (FUTREX 6100/XL) for estimating body fat percentage in elite rowers. Clin. Physiol. Funct. Imaging 2017, 37, 456–458. [Google Scholar] [CrossRef]
- Szczepan, S.; Danek, N.; Michalik, K.; Wróblewska, Z.; Zatoń, K. Influence of a Six-Week Swimming Training with Added Respiratory Dead Space on Respiratory Muscle Strength and Pulmonary Function in Recreational Swimmers. Int. J. Environ. Res. Public Health 2020, 8, 5743. [Google Scholar] [CrossRef]
- Bar-Or, O. The Wingate anaerobic test. An update on methodology, reliability and validity. Sports Med. 1987, 4, 381–394. [Google Scholar] [CrossRef] [PubMed]
- Jackson, C.E. Nomogram for simple calculation of cardiac output. Circulation 1955, 11, 635–636. [Google Scholar] [CrossRef]
- Stringer, W.W.; Hansen, J.E.; Wasserman, K. Cardiac output estimated noninvasively from oxygen uptake during exercise. J. Appl. Physiol. 1997, 82, 908–912. [Google Scholar] [CrossRef]
- Hebisz, P.; Hebisz, R.; Zatoń, M.; Ochmann, B.; Mielnik, N. Concomitant application of sprint and high-intensity interval training on maximal oxygen uptake and work output in well-trained cyclists. Eur. J. Appl. Physiol. 2016, 116, 1495–1502. [Google Scholar] [CrossRef] [PubMed]
- Dimitriadis, Z.; Kapreli, E.; Konstantinidou, I.; Oldham, J.; Strimpakos, N. Test/retest reliability of maximum mouth pressure measurements with the MicroRPM in healthy volunteers. Respir. Care 2011, 56, 776–782. [Google Scholar] [CrossRef]
- Borg, G.A. Psychophysical bases of perceived exertion. Med. Sci. Sports Exerc. 1982, 14, 377–381. [Google Scholar] [CrossRef]
- Richardson, J.T. Eta squared and partial eta squared as measures of effect size in educational research. Rev. Educ. Res. 2011, 6, 135–147. [Google Scholar] [CrossRef]
- Noakes, T.D. Maximal oxygen uptake as a parametric measure of cardiorespiratory capacity: Comment. Med. Sci. Sports Exerc. 2008, 40, 585–586. [Google Scholar] [CrossRef]
- Midgley, A.W.; McNaughton, L.R.; Carroll, S. Verification phase as a useful tool in the determination of the maximal oxygen uptake of distance runners. Appl. Physiol. Nutr. Metab. 2006, 31, 541–548. [Google Scholar] [CrossRef]
- Niemeyer, M.; Leithaeuser, R.; Beneke, R. Oxygen uptake plateau occurrence depends on oxygen kinetics and oxygen deficit accumulation. Scand. J. Med. Sci. Sports 2019, 29, 1466–1472. [Google Scholar] [CrossRef]
- Niemeyer, M.; Bergmann, T.G.J.; Beneke, R. Oxygen uptake plateau: Calculation artifact or physiological reality? Eur. J. Appl. Physiol. 2020, 120, 231–242. [Google Scholar] [CrossRef]
- Murias, J.M.; Kowalchuk, J.M.; Paterson, D.H. Time course and mechanisms of adaptations in cardiorespiratory fitness with endurance training in older and young men. J. Appl. Physiol. 2010, 108, 621–627. [Google Scholar] [CrossRef]
- Dogra, S.; Spencer, M.D.; Paterson, D.H. Higher Cardiorespiratory Fitness in Older Trained Women is Due to Preserved Stroke Volume. J. Sports Sci. Med. 2012, 11, 745–750. [Google Scholar]
- Scharhag-Rosenberger, F.; Carlsohn, A.; Cassel, M.; Mayer, F.; Scharhag, J. How to test maximal oxygen uptake: A study on timing and testing procedure of a supramaximal verification test. Appl. Physiol. Nutr. Metab. 2011, 36, 153–160. [Google Scholar] [CrossRef]
- Costa, V.A.B.; Midgley, A.W.; Baumgart, J.K.; Carroll, S.; Astorino, T.A.; Schaun, G.Z.; Fonseca, G.F.; Cunha, F.A. Confirming the attainment of maximal oxygen uptake within special and clinical groups: A systematic review and meta-analysis of cardiopulmonary exercise test and verification phase protocols. PLoS ONE 2024, 19, e0299563. [Google Scholar] [CrossRef]
- Hill, D.W.; Poole, D.C.; Smith, J.C. The relationship between power and the time to achieve VO2(max). Med. Sci. Sports Exerc. 2002, 34, 709–714. [Google Scholar] [CrossRef]
- Poole, D.C.; Jones, A.M. Oxygen uptake kinetics. Compr. Physiol. 2012, 2, 933–996. [Google Scholar] [CrossRef]
- Midgley, A.W.; Bentley, D.J.; Luttikholt, H.; McNaughton, L.R.; Millet, G.P. Challenging a dogma of exercise physiology: Does an incremental exercise test for valid VO2 max determination really need to last between 8 and 12 minutes? Sports Med. 2008, 38, 441–447. [Google Scholar] [CrossRef]
- Michalik, K.; Korta, K.; Danek, N.; Smolarek, M.; Zatoń, M. Influence of Intensity RAMP Incremental Test on Peak Power, Post-Exercise Blood Lactate, and Heart Rate Recovery in Males: Cross-Over Study. Int. J. Environ. Res. Public Health 2019, 16, 3934. [Google Scholar] [CrossRef]
- Boudet, G.; Albuisson, E.; Bedu, M.; Chamoux, A. Heart rate running speed relationships during exhaustive bouts in the laboratory. Can. J Appl. Physiol. 2004, 29, 731–742. [Google Scholar] [CrossRef]
- Midgley, A.W.; Carroll, S.; Marchant, D.; McNaughton, L.R.; Siegler, J. Evaluation of true maximal oxygen uptake based on a novel set of standardised criteria. Appl. Physiol. Nutr. Metab. 2009, 34, 115–123. [Google Scholar] [CrossRef]
- Wan, J.J.; Qin, Z.; Wang, P.Y.; Sun, Y.; Liu, X. Muscle fatigue: General understanding and treatment. Exp. Mol. Med. 2017, 49, e384. [Google Scholar] [CrossRef]
- Arad, A.D.; Bishop, K.; Adimoolam, D.; Albu, J.B.; DiMenna, F.J. Severe-intensity constant-work-rate cycling indicates that ramp incremental cycling underestimates VO2max in a heterogeneous cohort of sedentary individuals. PLoS ONE 2020, 15, e0235567. [Google Scholar] [CrossRef]
- Noakes, T.D. Testing for maximal oxygen consumption has produced a brainless model of human exercise performance. Br. J. Sports Med. 2008, 42, 551–555. [Google Scholar] [CrossRef]
- Oueslati, F.; Boone, J.; Tabka, Z.; Ahmaidi, S. Respiratory and locomotor muscle implications on the VO2 slow component and the VO2 excess in young trained cyclists. Respir. Physiol. Neurobiol. 2017, 239, 1–9. [Google Scholar] [CrossRef]
- Smith, J.R.; Ade, C.J.; Broxterman, R.M.; Skutnik, B.C.; Barstow, T.J.; Wong, B.J.; Harms, C.A. Influence of exercise intensity on respiratory muscle fatigue and brachial artery blood flow during cycling exercise. Eur. J. Appl. Physiol. 2014, 114, 1767–1777. [Google Scholar] [CrossRef]
- Tanner, D.A.; Duke, J.W.; Stager, J.M. Ventilatory patterns differ between maximal running and cycling. Respir. Physiol. Neurobiol. 2014, 191, 9–16. [Google Scholar] [CrossRef]
- Michalik, K.; Smolarek, M.; Ochmann, B.; Zatoń, M. Determination of optimal load in the Wingate Anaerobic Test is not depend on number of sprints included in mathematical models. Front. Physiol. 2023, 14, 1146076. [Google Scholar] [CrossRef]

Disclaimer/Publisher’s Note: The statements, opinions and data contained in all publications are solely those of the individual author(s) and contributor(s) and not of MDPI and/or the editor(s). MDPI and/or the editor(s) disclaim responsibility for any injury to people or property resulting from any ideas, methods, instructions or products referred to in the content. |
© 2024 by the authors. Licensee MDPI, Basel, Switzerland. This article is an open access article distributed under the terms and conditions of the Creative Commons Attribution (CC BY) license (https://creativecommons.org/licenses/by/4.0/).