
Navigating the Landscape of Cardiovascular Risk Scores: A Comparative Analysis of Eight Risk Prediction Models in a High-Risk Cohort in Lithuania

 ,
,  ,
,
Abstract
:1. Introduction
2. Materials and Methods
2.1. Study Population/Inclusion and Exclusion Criteria
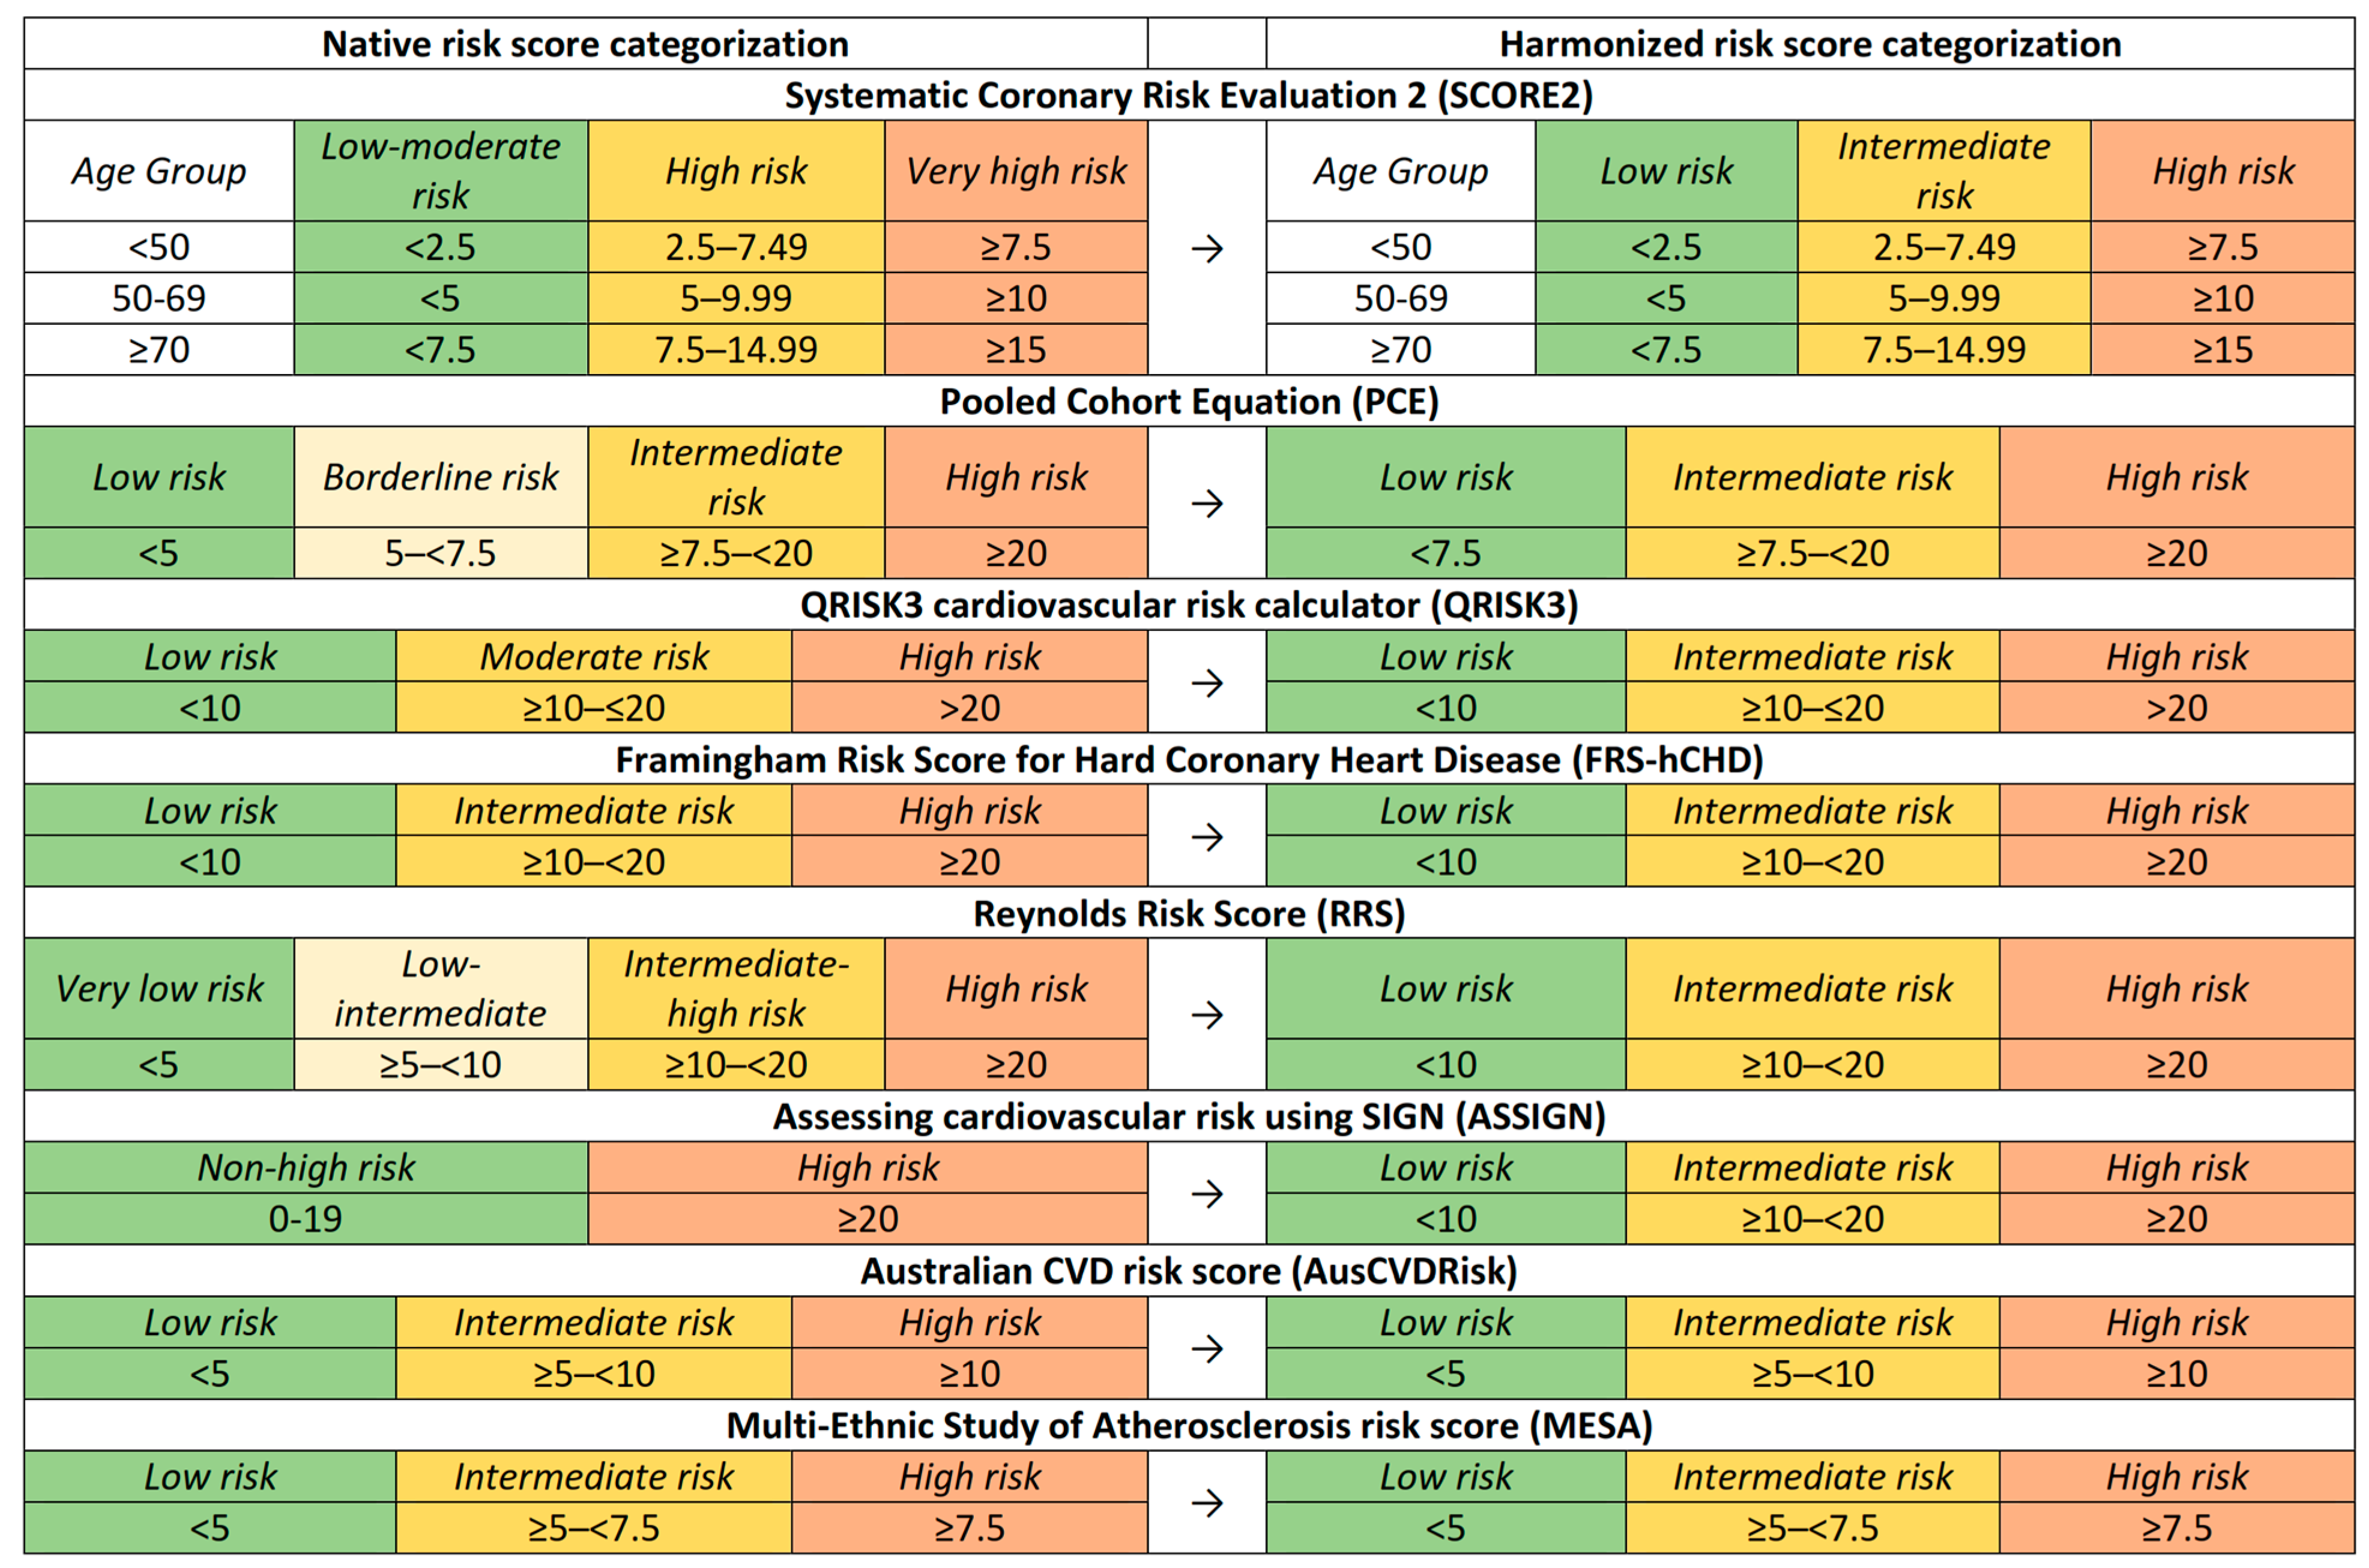
2.2. Risk Prediction Models
2.2.1. Systematic Coronary Risk Evaluation 2 (SCORE2)
2.2.2. Pooled Cohort Equations (PCE) Cardiovascular Risk Calculator
2.2.3. QRISK3 Risk Calculator (QRISK3)
2.2.4. Framingham Risk Score for Hard Coronary Heart Disease (FRS-hCHD)
2.2.5. Reynolds Risk Score (RRS)
2.2.6. Assessing Cardiovascular Risk Using SIGN (ASSIGN)
2.2.7. Australian CVD Risk Score (AusCVDRisk)
2.2.8. Multi-Ethnic Study of Atherosclerosis (MESA) Risk Score
2.3. Variable Definitions
2.4. Statistical Analysis
2.5. Ethical Considerations
3. Results
3.1. Descriptive Statistics
3.2. Risk Category Distribution
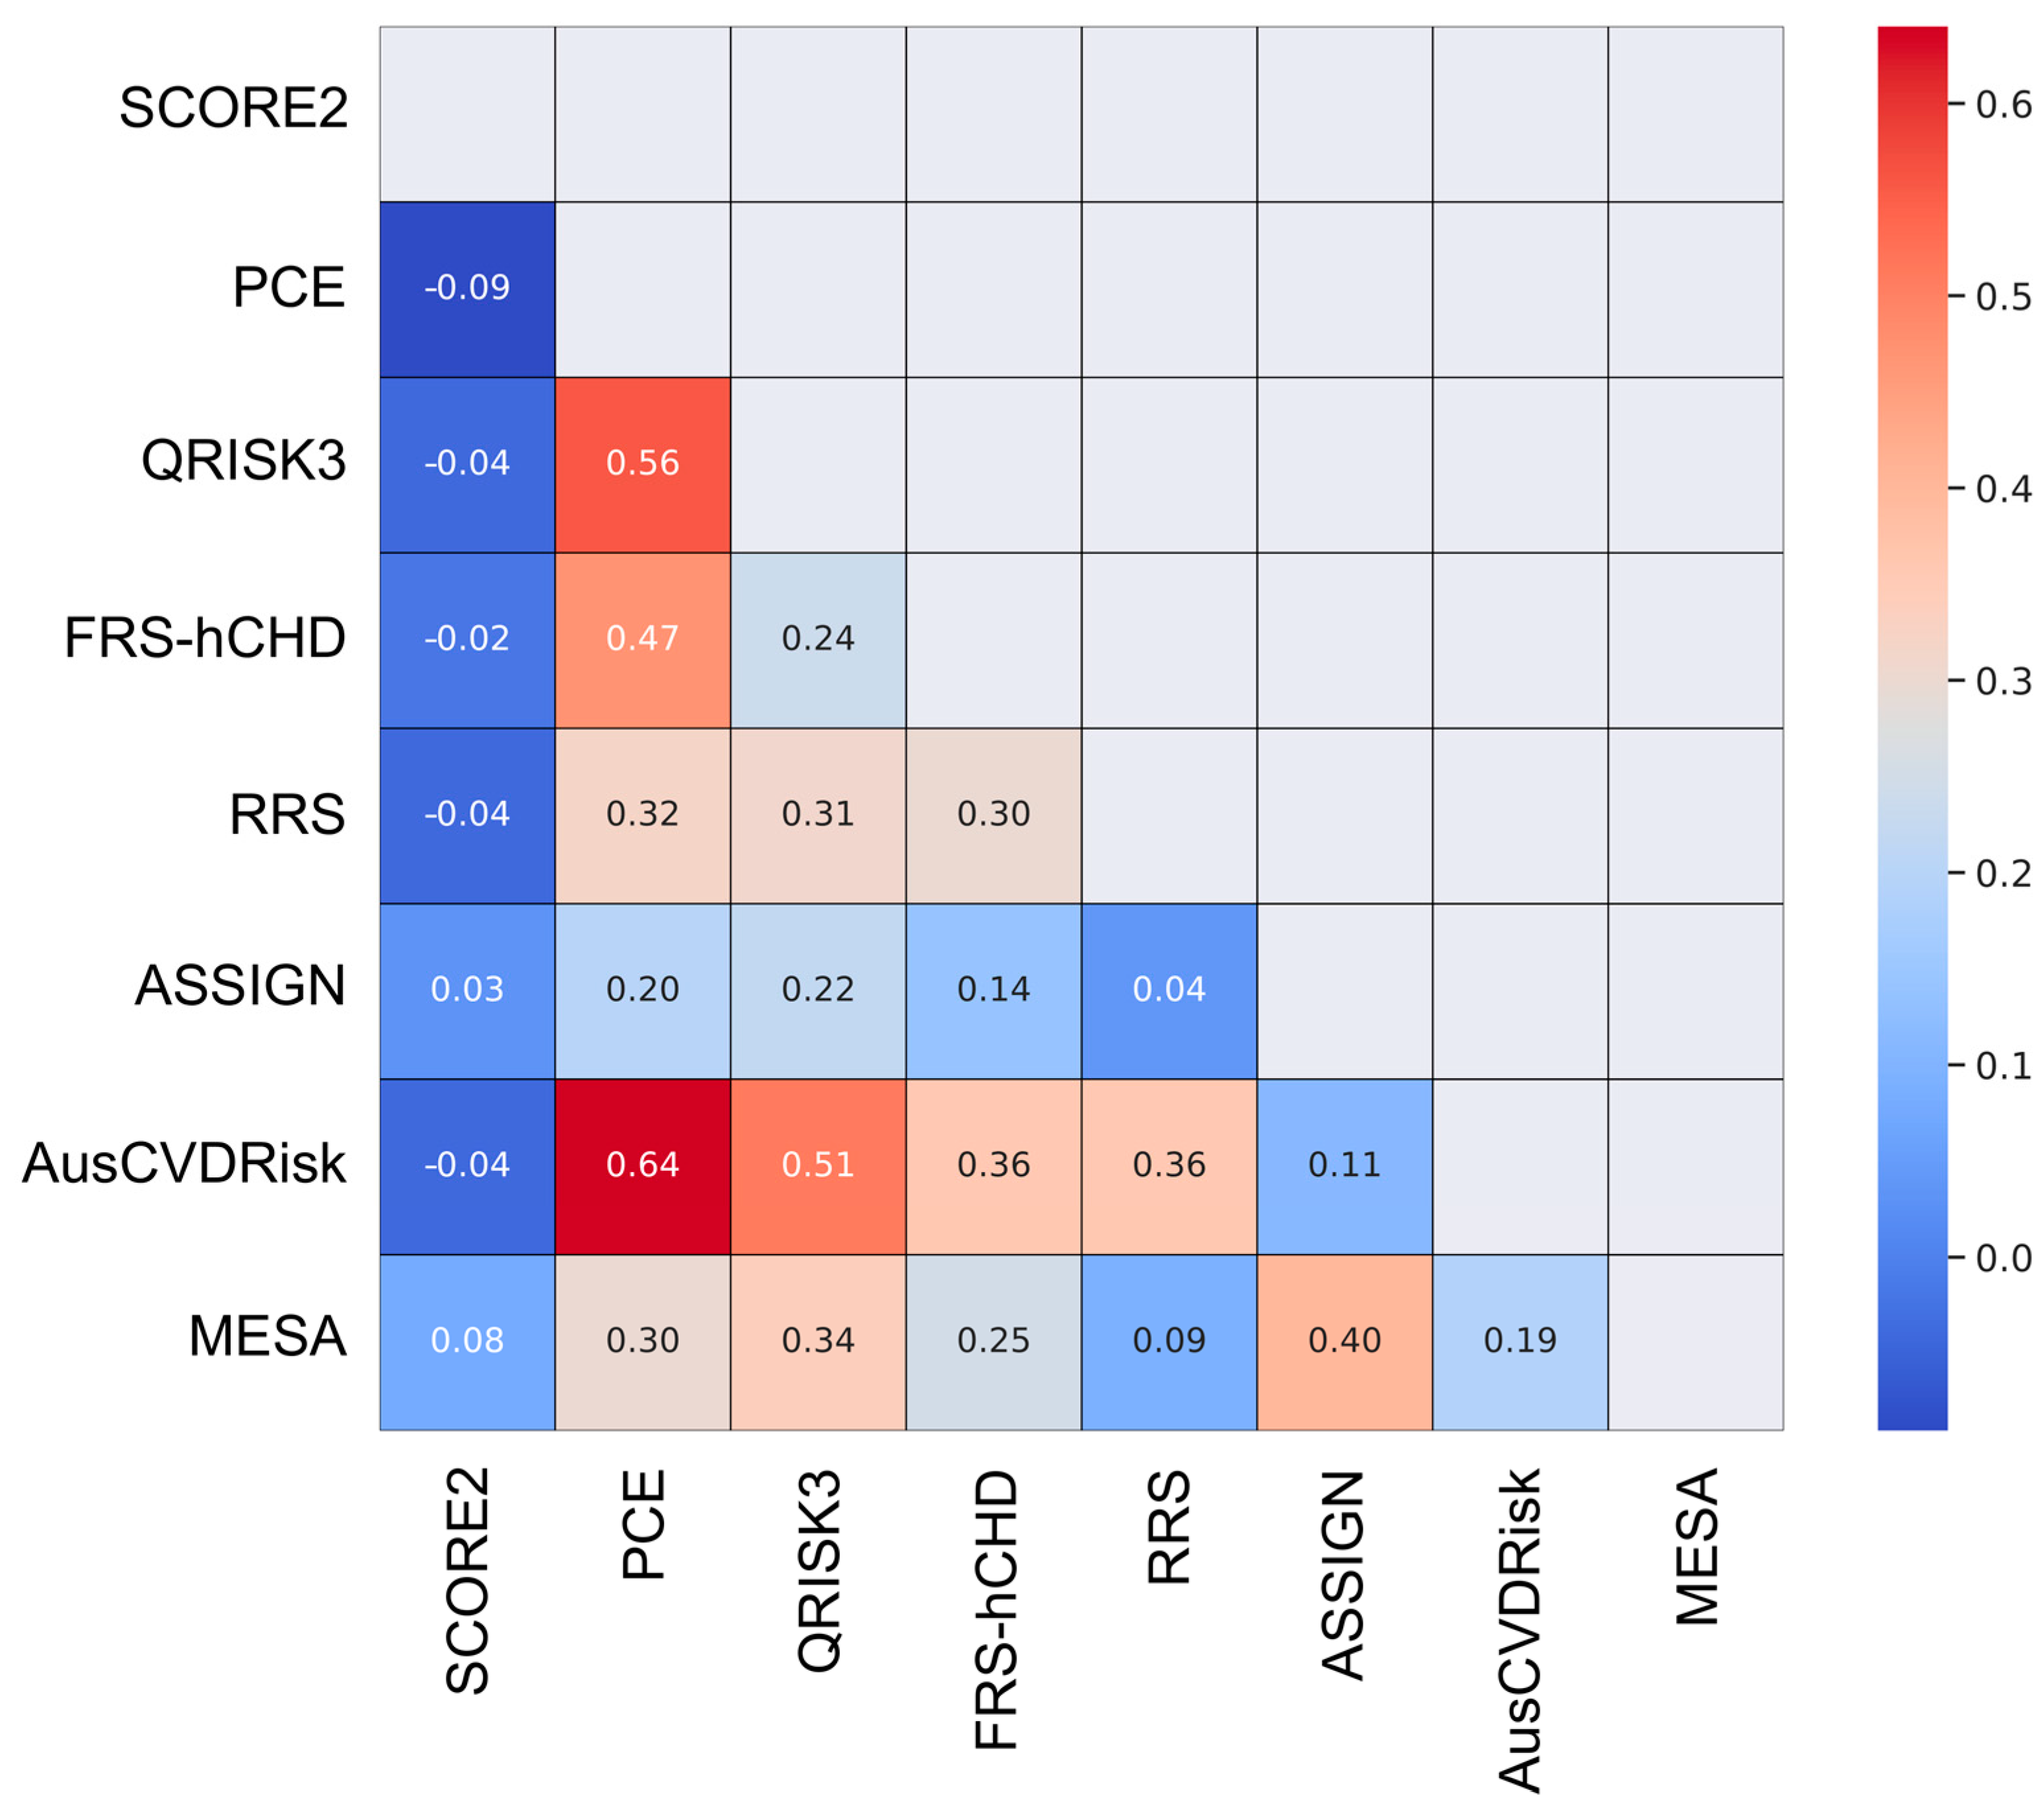
3.3. Pairwise Agreement Analysis
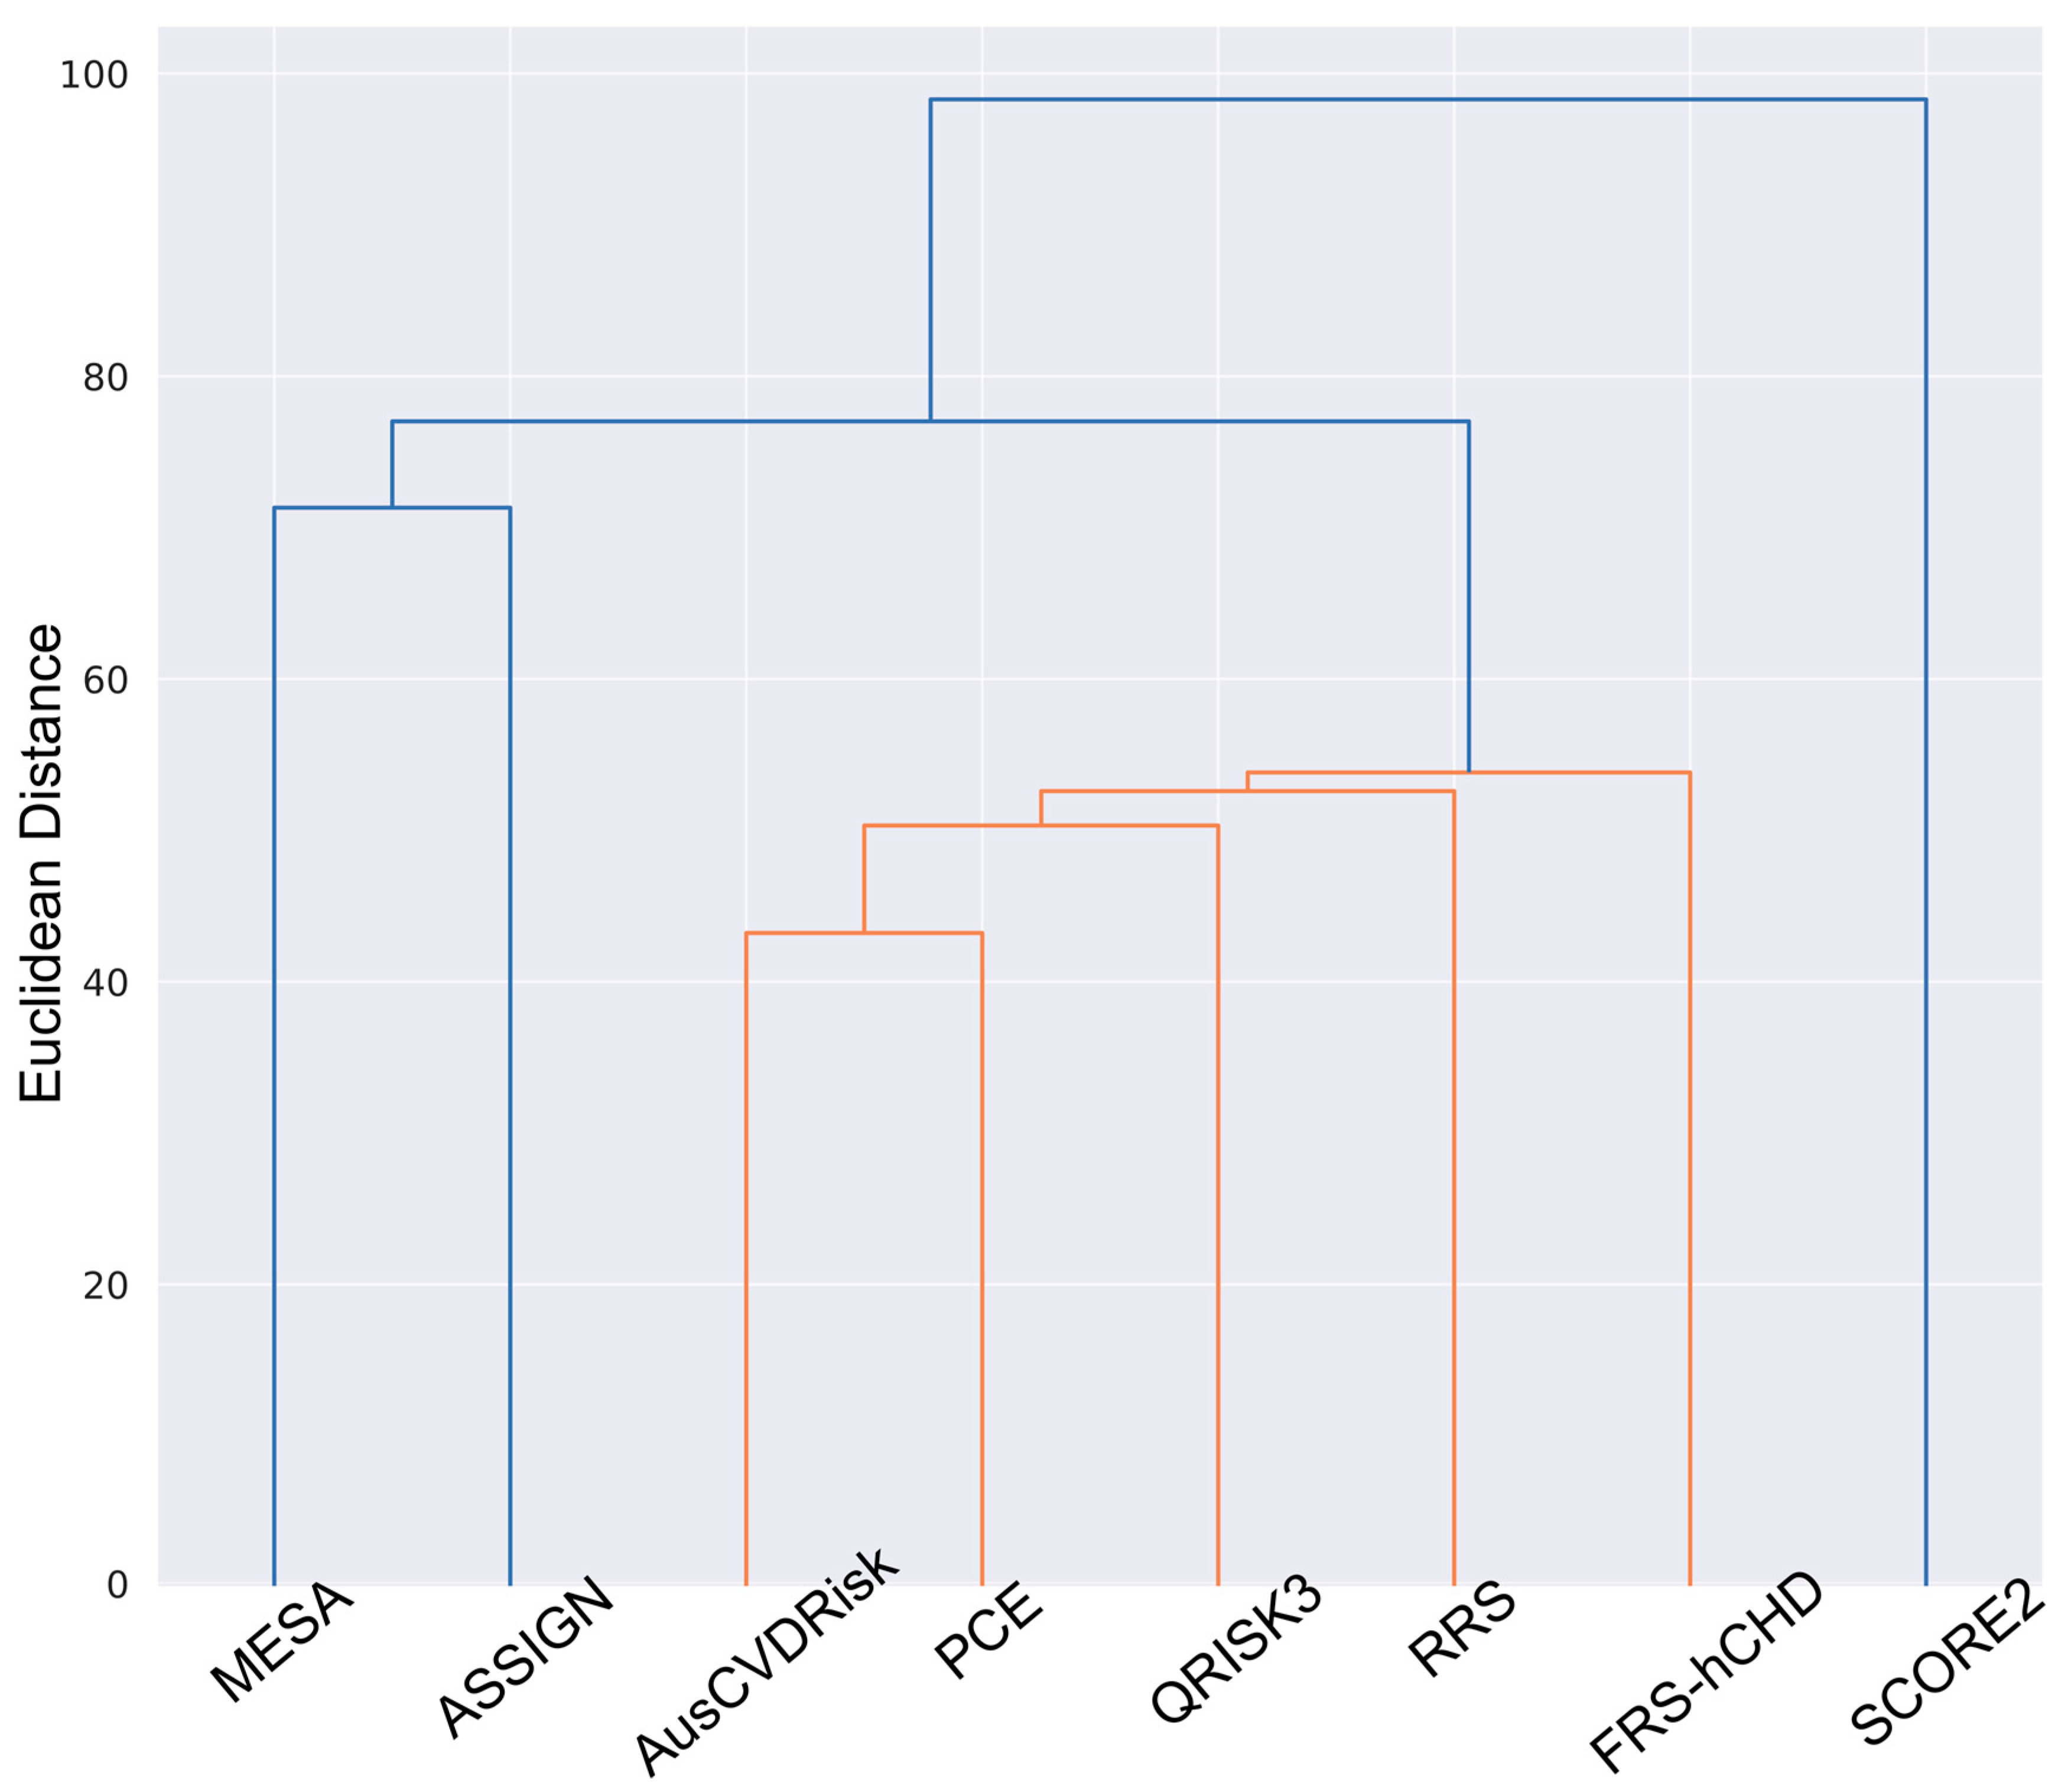
3.4. Cluster Analysis: Hierarchical Clustering
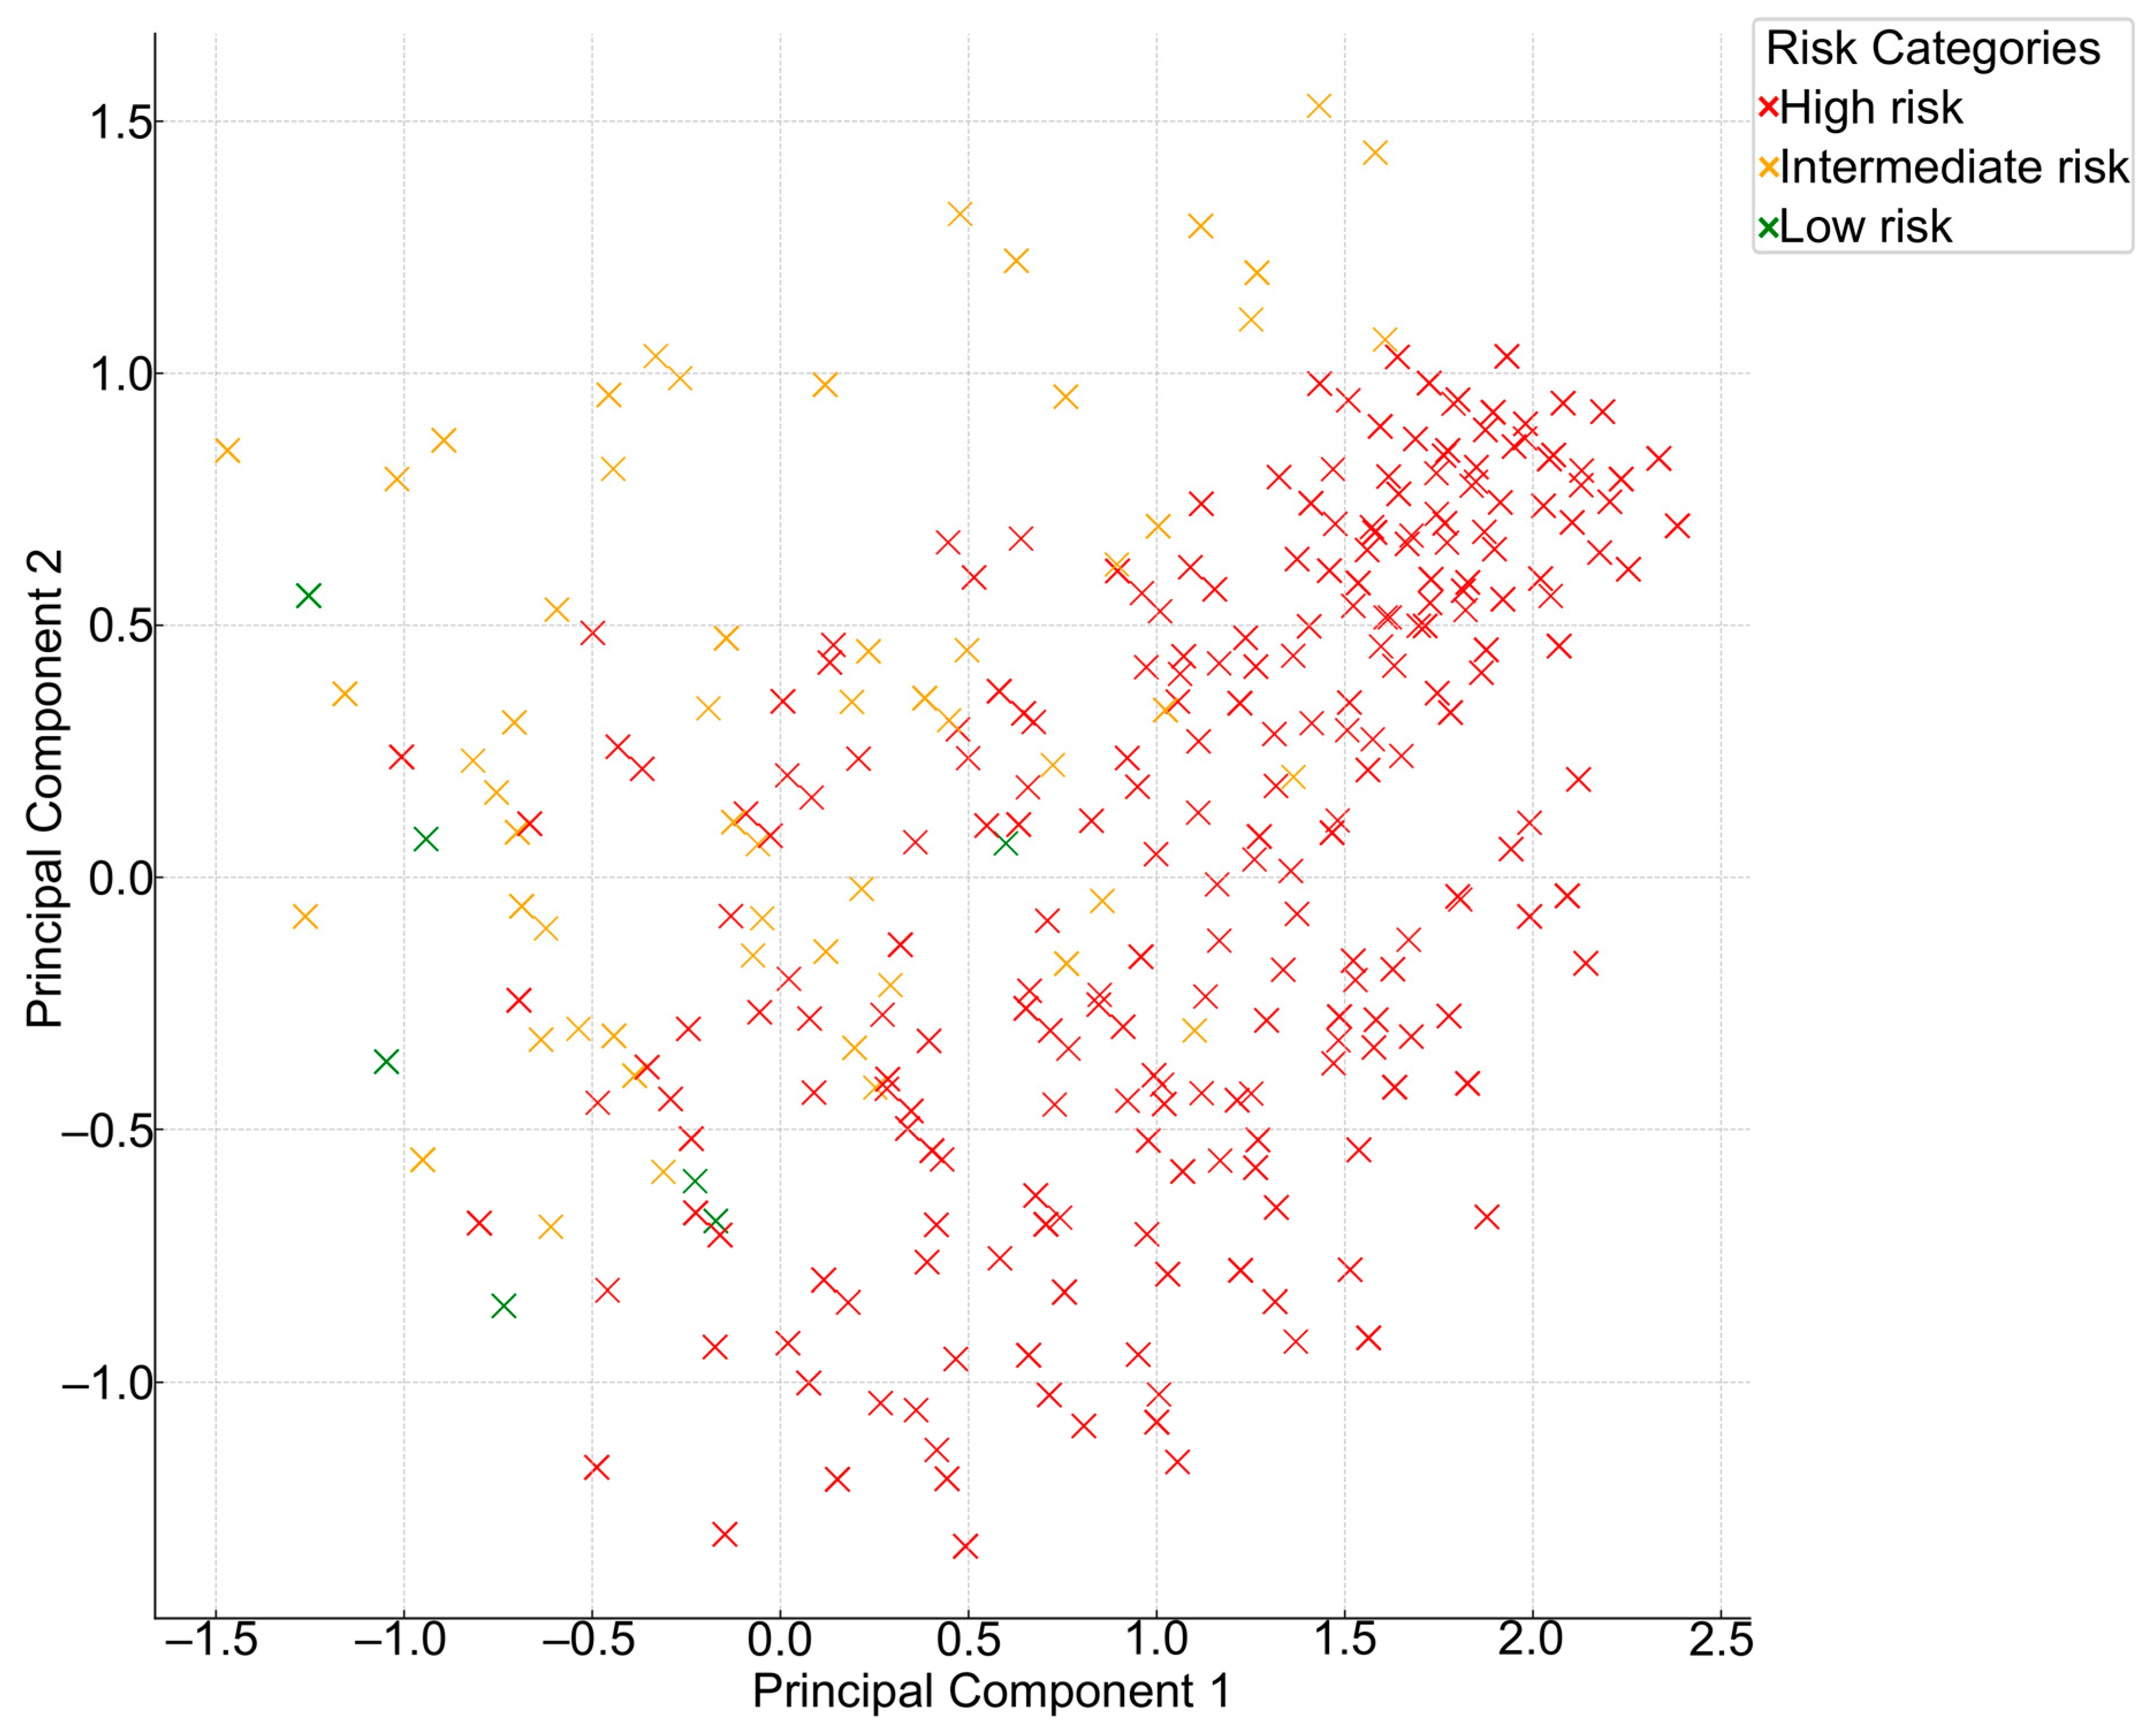
3.5. Principal Component Analysis (PCA)
3.6. Collective Model Agreement Analysis
4. Discussion
Study Strengths and Limitations
5. Conclusions
Author Contributions
Funding
Institutional Review Board Statement
Informed Consent Statement
Data Availability Statement
Acknowledgments
Conflicts of Interest
References
- World Health Organization. Cardiovascular Diseases (CVDs). 2022. Available online: https://www.who.int/news-room/fact-sheets/detail/cardiovascular-diseases-(cvds) (accessed on 1 September 2023).
- Tokgozoglu, L.; Torp-Pedersen, C. Redefining cardiovascular risk prediction: Is the crystal ball clearer now? Eur. Heart J. 2021, 42, 2468–2471. [Google Scholar] [CrossRef]
- Visseren, F.L.J.; Mach, F.; Smulders, Y.M.; Carballo, D.; Koskinas, K.C.; Bäck, M.; Benetos, A.; Biffi, A.; Boavida, J.-M.; Capodanno, D.; et al. 2021 ESC Guidelines on cardiovascular disease prevention in clinical practice: Developed by the Task Force for cardiovascular disease prevention in clinical practice with representatives of the European Society of Cardiology and 12 medical societies With the special contribution of the European Association of Preventive Cardiology (EAPC). Eur. Heart J. 2021, 42, 3227–3337. [Google Scholar] [CrossRef] [PubMed]
- Arnett, D.K.; Blumenthal, R.S.; Albert, M.A.; Buroker, A.B.; Goldberger, Z.D.; Hahn, E.J.; Himmelfarb, C.D.; Khera, A.; Lloyd-Jones, D.; McEvoy, J.W.; et al. 2019 ACC/AHA Guideline on the Primary Prevention of Cardiovascular Disease: A Report of the American College of Cardiology/American Heart Association Task Force on Clinical Practice Guidelines. Circulation 2019, 140, e596–e646. [Google Scholar] [CrossRef] [PubMed]
- Liew, S.M.; Lee, W.K.; Khoo, E.M.; Ismail, I.Z.; Ambigapathy, S.; Omar, M.; Suleiman, S.Z.; Saaban, J.; Zaidi, N.F.M.; Yusoff, H. Can doctors and patients correctly estimate cardiovascular risk? A cross-sectional study in primary care. BMJ Open 2018, 8, e017711. [Google Scholar] [CrossRef]
- Sofogianni, A.; Stalikas, N.; Antza, C.; Tziomalos, K. Cardiovascular Risk Prediction Models and Scores in the Era of Personalized Medicine. J. Pers. Med. 2022, 12, 1180. [Google Scholar] [CrossRef] [PubMed]
- Laucevičius, A.; Kasiulevičius, V.; Jatužis, D.; Petrulionienė, Ž.; Ryliškytė, L.; Rinkūnienė, E.; Badarienė, J.; Ypienė, A.; Gustienė, O.; Šlapikas, R. Lithuanian High Cardiovascular Risk (LitHiR) primary prevention programme—Rationale and design. Semin. Cardiovasc. Med. 2012, 18, 1–6. [Google Scholar] [CrossRef]
- Third Report of the National Cholesterol Education Program (NCEP) Expert Panel on Detection, Evaluation, and Treatment of High Blood Cholesterol in Adults (Adult Treatment Panel III) final report. Circulation 2002, 106, 3143–3421. [CrossRef]
- SCORE2 Working Group; ESC Cardiovascular Risk Collaboration. SCORE2 risk prediction algorithms: New models to estimate 10-year risk of cardiovascular disease in Europe. Eur. Heart J. 2021, 42, 2439–2454. [Google Scholar] [CrossRef]
- Grundy, S.M.; Stone, N.J.; Bailey, A.L.; Beam, C.; Birtcher, K.K.; Blumenthal, R.S.; Braun, L.T.; de Ferranti, S.; Faiella-Tommasino, J.; Forman, D.E.; et al. 2018 AHA/ACC/AACVPR/AAPA/ABC/ACPM/ADA/AGS/APhA/ASPC/NLA/PCNA Guideline on the Management of Blood Cholesterol: A Report of the American College of Cardiology/American Heart Association Task Force on Clinical Practice Guidelines. Circulation 2019, 139, e1082–e1143. [Google Scholar] [CrossRef]
- Hippisley-Cox, J.; Coupland, C.; Brindle, P. Development and validation of QRISK3 risk prediction algorithms to estimate future risk of cardiovascular disease: Prospective cohort study. BMJ (Clin. Res. Ed.) 2017, 357, j2099. [Google Scholar] [CrossRef]
- Ridker, P.M.; Buring, J.E.; Rifai, N.; Cook, N.R. Development and validation of improved algorithms for the assessment of global cardiovascular risk in women: The Reynolds Risk Score. JAMA 2007, 297, 611–619. [Google Scholar] [CrossRef]
- Woodward, M.; Brindle, P.; Tunstall-Pedoe, H. Adding social deprivation and family history to cardiovascular risk assessment: The ASSIGN score from the Scottish Heart Health Extended Cohort (SHHEC). Heart 2007, 93, 172–176. [Google Scholar] [CrossRef] [PubMed]
- Pylypchuk, R.; Wells, S.; Kerr, A.; Poppe, K.; Riddell, T.; Harwood, M.; Exeter, D.; Mehta, S.; Grey, C.; Wu, B.P.; et al. Cardiovascular disease risk prediction equations in 400,000 primary care patients in New Zealand: A derivation and validation study. Lancet 2018, 391, 1897–1907. [Google Scholar] [CrossRef] [PubMed]
- McClelland, R.L.; Jorgensen, N.W.; Budoff, M.; Blaha, M.J.; Post, W.S.; Kronmal, R.A.; Bild, D.E.; Shea, S.; Liu, K.; Watson, K.E.; et al. 10-Year Coronary Heart Disease Risk Prediction Using Coronary Artery Calcium and Traditional Risk Factors. J. Am. Coll. Cardiol. 2015, 66, 1643–1653. [Google Scholar] [CrossRef] [PubMed]
- Siontis, G.C.; Tzoulaki, I.; Siontis, K.C.; Ioannidis, J.P. Comparisons of established risk prediction models for cardiovascular disease: Systematic review. BMJ (Clin. Res. Ed.) 2012, 344, e3318. [Google Scholar] [CrossRef] [PubMed]
- Damen, J.A.; Hooft, L.; Schuit, E.; Debray, T.P.; Collins, G.S.; Tzoulaki, I.; Lassale, C.M.; Siontis, G.C.; Chiocchia, V.; Roberts, C.; et al. Prediction models for cardiovascular disease risk in the general population: Systematic review. BMJ (Clin. Res. Ed.) 2016, 353, i2416. [Google Scholar] [CrossRef]
- Allan, G.M.; Garrison, S.; McCormack, J. Comparison of cardiovascular disease risk calculators. Curr. Opin. Lipidol. 2014, 25, 254–265. [Google Scholar] [CrossRef] [PubMed]
- DeFilippis, A.P.; Young, R.; Carrubba, C.J.; McEvoy, J.W.; Budoff, M.J.; Blumenthal, R.S.; Kronmal, R.A.; McClelland, R.L.; Nasir, K.; Blaha, M.J. An analysis of calibration and discrimination among multiple cardiovascular risk scores in a modern multiethnic cohort. Ann. Intern. Med. 2015, 162, 266–275. [Google Scholar] [CrossRef]
- Muntner, P.; Colantonio, L.D.; Cushman, M.; Goff, D.C., Jr.; Howard, G.; Howard, V.J.; Kissela, B.; Levitan, E.B.; Lloyd-Jones, D.M.; Safford, M.M. Validation of the atherosclerotic cardiovascular disease Pooled Cohort risk equations. JAMA 2014, 311, 1406–1415. [Google Scholar] [CrossRef]
- Colantonio, L.D.; Richman, J.S.; Carson, A.P.; Lloyd-Jones, D.M.; Howard, G.; Deng, L.; Howard, V.J.; Safford, M.M.; Muntner, P.; Goff, D.C., Jr. Performance of the Atherosclerotic Cardiovascular Disease Pooled Cohort Risk Equations by Social Deprivation Status. J. Am. Heart Assoc. 2017, 6, e005676. [Google Scholar] [CrossRef]
- Feinstein, M.J.; Nance, R.M.; Drozd, D.R.; Ning, H.; Delaney, J.A.; Heckbert, S.R.; Budoff, M.J.; Mathews, W.C.; Kitahata, M.M.; Saag, M.S.; et al. Assessing and Refining Myocardial Infarction Risk Estimation Among Patients with Human Immunodeficiency Virus: A Study by the Centers for AIDS Research Network of Integrated Clinical Systems. JAMA Cardiol. 2017, 2, 155–162. [Google Scholar] [CrossRef] [PubMed]
- Ungprasert, P.; Matteson, E.L.; Crowson, C.S. Reliability of Cardiovascular Risk Calculators to Estimate Accurately the Risk of Cardiovascular Disease in Patients with Sarcoidosis. Am. J. Cardiol. 2017, 120, 868–873. [Google Scholar] [CrossRef] [PubMed]
- Mortensen, M.B.; Tybjærg-Hansen, A.; Nordestgaard, B.G. Statin Eligibility for Primary Prevention of Cardiovascular Disease According to 2021 European Prevention Guidelines Compared with Other International Guidelines. JAMA Cardiol. 2022, 7, 836–843. [Google Scholar] [CrossRef] [PubMed]


| Characteristics | |
|---|---|
| Gender—n (%) | Female 6527 (58.4) |
| Age, years—mean (SD) | 53.49 (6.47) |
| Body mass index, kg/m2—mean (SD) | 31.57 (4.46) |
| Total cholesterol, mmol/L—mean (SD) | 6.17 (1.37) |
| LDL cholesterol, mmol/L—mean (SD) | 3.98 (1.21) |
| HDL cholesterol, mmol/L—mean (SD) | 1.23 (0.31) |
| Triglycerides, mmol/L—mean (SD) | 2.11 (1.5) |
| Fasting glucose, mmol/L—mean (SD) | 6.31 (1.49) |
| Creatinine, µmol/L—mean (SD) | 71.69 (12.79) |
| Systolic blood pressure, mmHg—mean (SD) | 137.16 (15.41) |
| Diastolic blood pressure, mmHg—mean (SD) | 82.99 (10.69) |
| Diabetes mellitus—n (%) | 2063 (18.5) |
| Hypertension treatment—n (%) | 2939 (26.3) |
| Dyslipidemia treatment (statins)—n (%) | 1248 (11.2) |
| Antiplatelet treatment—n (%) | 30 (0.3) |
| Current smoker—n (%) | 2305 (20.6) |
| Ex-smoker—n (%) | 686 (6.1) |
| Number of Models Agreeing | Number of Patients | Percentage of Patients (%) |
|---|---|---|
| 3 | 974 | 8.72 |
| 4 | 2671 | 23.90 |
| 5 | 2157 | 19.30 |
| 6 | 2594 | 23.21 |
| 7 | 2611 | 23.37 |
| 8 | 167 | 1.49 |
Disclaimer/Publisher’s Note: The statements, opinions and data contained in all publications are solely those of the individual author(s) and contributor(s) and not of MDPI and/or the editor(s). MDPI and/or the editor(s) disclaim responsibility for any injury to people or property resulting from any ideas, methods, instructions or products referred to in the content. |
© 2024 by the authors. Licensee MDPI, Basel, Switzerland. This article is an open access article distributed under the terms and conditions of the Creative Commons Attribution (CC BY) license (https://creativecommons.org/licenses/by/4.0/).
Share and Cite
Navickas, P.; Lukavičiūtė, L.; Glaveckaitė, S.; Baranauskas, A.; Šatrauskienė, A.; Badarienė, J.; Laucevičius, A. Navigating the Landscape of Cardiovascular Risk Scores: A Comparative Analysis of Eight Risk Prediction Models in a High-Risk Cohort in Lithuania. J. Clin. Med. 2024, 13, 1806. https://doi.org/10.3390/jcm13061806
Navickas P, Lukavičiūtė L, Glaveckaitė S, Baranauskas A, Šatrauskienė A, Badarienė J, Laucevičius A. Navigating the Landscape of Cardiovascular Risk Scores: A Comparative Analysis of Eight Risk Prediction Models in a High-Risk Cohort in Lithuania. Journal of Clinical Medicine. 2024; 13(6):1806. https://doi.org/10.3390/jcm13061806
Chicago/Turabian StyleNavickas, Petras, Laura Lukavičiūtė, Sigita Glaveckaitė, Arvydas Baranauskas, Agnė Šatrauskienė, Jolita Badarienė, and Aleksandras Laucevičius. 2024. "Navigating the Landscape of Cardiovascular Risk Scores: A Comparative Analysis of Eight Risk Prediction Models in a High-Risk Cohort in Lithuania" Journal of Clinical Medicine 13, no. 6: 1806. https://doi.org/10.3390/jcm13061806
APA StyleNavickas, P., Lukavičiūtė, L., Glaveckaitė, S., Baranauskas, A., Šatrauskienė, A., Badarienė, J., & Laucevičius, A. (2024). Navigating the Landscape of Cardiovascular Risk Scores: A Comparative Analysis of Eight Risk Prediction Models in a High-Risk Cohort in Lithuania. Journal of Clinical Medicine, 13(6), 1806. https://doi.org/10.3390/jcm13061806