

Complete Blood Count-Derived Inflammation Indexes Are Useful in Predicting Metabolic Syndrome in Children and Adolescents with Severe Obesity


Abstract
1. Introduction
2. Material and Methods
2.1. Patients
- abdominal obesity (waist circumference ≥ 90th percentile);
- triglycerides: ≥150 mg/dL (1.7 mmol/L) or specific treatment for lipid abnormalities;
- HDL-C (High Density Lipoprotein): <40 mg/dL (1.03 mmol/L);
- blood pressure: SBP (systolic blood pressure) ≥ 130 mmHg or DBP (diastolic blood pressure) ≥ 85 mmHg and/or treatment for previously diagnosed hypertension;
- fasting plasma glucose (FPG) concentration ≥ 100 mg/dL (5.6 mmol/L) or previously diagnosed type 2 diabetes mellitus.
- abdominal obesity (waist circumference ≥ 94 cm for males; ≥80 cm for females);
- triglycerides: ≥150 mg/dL (1.7 mmol/L) or specific treatment for this lipid abnormality;
- HDL-C: <40 mg/dL (1.03 mmol/L) for males and <50 mg/dL (<1.29 mmol/L) for females, or specific treatment for lipid abnormalities;
- blood pressure: SBP (systolic blood pressure) ≥ 130 mmHg or DBP (diastolic blood pressure) ≥ 85 mmHg and/or treatment for previously diagnosed hypertension;
- fasting plasma glucose (FPG) concentration ≥ 100 mg/dL (5.6 mmol/L) or previously diagnosed type 2 diabetes mellitus.
2.2. Anthropometric Measurements
2.3. Laboratory Analyses and Metabolic Variables
- -
- Neutrophil/HDL-C ratio (NHR) = neutrophil count (109/L)/HDL-C (mg/dL);
- -
- Monocyte/HDL-C ratio (MHR) = monocyte count (109/L)/HDL-C (mg/dL);
- -
- Lymphocyte/HDL-C ratio (LHR) = lymphocyte count (109/L)/HDL-C (mg/dL);
- -
- Systemic Inflammation Response Index (SIRI) = monocyte (109/L) × neutrophil (109/L)/lymphocyte count (109/L).
- -
- Homeostatic model assessment of insulin resistance (HOMA-IR) = fasting insulin (mU/L) × fasting glucose (mmol/L)/22.5;
- -
- TG/HDL-C ratio = total triglycerides (mg/dL)/HDL-C (mg/dL);
- -
- non-HDL-C = total cholesterol (mg/dL) − HDL-C (mg/dL).
2.4. Blood Pressure Measurement
2.5. Statistical Analysis
3. Results

| Parameters | All Obese (No. 552) | Obese MetS− (No. 406, 73.6%) | Obese MetS+ (No. 146, 26.4%) | p-Value |
|---|---|---|---|---|
| Age (years) | 14.8 [12.9–16.3] | 14.5 [12.4–15.9] | 15.8 [14.0–16.9] | <0.0001 |
| Sex (n, %) | M 219, 40; F 333, 60 | M 151, 69; F 255, 77 | M 68, 31; F 78, 23 | 0.523 |
| BMI (kg/m2) | 36.4 [32.7–40.7] | 35.5 [32.2–39.8] | 39.3 [35.6–42.6] | <0.0001 |
| WC (cm) | 113.0 [103.0–123.0] | 110.0 [101.0–120.0] | 122.0 [112.0–132.0] | <0.0001 |
| SBP (mmHg) | 120.0 [120.0–130.0] | 120.0 [110.0–125.0] | 130 [130.0–140.0] | <0.0001 |
| DBP (mmHg) | 80.0 [70.0–80.0] | 80.0 [70.0–80.0] | 80.0 [80.0–87.5] | <0.0001 |
| TG (mg/dL) | 88.0 [65.0–115.0] | 80.5 [62.0–103.3] | 117.0 [86.0–158.0] | <0.0001 |
| FBG (mmol/L) | 4.5 [4.3–4.3] | 4.5 [4.3–4.3] | 4.5 [4.3–4.8] | 0.929 |
| Insulin (mU/L) | 13.1 [8.5–19.1] | 11.4 [7.9–17.3] | 16.4 [12.1–22.3] | <0.0001 |
| HDL-C (mg/dL) | 41.0 [35.0–48.0] | 44.0 [39.8–51.0] | 35.0 [32.0–38.0] | <0.0001 |
| LDL-C (mg/dL) | 99.0 [83.0–121.0] | 98.0 [82.0–119.0] | 103.0 [85.0–127.0] | 0.063 |
| Total cholesterol (mg/dL) | 160.0 [141–181.8] | 158.5 [141.0–180.3] | 162.5 [139.8–185.3] | 0.528 |
| Parameters | All Obese (No. 552) | Obese MetS− (No. 406, 73.6%) | Obese MetS+ (No. 146, 26.4%) | p-Value |
|---|---|---|---|---|
| Leukocytes (109/L) | 8.3 [7.1–9.6] | 8.2 [7.0–9.6] | 8.5 [7.1–9.8] | 0.217 |
| Neutrophils (109/L) | 4.2 [3.4–5.2] | 4.1 [3.4–5.2] | 4.3 [3.4–5.3] | 0.204 |
| Lymphocytes (109/L) | 3.0 [2.6–3.6] | 3.0 [2.6–3.5] | 3.0 [2.6–3.7] | 0.375 |
| Monocytes (109/L) | 0.7 [0.6–0.8] | 0.7 [0.6–0.8] | 0.7 [0.6–0.8] | 0.766 |
| Eosinophils (109/L) | 0.2 [0.1–0.3] | 0.2 [0.1–0.3] | 0.2 [0.1–0.3] | 0.664 |
| Basophils (109/L) | 0.0 [0.0–0.0] | 0.0 [0.0–0.0] | 0.0 [0.0–0.1] | 0.181 |
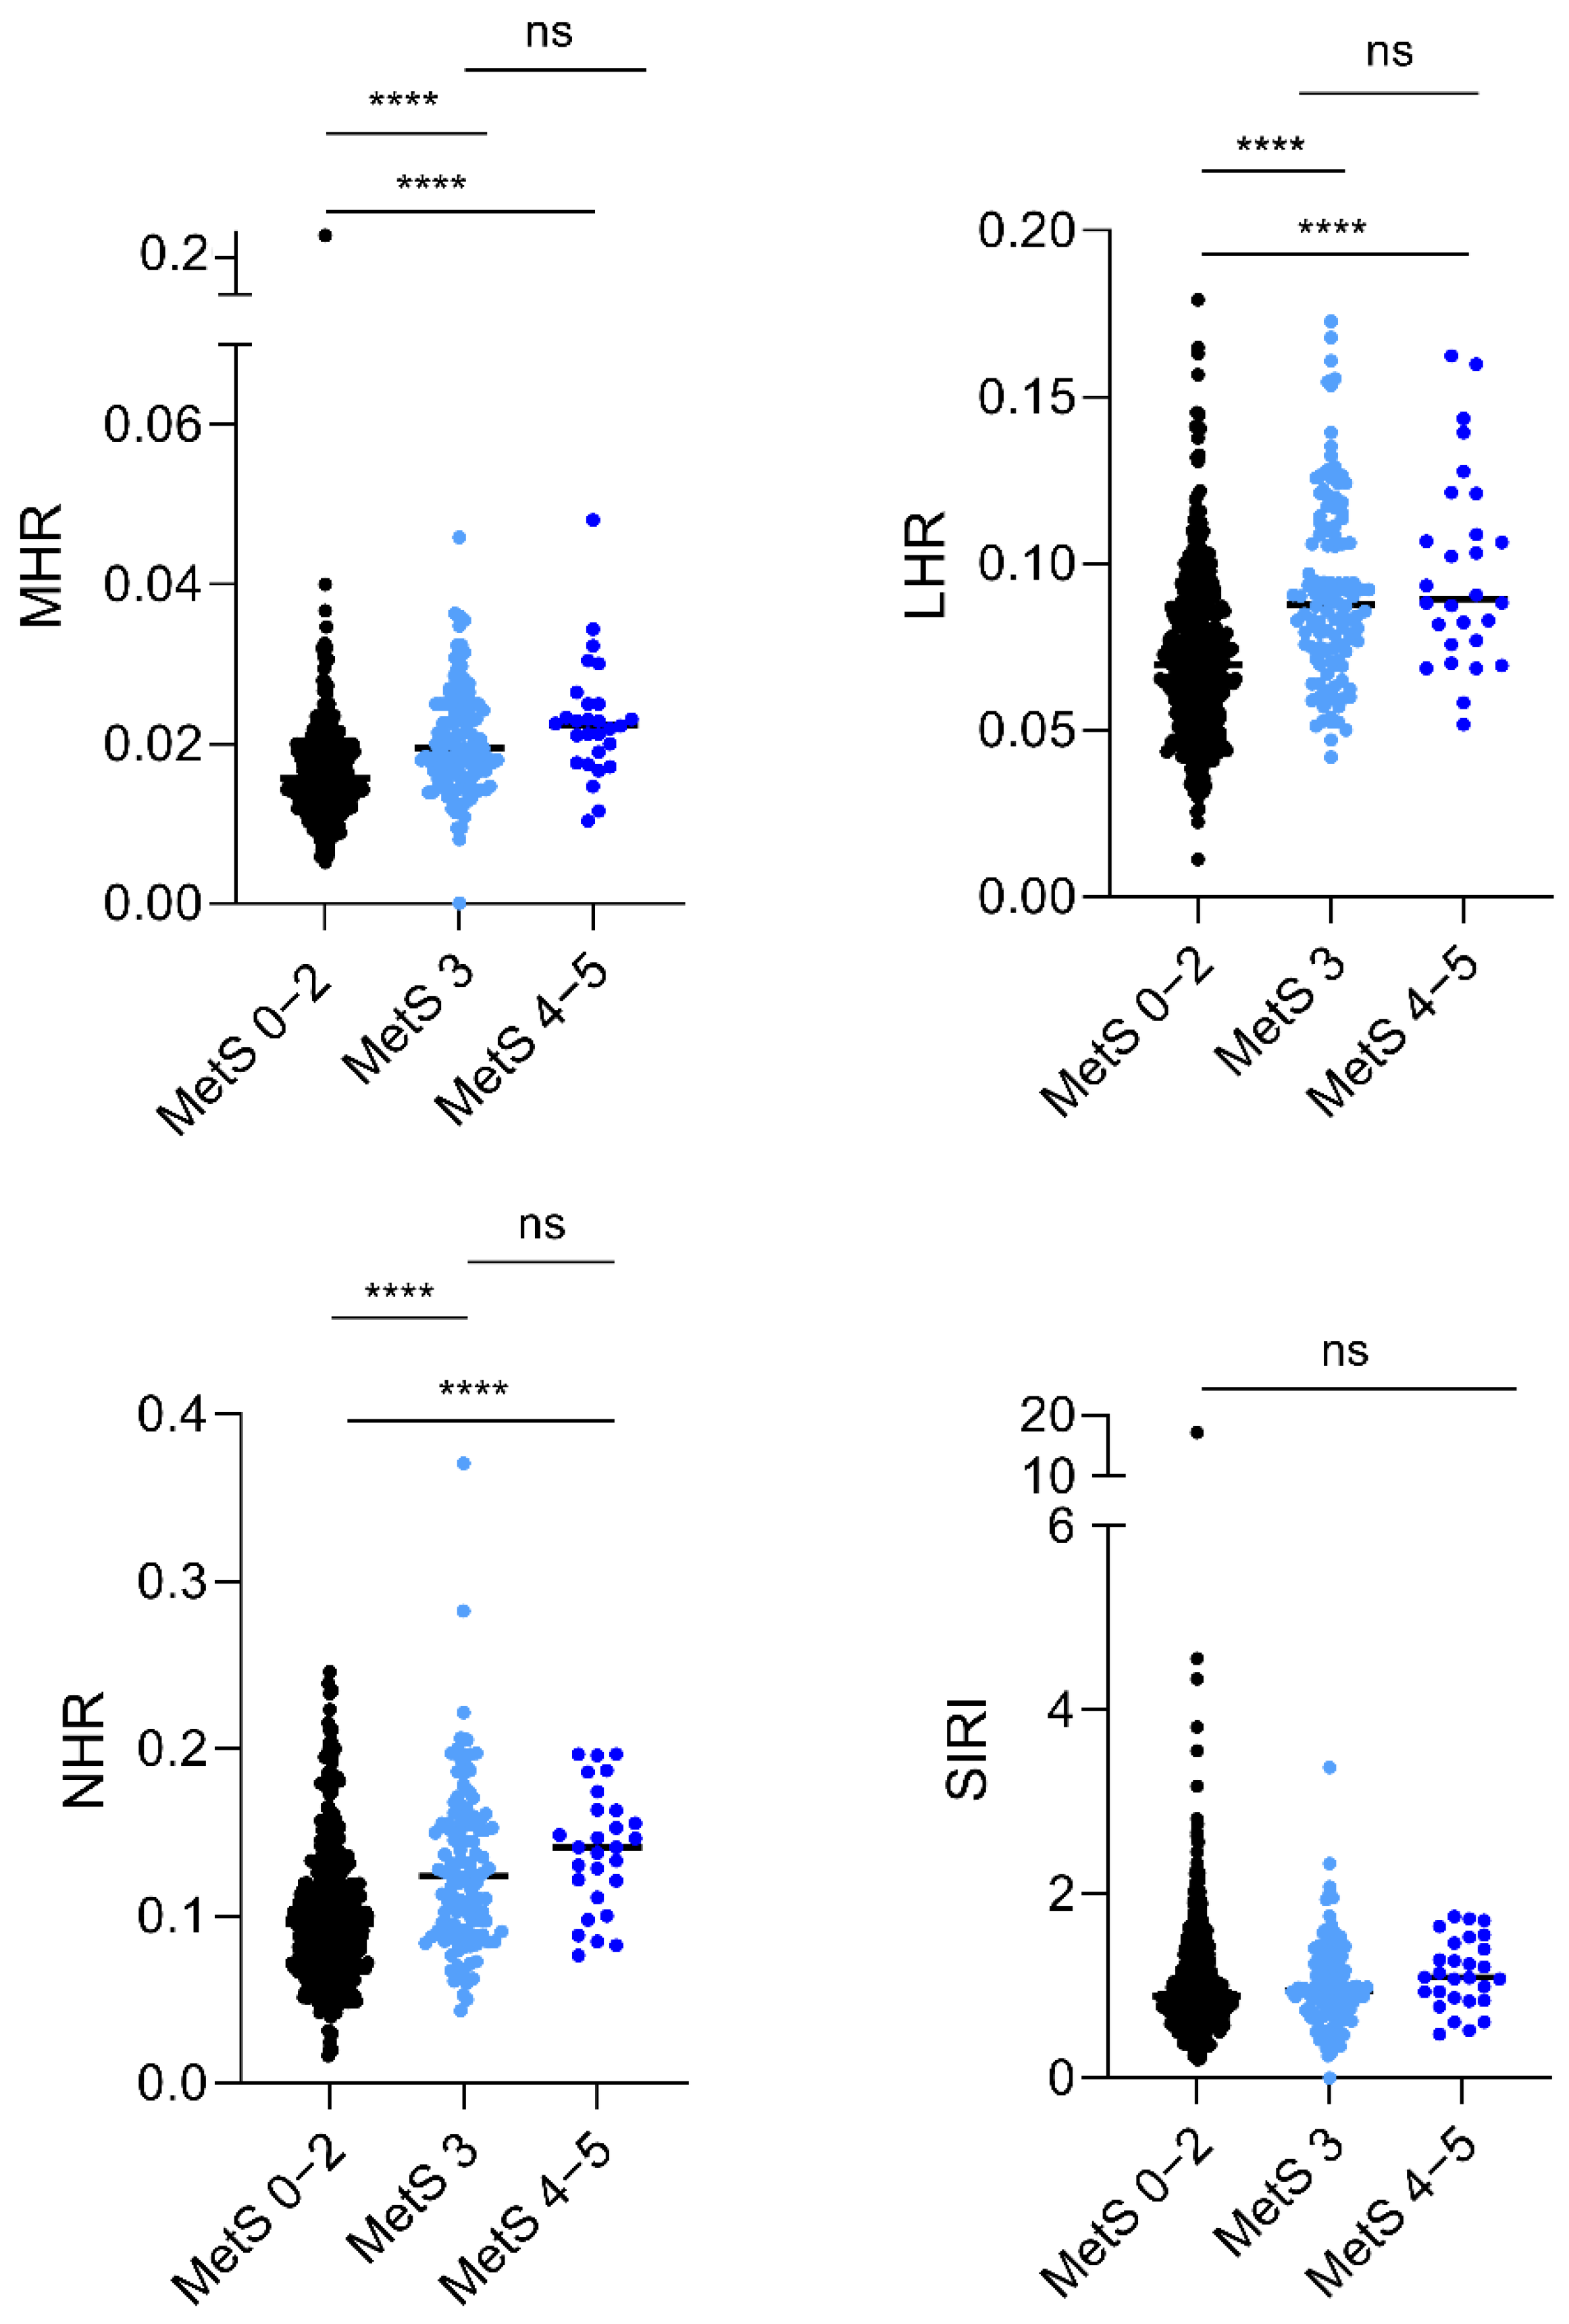
| MHR | 0.016 [0.013–0.20] | 0.015 [0.012–0.019] | 0.020 [0.017–0.025] | <0.0001 |
| LHR | 0.074 [0.058–0.091] | 0.069 [0.054–0.085] | 0.088 [0.073–0.111] | <0.0001 |
| NHR | 0.10 [0.07–0.13] | 0.095 [0.07–0.12] | 0.13 [0.09–0.15] | <0.0001 |
| SIRI | 0.92 [0.68–1.3] | 0.90 [0.68–1.31] | 0.98 [0.72–1.30] | 0.524 |
| HOMA-IR | 2.6 [1.7–3.8] | 2.3 [1.6–3.6] | 3.2 [2.3–4.5] | <0.0001 |
| non-HDL-C | 117.0 [98.0–141.0] | 114.0 [96.0–136.3] | 126.0 [105.8–152.0] | <0.0001 |
| TG/HDL-C | 2.1 [1.4–3.0] | 1.8 [1.3–2.5] | 3.4 [2.4–4.7] | <0.0001 |


| HOMA-IR | Non-HDL-C | TG/HDL-C | ||||
|---|---|---|---|---|---|---|
| CBC-Index | r | p | r | p | r | p |
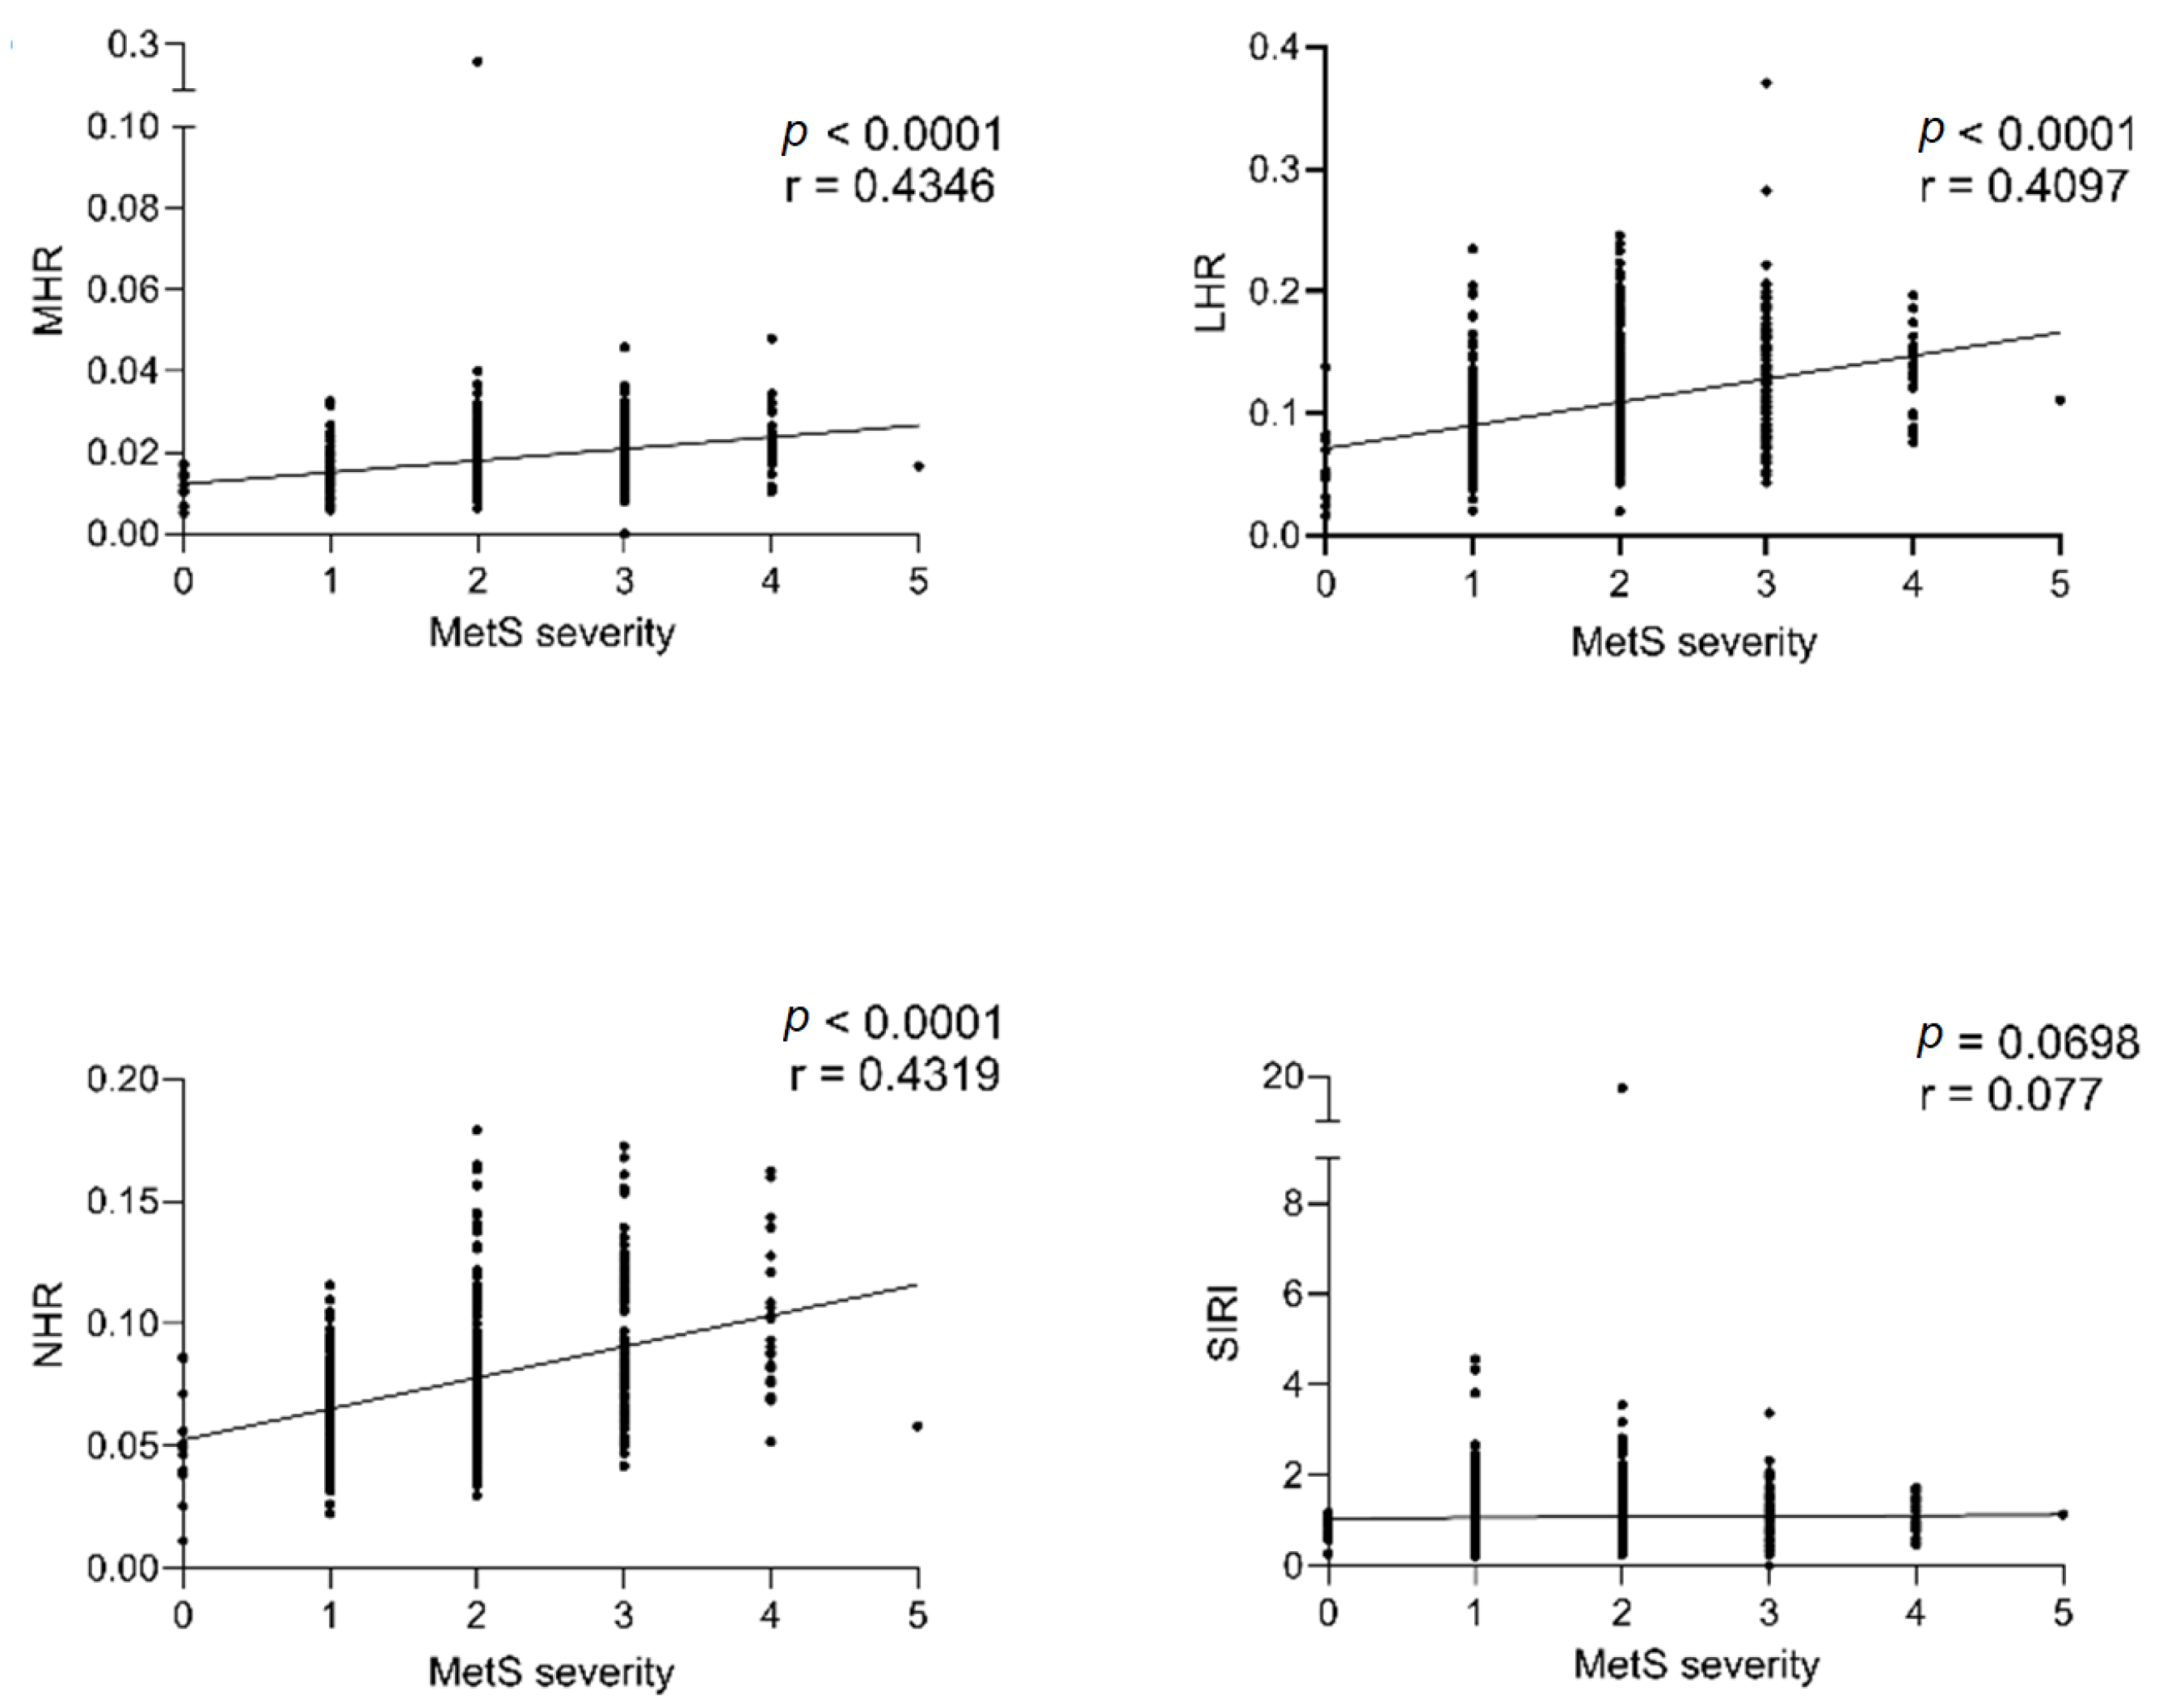
| MHR | 0.1547 | 0.000 | 0.1689 | <0.0001 | 0.5054 | <0.0001 |
| LHR | 0.1338 | 0.001 | 0.2091 | <0.0001 | 0.5569 | <0.0001 |
| NHR | 0.2393 | <0.0001 | 0.1578 | 0.000 | 0.4479 | <0.0001 |
| SIRI | 0.1393 | 0.001 | 0.02203 | 0.606 | 0.0279 | 0.513 |
| Exposure Variables | OR (95% CI) | p-Value |
|---|---|---|
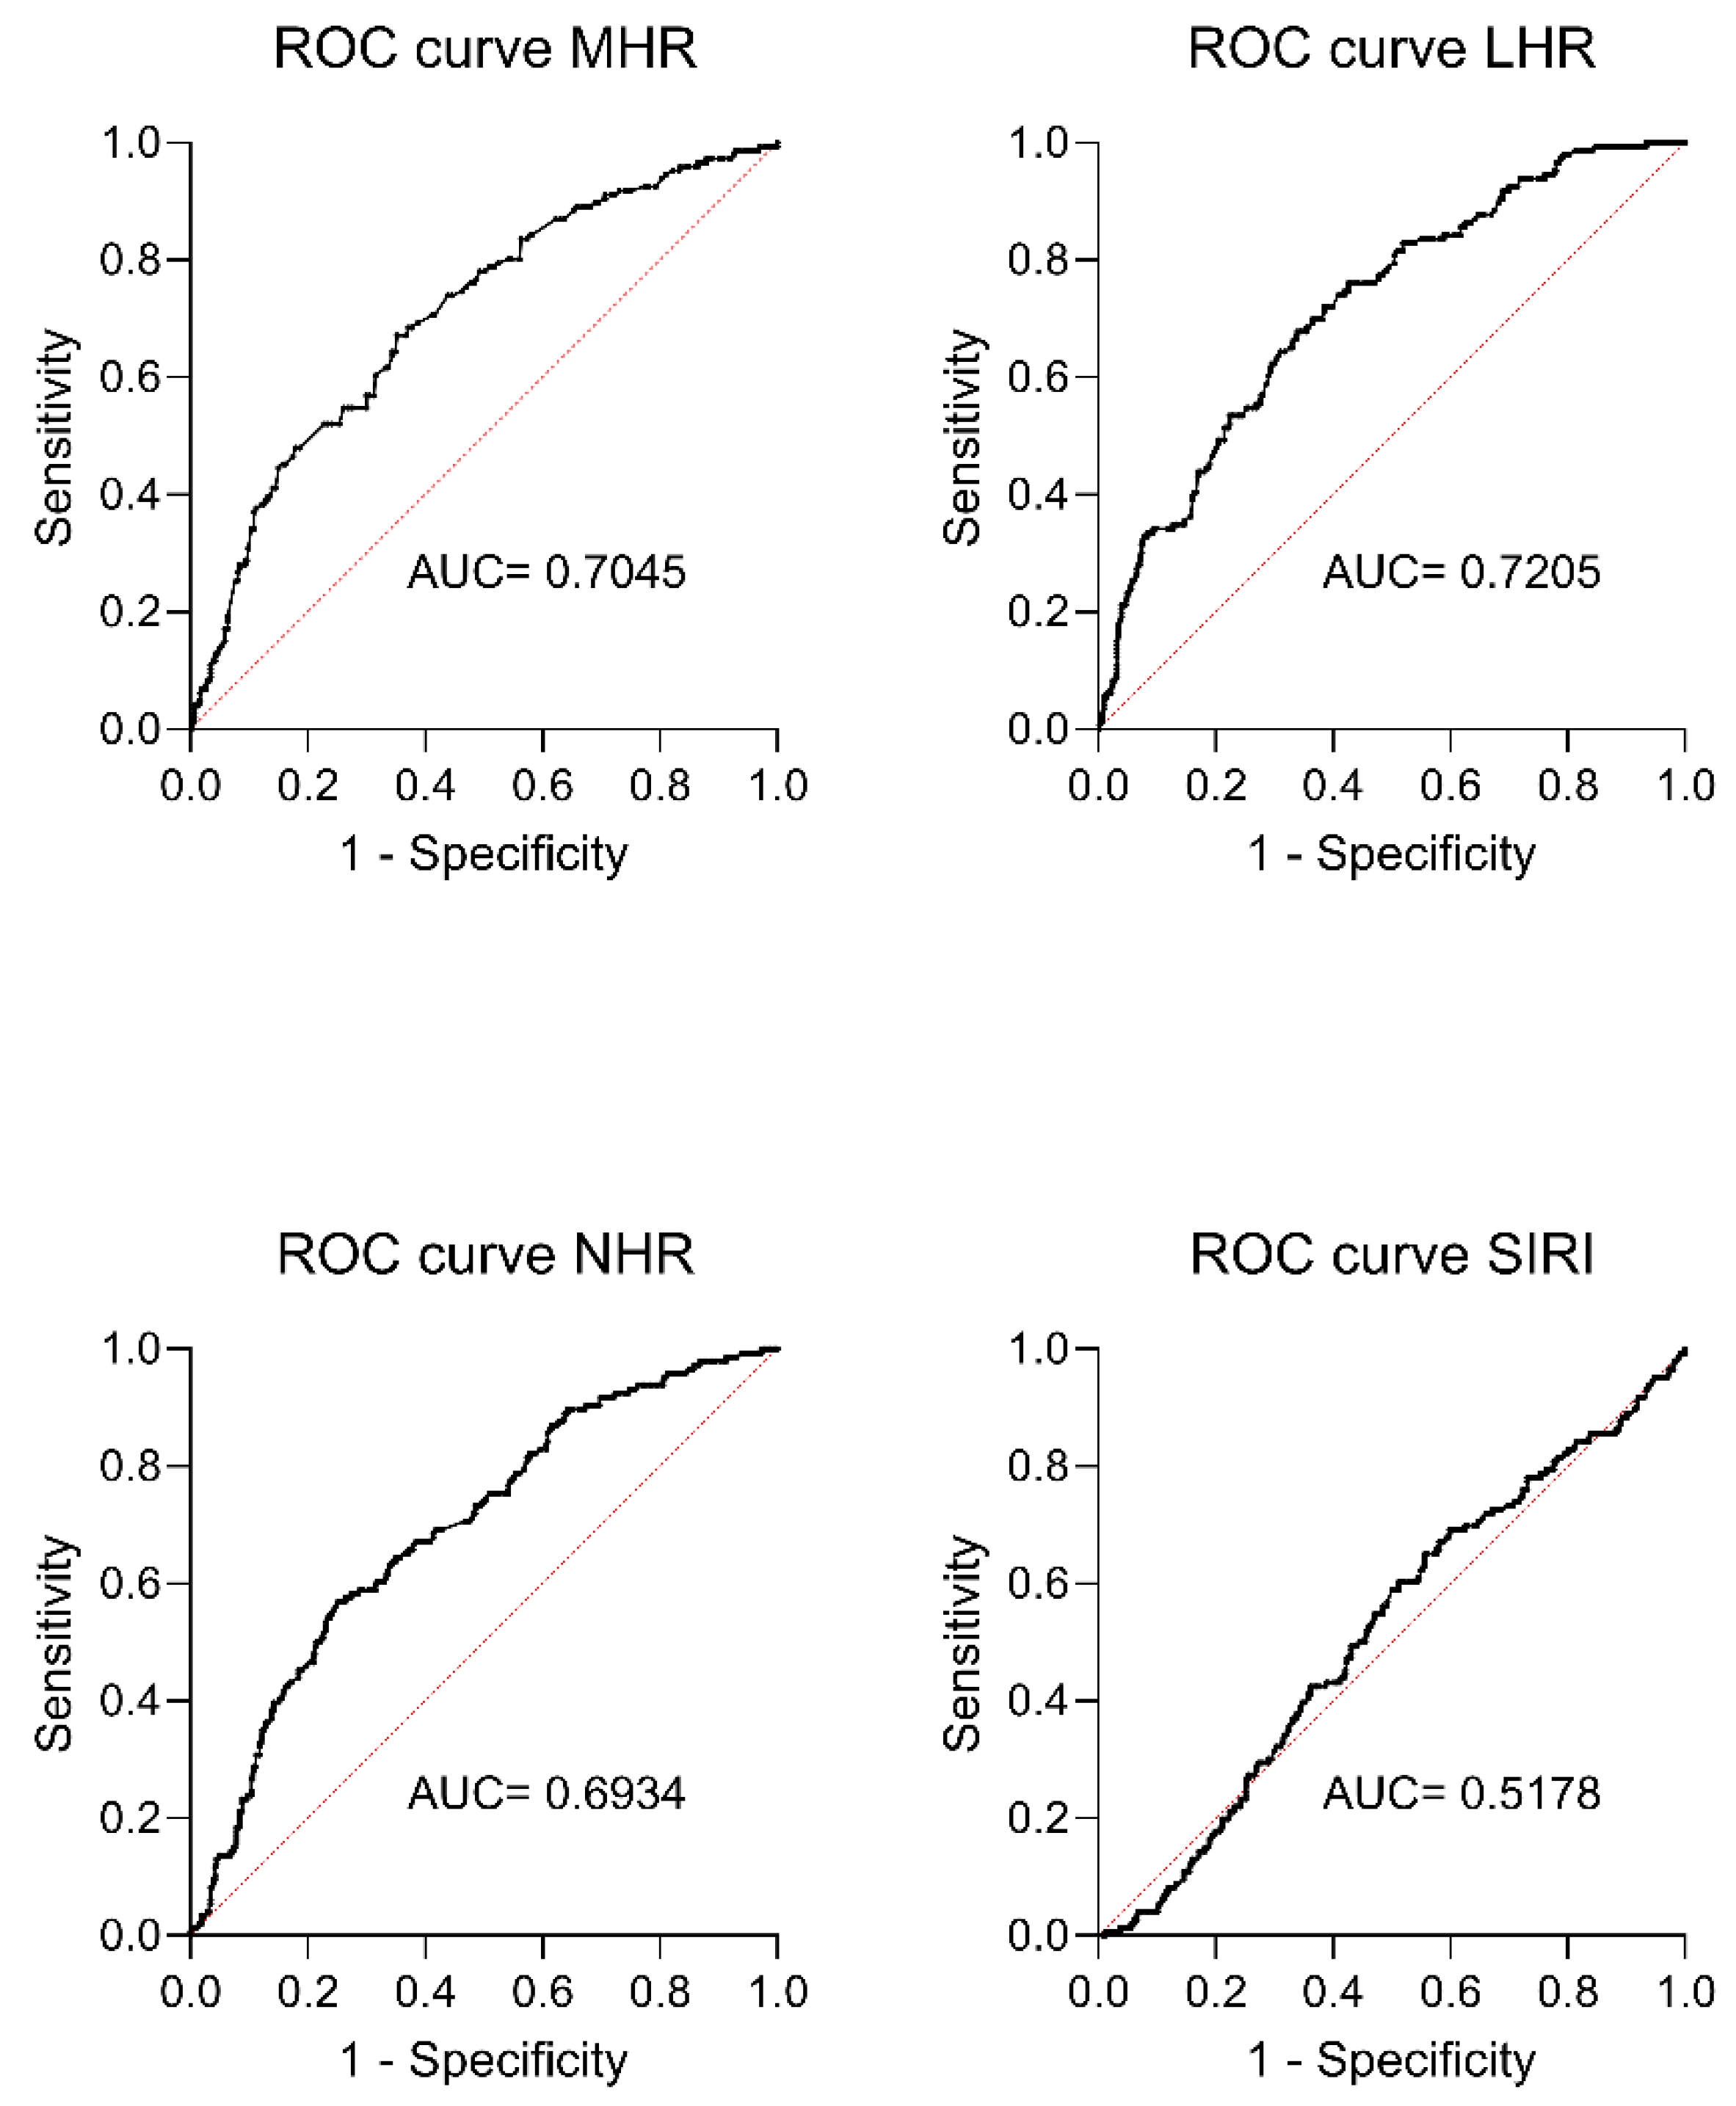
| MHR | 4.14 [4.55−3.77] | 0.000 |
| LHR | 6.74 [2.67−1.70] | <0.0001 |
| NHR | 2.79 [2.93−2.67] | <0.0001 |
| SIRI | 0.88 [0.63−1.12] | 0.382 |

4. Discussion
Supplementary Materials
Author Contributions
Funding
Institutional Review Board Statement
Informed Consent Statement
Data Availability Statement
Acknowledgments
Conflicts of Interest
Abbreviations
References
- World Health Organisation (WHO). Noncommunicable Diseases: Childhood Overweight and Obesity. 2020. Available online: https://www.who.int/News-Room/Questions-and-Answers/Item/Noncommunicable-Diseases-Childhood-Overweight-and-Obesity (accessed on 1 January 2024).
- Al-Hamad, D.; Raman, V. Metabolic Syndrome in Children and Adolescents. Transl. Pediatr. 2017, 6, 397–407. [Google Scholar] [CrossRef]
- Morrison, J.A.; Friedman, L.A.; Gray-McGuire, C. Metabolic Syndrome in Childhood Predicts Adult Cardiovascular Disease 25 Years Later: The Princeton Lipid Research Clinics Follow-up Study. Pediatrics 2007, 120, 340–345. [Google Scholar] [CrossRef] [PubMed]
- Jankowska, A.; Brzeziński, M.; Romanowicz-Sołtyszewska, A.; Szlagatys-Sidorkiewicz, A. Metabolic Syndrome in Obese Children—Clinical Prevalence and Risk Factors. Int. J. Environ. Res. Public Health 2021, 18, 1060. [Google Scholar] [CrossRef] [PubMed]
- Weihe, P.; Weihrauch-Blüher, S. Metabolic Syndrome in Children and Adolescents: Diagnostic Criteria, Therapeutic Options and Perspectives. Curr. Obes. Rep. 2019, 8, 472–479. [Google Scholar] [CrossRef] [PubMed]
- DeBoer, M.D. Assessing and Managing the Metabolic Syndrome in Children and Adolescents. Nutrients 2019, 11, 1788. [Google Scholar] [CrossRef] [PubMed]
- Fahed, G.; Aoun, L.; Bou Zerdan, M.; Allam, S.; Bou Zerdan, M.; Bouferraa, Y.; Assi, H.I. Metabolic Syndrome: Updates on Pathophysiology and Management in 2021. Int. J. Mol. Sci. 2022, 23, 786. [Google Scholar] [CrossRef] [PubMed]
- Kosmas, C.E.; Bousvarou, M.D.; Kostara, C.E.; Papakonstantinou, E.J.; Salamou, E.; Guzman, E. Insulin Resistance and Cardiovascular Disease. J. Int. Med. Res. 2023, 51, 0300060523116454. [Google Scholar] [CrossRef] [PubMed]
- Bashir, A.; Doreswamy, S.; Narra, L.R.; Patel, P.; Guarecuco, J.E.; Baig, A.; Lahori, S.; Heindl, S.E. Childhood Obesity as a Predictor of Coronary Artery Disease in Adults: A Literature Review. Cureus 2020, 12, e11473. [Google Scholar] [CrossRef] [PubMed]
- Delvecchio, M.; Pastore, C.; Valente, F.; Giordano, P. Cardiovascular Implications in Idiopathic and Syndromic Obesity in Childhood: An Update. Front. Endocrinol. 2020, 11, 330. [Google Scholar] [CrossRef] [PubMed]
- Mărginean, C.O.; Meliţ, L.E.; Ghiga, D.V.; Mărginean, M.O. Early Inflammatory Status Related to Pediatric Obesity. Front. Pediatr. 2019, 7, 241. [Google Scholar] [CrossRef] [PubMed]
- Nicoară, D.-M.; Munteanu, A.-I.; Scutca, A.-C.; Mang, N.; Juganaru, I.; Brad, G.-F.; Mărginean, O. Assessing the Relationship between Systemic Immune-Inflammation Index and Metabolic Syndrome in Children with Obesity. Int. J. Mol. Sci. 2023, 24, 8414. [Google Scholar] [CrossRef]
- Furuncuoglu, Y.; Tulgar, Y.K.; Cakiroglu, B. How Obesity Affects the Neutrophil/Lymphocyte and Platelet/Lymphocyte Ratio, Systemic Immune-Inflammatory Index and Platelet Indices: A Retrospective Study. Eur. Rev. Med. Pharmacol. Sci. 2016, 20, 1300–1306. [Google Scholar]
- Marra, A.; Bondesan, A.; Caroli, D.; Grugni, G.; Sartorio, A. The Neutrophil to Lymphocyte Ratio (NLR) Positively Correlates with the Presence and Severity of Metabolic Syndrome in Obese Adults, but Not in Obese Children/Adolescents. BMC Endocr. Disord. 2023, 23, 121. [Google Scholar] [CrossRef]
- Marra, A.; Bondesan, A.; Caroli, D.; Sartorio, A. Complete Blood Count (CBC)-Derived Inflammation Indexes Are Useful in Predicting Metabolic Syndrome in Adults with Severe Obesity. J. Clin. Med. 2024, 13, 1353. [Google Scholar] [CrossRef]
- Podeanu, M.-A.; Turcu-Stiolica, A.; Subțirelu, M.S.; Stepan, M.D.; Ionele, C.-M.; Gheonea, D.-I.; Vintilescu, B.Ș.; Sandu, R.E. C-Reactive Protein as a Marker of Inflammation in Children and Adolescents with Metabolic Syndrome: A Systematic Review and Meta-Analysis. Biomedicines 2023, 11, 2961. [Google Scholar] [CrossRef] [PubMed]
- Song, Y.; Zhao, Y.; Shu, Y.; Zhang, L.; Cheng, W.; Wang, L.; Shu, M.; Xue, B.; Wang, R.; Feng, Z.; et al. Combination Model of Neutrophil to High-Density Lipoprotein Ratio and System Inflammation Response Index Is More Valuable for Predicting Peripheral Arterial Disease in Type 2 Diabetic Patients: A Cross-Sectional Study. Front. Endocrinol. 2023, 14, 1100453. [Google Scholar] [CrossRef] [PubMed]
- Chen, T.; Chen, H.; Xiao, H.; Tang, H.; Xiang, Z.; Wang, X.; Wang, X.; Zou, H. Comparison of the Value of Neutrophil to High-Density Lipoprotein Cholesterol Ratio and Lymphocyte to High-Density Lipoprotein Cholesterol Ratio for Predicting Metabolic Syndrome Among a Population in the Southern Coast of China. Diabetes Metab. Syndr. Obes. Targets Ther. 2020, 13, 597–605. [Google Scholar] [CrossRef] [PubMed]
- Manoochehri, H.; Gheitasi, R.; Pourjafar, M.; Amini, R.; Yazdi, A. Investigating the Relationship between the Severity of Coronary Artery Disease and Inflammatory Factors of MHR, PHR, NHR, and IL-25. Med. J. Islam. Repub. Iran 2021, 35, 85. [Google Scholar] [CrossRef] [PubMed]
- Xia, Y.; Xia, C.; Wu, L.; Li, Z.; Li, H.; Zhang, J. Systemic Immune Inflammation Index (SII), System Inflammation Response Index (SIRI) and Risk of All-Cause Mortality and Cardiovascular Mortality: A 20-Year Follow-Up Cohort Study of 42,875 US Adults. J. Clin. Med. 2023, 12, 1128. [Google Scholar] [CrossRef] [PubMed]
- Wang, P.; Guo, X.; Zhou, Y.; Li, Z.; Yu, S.; Sun, Y.; Hua, Y. Monocyte-to-High-Density Lipoprotein Ratio and Systemic Inflammation Response Index Are Associated with the Risk of Metabolic Disorders and Cardiovascular Diseases in General Rural Population. Front. Endocrinol. 2022, 13, 944991. [Google Scholar] [CrossRef]
- Buyukkaya, E.; Karakas, M.F.; Karakas, E.; Akçay, A.B.; Tanboga, I.H.; Kurt, M.; Sen, N. Correlation of Neutrophil to Lymphocyte Ratio with the Presence and Severity of Metabolic Syndrome. Clin. Appl. Thromb. Off. J. Int. Acad. Clin. Appl. Thromb. 2014, 20, 159–163. [Google Scholar] [CrossRef] [PubMed]
- Tamini, S.; Cicolini, S.; Caroli, D.; Sartorio, A. Effects of a 3-Week In-Hospital Multidisciplinary Body Weight Reduction Program in Obese Females: Is Measured Resting Energy Expenditure Essential for Tailoring Adequately the Amount of Energy Intake? Front. Nutr. 2021, 8, 678788. [Google Scholar] [CrossRef] [PubMed]
- Rigamonti, A.E.; Bollati, V.; Favero, C.; Albetti, B.; Caroli, D.; Abbruzzese, L.; Cella, S.G.; Sartorio, A. Effect of a 3-Week Multidisciplinary Body Weight Reduction Program on the Epigenetic Age Acceleration in Obese Adults. J. Clin. Med. 2022, 11, 4677. [Google Scholar] [CrossRef] [PubMed]
- Cacciari, E.; Milani, S.; Balsamo, A.; Spada, E.; Bona, G.; Cavallo, L.; Cerutti, F.; Gargantini, L.; Greggio, N.; Tonini, G.; et al. Italian Cross-Sectional Growth Charts for Height, Weight and BMI (2 to 20 Yr). J. Endocrinol. Investig. 2006, 29, 581–593. [Google Scholar] [CrossRef] [PubMed]
- Alberti, K.G.M.M.; Eckel, R.H.; Grundy, S.M.; Zimmet, P.Z.; Cleeman, J.I.; Donato, K.A.; Fruchart, J.-C.; James, W.P.T.; Loria, C.M.; Smith, S.C. Harmonizing the Metabolic Syndrome: A Joint Interim Statement of the International Diabetes Federation Task Force on Epidemiology and Prevention; National Heart, Lung, and Blood Institute; American Heart Association; World Heart Federation; International Atherosclerosis Society; and International Association for the Study of Obesity. Circulation 2009, 120, 1640–1645. [Google Scholar] [CrossRef] [PubMed]
- Zimmet, P.; Alberti, K.G.M.; Kaufman, F.; Tajima, N.; Silink, M.; Arslanian, S.; Wong, G.; Bennett, P.; Shaw, J.; Caprio, S. The Metabolic Syndrome in Children and Adolescents—An IDF Consensus Report. Pediatr. Diabetes 2007, 8, 299–306. [Google Scholar] [CrossRef] [PubMed]
- Pelletiet, D.; Roche, A.F.; Martorell, R. Anthropometric Standardization Reference Manual. Anthr. Stand. Ref. Man. 1988, 4, 425. [Google Scholar]
- Ma, W.-Y.; Yang, C.-Y.; Shih, S.-R.; Hsieh, H.-J.; Hung, C.S.; Chiu, F.-C.; Lin, M.-S.; Liu, P.-H.; Hua, C.-H.; Hsein, Y.-C.; et al. Measurement of Waist Circumference. Diabetes Care 2013, 36, 1660–1666. [Google Scholar] [CrossRef] [PubMed]
- Caranti, D.A.; Lazzer, S.; Dâmaso, A.R.; Agosti, F.; Zennaro, R.; De Mello, M.T.; Tufik, S.; Sartorio, A. Prevalence and Risk Factors of Metabolic Syndrome in Brazilian and Italian Obese Adolescents: A Comparison Study: Metabolic Syndrome and Risk Factors in Obese Adolescents. Int. J. Clin. Pract. 2008, 62, 1526–1532. [Google Scholar] [CrossRef] [PubMed]
- Kahn, C.R.; Wang, G.; Lee, K.Y. Altered Adipose Tissue and Adipocyte Function in the Pathogenesis of Metabolic Syndrome. J. Clin. Investig. 2019, 129, 3990–4000. [Google Scholar] [CrossRef]
- Kwon, H.; Pessin, J.E. Adipokines Mediate Inflammation and Insulin Resistance. Front. Endocrinol. 2013, 4, 40863. [Google Scholar] [CrossRef] [PubMed]
- Kanneganti, T.-D.; Dixit, V.D. Immunological Complications of Obesity. Nat. Immunol. 2012, 13, 707–712. [Google Scholar] [CrossRef] [PubMed]
- Saltiel, A.R.; Olefsky, J.M. Inflammatory Mechanisms Linking Obesity and Metabolic Disease. J. Clin. Investig. 2017, 127, 1–4. [Google Scholar] [CrossRef] [PubMed]
- Türkkan, E.; Çetin Dağ, N.; Arabacı, Ç.; Dikker, O.; Dag, H. Evaluation of Inflammatory Hematological Ratios (NLR, PLR, MLR and Monocyte/HDL-Cholesterol Ratio) in Obese Adolescents. Iberoam. J. Med. 2022, 4, 11–17. [Google Scholar] [CrossRef]
- Akboga, M.K.; Canpolat, U.; Yuksel, M.; Yayla, C.; Yilmaz, S.; Turak, O.; Ozeke, O.; Topaloglu, S.; Aras, D. Platelet to Lymphocyte Ratio as a Novel Indicator of Inflammation Is Correlated with the Severity of Metabolic Syndrome: A Single Center Large-Scale Study. Platelets 2016, 27, 178–183. [Google Scholar] [CrossRef] [PubMed]
- Uslu, A.U.; Sekin, Y.; Tarhan, G.; Canakcı, N.; Gunduz, M.; Karagulle, M. Evaluation of Monocyte to High-Density Lipoprotein Cholesterol Ratio in the Presence and Severity of Metabolic Syndrome. Clin. Appl. Thromb. 2018, 24, 828–833. [Google Scholar] [CrossRef] [PubMed]
- Jiang, M.; Yang, J.; Zou, H.; Li, M.; Sun, W.; Kong, X. Monocyte-to-High-Density Lipoprotein-Cholesterol Ratio (MHR) and the Risk of All-Cause and Cardiovascular Mortality: A Nationwide Cohort Study in the United States. Lipids Health Dis. 2022, 21, 30. [Google Scholar] [CrossRef] [PubMed]
- Ren, H.; Zhu, B.; Zhao, Z.; Li, Y.; Deng, G.; Wang, Z.; Ma, B.; Feng, Y.; Zhang, Z.; Zhao, X.; et al. Neutrophil to High-Density Lipoprotein Cholesterol Ratio as the Risk Mark in Patients with Type 2 Diabetes Combined with Acute Coronary Syndrome: A Cross-Sectional Study. Sci. Rep. 2023, 13, 7836. [Google Scholar] [CrossRef]
- Feingold, K.R.; Grunfeld, C. The Role of HDL in Innate Immunity. J. Lipid Res. 2011, 52, 1–3. [Google Scholar] [CrossRef] [PubMed]
- Stadler, J.T.; Marsche, G. Obesity-Related Changes in High-Density Lipoprotein Metabolism and Function. Int. J. Mol. Sci. 2020, 21, 8985. [Google Scholar] [CrossRef]
- Klop, B.; Elte, J.; Cabezas, M. Dyslipidemia in Obesity: Mechanisms and Potential Targets. Nutrients 2013, 5, 1218–1240. [Google Scholar] [CrossRef] [PubMed]
- Dilek, T.D.; Bostan Gayret, Ö.; Kılınç, S.; Erol, M.; Yiğit, Ö.; Mete, F. The Assessment of the Neutrophil-Lymphocyte Ratio and Platelet-Lymphocyte Ratio in Dyslipidemic Obese Children. Bagcilar Med. Bull. 2019, 4, 56–60. [Google Scholar] [CrossRef]
- Yazaki, L.G.; Faria, J.C.P.; Souza, F.I.S.D.; Sarni, R.O.S. Neutrophil-to-Lymphocyte and Platelet-to-Lymphocyte Ratios of Overweight Children and Adolescents. Rev. Assoc. Méd. Bras. 2022, 68, 1006–1010. [Google Scholar] [CrossRef] [PubMed]
- Aydın, M. Neutrophil Lymphocyte Ratio in Obese Adolescents. North. Clin. Istanb. 2015, 2, 87–91. [Google Scholar] [CrossRef] [PubMed][Green Version]
- Gast, K.B.; Tjeerdema, N.; Stijnen, T.; Smit, J.W.A.; Dekkers, O.M. Insulin Resistance and Risk of Incident Cardiovascular Events in Adults without Diabetes: Meta-Analysis. PLoS ONE 2012, 7, e52036. [Google Scholar] [CrossRef] [PubMed]
- Vladu, I.; Forțofoiu, M.; Clenciu, D.; Forțofoiu, M.-C.; Pădureanu, R.; Radu, L.; Cojan, Ș.; Rădulescu, P.; Pădureanu, V. Insulin Resistance Quantified by the Value of HOMA-IR and Cardiovascular Risk in Patients with Type 2 Diabetes. Exp. Ther. Med. 2021, 23, 73. [Google Scholar] [CrossRef] [PubMed]
- Raja, V.; Aguiar, C.; Alsayed, N.; Chibber, Y.S.; ElBadawi, H.; Ezhov, M.; Hermans, M.P.; Pandey, R.C.; Ray, K.K.; Tokgözoglu, L.; et al. Non-HDL-Cholesterol in Dyslipidemia: Review of the State-of-the-Art Literature and Outlook. Atherosclerosis 2023, 383, 117312. [Google Scholar] [CrossRef] [PubMed]
- Kosmas, C.E.; Rodriguez Polanco, S.; Bousvarou, M.D.; Papakonstantinou, E.J.; Peña Genao, E.; Guzman, E.; Kostara, C.E. The Triglyceride/High-Density Lipoprotein Cholesterol (TG/HDL-C) Ratio as a Risk Marker for Metabolic Syndrome and Cardiovascular Disease. Diagnostics 2023, 13, 929. [Google Scholar] [CrossRef] [PubMed]
- Díaz-Ortega, J.L.; Yupari-Azabache, I.L.; Caballero Vidal, J.A.; Conde-Parada, N.E.; Rojas Gamboa, A.F. Criteria in the Diagnosis of Metabolic Syndrome in Children: A Scoping Review. Diabetes Metab. Syndr. Obes. 2023, 16, 3489–3500. [Google Scholar] [CrossRef] [PubMed]
- Friend, A.; Craig, L.; Turner, S. The Prevalence of Metabolic Syndrome in Children: A Systematic Review of the Literature. Metab. Syndr. Relat. Disord. 2013, 11, 71–80. [Google Scholar] [CrossRef] [PubMed]
- Obita, G.; Alkhatib, A. Disparities in the Prevalence of Childhood Obesity-Related Comorbidities: A Systematic Review. Front. Public Health 2022, 10, 923744. [Google Scholar] [CrossRef] [PubMed]
- Matsushita, R.; Isojima, T.; Takaya, R.; Satake, E.; Yamaguchi, R.; Kitsuda, K.; Nagata, E.; Sano, S.; Nakanishi, T.; Nakagawa, Y.; et al. Development of Waist Circumference Percentiles for Japanese Children and an Examination of Their Screening Utility for Childhood Metabolic Syndrome: A Population-Based Cross-Sectional Study. BMC Public Health 2015, 15, 1121. [Google Scholar] [CrossRef] [PubMed]
- Gonzalez-Gil, A.M.; Peschard-Franco, M.; Castillo, E.C.; Gutierrez-DelBosque, G.; Treviño, V.; Silva-Platas, C.; Perez-Villarreal, L.; Garcia-Rivas, G.; Elizondo-Montemayor, L. Myokine–Adipokine Cross-Talk: Potential Mechanisms for the Association between Plasma Irisin and Adipokines and Cardiometabolic Risk Factors in Mexican Children with Obesity and the Metabolic Syndrome. Diabetol. Metab. Syndr. 2019, 11, 63. [Google Scholar] [CrossRef] [PubMed]
- Guzmán-Guzmán, I.P.; Salgado-Bernabé, A.B.; Muñoz Valle, J.F.; Vences-Velázquez, A.; Parra-Rojas, I. Prevalence of metabolic syndrome in children with and without obesity. Med. Clin. 2015, 144, 198–203. [Google Scholar] [CrossRef]
- Peña-Espinoza, B.I.; de los Ángeles Granados-Silvestre, M.; Sánchez-Pozos, K.; Ortiz-López, M.G.; Menjivar, M. Metabolic syndrome in Mexican children: Low effectiveness of diagnostic definitions. Endocrinol. Diabetes Nutr. 2017, 64, 369–376. [Google Scholar] [CrossRef] [PubMed]
- Rosini, N.; Moura, S.A.Z.O.; Rosini, R.D.; Machado, M.J.; da Silva, E.L. Metabolic Syndrome and Importance of Associated Variables in Children and Adolescents in Guabiruba—SC, Brazil. Arq. Bras. Cardiol. 2015, 105, 37–44. [Google Scholar] [CrossRef] [PubMed]
- Ellulu, M.S.; Patimah, I.; Khaza’ai, H.; Rahmat, A.; Abed, Y. Obesity and Inflammation: The Linking Mechanism and the Complications. Arch. Med. Sci. 2017, 13, 851–863. [Google Scholar] [CrossRef] [PubMed]
- Straub, R.H.; Schradin, C. Chronic Inflammatory Systemic Diseases—An Evolutionary Trade-off between Acutely Beneficial but Chronically Harmful Programs. Evol. Med. Public Health 2016, 2016, 37–51. [Google Scholar] [CrossRef] [PubMed]
- Oudijk, E.J.D.; Lammers, J.W.J.; Koenderman, L. Systemic Inflammation in Chronic Obstructive Pulmonary Disease. Eur. Respir. J. 2003, 22, 5s–13s. [Google Scholar] [CrossRef]
- Mou, Y.; Du, Y.; Zhou, L.; Yue, J.; Hu, X.; Liu, Y.; Chen, S.; Lin, X.; Zhang, G.; Xiao, H.; et al. Gut Microbiota Interact With the Brain Through Systemic Chronic Inflammation: Implications on Neuroinflammation, Neurodegeneration, and Aging. Front. Immunol. 2022, 13, 796288. [Google Scholar] [CrossRef] [PubMed]
- Magnussen, C.G.; Koskinen, J.; Chen, W.; Thomson, R.; Schmidt, M.D.; Srinivasan, S.R.; Kivimäki, M.; Mattsson, N.; Kähönen, M.; Laitinen, T.; et al. Pediatric Metabolic Syndrome Predicts Adulthood Metabolic Syndrome, Subclinical Atherosclerosis, and Type 2 Diabetes Mellitus but Is No Better Than Body Mass Index Alone: The Bogalusa Heart Study and the Cardiovascular Risk in Young Finns Study. Circulation 2010, 122, 1604–1611. [Google Scholar] [CrossRef] [PubMed]
- Codazzi, V.; Frontino, G.; Galimberti, L.; Giustina, A.; Petrelli, A. Mechanisms and Risk Factors of Metabolic Syndrome in Children and Adolescents. Endocrine 2024, 84, 16–28. [Google Scholar] [CrossRef] [PubMed]
- Lamichhane, P.; Agrawal, A.; Abouainain, Y.; Abousahle, S.; Regmi, P.R. Utility of Neutrophil-to-High-Density Lipoprotein-Cholesterol Ratio in Patients with Coronary Artery Disease: A Narrative Review. J. Int. Med. Res. 2023, 51, 030006052311665. [Google Scholar] [CrossRef] [PubMed]
- Coupal, K.E.; Heeney, N.D.; Hockin, B.C.D.; Ronsley, R.; Armstrong, K.; Sanatani, S.; Claydon, V.E. Pubertal Hormonal Changes and the Autonomic Nervous System: Potential Role in Pediatric Orthostatic Intolerance. Front. Neurosci. 2019, 13, 1197. [Google Scholar] [CrossRef] [PubMed]
- Abreu, A.P.; Kaiser, U.B. Pubertal Development and Regulation. Lancet Diabetes Endocrinol. 2016, 4, 254–264. [Google Scholar] [CrossRef]
Disclaimer/Publisher’s Note: The statements, opinions and data contained in all publications are solely those of the individual author(s) and contributor(s) and not of MDPI and/or the editor(s). MDPI and/or the editor(s) disclaim responsibility for any injury to people or property resulting from any ideas, methods, instructions or products referred to in the content. |
© 2024 by the authors. Licensee MDPI, Basel, Switzerland. This article is an open access article distributed under the terms and conditions of the Creative Commons Attribution (CC BY) license (https://creativecommons.org/licenses/by/4.0/).
Share and Cite
Marra, A.; Bondesan, A.; Caroli, D.; Sartorio, A. Complete Blood Count-Derived Inflammation Indexes Are Useful in Predicting Metabolic Syndrome in Children and Adolescents with Severe Obesity. J. Clin. Med. 2024, 13, 2120. https://doi.org/10.3390/jcm13072120
Marra A, Bondesan A, Caroli D, Sartorio A. Complete Blood Count-Derived Inflammation Indexes Are Useful in Predicting Metabolic Syndrome in Children and Adolescents with Severe Obesity. Journal of Clinical Medicine. 2024; 13(7):2120. https://doi.org/10.3390/jcm13072120
Chicago/Turabian StyleMarra, Alice, Adele Bondesan, Diana Caroli, and Alessandro Sartorio. 2024. "Complete Blood Count-Derived Inflammation Indexes Are Useful in Predicting Metabolic Syndrome in Children and Adolescents with Severe Obesity" Journal of Clinical Medicine 13, no. 7: 2120. https://doi.org/10.3390/jcm13072120
APA StyleMarra, A., Bondesan, A., Caroli, D., & Sartorio, A. (2024). Complete Blood Count-Derived Inflammation Indexes Are Useful in Predicting Metabolic Syndrome in Children and Adolescents with Severe Obesity. Journal of Clinical Medicine, 13(7), 2120. https://doi.org/10.3390/jcm13072120