
A Novel Decision Tree Model for Predicting the Cancer-Specific Survival of Patients with Bladder Cancer Treated with Radical Cystectomy

 , , and
Abstract
1. Introduction
2. Materials and Methods
2.1. Patients
2.2. Statistical Analysis
3. Results
4. Discussion
5. Conclusions
Supplementary Materials
Author Contributions
Funding
Institutional Review Board Statement
Informed Consent Statement
Data Availability Statement
Conflicts of Interest
References
- Sung, H.; Ferlay, J.; Siegel, R.L.; Laversanne, M.; Soerjomataram, I.; Jemal, A.; Bray, F. Global Cancer Statistics 2020: GLOBOCAN Estimates of Incidence and Mortality Worldwide for 36 Cancers in 185 Countries. CA Cancer J. Clin. 2021, 71, 209–249. [Google Scholar] [CrossRef] [PubMed]
- Dyba, T.; Randi, G.; Bray, F.; Martos, C.; Giusti, F.; Nicholson, N.; Gavin, A.; Flego, M.; Neamtiu, L.; Dimitrova, N.; et al. The European cancer burden in 2020: Incidence and mortality estimates for 40 countries and 25 major cancers. Eur. J. Cancer Oxf. Engl. 2021, 157, 308–347. [Google Scholar] [CrossRef] [PubMed]
- Schafer, E.J.; Jemal, A.; Wiese, D.; Sung, H.; Kratzer, T.B.; Islami, F.; Dahut, W.L.; Knudsen, K.E. Disparities and Trends in Genitourinary Cancer Incidence and Mortality in the USA. Eur. Urol. 2023, 84, 117–126. [Google Scholar] [CrossRef]
- Sarrio-Sanz, P.; Martinez-Cayuelas, L.; Gil-Guillen, V.F.; Quesada, J.A.; Gomez-Perez, L. Mortality Trends Related to Bladder Cancer in Spain, 1999–2018. J. Clin. Med. 2022, 11, 930. [Google Scholar] [CrossRef] [PubMed]
- Siegel, R.L.; Miller, K.D.; Wagle, N.S.; Jemal, A. Cancer statistics, 2023. CA Cancer J. Clin. 2023, 73, 17–48. [Google Scholar] [CrossRef] [PubMed]
- Sarrió-Sanz, P.; Martinez-Cayuelas, L.; Lumbreras, B.; Sánchez-Caballero, L.; Palazón-Bru, A.; Gil-Guillén, V.F.; Gómez-Pérez, L. Mortality prediction models after radical cystectomy for bladder tumour: A systematic review and critical appraisal. Eur. J. Clin. Investig. 2022, 31, e13822. [Google Scholar] [CrossRef] [PubMed]
- Witjes, J.A.; Bruins, H.M.; Cathomas, R.; Compérat, E.M.; Cowan, N.C.; Gakis, G.; Hernández, V.; Espinós, E.L.; Lorch, A.; Neuzillet, Y.; et al. European Association of Urology Guidelines on Muscle-invasive and Metastatic Bladder Cancer: Summary of the 2020 Guidelines. Eur. Urol. 2021, 79, 82–104. [Google Scholar] [CrossRef]
- Cicione, A.; Simone, G.; Lombardo, R.; Franco, A.; Nacchia, A.; Ghezzo, N.; Zammitti, F.; Guidotti, A.; Gallo, G.; Molinaro, E.; et al. Development of a Pocket Nomogram to Predict Cancer and Disease Specific Survival after Radical Cystectomy for Bladder Cancer: The CRAB Nomogram. Clin. Genitourin. Cancer 2023, 21, 108–114. [Google Scholar] [CrossRef]
- Fedeli, U.; De Paoli, A.; Corti, M.C.; Cacciamani, G.E.; Gill, I.S.; Zattoni, F.; Novara, G.; Porreca, A.; Artibani, W. Perioperative Mortality and Long-Term Survival after Radical Cystectomy: A Population-Based Study in a Southern European Country on 4389 Patients. Urol. Int. 2020, 104, 559–566. [Google Scholar] [CrossRef]
- Yang, Z.; Bai, Y.; Liu, M.; Hu, X.; Han, P. Development and validation of a prognostic nomogram for predicting cancer-specific survival after radical cystectomy in patients with bladder cancer:A population-based study. Cancer Med. 2020, 9, 9303–9314. [Google Scholar] [CrossRef]
- Mir, M.C.; Marchioni, M.; Zargar, H.; Zargar-Shoshtari, K.; Fairey, A.; Mertens, L.S.; Dinney, C.; Krabbe, L.; Cookson, M.; Jacobsen, N.; et al. Nomogram Predicting Bladder Cancer-specific Mortality after Neoadjuvant Chemotherapy and Radical Cystectomy for Muscle-invasive Bladder Cancer: Results of an International Consortium. Eur. Urol. Focus 2021, 7, 1347–1354. [Google Scholar] [CrossRef] [PubMed]
- Tian, J.; Sun, J.; Fu, G.; Xu, Z.; Chen, X.; Shi, Y.; Jin, B. Population-based outcome of muscle-invasive bladder cancer following radical cystectomy: Who can benefit from adjuvant chemotherapy? Transl. Androl. Urol. 2021, 10, 356–373. [Google Scholar] [CrossRef] [PubMed]
- Proietti, F.; Flammia, R.S.; Licari, L.C.; Bologna, E.; Bove, A.M.; Brassetti, A.; Tuderti, G.; Mastroianni, R.; Tufano, A.; Simone, G.; et al. Impacts of Neoadjuvant Chemotherapy on Perioperative Outcomes in Patients with Bladder Cancer Treated with Radical Cystectomy: A Single High-Volume Center Experience. J. Personal. Med. 2024, 14, 212. [Google Scholar] [CrossRef] [PubMed]
- Beneyto-Ripoll, C.; Palazón-Bru, A.; Llópez-Espinós, P.; Martínez-Díaz, A.M.; Gil-Guillén, V.F.; de Los Ángeles Carbonell-Torregrosa, M. A critical appraisal of the prognostic predictive models for patients with sepsis: Which model can be applied in clinical practice? Int. J. Clin. Pract. 2021, 25, e14044. [Google Scholar] [CrossRef] [PubMed]
- Lopez-Beltran, A.; Cookson, M.S.; Guercio, B.J.; Cheng, L. Advances in diagnosis and treatment of bladder cancer. BMJ 2024, 384, e076743. [Google Scholar] [CrossRef]
- Young, J.; Roffers, S.; Ries, L.; Fritz, A.; Hurlbut, A. SEER Summary Staging Manual—2000: Codes and Coding Instructions; NIH Pub. No. 01-4969; National Cancer Institute: Bethesda, MD, USA, 2001. [Google Scholar]
- Pereira, L.C.; da Silva, S.J.; Fidelis, C.R.; Brito, A.d.L.; Júnior, S.F.A.X.; Andrade, L.S.d.S.; de Oliveira, M.E.C.; de Oliveira, T.A. Cox model and decision trees: An application to breast cancer data. Pan Am. J. Public Health 2022, 46, e17. [Google Scholar] [CrossRef] [PubMed]
- Linden, A.; Yarnold, P.R. Modeling time-to-event (survival) data using classification tree analysis. J. Eval. Clin. Pract. 2017, 23, 1299–1308. [Google Scholar] [CrossRef] [PubMed]
- Weathers, B. Comparison of Survival Curves between Cox Proportional Hazards, Random Forests, and Conditional Inference Forests in Survival Analysis. All Graduate Plan B and Other Reports. 2017. Available online: https://digitalcommons.usu.edu/gradreports/927 (accessed on 7 April 2024).
- Schumacher, M.; Hollander, N.; Schwarzer, G. Prognostic Factor Studies. In Handbook of Statistics in Clinical Oncology; Crowley, J., Hoering, A., Eds.; CRC Press: Boca Raton, FL, USA, 2001. [Google Scholar]
- Mogensen, U.B.; Ishwaran, H.; Gerds, T.A. Evaluating Random Forests for Survival Analysis using Prediction Error Curves. J. Stat. Softw. 2012, 50, 1–23. [Google Scholar] [CrossRef]
- Moons, K.G.; Wolff, R.F.; Riley, R.D.; Whiting, P.F.; Westwood, M.; Collins, G.S.; Reitsma, J.B.; Kleijnen, J.; Mallett, S. PROBAST: A Tool to Assess Risk of Bias and Applicability of Prediction Model Studies: Explanation and Elaboration. Ann. Intern. Med. 2019, 170, W1–W33. [Google Scholar] [CrossRef]
- Moons, K.G.M.; de Groot, J.A.H.; Bouwmeester, W.; Vergouwe, Y.; Mallett, S.; Altman, D.G.; Reitsma, J.B.; Collins, G.S. Critical appraisal and data extraction for systematic reviews of prediction modelling studies: The CHARMS checklist. PLoS Med. 2014, 11, e1001744. [Google Scholar] [CrossRef]
- Ku, J.H.; Kang, M.; Kim, H.S.; Jeong, C.W.; Kwak, C.; Kim, H.H. The prognostic value of pretreatment of systemic inflammatory responses in patients with urothelial carcinoma undergoing radical cystectomy. Br. J. Cancer 2015, 112, 461–467. [Google Scholar] [CrossRef] [PubMed]
- Simone, G.; Bianchi, M.; Giannarelli, D.; Daneshmand, S.; Papalia, R.; Ferriero, M.; Guaglianone, S.; Sentinelli, S.; Colombo, R.; Montorsi, F.; et al. Development and external validation of nomograms predicting disease-free and cancer-specific survival after radical cystectomy. World J. Urol. 2015, 33, 1419–1428. [Google Scholar] [CrossRef] [PubMed]
- Shariat, S.F.; Karakiewicz, P.I.; Palapattu, G.S.; Amiel, G.E.; Lotan, Y.; Rogers, C.G.; Vazina, A.; Bastian, P.J.; Gupta, A.; Sagalowsky, A.I.; et al. Nomograms provide improved accuracy for predicting survival after radical cystectomy. Clin. Cancer Res. 2006, 12, 6663–6676. [Google Scholar] [CrossRef] [PubMed]
- Di Trapani, E.; Sanchez-Salas, R.; Gandaglia, G.; Rocchini, L.; Moschini, M.; Lizee, D.; Carneiro, A.; Sivaraman, A.; Barret, E.; Rozet, F.; et al. A nomogram predicting the cancer-specific mortality in patients eligible for radical cystectomy evaluating clinical data and neoadjuvant cisplatinum-based chemotherapy. World J. Urol. 2016, 34, 207–213. [Google Scholar] [CrossRef] [PubMed]
- Gondo, T.; Nakashima, J.; Ohno, Y.; Choichiro, O.; Horiguchi, Y.; Namiki, K.; Yoshioka, K.; Ohori, M.; Hatano, T.; Tachibana, M. Prognostic value of neutrophil-to-lymphocyte ratio and establishment of novel preoperative risk stratification model in bladder cancer patients treated with radical cystectomy. Urology 2012, 79, 1085–1091. [Google Scholar] [CrossRef] [PubMed]
- May, M.; Bastian, P.J.; Brookman-May, S.; Fritsche, H.-M.; Tilki, D.; Otto, W.; Bolenz, C.; Gilfrich, C.; Trojan, L.; Herrmann, E.; et al. Gender-specific differences in cancer-specific survival after radical cystectomy for patients with urothelial carcinoma of the urinary bladder in pathologic tumor stage T4a. Urol. Oncol. 2013, 31, 1141–1147. [Google Scholar] [CrossRef]
- Booth, C.M.; Karim, S.; Brennan, K.; Siemens, D.R.; Peng, Y.; Mackillop, W.J. Perioperative chemotherapy for bladder cancer in the general population: Are practice patterns finally changing? Urol. Oncol. 2018, 36, e13–e89. [Google Scholar] [CrossRef]


| Variable | Derivation Cohort | Validation Cohort | Overall | p-Value | Missing Values (%) |
|---|---|---|---|---|---|
| N = 7889 | N = 3945 | N = 11,834 | |||
| Sex | 0.1 | 0 | |||
| Female | 1808 (23%) | 954 (24%) | 2762 (23%) | ||
| Male | 6081 (77%) | 2991 (76%) | 9072 (77%) | ||
| Year of diagnostic | 0.8 | 0 | |||
| 2004 | 445 (5.6%) | 244 (6.2%) | 689 (5.8%) | ||
| 2005 | 446 (5.7%) | 229 (5.8%) | 675 (5.7%) | ||
| 2006 | 486 (6.2%) | 246 (6.2%) | 732 (6.2%) | ||
| 2007 | 536 (6.8%) | 251 (6.4%) | 787 (6.7%) | ||
| 2008 | 524 (6.6%) | 270 (6.8%) | 794 (6.7%) | ||
| 2009 | 517 (6.6%) | 233 (5.9%) | 750 (6.3%) | ||
| 2010 | 565 (7.2%) | 305 (7.7%) | 870 (7.4%) | ||
| 2011 | 505 (6.4%) | 268 (6.8%) | 773 (6.5%) | ||
| 2012 | 458 (5.8%) | 225 (5.7%) | 683 (5.8%) | ||
| 2013 | 474 (6.0%) | 255 (6.5%) | 729 (6.2%) | ||
| 2014 | 527 (6.7%) | 251 (6.4%) | 778 (6.6%) | ||
| 2015 | 491 (6.2%) | 238 (6.0%) | 729 (6.2%) | ||
| 2016 | 519 (6.6%) | 239 (6.1%) | 758 (6.4%) | ||
| 2017 | 497 (6.3%) | 237 (6.0%) | 734 (6.2%) | ||
| 2018 | 461 (5.8%) | 250 (6.3%) | 711 (6.0%) | ||
| 2019 | 438 (5.6%) | 204 (5.2%) | 642 (5.4%) | ||
| Age | 68.06 (9.98) | 68.11 (10.05) | 68.08 (10.00) | 0.7 | 0 |
| Race | 0.1 | 0.19 | |||
| American Indian/Alaska Native | 33 (0.4%) | 24 (0.6%) | 57 (0.5%) | ||
| Asian or Pacific Islander | 353 (4.5%) | 206 (5.2%) | 559 (4.7%) | ||
| Black | 486 (6.2%) | 220 (5.6%) | 706 (6.0%) | ||
| White | 7017 (89%) | 3495 (89%) | 10,512 (89%) | ||
| Death classification | 0.7 | 0.7 | |||
| Alive or death of another cause | 4664 (59%) | 2346 (59%) | 7010 (59%) | ||
| Death due to bladder cancer | 3225 (41%) | 1599 (41%) | 4824 (41%) | ||
| Survival time (month) | 47.38 (46.21) | 47.64 (47.10) | 47.47 (46.51) | 0.8 | 0 |
| Summary stage | 0.1 | 0.62 | |||
| Localized | 3204 (41%) | 1603 (41%) | 4807 (41%) | ||
| Lymph node | 4066 (52%) | 2074 (53%) | 6140 (52%) | ||
| Metastatic | 619 (7.9%) | 268 (6.8%) | 887 (7.5%) | ||
| T stage | 0.2 | 0.87 | |||
| T1 | 712 (9%) | 338 (8.6%) | 1050 (8.9%) | ||
| T2 | 3032 (38%) | 1539 (39%) | 4571 (39%) | ||
| T3 | 2639 (33%) | 1370 (35%) | 4009 (34%) | ||
| T4 | 1506 (19%) | 698 (18%) | 2204 (19%) | ||
| N stage | 0.6 | 1.4 | |||
| Negative | 5785 (73%) | 2874 (73%) | 8659 (73%) | ||
| Positive | 2104 (27%) | 1071 (27%) | 3175 (27%) | ||
| M stage | 0.9 | 0.59 | |||
| Negative | 7587 (96%) | 3793 (96%) | 11,380 (96%) | ||
| Positive | 302 (3.8%) | 152 (3.9%) | 454 (3.8%) | ||
| Size | 41.85 (36.73) | 41.78 (36.95) | 41.83 (36.80) | 0.9 | 27.09 |
| Grade | 0.5 | 11.35 | |||
| I | 26 (0.3%) | 15 (0.4%) | 41 (0.3%) | ||
| II | 133 (1.7%) | 75 (1.9%) | 208 (1.8%) | ||
| III | 2014 (26%) | 1047 (27%) | 3061 (26%) | ||
| IV | 5716 (72%) | 2808 (71%) | 8524 (72%) | ||
| AJCC stage | 0.8 | 0 | |||
| I | 670 (8.5%) | 316 (8%) | 986 (8.3%) | ||
| II | 2601 (33%) | 1319 (33%) | 3920 (33%) | ||
| III | 2475 (31%) | 1239 (31%) | 3714 (31%) | ||
| IV | 2143 (27%) | 1071 (27%) | 3214 (27%) |
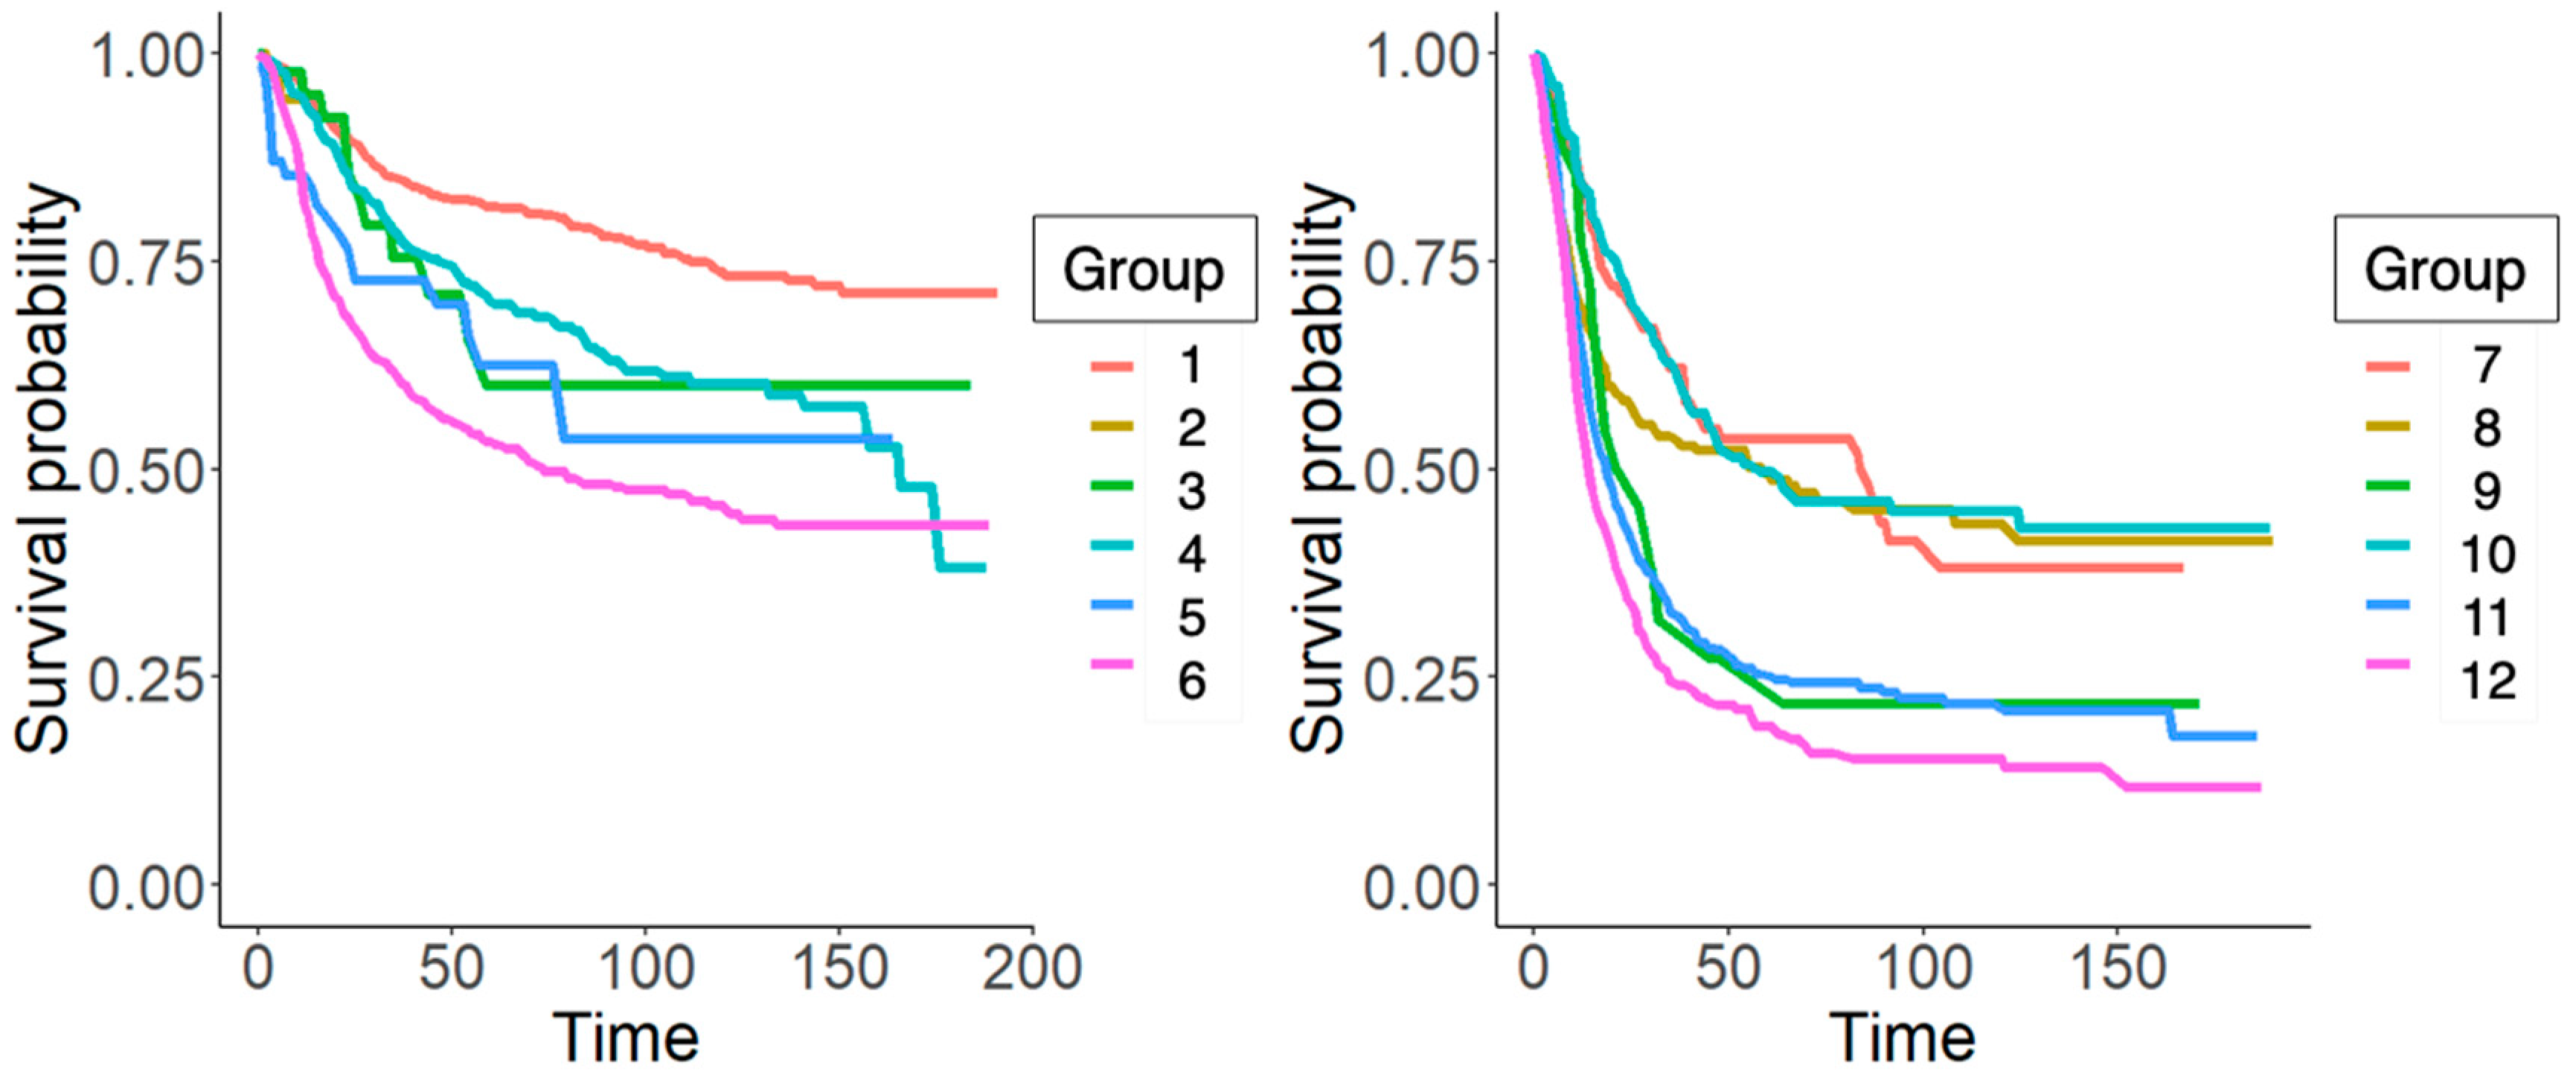
| Group | n | Events | * r Mean | Median Survival | 0.95 CI |
|---|---|---|---|---|---|
| 1 | 1830 (885) | 369 (175) | 151.0 (151.4) | ||
| 2 | 114 (56) | 2 (2) | 10.8 (10.7) | ||
| 3 | 129 (46) | 40 (11) | 121.1 (124.2) | 169 | 111–( |
| 4 | 1087 (583) | 288 (161) | 128.5 (124.9) | (166) | 171–(157-) |
| 5 | 111 (65) | 42 (20) | 91.2 (103.4) | 104 | 47–(57-) |
| 6 | 1424 (741) | 548 (312) | 106.5 (100.8) | 112 (74) | 77–(58–122) |
| 7 | 393 (183) | 153 (68) | 92.2 (87.3) | 67 (84) | 47–126 (41-) |
| 8 | 658 (315) | 357 (138) | 68.5 (93.3) | 26 (59) | 22–32 (28-) |
| 9 | 63 (29) | 40 (18) | 34.0 (54.9) | 17 (27) | 14–41 (16–64) |
| 10 | 350 (180) | 169 (87) | 100.15 (99.1) | 68 (58) | 42–(41-) |
| 11 | 918 (478) | 596 (335) | 63.5 (55.1) | 22 (19) | 20–25 (16–22) |
| 12 | 812 (384) | 621 (272) | 41.1 (42) | 14 (14) | 13–15 (13–17) |
| CHARMS Items | Sarrio et al., 2024 |
|---|---|
| Source of data | Retrospective cohort study |
| Participants | SEER database The total records were randomly split into development and validation cohorts in a ratio of 2:1 Patients with urothelial BC who received RC + LND Treatment is not included as a candidate predictor Baseline data: 2004–2019 |
| Outcome to be predicted | 3-year CCS Measurement: medical records Blinding unknown |
| Candidate predictors | Predictors: age, sex, race, year of diagnosis, tumor size, grade, AJCC stage, TNM stage and summary stage Measurement: clinical records at baseline (diagnosis) Blinding of measurement unknown, but all of them are objective Continuous predictors: linear |
| Sample size | N = 7889 (E = 3225) to develop the model and 3945 to validate it (E = 1599) EPV = 4824/35 = 168 |
| Missing data | Multiple Imputation by Chained Equations |
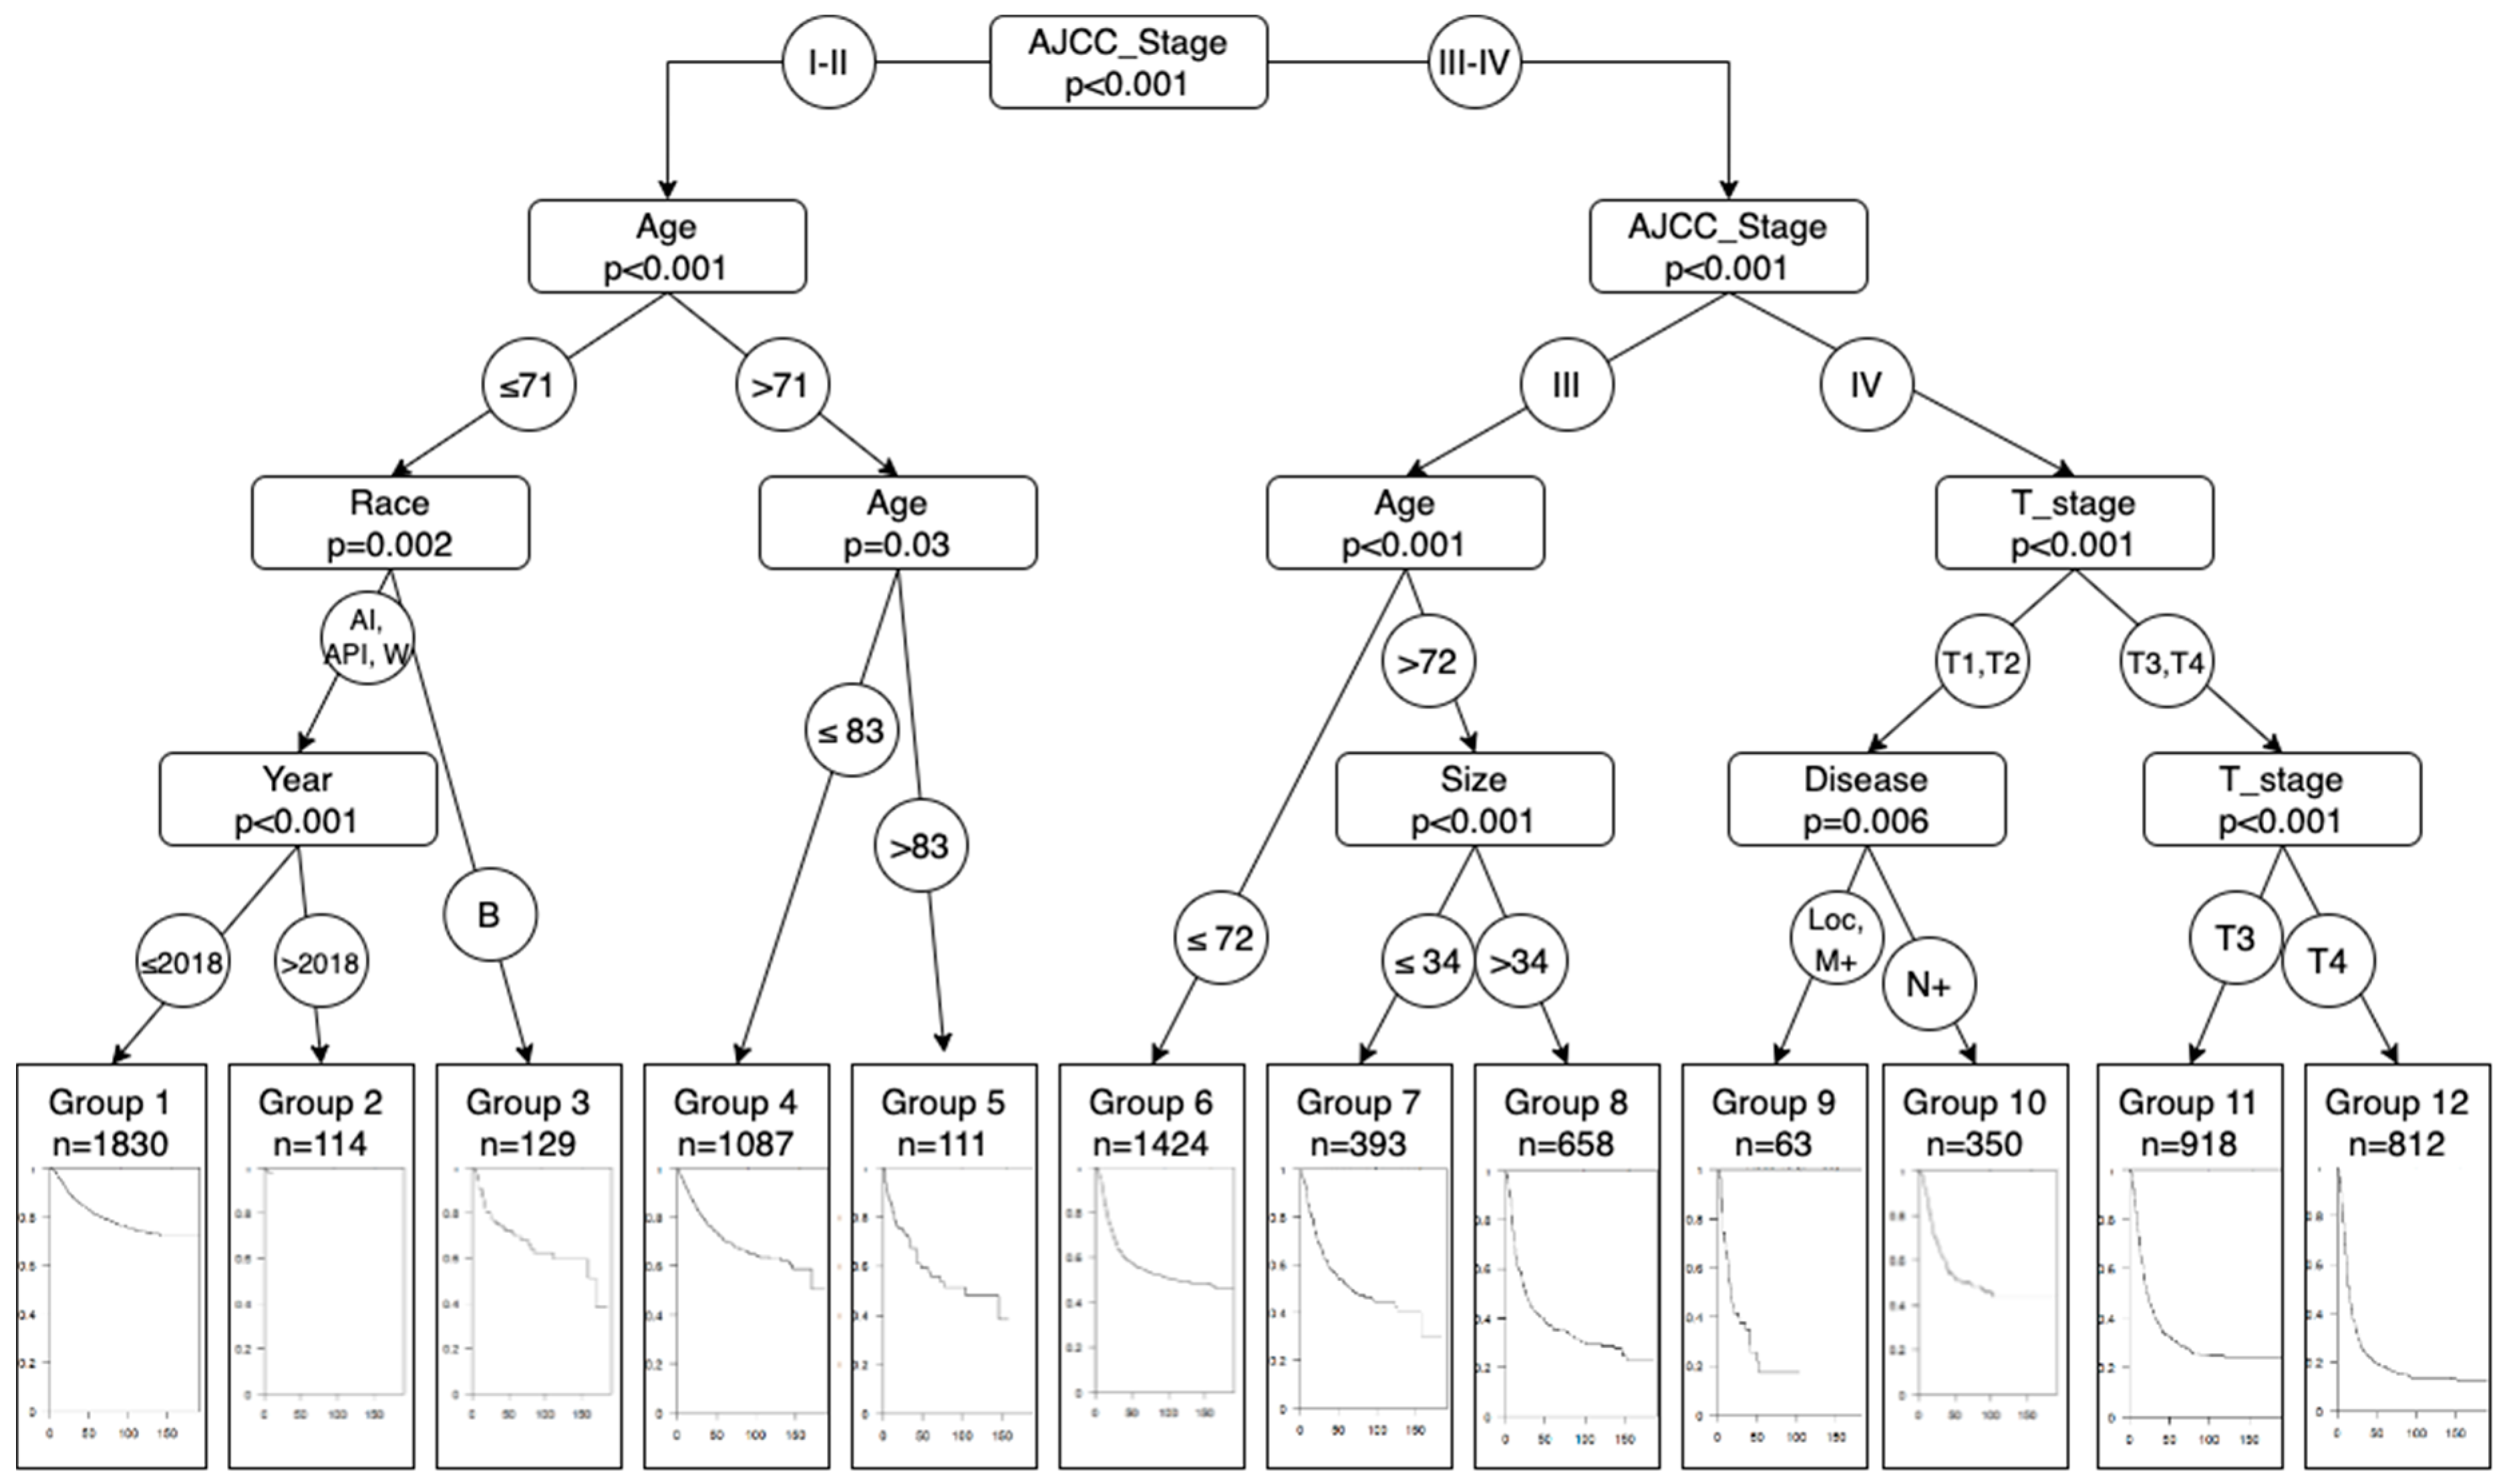
| Model development | Conditional inference trees for survival analysis Assumptions were not tested Method for selection of predictors for inclusion in multivariable modeling: full model Method for selection of predictors during multivariable modeling: full model No shrinkage or penalization |
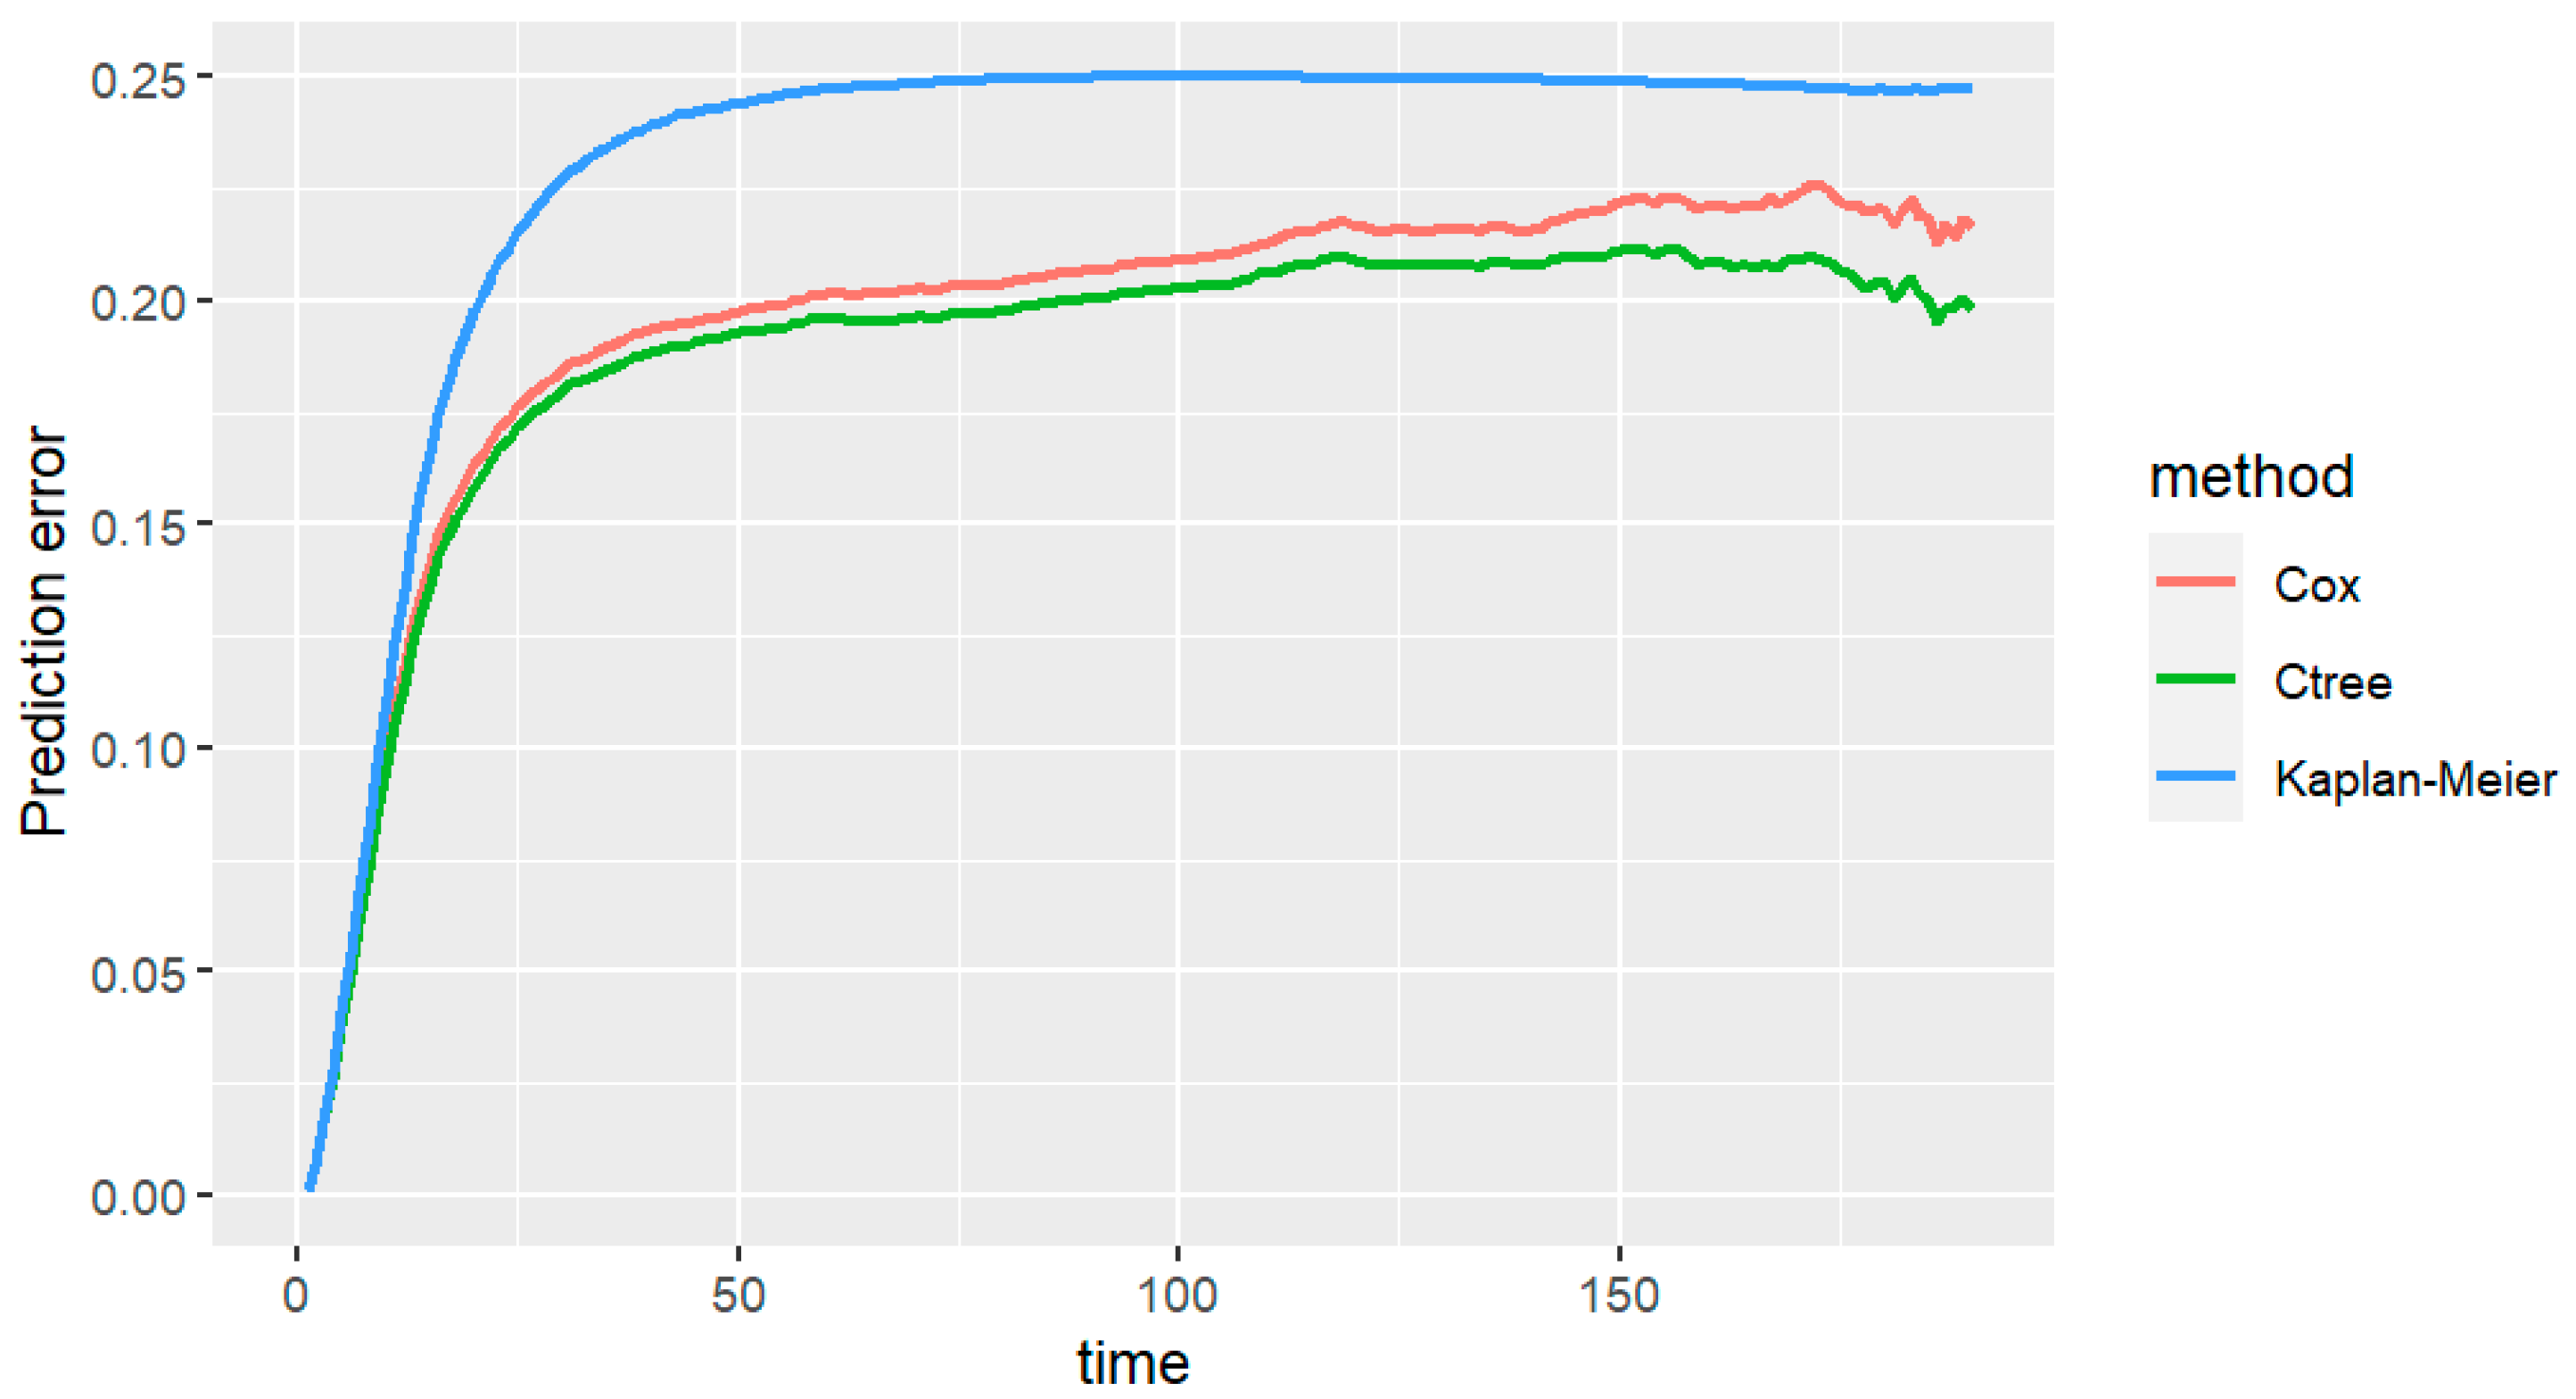
| Model performance | Discrimination: none Calibration: none Classification measures: pec package |
| Model evaluation | Internal: Brier score External: Brier score |
| Results | Indicated: model coefficients, Brier score Not indicated: none Presentation: decision tree + risk score The authors did compare the distribution of the predictors for development and validation data sets |
| Interpretation and discussion | Exploratory results Comparison with previous models and explanation for the predictors of the final models They analyzed strengths and limitations They discussed generalizability in other areas |
Disclaimer/Publisher’s Note: The statements, opinions and data contained in all publications are solely those of the individual author(s) and contributor(s) and not of MDPI and/or the editor(s). MDPI and/or the editor(s) disclaim responsibility for any injury to people or property resulting from any ideas, methods, instructions or products referred to in the content. |
© 2024 by the authors. Licensee MDPI, Basel, Switzerland. This article is an open access article distributed under the terms and conditions of the Creative Commons Attribution (CC BY) license (https://creativecommons.org/licenses/by/4.0/).
Share and Cite
Sarrio-Sanz, P.; Martinez-Cayuelas, L.; Beltran-Perez, A.; Muñoz-Montoya, M.; Segura-Heras, J.-V.; Gil-Guillen, V.F.; Gomez-Perez, L. A Novel Decision Tree Model for Predicting the Cancer-Specific Survival of Patients with Bladder Cancer Treated with Radical Cystectomy. J. Clin. Med. 2024, 13, 2177. https://doi.org/10.3390/jcm13082177
Sarrio-Sanz P, Martinez-Cayuelas L, Beltran-Perez A, Muñoz-Montoya M, Segura-Heras J-V, Gil-Guillen VF, Gomez-Perez L. A Novel Decision Tree Model for Predicting the Cancer-Specific Survival of Patients with Bladder Cancer Treated with Radical Cystectomy. Journal of Clinical Medicine. 2024; 13(8):2177. https://doi.org/10.3390/jcm13082177
Chicago/Turabian StyleSarrio-Sanz, Pau, Laura Martinez-Cayuelas, Abraham Beltran-Perez, Milagros Muñoz-Montoya, Jose-Vicente Segura-Heras, Vicente F. Gil-Guillen, and Luis Gomez-Perez. 2024. "A Novel Decision Tree Model for Predicting the Cancer-Specific Survival of Patients with Bladder Cancer Treated with Radical Cystectomy" Journal of Clinical Medicine 13, no. 8: 2177. https://doi.org/10.3390/jcm13082177
APA StyleSarrio-Sanz, P., Martinez-Cayuelas, L., Beltran-Perez, A., Muñoz-Montoya, M., Segura-Heras, J.-V., Gil-Guillen, V. F., & Gomez-Perez, L. (2024). A Novel Decision Tree Model for Predicting the Cancer-Specific Survival of Patients with Bladder Cancer Treated with Radical Cystectomy. Journal of Clinical Medicine, 13(8), 2177. https://doi.org/10.3390/jcm13082177