
The Natural History of Retinal Sensitivity Loss in Diabetic Macular Ischemia over One Year Evaluated by Microperimetry

 , ,
, ,
Abstract
1. Introduction
2. Materials and Methods
2.1. Study Design
2.2. Inclusion Criteria
2.3. Exclusion Criteria
2.4. Visual Acuity
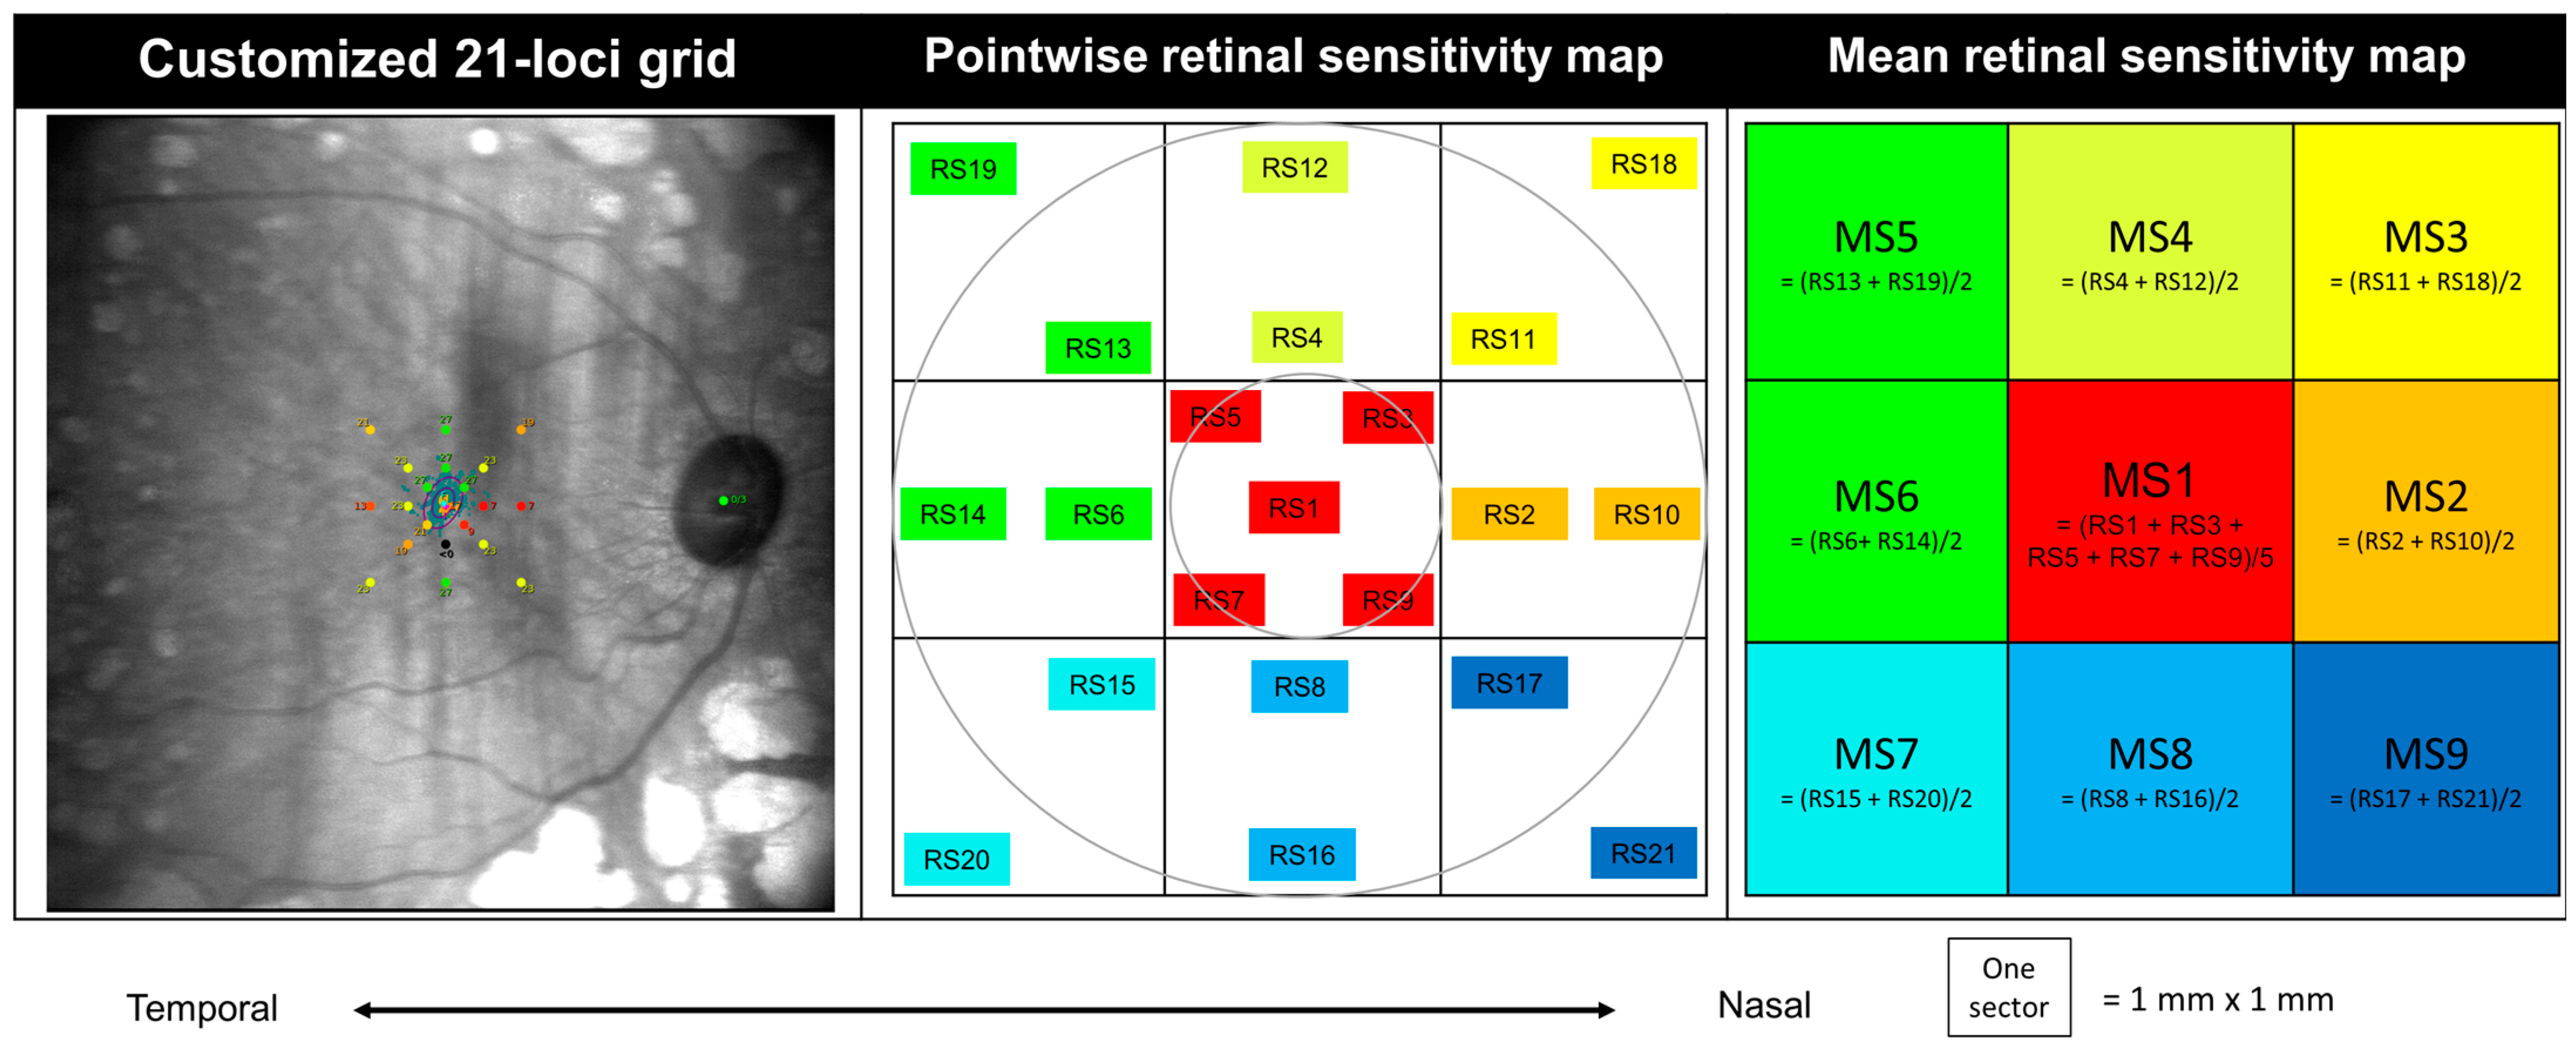
2.5. Microperimetry
2.6. Outcomes
2.7. Statistical Analysis
3. Results
3.1. Demographics and Ocular Characteristics
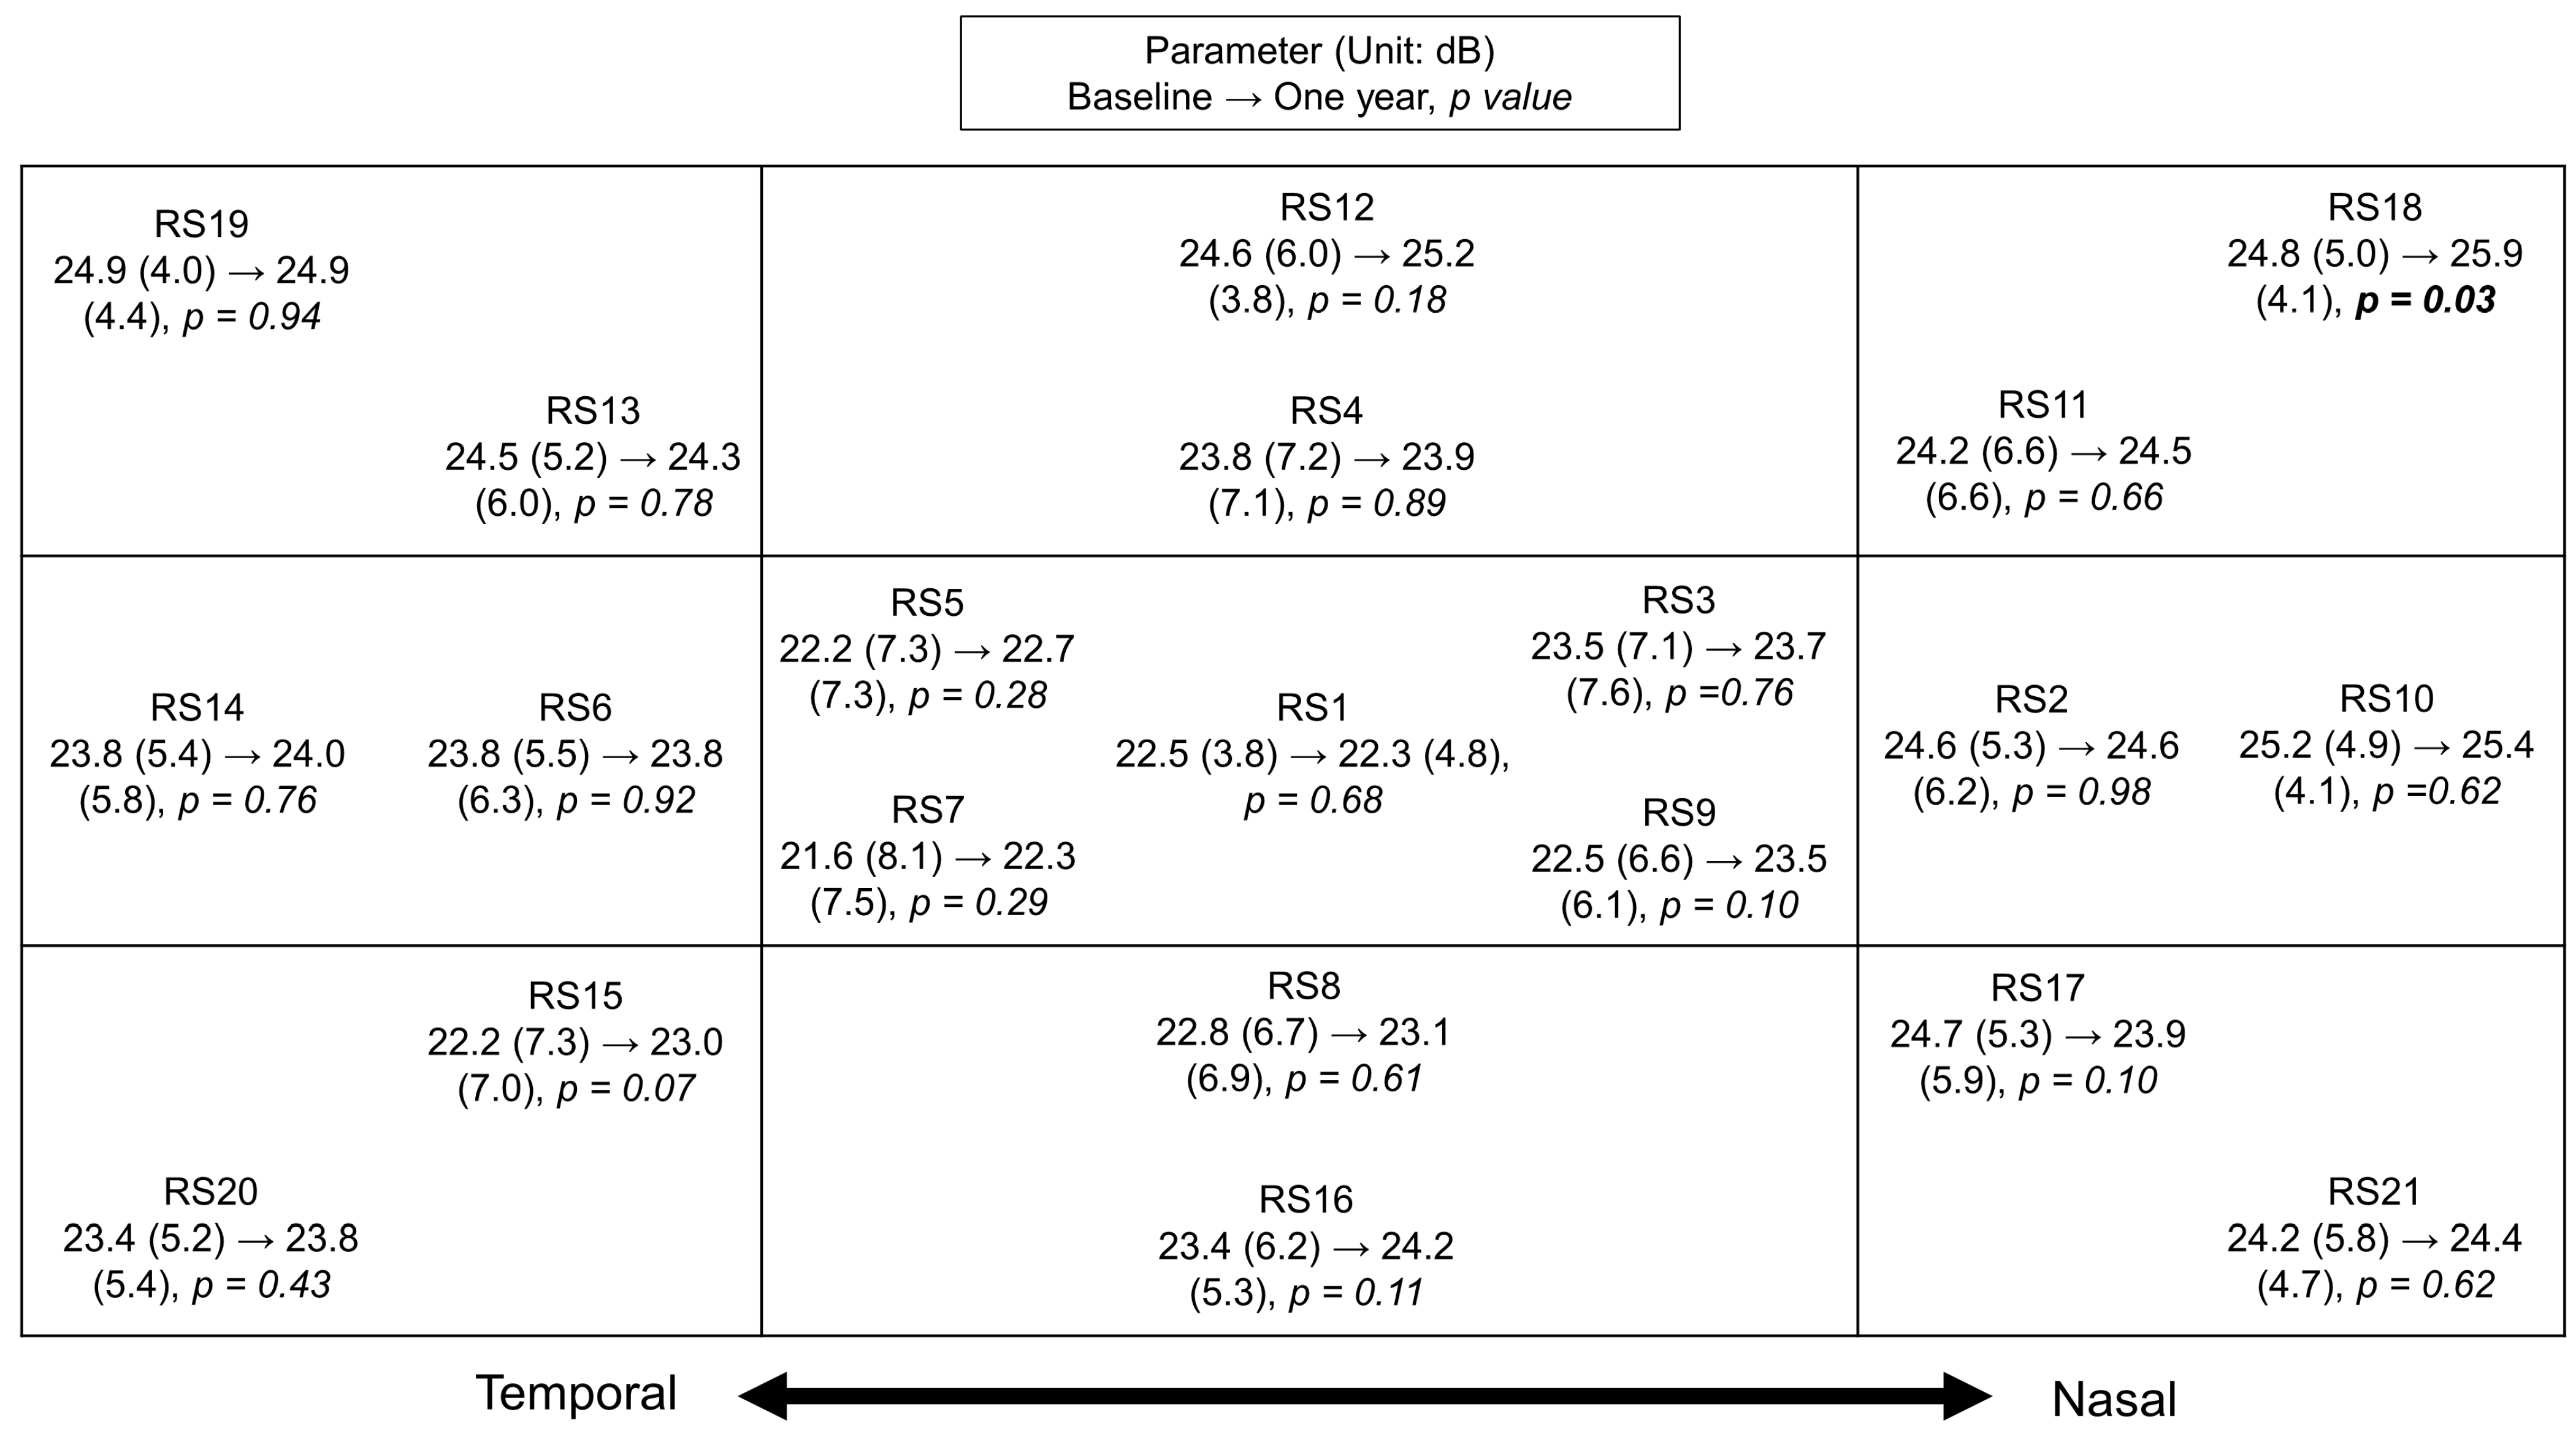
3.2. Microperimetry Changes in DMI over One Year
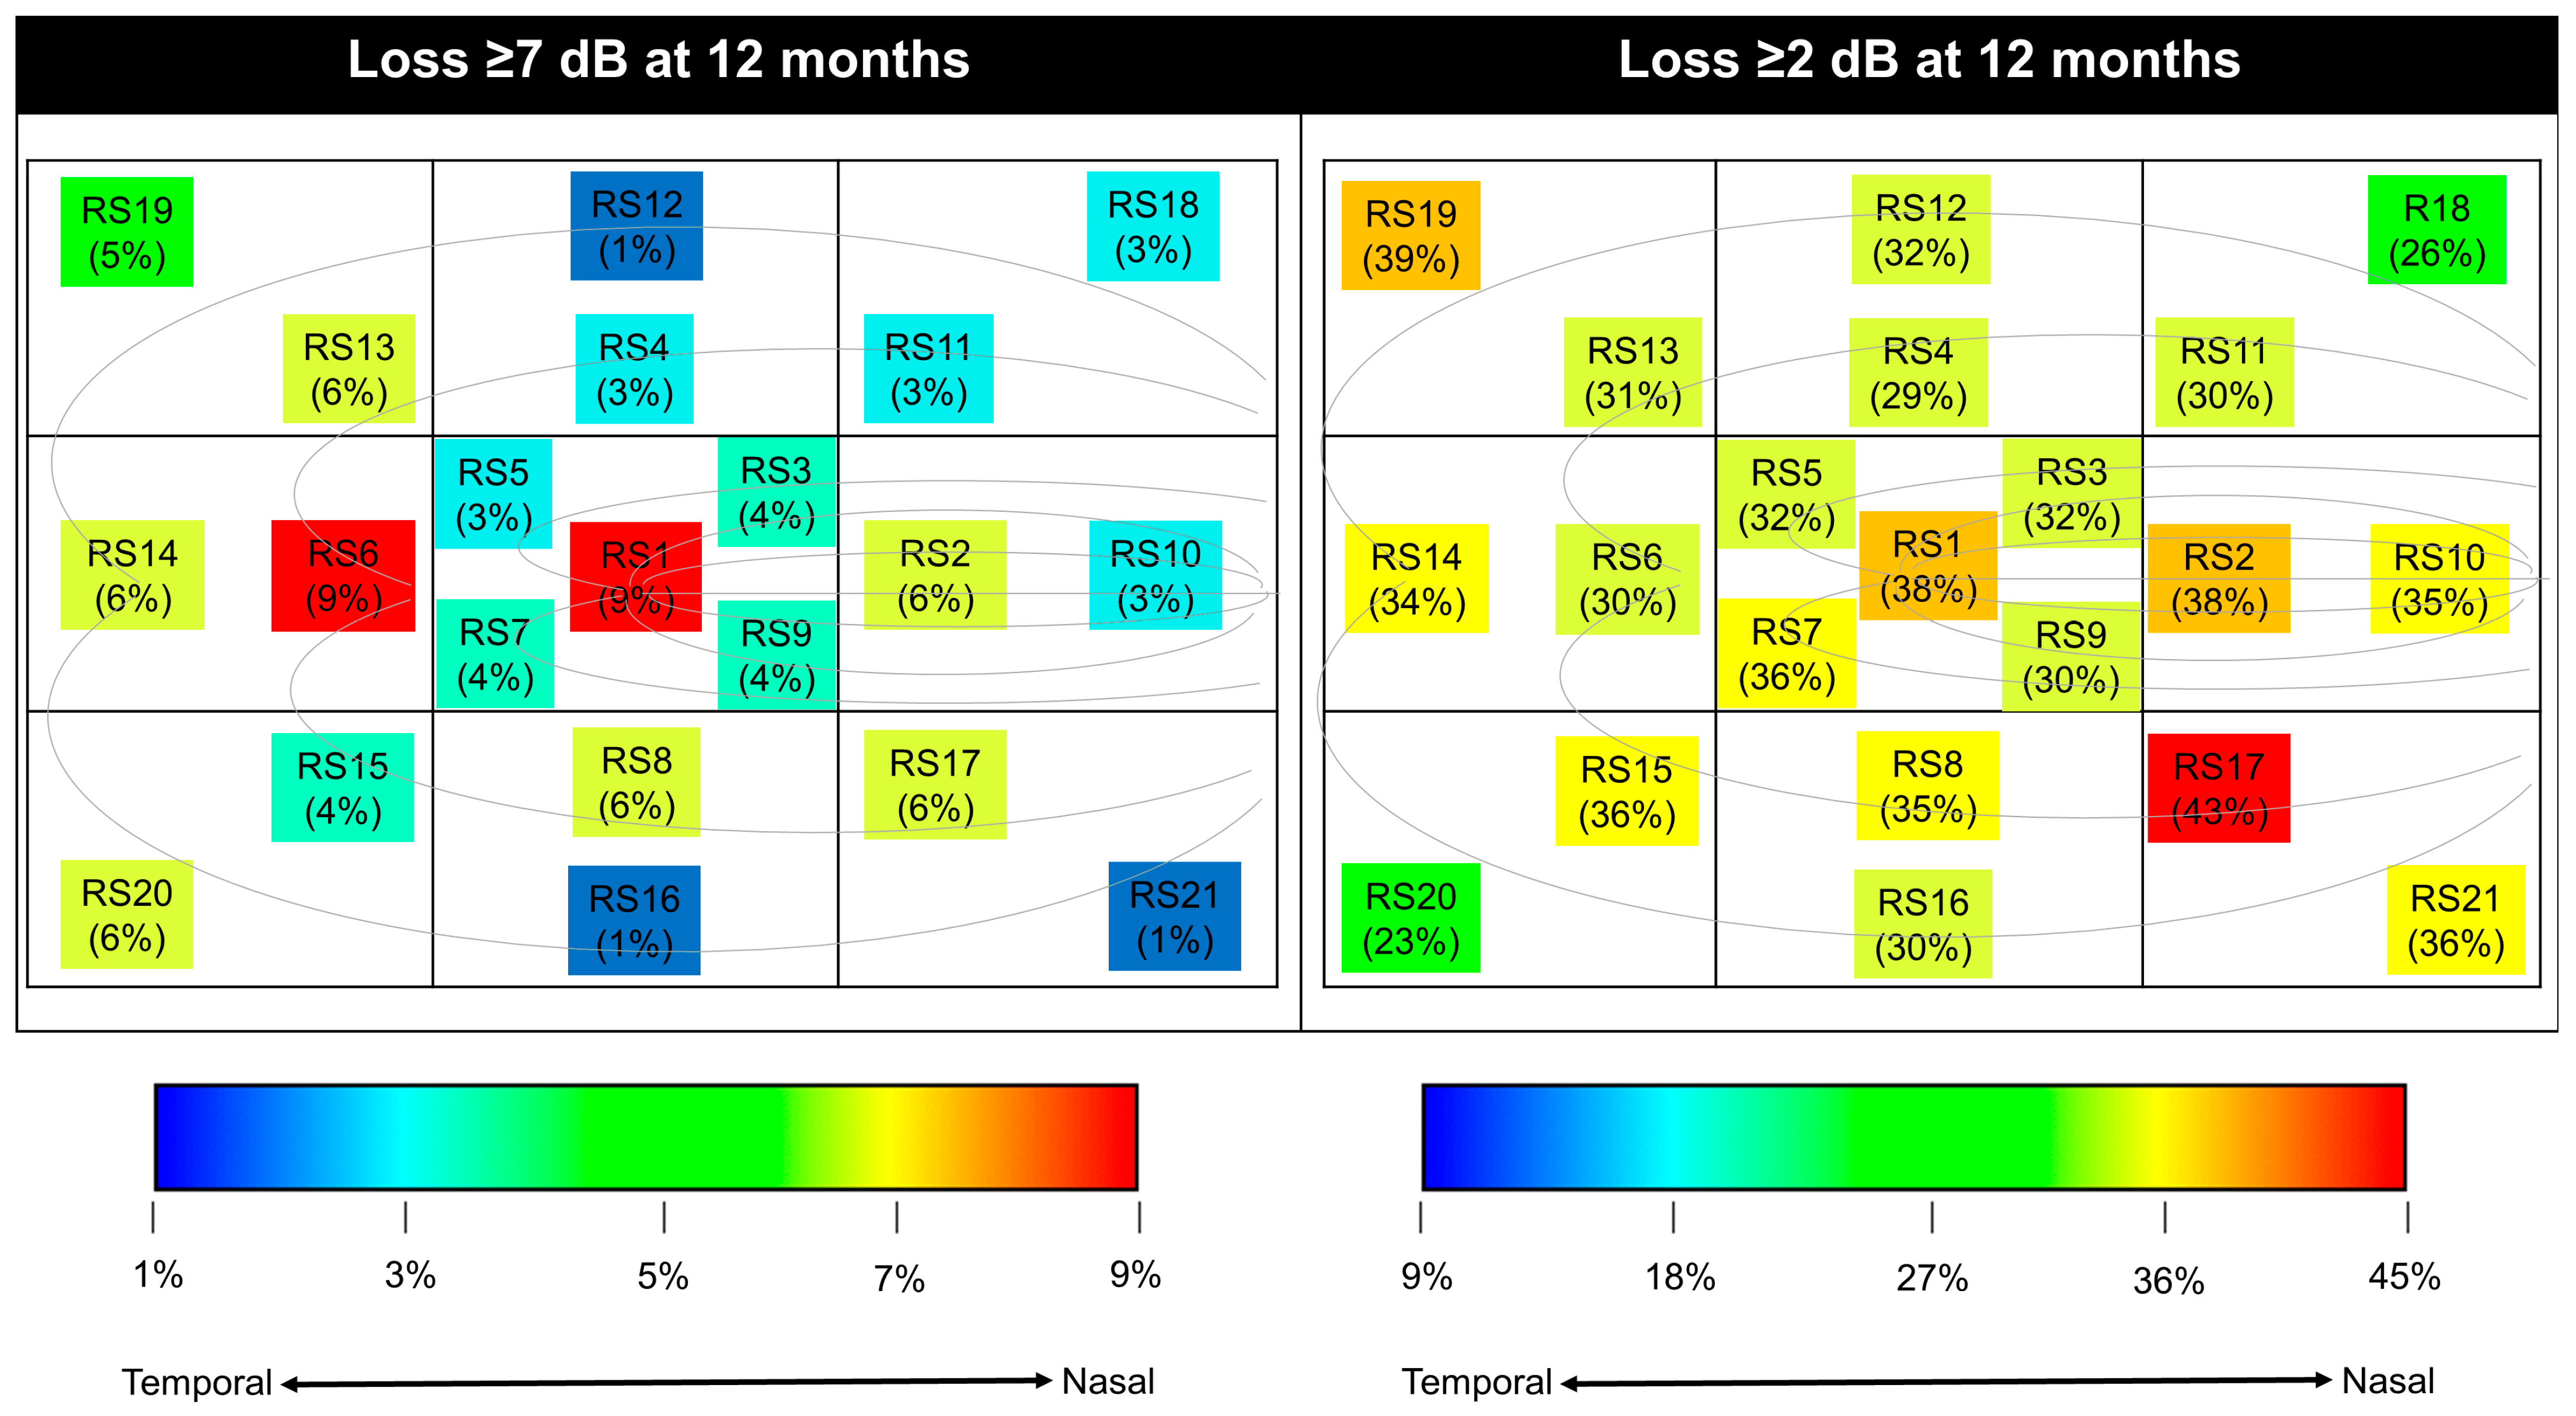
3.3. The Severity of RS Losses in DMI
3.4. The Distribution of RS Losses in DMI
3.5. The Utility of Baseline oRS 25 dB in Predicting Future Development in DMI
4. Discussion
5. Conclusions
Author Contributions
Funding
Institutional Review Board Statement
Informed Consent Statement
Data Availability Statement
Conflicts of Interest
References
- International Diabetes Federation. IDF Diabetes Atlas. Available online: www.diabetesatlas.org (accessed on 22 May 2023).
- Steinmetz, J.D.; Bourne, R.R.A.; Briant, P.S.; Flaxman, S.R.; Taylor, H.R.B.; Jonas, J.B.; Abdoli, A.A.; Abrha, W.A.; Abualhasan, A.; Abu-Gharbieh, E.G.; et al. Causes of blindness and vision impairment in 2020 and trends over 30 years, and prevalence of avoidable blindness in relation to VISION 2020: The Right to Sight: An analysis for the Global Burden of Disease Study. Lancet Glob. Health 2021, 9, e144–e160. [Google Scholar] [CrossRef]
- Sim, D.A.; Keane, P.A.; Zarranz-Ventura, J.; Fung, S.; Powner, M.B.; Platteau, E.; Bunce, C.V.; Fruttiger, M.; Patel, P.J.; Tufail, A.; et al. The Effects of Macular Ischemia on Visual Acuity in Diabetic Retinopathy. Investig. Ophthalmol. Vis. Sci. 2013, 54, 2353–2360. [Google Scholar] [CrossRef]
- Sim, D.A.; Keane, P.A.; Zarranz-Ventura, J.; Bunce, C.V.; Fruttiger, M.; Patel, P.J.; Tufail, A.; Egan, C.A. Predictive Factors for the Progression of Diabetic Macular Ischemia. Am. J. Ophthalmol. 2013, 156, 684–692. [Google Scholar] [CrossRef] [PubMed]
- Manousaridis, K.; Talks, J. Macular ischaemia: A contraindication for anti-VEGF treatment in retinal vascular disease? Br. J. Ophthalmol. 2012, 96, 179–184. [Google Scholar] [CrossRef] [PubMed]
- Usman, M. An Overview of Our Current Understanding of Diabetic Macular Ischemia (DMI). Cureus 2018, 10, e3064. [Google Scholar] [CrossRef]
- Chong, V.; Nguyen, Q.D.; Sepah, Y.; Giani, A.; Pearce, E. HORNBILL: A phase I/IIa trial examining the safety, tolerability and early response of BI 764524 in patients with diabetic retinopathy and diabetic macular ischaemia-rationale, study design and protocol. Trials 2022, 23, 669. [Google Scholar] [CrossRef] [PubMed]
- Cheung, G.; Pearce, E.; Fenner, B.; Sen, P.; Chong, V.; Sivaprasad, S. Looking Ahead: Visual and Anatomical Endpoints in Future Trials of Diabetic Macular Ischemia. Ophthalmologica 2021, 24, 24. [Google Scholar] [CrossRef]
- Tsai, W.S.; Thottarath, S.; Gurudas, S.; Pearce, E.; Giani, A.; Sivaprasad, S. Topographic Correlation of Microperimetry with Structural Characteristics in Diabetic Macular Ischemia. Am. J. Ophthalmol. 2023, 257, 25–33. [Google Scholar] [CrossRef]
- Molina-Martín, A.; Pérez-Cambrodí, R.J.; Piñero, D.P. Current Clinical Application of Microperimetry: A Review. Seminars in Ophthalmology 2018, 33, 620–628. [Google Scholar] [CrossRef]
- Yang, Y.; Dunbar, H. Clinical Perspectives and Trends: Microperimetry as a Trial Endpoint in Retinal Disease. Ophthalmologica 2021, 244, 418–450. [Google Scholar] [CrossRef]
- Gemmy Cheung, C.M.; Fawzi, A.; Teo, K.Y.C.; Fukuyama, H.; Sen, S.; Tsai, W.-S.; Sivaprasad, S. Diabetic macular ischaemia- a new therapeutic target? Prog. Retin. Eye Res. 2021, 89, 101033. [Google Scholar] [CrossRef]
- Parodi, M.B.; Triolo, G.; Morales, M.; Borrelli, E.; Cicinelli, M.V.; Cascavilla, M.L.; Bandello, F. MP1 and MAIA Fundus Perimetry in Healthy Subjects and Patients Affected by Retinal Dystrophies. Retina 2015, 35, 1662–1669. [Google Scholar] [CrossRef] [PubMed]
- Molina-Martín, A.; Piñero, D.P.; Pérez-Cambrodí, R.J. Normal Values for Microperimetry with the MAIA Microperimeter: Sensitivity and Fixation Analysis in Healthy Adults and Children. Eur. J. Ophthalmol. 2017, 27, 607–613. [Google Scholar] [CrossRef] [PubMed]
- Charng, J.; Sanfilippo, P.G.; Attia, M.S.; Dolliver, M.; Arunachalam, S.; Chew, A.L.; Wong, E.N.; Mackey, D.A.; Chen, F.K. Interpreting MAIA Microperimetry Using Age- and Retinal Loci-Specific Reference Thresholds. Transl. Vis. Sci. Technol. 2020, 9, 19. [Google Scholar] [CrossRef]
- CenterVue. MAIA Operating Manual; CenterVue: Padova, Italy, 2019. [Google Scholar]
- Mukherjee, D.; Lad, E.M.; Vann, R.R.; Jaffe, S.J.; Clemons, T.E.; Friedlander, M.; Chew, E.Y.; Jaffe, G.J.; Farsiu, S. Correlation Between Macular Integrity Assessment and Optical Coherence Tomography Imaging of Ellipsoid Zone in Macular Telangiectasia Type 2. Investig. Ophthalmol. Vis. Sci. 2017, 58, Bio291–Bio299. [Google Scholar] [CrossRef] [PubMed]
- Mokrane, A.; Zureik, A.; Bonnin, S.; Erginay, A.; Lavia, C.; Gaudric, A.; Tadayoni, R.; Couturier, A. Retinal Sensitivity Correlates with the Superficial Vessel Density and Inner Layer Thickness in Diabetic Retinopathy. Investig. Ophthalmol. Vis. Sci. 2021, 62, 28. [Google Scholar] [CrossRef] [PubMed]
- Hsu, S.T.; Thompson, A.C.; Stinnett, S.S.; Luhmann, U.F.O.; Vajzovic, L.; Horne, A.; Schuman, S.G.; Toth, C.A.; Cousins, S.W.; Lad, E.M. Longitudinal Study of Visual Function in Dry Age-Related Macular Degeneration at 12 Months. Ophthalmol. Retina 2019, 3, 637–648. [Google Scholar] [CrossRef] [PubMed]
- Weinreb, R.N.; Kaufman, P.L. The glaucoma research community and FDA look to the future: A report from the NEI/FDA CDER Glaucoma Clinical Trial Design and Endpoints Symposium. Investig. Ophthalmol. Vis. Sci. 2009, 50, 1497–1505. [Google Scholar] [CrossRef]
- Taylor, L.J.; Josan, A.S.; Jolly, J.K.; MacLaren, R.E. Microperimetry as an Outcome Measure in RPGR-associated Retinitis Pigmentosa Clinical Trials. Transl. Vis. Sci. Technol. 2023, 12, 4. [Google Scholar] [CrossRef]
- EDTRS. Classification of Diabetic Retinopathy from Fluorescein Angiograms: ETDRS Report Number 11. Ophthalmology 1991, 98, 807–822. [Google Scholar] [CrossRef]
- Cennamo, G.; Vecchio, E.C.; Finelli, M.; Velotti, N.; de Crecchio, G. Evaluation of ischemic diabetic maculopathy with Fourier-domain optical coherence tomography and microperimetry. Can. J. Ophthalmol. 2015, 50, 44–48. [Google Scholar] [CrossRef]
- Pereira, F.; Godoy, B.R.; Maia, M.; Regatieri, C.V. Microperimetry and OCT angiography evaluation of patients with ischemic diabetic macular edema treated with monthly intravitreal bevacizumab: A pilot study. Int. J. Retin. Vitr. 2019, 5, 24. [Google Scholar] [CrossRef]
- Testa, F.; Melillo, P.; Di Iorio, V.; Orrico, A.; Attanasio, M.; Rossi, S.; Simonelli, F. Macular Function and Morphologic Features in Juvenile Stargardt Disease: Longitudinal Study. Ophthalmology 2014, 121, 2399–2405. [Google Scholar] [CrossRef] [PubMed]
- Charng, J.; Lamey, T.M.; Thompson, J.A.; McLaren, T.L.; Attia, M.S.; McAllister, I.L.; Constable, I.J.; Mackey, D.A.; De Roach, J.N.; Chen, F.K. Edge of Scotoma Sensitivity as a Microperimetry Clinical Trial End Point in USH2A Retinopathy. Transl. Vis. Sci. Technol. 2020, 9, 9. [Google Scholar] [CrossRef]
- Schönbach, E.M.; Strauss, R.W.; Muñoz, B.; Wolfson, Y.; Ibrahim, M.A.; Birch, D.G.; Zrenner, E.; Sunness, J.S.; Ip, M.S.; Sadda, S.R.; et al. Longitudinal Microperimetric Changes of Macular Sensitivity in Stargardt Disease After 12 Months: ProgStar Report No. 13. JAMA Ophthalmol. 2020, 138, 772–779. [Google Scholar] [CrossRef] [PubMed]
- Nguyen, X.T.; Talib, M.; van Schooneveld, M.J.; Wijnholds, J.; van Genderen, M.M.; Schalij-Delfos, N.E.; Klaver, C.C.W.; Talsma, H.E.; Fiocco, M.; Florijn, R.J.; et al. CRB1-Associated Retinal Dystrophies: A Prospective Natural History Study in Anticipation of Future Clinical Trials. Am. J. Ophthalmol. 2022, 234, 37–48. [Google Scholar] [CrossRef] [PubMed]
- Santos, A.R.; Raimundo, M.; Alves, D.; Lopes, M.; Pestana, S.; Figueira, J.; Cunha-Vaz, J.; Silva, R. Microperimetry and mfERG as functional measurements in diabetic macular oedema undergoing intravitreal ranibizumab treatment. Eye 2021, 35, 1384–1392. [Google Scholar] [CrossRef]
- Vujosevic, S.; Martini, F.; Longhin, E.; Convento, E.; Cavarzeran, F.; Midena, E. Subthreshold Micropulse Yellow Laser versus Subthreshold Micropulse Infrared Laser in Center-Involving Diabetic Macular Edema: Morphologic and Functional Safety. Retina 2015, 35, 1594–1603. [Google Scholar] [CrossRef]
- Comyn, O.; Sivaprasad, S.; Peto, T.; Neveu, M.M.; Holder, G.E.; Xing, W.; Bunce, C.V.; Patel, P.J.; Egan, C.A.; Bainbridge, J.W.; et al. A randomized trial to assess functional and structural effects of ranibizumab versus laser in diabetic macular edema (the LUCIDATE study). Am. J. Ophthalmol. 2014, 157, 960–970. [Google Scholar] [CrossRef]
- Vujosevic, S.; Bottega, E.; Casciano, M.; Pilotto, E.; Convento, E.; Midena, E. Microperimetry and fundus autofluorescence in diabetic macular edema: Subthreshold micropulse diode laser versus modified early treatment diabetic retinopathy study laser photocoagulation. Retina 2010, 30, 908–916. [Google Scholar] [CrossRef]
- May, C.A.; Rutkowski, P. The Horizontal Raphe of the Human Retina and its Watershed Zones. Vision 2019, 3, 60. [Google Scholar] [CrossRef] [PubMed]
- Mohite, A.A.; Perais, J.A.; McCullough, P.; Lois, N. Retinal Ischaemia in Diabetic Retinopathy: Understanding and Overcoming a Therapeutic Challenge. J. Clin. Med. 2023, 12, 2406. [Google Scholar] [CrossRef] [PubMed]
- Van Stavern, G.P. Metabolic, hereditary, traumatic, and neoplastic optic neuropathies. Continuum 2014, 20, 877–906. [Google Scholar] [CrossRef] [PubMed]
- Levine, E.S.; Moult, E.M.; Greig, E.C.; Zhao, Y.; Pramil, V.; Gendelman, I.; Alibhai, A.Y.; Baumal, C.R.; Witkin, A.J.; Duker, J.S.; et al. Multiscale Correlation of Microvascular Changes on Optical Coherence Tomography Angiography with Retinal Sensitivity in Diabetic Retinopathy. Retina 2022, 42, 357–368. [Google Scholar] [CrossRef]
- Tababat-Khani, P.; Bengtsson, B.; Agardh, E. Effects of focal/grid laser treatment on the central visual field in diabetic macular oedema: A 2-year follow-up study. Acta Ophthalmol. 2016, 94, 240–245. [Google Scholar] [CrossRef]


| Demographics | All Participants (n =88) |
| Age, mean (SD), years | 58 (12) |
| Male, No. (%) | 53 (60%) |
| T1DM, No. (%) | 31 (35%) |
| T2DM, No. (%) | 57 (65%) |
| Duration of diabetes, mean (SD), years | 27 (14) |
| Ocular characteristics | All eligible eyes (n = 97) |
| BCVA, mean (SD), ETDRS letters | 78 (8) |
| ≥70 letters, No. (%) | 85 (88%) |
| LLVA, mean (SD), ETDRS letters | 67 (11) |
| ≥70 letters, No. (%) | 48 (50%) |
| LLD, mean (SD), ETDRS letters | 11 (7) |
| Pseudophakia, No. (%) | 42 (34%) |
| History of vitrectomy, No. (%) | 15 (12%) |
| History of DME, No. (%) | 22 (18%) |
| n = 97 | Baseline Mean (SD), dB | At One Year Mean (SD), dB | Changes | p Value Clustered a |
|---|---|---|---|---|
| Overall RS | 23.7 (4.2) | 23.9 (3.9) | 0.3 (2.6) | 0.33 |
| <25 dB No. (%) | 50 (52%) | 50 (52%) | 0 (0%) | - |
| Parafoveal RS | 24.0 (4.3) | 24.2 (4.0) | 0.2 (2.9) | 0.54 |
| Regional sensitivity | ||||
| MS1 (central) | 22.5 (5.0) | 22.9 (4.9) | 0.4 (2.9) | 0.21 |
| MS2 (nasal) | 24.9 (4.5) | 25.0 (4.6) | 0.1 (3.8) | 0.79 |
| MS3 (superonasal) | 24.5 (5.2) | 25.2 (4.4) | 0.7 (4.1) | 0.12 |
| MS4 (superior) | 24.2 (5.9) | 24.5 (4.8) | 0.4 (3.4) | 0.33 |
| MS5 (superotemporal) | 24.7 (3.9) | 24.6 (4.1) | −0.1 (3.6) | 0.86 |
| MS6 (temporal) | 23.8 (4.9) | 23.9 (5.4) | 0.1 (4.8) | 0.82 |
| MS7 (inferotemporal) | 22.8 (5.4) | 23.4 (5.2) | 0.6 (3.8) | 0.12 |
| MS8 (inferior) | 23.6 (4.9) | 24.0 (4.6) | 0.4 (4.0) | 0.34 |
| MS9 (inferonasal) | 24.4 (4.9) | 24.1 (4.3) | −0.3 (4.0) | 0.47 |
| MP at One Year Compared to Baseline (n = 97) | Loss ≥7 dB No. (%) | Loss ≥2 dB No. (%) | Any Loss No. (%) | Loss ≥7 dB in ≥5 Loci No. (%) | Loss ≥2 dB in ≥5 Loci No. (%) | Any Loss in ≥5 Loci No. (%) |
|---|---|---|---|---|---|---|
| Overall RS (Macula) | 1 (1%) | 10 (10%) | 42 (43%) | 4 (4%) | 71 (73%) | 71 (73%) |
| Parafoveal RS (Parafovea) | 2 (2%) | 13 (13%) | 46 (47%) | 1 (1%) | 44 (45%) | 44 (45%) |
| Regional sensitivity | ||||||
| MS1 (central fovea) | 1 (1%) | 16 (16%) | 40 (41%) | 0 (0%) | 2 (2%) | 3 (3%) |
| MS2 (nasal) | 2 (2%) | 29 (30%) | 41 (42%) | - | - | - |
| MS3 (superonasal) | 4 (4%) | 25 (26%) | 31 (32%) | - | - | - |
| MS4 (superior) | 2 (2%) | 25 (26%) | 39 (40%) | - | - | - |
| MS5 (superotemporal) | 3 (3%) | 24 (25%) | 42 (43%) | - | - | - |
| MS6 (temporal) | 7 (7%) | 24 (25%) | 35 (36%) | - | - | - |
| MS7 (inferotemporal) | 3 (3%) | 18 (19%) | 33 (34%) | - | - | - |
| MS8 (inferior) | 3 (3%) | 25 (26%) | 37 (38%) | - | - | - |
| MS9 (inferonasal) | 1 (1%) | 32 (33%) | 49 (51%) | - | - | - |
| Pointwise sensitivity | ||||||
| RS1 | 8 (8%) | 39 (40%) | 39 (40%) | - | - | - |
| RS2 | 5 (5%) | 37 (38%) | 37 (38%) | - | - | - |
| RS3 | 3 (3%) | 34 (35%) | 36 (37%) | - | - | - |
| RS4 | 3 (3%) | 33 (34%) | 35 (36%) | - | - | - |
| RS5 | 2 (2%) | 36 (37%) | 38 (39%) | - | - | - |
| RS6 | 8 (8%) | 31 (32%) | 31 (32%) | - | - | - |
| RS7 | 5 (5%) | 33 (34%) | 34 (35%) | - | - | - |
| RS8 | 7 (7%) | 34 (35%) | 36 (37%) | - | - | - |
| RS9 | 6 (6%) | 30 (31%) | 30 (31%) | - | - | - |
| RS10 | 2 (2%) | 40 (41%) | 40 (41%) | - | - | - |
| RS11 | 4 (4%) | 34 (35%) | 35 (36%) | - | - | - |
| RS12 | 1 (1%) | 30 (31%) | 31 (32%) | - | - | - |
| RS13 | 5 (5%) | 31 (32%) | 32 (33%) | - | - | - |
| RS14 | 6 (6%) | 34 (35%) | 34 (35%) | - | - | - |
| RS15 | 5 (5%) | 33 (34%) | 33 (34%) | - | - | - |
| RS16 | 1 (1%) | 30 (31%) | 32 (33%) | - | - | - |
| RS17 | 7 (7%) | 45 (46%) | 46 (47%) | - | - | - |
| RS18 | 2 (2%) | 29 (30%) | 31 (32%) | - | - | - |
| RS19 | 4 (4%) | 38 (39%) | 39 (40%) | - | - | - |
| RS20 | 6 (6%) | 26 (27%) | 27 (28%) | - | - | - |
| RS21 | 2 (2%) | 35 (36%) | 36 (37%) | - | - | - |
| Microperimetry No. (%) n = 97 | Loss ≥7 dB at One Year | Loss ≥2 dB at One Year | Any Loss at One Year | ||||||
|---|---|---|---|---|---|---|---|---|---|
| Baseline Overall RS <25 dB n = 50 | Baseline Overall RS ≥25 dB n = 47 | p Value | Baseline Overall RS <25 dB n = 50 | Baseline Overall RS ≥25 dB n = 47 | p Value a | Baseline Overall RS <25 dB n = 50 | Baseline Overall RS ≥25 dB n = 47 | p Value a | |
| Overall RS | 0 (0%) | 1 (2%) | NA b | 4 (8%) | 6 (13%) | 0.54 | 16 (32%) | 26 (55%) | 0.01 |
| Parafoveal RS | 0 (0%) | 2 (4%) | NA b | 5 (10%) | 8 (17%) | 0.46 | 19 (38%) | 27 (57%) | 0.04 |
| Regional sensitivity | |||||||||
| MS1 | 0 (0%) | 1 (2%) | NA b | 8 (16%) | 8 (17%) | 0.90 | 18 (36%) | 22 (47%) | 0.24 |
| MS2 | 1 (2%) | 1 (2%) | NA b | 15 (30%) | 14 (30%) | 0.91 | 18 (36%) | 23 (49%) | 0.16 |
| MS3 | 1 (2%) | 3 (6%) | NA b | 11 (22%) | 14 (30%) | 0.34 | 14 (28%) | 17 (36%) | 0.35 |
| MS4 | 1 (2%) | 1 (2%) | NA b | 11 (22%) | 14 (30%) | 0.32 | 14 (28%) | 25 (53%) | 0.01 |
| MS5 | 1 (2%) | 2 (4%) | NA b | 12 (24%) | 12 (26%) | 0.90 | 18 (36%) | 24 (51%) | 0.10 |
| MS6 | 4 (8%) | 3 (6%) | 0.63 | 12 (24%) | 12 (26%) | 0.77 | 17 (34%) | 18 (38%) | 0.66 |
| MS7 | 0 (0%) | 3 (6%) | NA b | 9 (18%) | 9 (19%) | 0.88 | 15 (30%) | 18 (38%) | 0.19 |
| MS8 | 1 (2%) | 2 (4%) | NA b | 16 (32%) | 9 (19%) | 0.11 | 22 (44%) | 15 (32%) | 0.21 |
| MS9 | 0 (0%) | 1 (2%) | NA b | 17 (34%) | 15 (32%) | 0.81 | 24 (48%) | 25 (53%) | 0.72 |
| Pointwise sensitivity | |||||||||
| RS1 | 3 (6%) | 5 (11%) | 0.43 | 22 (44%) | 17 (36%) | 0.43 | 22 (44%) | 17 (36%) | 0.43 |
| RS2 | 3 (6%) | 2 (4%) | 0.67 | 18 (36%) | 19 (40%) | 0.63 | 18 (36%) | 19 (40%) | 0.63 |
| RS3 | 3 (6%) | 0 (0%) | NA b | 17 (34%) | 17 (36%) | 0.83 | 19 (38%) | 17 (36%) | 0.88 |
| RS4 | 3 (6%) | 0 (0%) | NA b | 13 (26%) | 20 (43%) | 0.10 | 14 (28%) | 21 (45%) | 0.09 |
| RS5 | 2 (4%) | 0 (0%) | NA b | 20 (40%) | 16 (34%) | 0.46 | 21 (42%) | 17 (36%) | 0.47 |
| RS6 | 6 (12%) | 2 (4%) | 0.28 | 17 (34%) | 14 (30%) | 0.70 | 17 (34%) | 14 (30%) | 0.70 |
| RS7 | 3 (6%) | 2 (4%) | 0.67 | 14 (28%) | 19 (40%) | 0.26 | 15 (30%) | 19 (40%) | 0.41 |
| RS8 | 6 (12%) | 1 (2%) | NA b | 14 (28%) | 20 (43%) | 0.16 | 16 (32%) | 20 (43%) | 0.29 |
| RS9 | 1 (2%) | 6 (11%) | NA b | 12 (24%) | 18 (38%) | 0.14 | 12 (24%) | 18 (38%) | 0.14 |
| RS10 | 1 (2%) | 1 (2%) | NA b | 18 (36%) | 22 (47%) | 0.23 | 18 (36%) | 22 (47%) | 0.23 |
| RS11 | 1 (2%) | 3 (6%) | NA b | 16 (32%) | 18 (38%) | 0.47 | 17 (34%) | 18 (38%) | 0.59 |
| RS12 | 0 (0%) | 1 (2%) | NA b | 10 (20%) | 20 (43%) | 0.02 | 10 (20%) | 21 (45%) | 0.01 |
| RS13 | 1 (2%) | 4 (9%) | NA b | 14 (28%) | 17 (36%) | 0.30 | 15 (30%) | 17 (36%) | 0.41 |
| RS14 | 4 (8%) | 2 (4%) | 0.50 | 13 (26%) | 21 (45%) | 0.03 | 13 (26%) | 21 (45%) | 0.03 |
| RS15 | 3 (6%) | 2 (4%) | 0.70 | 15 (30%) | 18 (38%) | 0.37 | 15 (30%) | 18 (38%) | 0.37 |
| RS16 | 1 (2%) | 0 (0%) | NA b | 13 (26%) | 17 (36%) | 0.26 | 15 (30%) | 17 (36%) | 0.51 |
| RS17 | 5 (10%) | 2 (4%) | 0.30 | 24 (48%) | 21 (45%) | 0.75 | 24 (48%) | 22 (47%) | 0.91 |
| RS18 | 1 (2%) | 1 (2%) | NA b | 13 (26%) | 16 (34%) | 0.38 | 15 (30%) | 16 (34%) | 0.68 |
| RS19 | 4 (8%) | 0 (0%) | NA b | 18 (36%) | 20 (43%) | 0.54 | 18 (36%) | 21 (45%) | 0.40 |
| RS20 | 3 (6%) | 3 (6%) | 0.98 | 12 (24%) | 14 (30%) | 0.48 | 12 (24%) | 15 (32%) | 0.34 |
| RS21 | 0 (0%) | 2 (4%) | NA b | 14 (28%) | 21 (45%) | 0.09 | 15 (30%) | 21 (45%) | 0.13 |
| Microperimetry Region No. (%) n = 97 | Loss ≥7 dB in ≥5 Loci at One Year | Loss ≥2 dB in ≥5 Loci at One Year | Any Loss in ≥5 Loci at One Year | ||||||
|---|---|---|---|---|---|---|---|---|---|
| Baseline Overall RS <25 dB n = 50 | Baseline Overall RS ≥25 dB n = 47 | p Value | Baseline Overall RS <25 dB n = 50 | Baseline Overall RS ≥25 dB n = 47 | p Value a | Baseline Overall RS <25 dB n = 50 | Baseline Overall RS ≥25 dB n = 47 | p Value a | |
| Macula (21 loci) | 2 (4%) | 2 (4%) | Na b | 33 (66%) | 38 (81%) | 0.10 | 33 (66%) | 38 (81%) | 0.10 |
| Parafovea (12 loci) | 0 (0%) | 1 (2%) | Na b | 18 (36%) | 26 (55%) | 0.05 | 18 (36%) | 26 (55%) | 0.05 |
| Central fovea (5 loci) | 0 (0%) | 0 (0%) | Na b | 1 (2%) | 1 (2%) | Na b | 2 (4%) | 0 (0%) | Na b |
Disclaimer/Publisher’s Note: The statements, opinions and data contained in all publications are solely those of the individual author(s) and contributor(s) and not of MDPI and/or the editor(s). MDPI and/or the editor(s) disclaim responsibility for any injury to people or property resulting from any ideas, methods, instructions or products referred to in the content. |
© 2024 by the authors. Licensee MDPI, Basel, Switzerland. This article is an open access article distributed under the terms and conditions of the Creative Commons Attribution (CC BY) license (https://creativecommons.org/licenses/by/4.0/).
Share and Cite
Tsai, W.-S.; Thottarath, S.; Gurudas, S.; Zhao, J.; Cheung, C.M.G.; Yamaguchi, T.C.N.; Giani, A.; Pearce, E.; Sivaprasad, S. The Natural History of Retinal Sensitivity Loss in Diabetic Macular Ischemia over One Year Evaluated by Microperimetry. J. Clin. Med. 2024, 13, 2219. https://doi.org/10.3390/jcm13082219
Tsai W-S, Thottarath S, Gurudas S, Zhao J, Cheung CMG, Yamaguchi TCN, Giani A, Pearce E, Sivaprasad S. The Natural History of Retinal Sensitivity Loss in Diabetic Macular Ischemia over One Year Evaluated by Microperimetry. Journal of Clinical Medicine. 2024; 13(8):2219. https://doi.org/10.3390/jcm13082219
Chicago/Turabian StyleTsai, Wei-Shan, Sridevi Thottarath, Sarega Gurudas, Jinzhi Zhao, Chui Ming Gemmy Cheung, Taffeta Ching Ning Yamaguchi, Andrea Giani, Elizabeth Pearce, and Sobha Sivaprasad. 2024. "The Natural History of Retinal Sensitivity Loss in Diabetic Macular Ischemia over One Year Evaluated by Microperimetry" Journal of Clinical Medicine 13, no. 8: 2219. https://doi.org/10.3390/jcm13082219
APA StyleTsai, W.-S., Thottarath, S., Gurudas, S., Zhao, J., Cheung, C. M. G., Yamaguchi, T. C. N., Giani, A., Pearce, E., & Sivaprasad, S. (2024). The Natural History of Retinal Sensitivity Loss in Diabetic Macular Ischemia over One Year Evaluated by Microperimetry. Journal of Clinical Medicine, 13(8), 2219. https://doi.org/10.3390/jcm13082219