


Resistance Training to Muscle Failure with Variable Load Intensities: Implications for Post-Exercise Blood Pressure and Heart Rate Variability in Trained Men

 , , ,
, , , 
Abstract
1. Introduction
2. Materials and Methods
2.1. Experimental Design
2.2. Subjects
2.3. Procedures
2.3.1. One-Repetition Maximum Test (1RM)
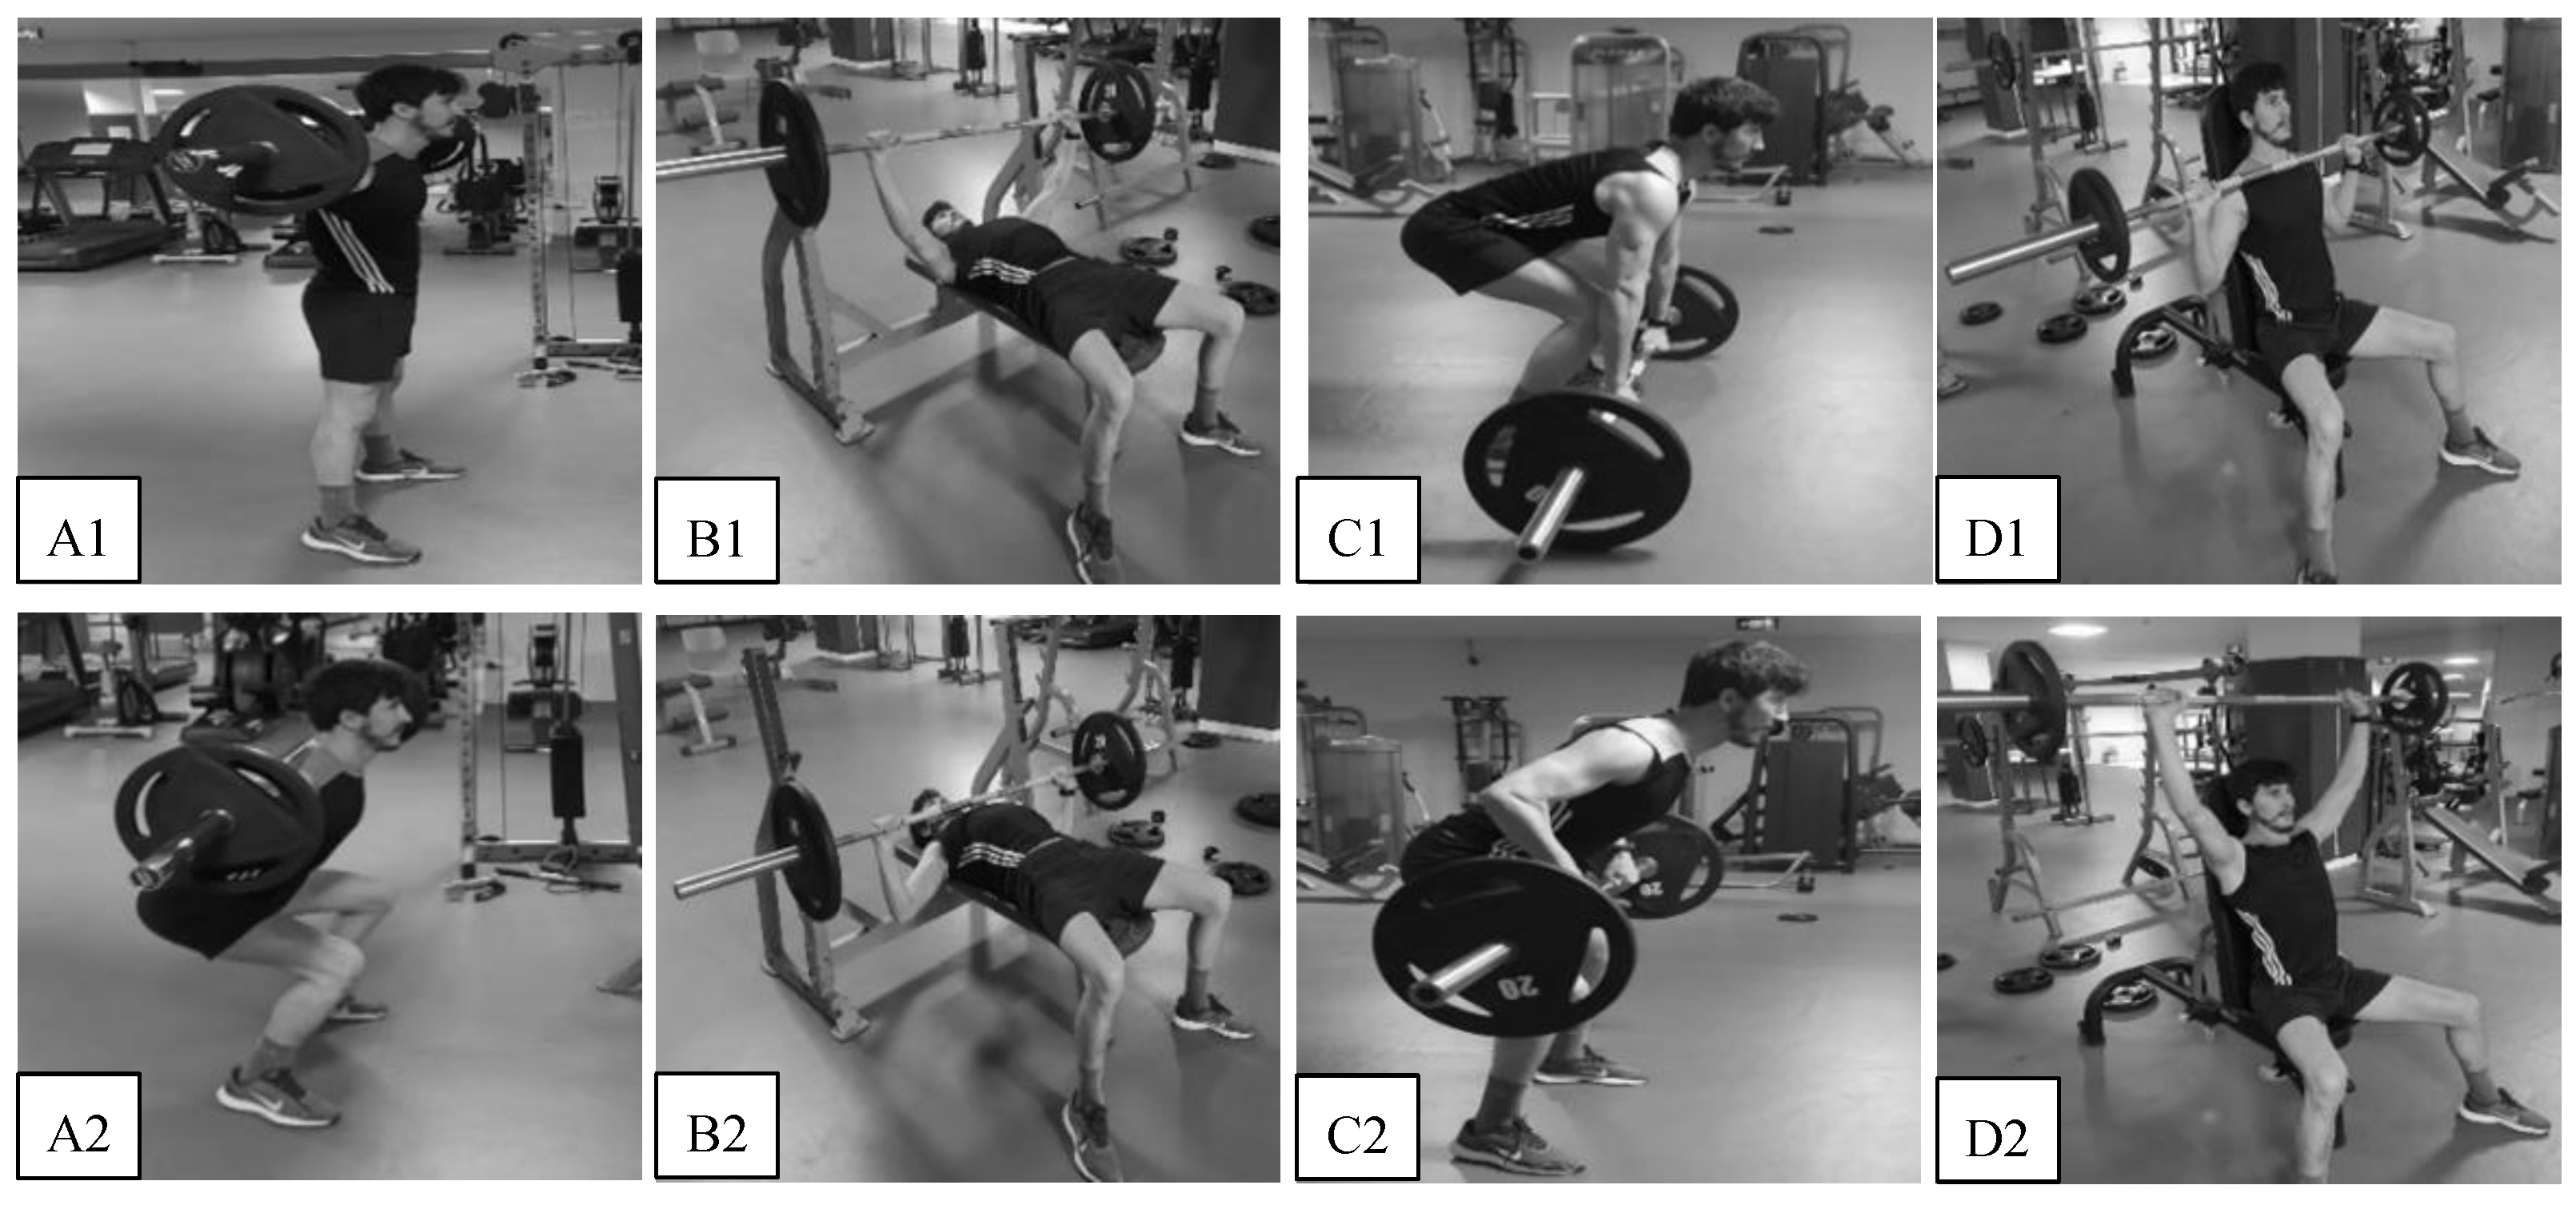
2.3.2. Training Interventions
2.3.3. Rating of Perceived Exertion Assessment
2.3.4. Blood Pressure Assessment
2.3.5. Heart Rate Variability Assessment
2.4. Statistical Analysis
3. Results
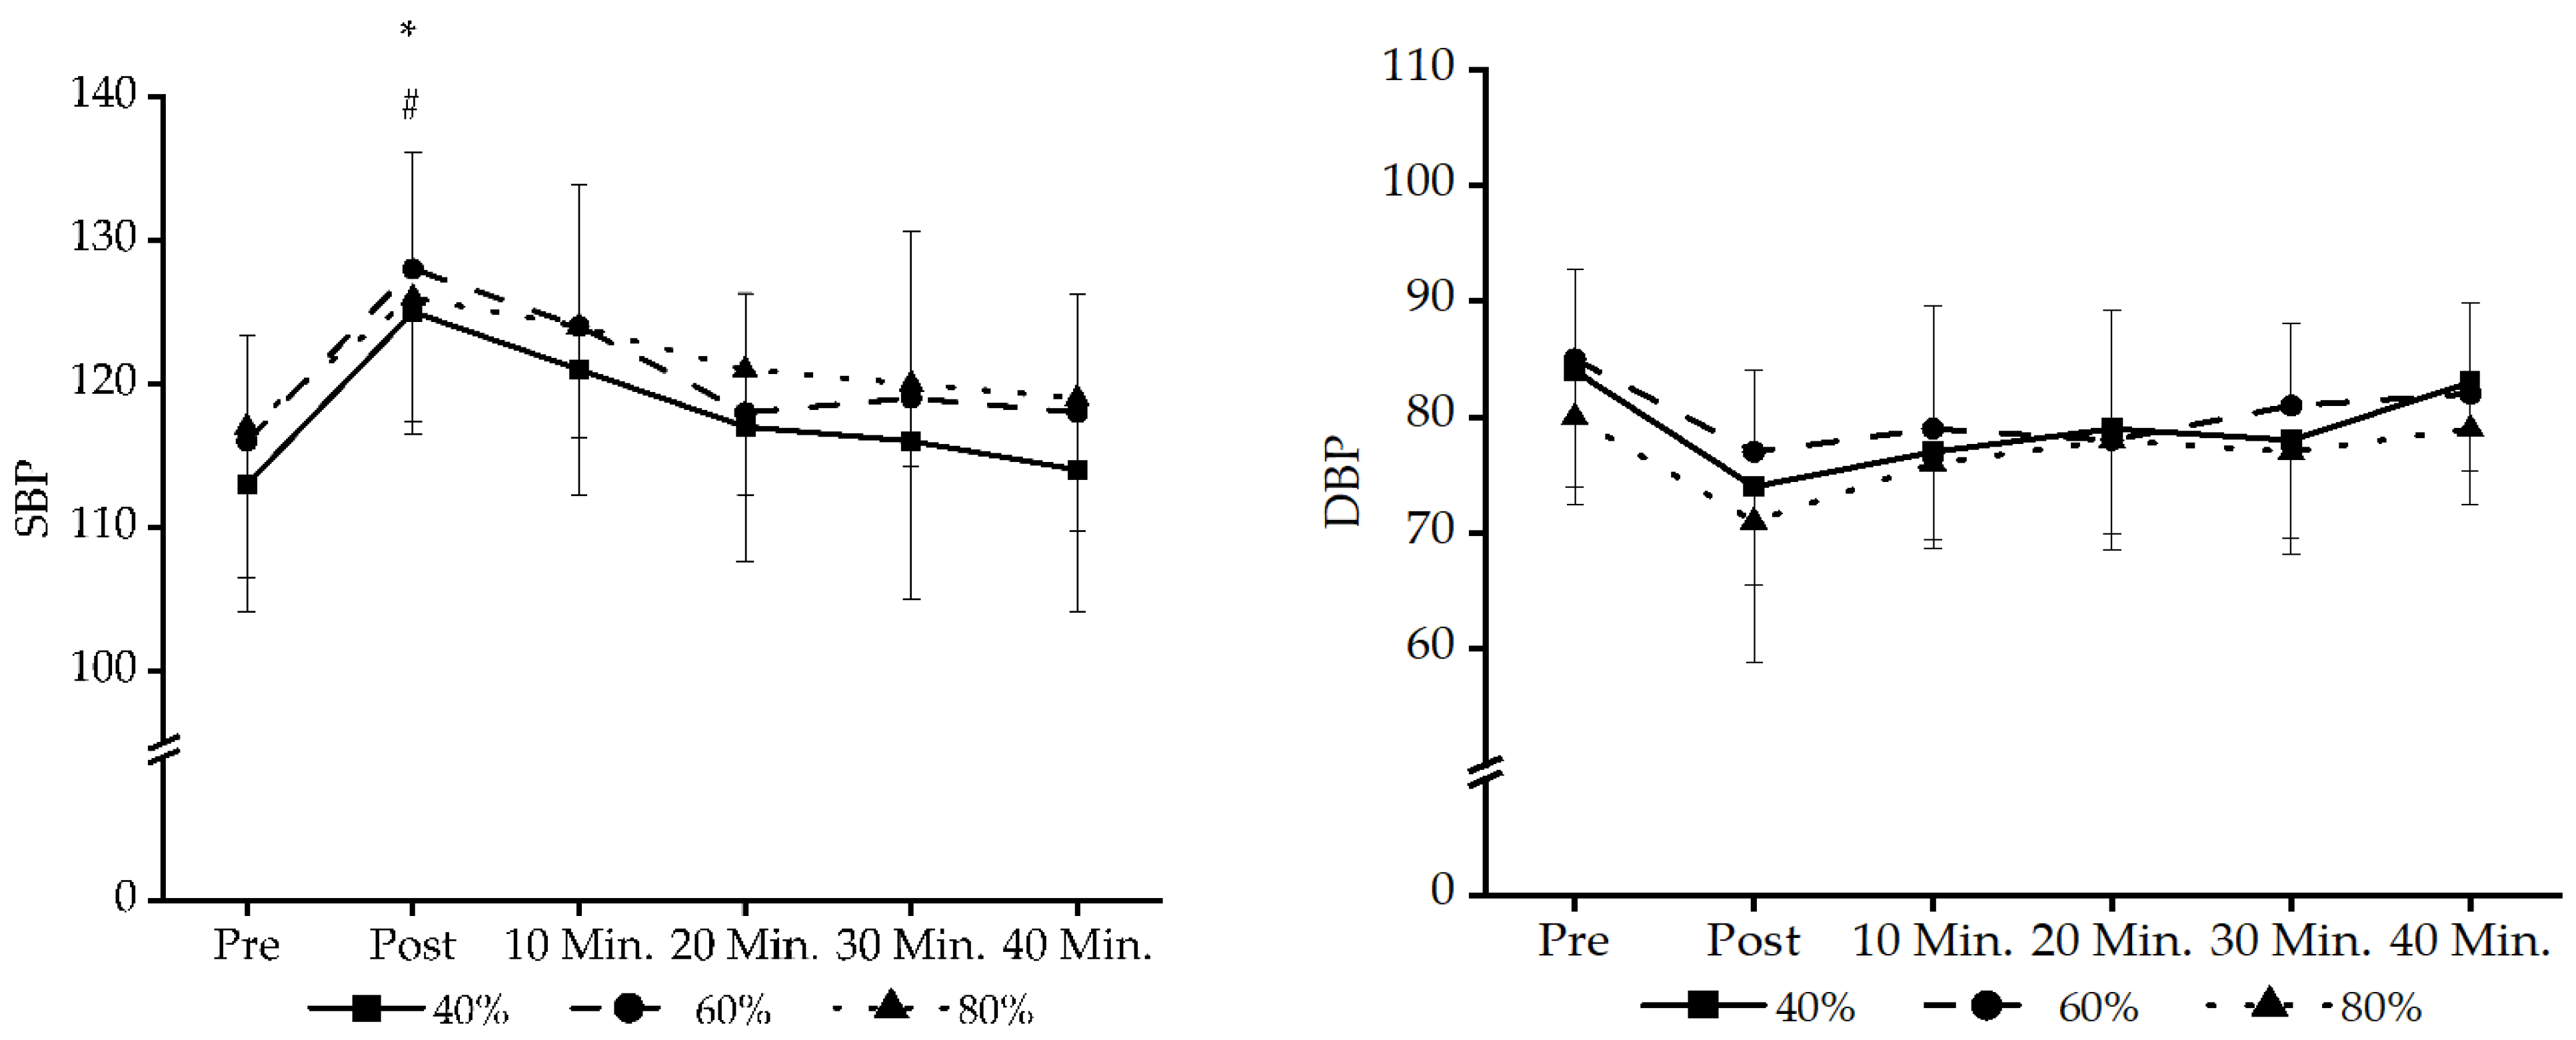
3.1. BP Data
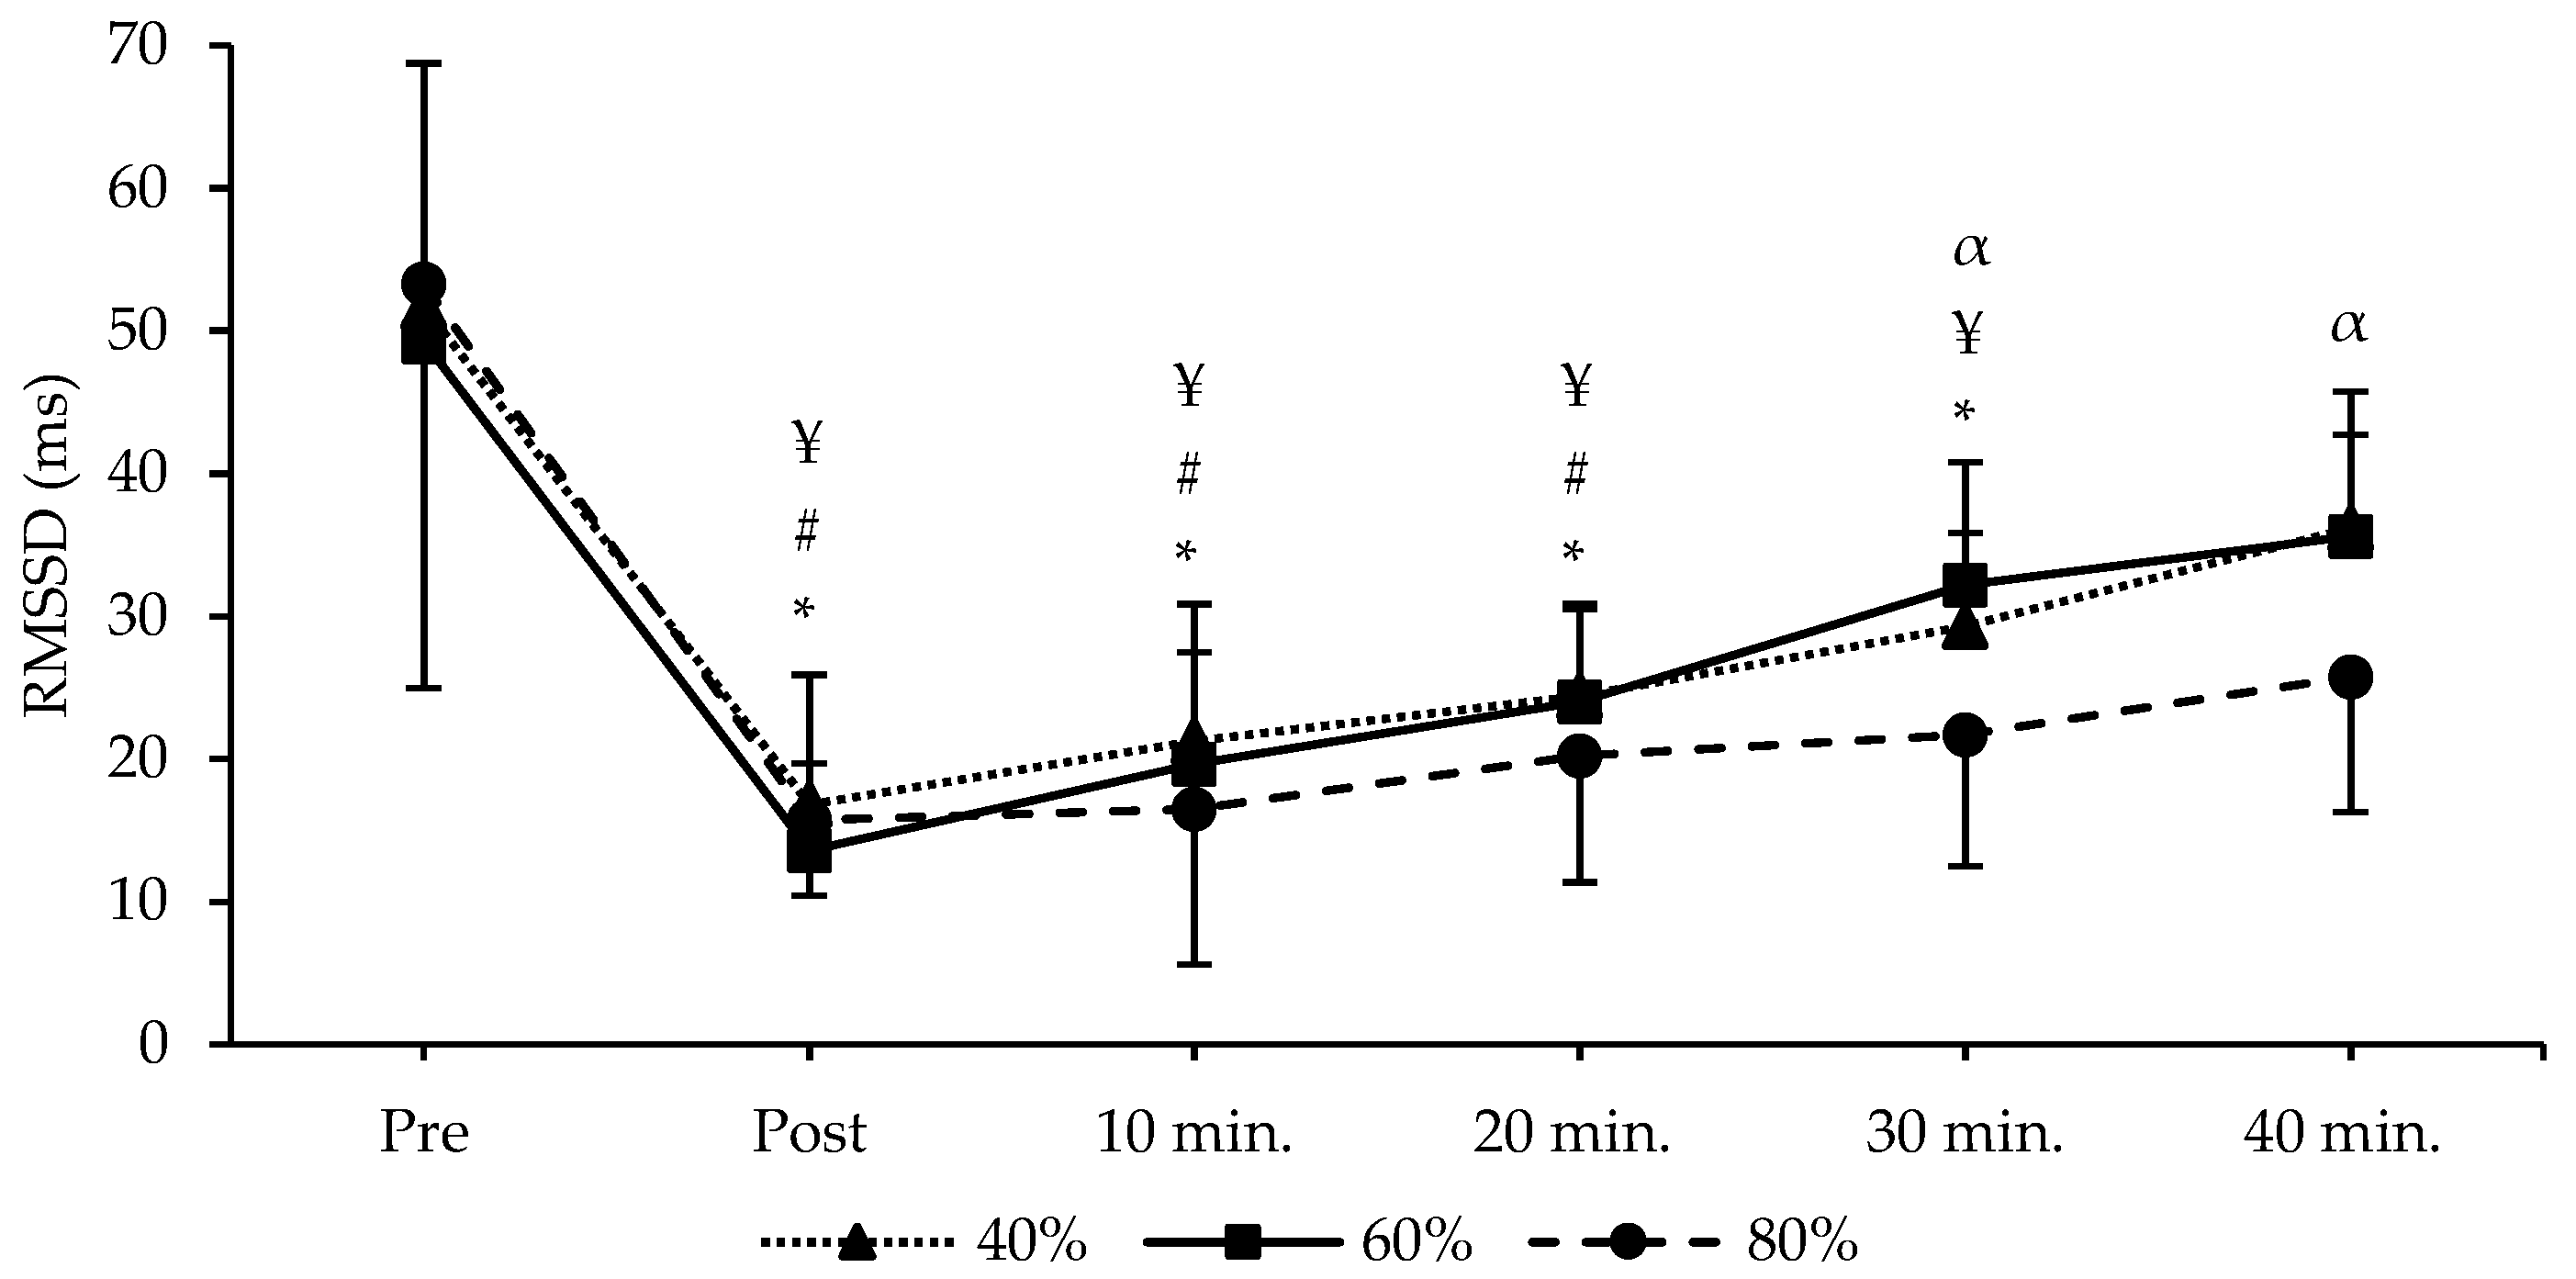
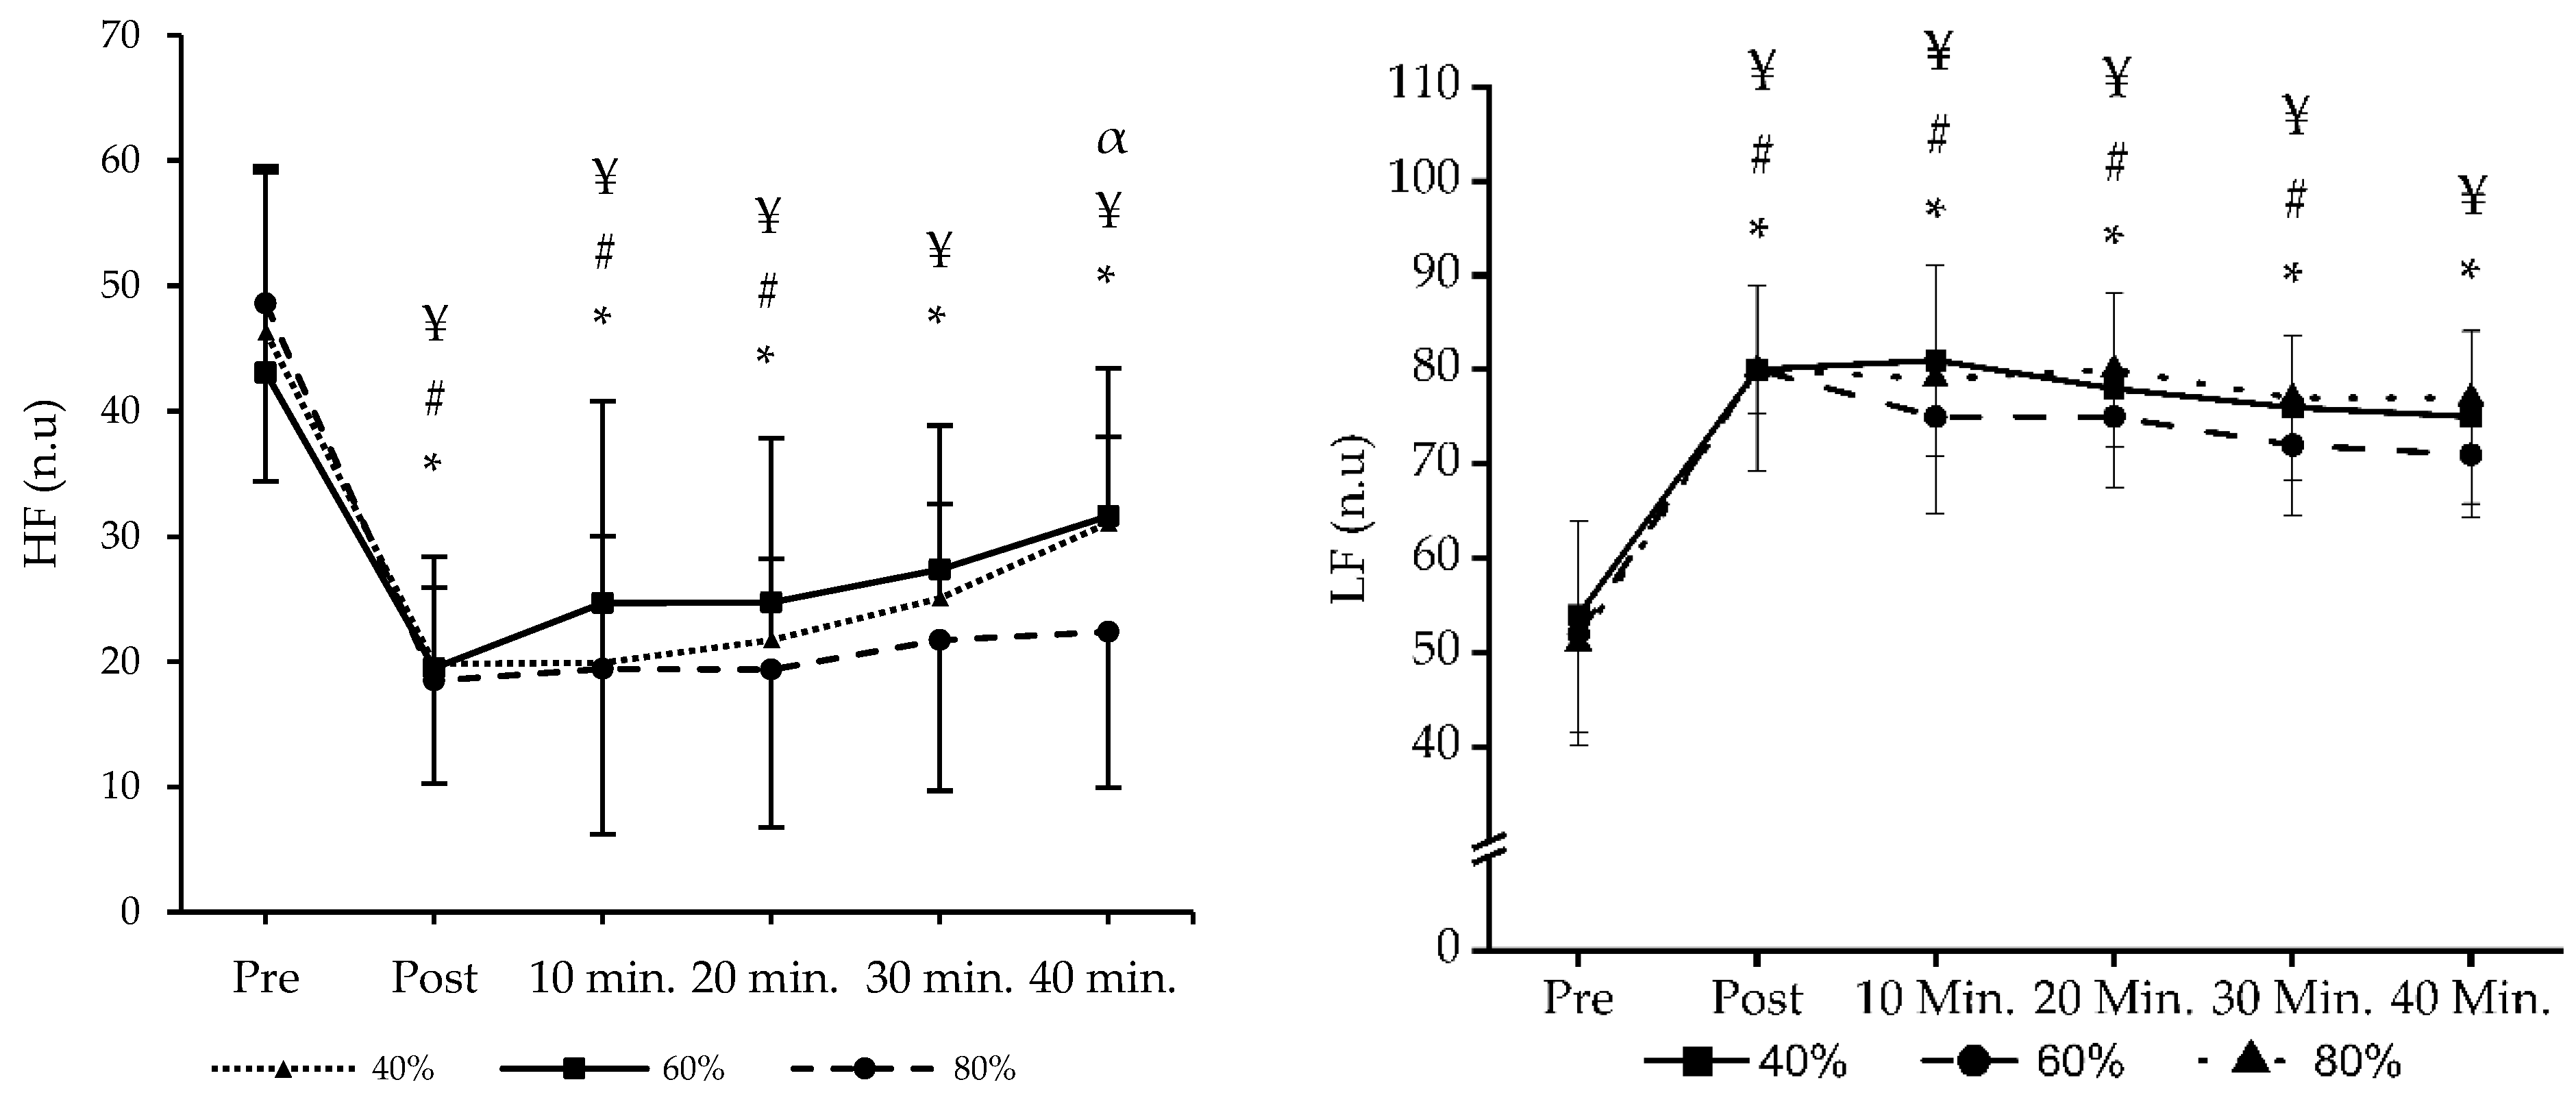
3.2. HRV Data
4. Discussion
5. Conclusions
Author Contributions
Funding
Institutional Review Board Statement
Informed Consent Statement
Data Availability Statement
Acknowledgments
Conflicts of Interest
References
- Mayo, X.; Iglesias-Soler, E.; Fariñas-Rodríguez, J.; Fernández-Del-Olmo, M.; Kingsley, J.D. Exercise Type Affects Cardiac Vagal Autonomic Recovery after a Resistance Training Session. J. Strength Cond. Res. 2016, 30, 2565–2573. [Google Scholar] [CrossRef] [PubMed]
- Spiering, B.A.; Kraemer, W.J.; Anderson, J.M.; Armstrong, L.E.; Nindl, B.C.; Volek, J.S.; Maresh, C.M. Resistance Exercise Biology: Manipulation of Resistance Exercise Programme Variables Determines the Responses of Cellular and Molecular Signalling Pathways. Sports Med. 2008, 38, 527–540. [Google Scholar] [CrossRef] [PubMed]
- Duncan, M.J.; Birch, S.L.; Oxford, S.W. The Effect of Exercise Intensity on Postresistance Exercise Hypotension in Trained Men. J. Strength Cond. Res. 2014, 28, 1706–1713. [Google Scholar] [CrossRef]
- Malik, M. Heart Rate Variability. Ann. Noninvasive Electrocardiol. 1996, 1, 151–181. [Google Scholar] [CrossRef]
- Figueiredo, T.; Rhea, M.R.; Peterson, M.; Miranda, H.; Bentes, C.M.; MacHado De Ribeiro Dos Reis, V.; Simao, R. Influence of Number of Sets on Blood Pressure and Heart Rate Variability after a Strength Training Session. J. Strength Cond. Res. 2015, 29, 1556–1563. [Google Scholar] [CrossRef] [PubMed]
- Okuno, N.M.; Pedro, R.E.; Leicht, A.S.; De Paula Ramos, S.; Nakamura, F.Y. Cardiac Autonomic Recovery after a Single Session of Resistance Exercise with and without Vascular Occlusion. J. Strength Cond. Res. 2014, 28, 1143–1150. [Google Scholar] [CrossRef] [PubMed]
- Schoenfeld, B.J.; Peterson, M.D.; Ogborn, D.; Contreras, B.; Sonmez, G.T. Effects of Low- vs. High-Load Resistance Training on Muscle Strength and Hypertrophy in Well-Trained Men. J. Strength Cond. Res. 2015, 29, 2954–2963. [Google Scholar] [CrossRef] [PubMed]
- Fink, J.; Kikuchi, N.; Yoshida, S.; Terada, K.; Nakazato, K. Impact of High versus Low Fixed Loads and Non-Linear Training Loads on Muscle Hypertrophy, Strength and Force Development. SpringerPlus 2016, 5, 698. [Google Scholar] [CrossRef] [PubMed]
- Nobrega, S.R.; Ugrinowitsch, C.; Pintanel, L.; Barcelos, C.; Libardi, C.A. Effect of Resistance Training to Muscle Failure vs. Volitional Interruption at High-and Low-Intensities on Muscle Mass and Strength. J. Strength Cond. Res. 2018, 32, 162–169. [Google Scholar] [CrossRef]
- de Andrade Lima, A.H.R.; de Moraes Forjaz, C.L.; de Moraes Silva, G.Q.; Menêses, A.L.; Silva, A.J.M.R.; Ritti-Dias, R.M. Acute Effect of Resistance Exercise Intensity in Cardiac Autonomic Modulation after Exercise. Arq. Bras. Cardiol. 2011, 96, 498–503. [Google Scholar] [CrossRef]
- Figueiredo, T.; Willardson, J.M.; Miranda, H.; Bentes, C.M.; Reis, V.M.; Simão, R. Influence of Load Intensity on Postexercise Hypotension and Heart Rate Variability after a Strength Training Session. J. Strength Cond. Res. 2015, 29, 2941–2948. [Google Scholar] [CrossRef] [PubMed]
- Liu, S.; Goodman, J.; Nolan, R.; Lacombe, S.; Thomas, S.G. Blood Pressure Responses to Acute and Chronic Exercise Are Related in Prehypertension. Med. Sci. Sports Exerc. 2012, 44, 1644–1652. [Google Scholar] [CrossRef] [PubMed]
- Anunciação, P.G.; Juliano, C.; Marcos, D.P. Blood Pressure Responses and Heart Rate Variability after Resistance Exercise with Different Intensities and Same Workload. Int. Sport J. 2011, 12, 53–67. [Google Scholar]
- Vale, A.F.; Carneiro, J.A.; Jardim, P.C.V.; Jardim, T.V.; Steele, J.; Fisher, J.P.; Gentil, P. Acute Effects of Different Resistance Training Loads on Cardiac Autonomic Modulation in Hypertensive Postmenopausal Women. J. Transl. Med. 2018, 16, 240. [Google Scholar] [CrossRef] [PubMed]
- González-Badillo, J.J.; Rodríguez-Rosell, D.; Sánchez-Medina, L.; Ribas, J.; López-López, C.; Mora-Custodio, R.; Yañez-García, J.M.; Pareja-Blanco, F. Short-Term Recovery Following Resistance Exercise Leading or Not to Failure. Int. J. Sports Med. 2016, 37, 295–304. [Google Scholar] [CrossRef] [PubMed]
- De Souza, J.C.; Tibana, R.A.; Cavaglieri, C.R.; Vieira, D.C.L.; De Sousa, N.M.F.; Mendes, F.A.D.S.; Tajra, V.; Martins, W.R.; De Farias, D.L.; Balsamo, S.; et al. Resistance Exercise Leading to Failure versus Not to Failure: Effects on Cardiovascular Control. BMC Cardiovasc. Disord. 2013, 13, 105. [Google Scholar] [CrossRef] [PubMed]
- Rezk, C.C.; Marrache, R.C.B.; Tinucci, T.; Mion, D.; Forjaz, C.L.M. Post-Resistance Exercise Hypotension, Hemodynamics, and Heart Rate Variability: Influence of Exercise Intensity. Eur. J. Appl. Physiol. 2006, 98, 105–112. [Google Scholar] [CrossRef] [PubMed]
- Sánchez-Medina, L.; González-Badillo, J.J. Velocity Loss as an Indicator of Neuromuscular Fatigue during Resistance Training. Med. Sci. Sports Exerc. 2011, 43, 1725–1734. [Google Scholar] [CrossRef] [PubMed]
- Simões, R.P.; Mendes, R.G.; Castello, V.; Machado, H.G.; Almeida, L.B.; Baldissera, V.; Catai, A.M.; Arena, R.; Borghi-Silva, A. Heart-Rate Variability and Blood-Lactate Threshold Interaction during Progressive Resistance Exercise in Healthy Older Men. J. Strength Cond. Res. 2010, 24, 1313–1320. [Google Scholar] [CrossRef]
- Holmes, C.J.; Winchester, L.J.; MacDonald, H.V.; Fedewa, M.V.; Wind, S.A.; Esco, M.R. Changes in Heart Rate Variability and Fatigue Measures Following Moderate Load Resistance Exercise. J. Exerc. Physiol. Online 2020, 23, 24. [Google Scholar]
- Borg, G.A.V. Psychophysical Bases of Perceived Exertion. Med. Sci. Sports Exerc. 1982, 14, 377–381. [Google Scholar] [CrossRef] [PubMed]
- Pickering, T.G.; Hall, J.E.; Appel, L.J.; Falkner, B.E.; Graves, J.; Hill, M.N.; Jones, D.W.; Kurtz, T.; Sheps, S.G.; Roccella, E.J. Recommendations for Blood Pressure Measurement in Humans and Experimental Animals: Part 1: Blood Pressure Measurement in Humans: A Statement for Professionals from the Subcommittee of Professional and Public Education of the American Heart Association Council on High Blood Pressure Research. Hypertension 2005, 45, 142–161. [Google Scholar] [CrossRef] [PubMed]
- Hopkins, W.G.; Marshall, S.W.; Batterham, A.M.; Hanin, J. Progressive Statistics for Studies in Sports Medicine and Exercise Science. Med. Sci. Sports Exerc. 2009, 41, 3–12. [Google Scholar] [CrossRef] [PubMed]
- Simão, R.; Fleck, S.J.; Polito, M.; Monteiro, W.; Farinatti, P. Effects of Resistance Training Intensity, Volume, and Session Format on the Postexercise Hypotensive Response. J. Strength Cond. Res. 2005, 19, 853–858. [Google Scholar] [PubMed]
- Agen, G.I.; De Lucena, E.G.P.; Teixeira, L.F.M.; Boas, V.V.; Ribeiro, I.C.; Barroso, R.; Schoenfeld, B.J.; Uchida, M.C. Low-Load x High-Load Resistance Exercise: Greater Cell Swelling After a Training Session. Int. J. Exerc. Sci. 2023, 16, 513. [Google Scholar]
- Mitchell, J.H. Neural Control of the Circulation during Exercise. Med. Sci. Sports 1990, 22, 141–154. [Google Scholar]
- Assunção, A.R.; Bottaro, M.; Ferreira-Junior, J.B.; Izquierdo, M.; Cadore, E.L.; Gentil, P. The Chronic Effects of Low- and High-Intensity Resistance Training on Muscular Fitness in Adolescents. PLoS ONE 2016, 11, e0160650. [Google Scholar] [CrossRef]
- de Tarso Veras Farinatti, P.; Nakamura, F.Y.; Polito, M.D. Influence of Recovery Posture on Blood Pressure and Heart Rate after Resistance Exercises in Normotensive Subjects. J. Strength Cond. Res. 2009, 23, 2487–2492. [Google Scholar] [CrossRef]


| Exercises | Total Repetitions (1) | Volume Load (kg) (2) | Total Set Duration (3) | RPE (Median) | Pairwise Comparisons | p/Cohen’s d |
|---|---|---|---|---|---|---|
| 40% (a) | 271.7 (30.7) † | 10,726.1 (2346.5) | 1048.54 (64.3) † | 16 (16 ± 1) | a1–b1 | 0.001/3.815 |
| a1–c1 | 0.001/6.875 | |||||
| b1–c1 | 0.001/3.059 | |||||
| 60% (b) | 170.4 (30.4) † | 9921.8 (2367.3) † | 697.58 (34.04) † | 16 (15.9 ± 0.8) | a2–c2 | 0.001/1.813 |
| b2–c2 | 0.002/1.435 | |||||
| a3–b3 | 0.001/8.243 | |||||
| 80% (c) | 89.2 (15.5) † | 6867.1 (1577.5) † | 213.91 (12.06) † | 16 (16.1 ± 0.8) | a3–c3 | 0.001/19.602 |
| b3–c3 | 0.001/11.359 |
| Variables | Exercise Intensity | Pre-Exercise (1) | Post-Exercise (2) | 10 Min. (3) | 20 Min. (4) | 30 Min. (5) | 40 Min. (6) | ||||
|---|---|---|---|---|---|---|---|---|---|---|---|
| Mean ± SD | Mean ± SD | Mean ± SD | Mean ± SD | Mean ± SD | Mean ± SD | Differences | ∆% | (95% CI) | p/Cohen’s d | ||
| SBP | 40% (a) | 113.28 ± 8.9 | 125.35 ± 8.5 | 121.21 ± 8.7 | 117.57 ± 9.4 | 116.07 ± 11 | 114.64 ± 9.9 | a1–a2 * b1–b2 * | 10.65 ↑ 9.90 ↑ | −20.1 to −4.1 −15.6 to −7.5 | 0.002/−1.342 0.001/−1.286 |
| 60% (b) | 116.85 ± 7.4 | 128.42 ± 8.1 | 124.07 ± 9.9 | 118.64 ± 8.3 | 119.07 ± 11.6 | 118.28 ± 8.2 | |||||
| 80% (c) | 117.71 ± 10.5 | 126.07 ± 8.6 | 124.21 ± 7.8 | 121.36 ± 8.8 | 120.21 ± 5.7 | 119.36 ± 9.2 | |||||
| DBP | 40% (a) | 84.92 ± 10.5 | 74.78 ± 8.5 | 77.64 ± 8.3 | 79.14 ± 9.1 | 78.92 ± 8.5 | 83.28 ± 7.7 | N/S | |||
| 60% (b) | 85.5 ± 7.7 | 77.2 ± 7.1 | 79.4 ± 10.6 | 78.93 ± 11.2 | 81.42 ± 7.1 | 82.64 ± 7.9 | |||||
| 80% (c) | 80.71 ± 7.5 | 71.5 ± 12.1 | 76.35 ± 6.6 | 78.21 ± 9.5 | 77.92 ± 8.8 | 79.57 ± 6.6 | |||||
| RMSSD | 40% (a) | 51.12 ± 17 | 16.80 ± 9.1 | 21.26 ± 9.6 | 24.39 ± 6.1 | 29.33 ± 6.5 | 36.17 ± 9.6 | a1–a2 * | 67.13 ↓ | 20.2 to 48.3 | 0.001/2.918 |
| a1–a3 * | 58.41 ↓ | 14.8 to 44.8 | 0.001/2.539 | ||||||||
| a1–a4 * | 52.28 ↓ | 12.2 to 41.2 | 0.001/2.273 | ||||||||
| a1–a5 * | 42.62 ↓ | 6.1 to 37.4 | 0.004/1.853 | ||||||||
| 60% (b) | 49.28 ± 19.5 | 13.58 ± 6.1 | 19.67 ± 7.8 | 24.01 ± 6.9 | 32.18 ± 8.6 | 35.64 ± 7.1 | b1–b2 * | 77.44 ↓ | 17.5 to 53.8 | 0.001/3.036 | |
| b1–b3 * | 60.08 ↓ | 14.4 to 44.8 | 0.001/2.519 | ||||||||
| b1–b4 * | 51.57 ↓ | 9.1 to 41.4 | 0.001/2.149 | ||||||||
| c1–c2 * | 70.51 ↓ | 12.3 to 62.8 | 0.002/3.196 | ||||||||
| c1–c3 * | 69.03 ↓ | 9.2 to 64.3 | 0.005/3.129 | ||||||||
| c1–c4 * | 62.00 ↓ | 5.2 to 61.1 | 0.015/2.809 | ||||||||
| c1–c5 * | 59.29 ↓ | 3.1 to 60.1 | 0.024/2.688 | ||||||||
| 80% (c) | 53.29 ± 28.3 | 15.71 ± 5.3 | 16.50 ± 10.9 | 20.25 ± 8.9 | 21.69 ± 9.2 | 25.77 ± 9.5 | a5–c5 $ | 26.04 | 0.9 to 14.4 | 0.025/0.650 | |
| b5–c5 $ | 32.59 | 1.1 to 19.9 | 0.028/0.893 | ||||||||
| a6–c6 $ | 28.75 | 0.8 to 19.9 | 0.031/0.884 | ||||||||
| b6–c6 $ | 27.69 | 0.2 to 19.6 | 0.046/0.839 | ||||||||
| HF | 40% (a) | 46.33 ± 13.2 | 19.82 ± 6.1 | 18.9 ± 10.1 | 21.71 ± 6.5 | 25.07 ± 7.5 | 31.05 ± 6.9 | a1–a2 * | 57.21 ↓ | 10.8 to 42.1 | 0.001/2.292 |
| a1–a3 * | 57.04 ↓ | 12.3 to 42.5 | 0.001/2.372 | ||||||||
| a1–a4 * | 53.14 ↓ | 10.8 to 38.4 | 0.001/2.129 | ||||||||
| a1–a5 * | 45.88 ↓ | 8.5 to 34 | 0.001/1.838 | ||||||||
| a1–a6 * | 32.98 ↓ | 2.7 to 27.8 | 0.012/1.321 | ||||||||
| 60% (b) | 43.08 ± 16 | 19.48 ± 8.9 | 24.68 ± 16.1 | 24.74 ± 13.1 | 27.34 ± 11.5 | 31.61 ± 11.8 | b1–b2 * | 54.78 ↓ | 5.7 to 41.5 | 0.006/2.128 | |
| b1–b3 * | 42.71 ↓ | 0.4 to 36.3 | 0.042/1.592 | ||||||||
| b1–b4 * | 42.57 ↓ | 1.6 to 35.1 | 0.027/1.586 | ||||||||
| 80% (c) | 48.59 ± 14.2 | 18.47 ± 8.2 | 19.41 ± 13.2 | 19.37 ± 12.6 | 21.69 ± 12 | 22.34 ± 12.4 | c1–c2 * | 61.98 ↓ | 16.9 to 43.3 | 0.001/2.604 | |
| c1–c3 * | 60.05 ↓ | 14.9 to 43.4 | 0.001/2.522 | ||||||||
| c1–c4 * | 60.13 ↓ | 14.2 to 44.2 | 0.001/2.527 | ||||||||
| c1–c5 * | 55.36 ↓ | 13.1 to 40.6 | 0.001/2.326 | ||||||||
| c1–c6 * | 52.02 ↓ | 10.8 to 41.6 | 0.001/2.270 | ||||||||
| a6–c6 $ | 28.05 | 0.2 to 17.2 | 0.045/0.753 | ||||||||
| LF | 40% (a) | 54.31 ± 13.9 | 80.85 ± 4.7 | 81.04 ± 10.2 | 78.15 ± 6.2 | 76.47 ± 7.8 | 75.95 ± 9.2 | a1–a2 * | 48.86 ↑ | −40.5 to −12.5 | 0.001/−2.325 |
| a1–a3 * | 49.21 ↑ | −39 to −14.4 | 0.001/−2.342 | ||||||||
| a1–a4 * | 43.89 ↑ | −35.8 to −11.8 | 0.001/−2.088 | ||||||||
| a1–a5 * | 40.80 ↑ | −33.9 to −10.3 | 0.001/−1.941 | ||||||||
| a1–a6 * | 39.84 ↑ | −33.2 to −10.1 | 0.001/−1.896 | ||||||||
| 60% (b) | 52.9 ± 11.9 | 80.48 ± 8.9 | 75.16 ± 16.1 | 75.14 ± 13.2 | 72.58 ± 11.6 | 71.21 ± 13.1 | b1–b2 * | 52.13 ↑ | −43.7 to −11.5 | 0.001/−2.417 | |
| b1–b3 * | 42.07 ↑ | −43.9 to −0.6 | 0.041/−1.950 | ||||||||
| b1–b4 * | 42.04 ↑ | −40.8 to −3.6 | 0.013/−1.949 | ||||||||
| b1–b5 * | 37.20 ↑ | −38.1 to −1.3 | 0.030/−1.724 | ||||||||
| 80% (c) | 51.98 ± 9.4 | 80.31 ± 10.7 | 79.74 ± 14.3 | 80.65 ± 12.5 | 77.36 ± 12.4 | 77.34 ± 12.6 | c1–c2 * | 54.50 ↑ | −41.1 to −15.6 | 0.001/−2.483 | |
| c1–c3 * | 53.40 ↑ | −42.8 to −12.7 | 0.001/−2.433 | ||||||||
| c1–c4 * | 55.15 ↑ | −44.1 to −13.2 | 0.001/−2.513 | ||||||||
| c1–c5 * | 48.82 ↑ | −41.4 to −9.3 | 0.001/−2.224 | ||||||||
| c1–c6 * | 48.78 ↑ | −41.8 to −8.9 | 0.001/−2.222 | ||||||||
| Exercise Variables | Intensity | RMSSD Post | RMSSD 40 Min. | HF Post | HF 40 Min. | LF Post | LF 40 Min. | ||||||
|---|---|---|---|---|---|---|---|---|---|---|---|---|---|
| r | p | r | p | r | p | r | p | r | p | r | p | ||
| Total Repetition | 40% | −0.431 | 0.124 | 0.121 | 0.680 | −0.047 | 0.874 | 0.363 | 0.202 | 0.047 | 0.874 | −0.365 | 0.199 |
| 60% | −0.577 * | 0.031 | −0.235 | 0.420 | −0.231 | 0.426 | 0.177 | 0.545 | 0.231 | 0.426 | −0.177 | 0.546 | |
| 80% | −0.089 | 0.762 | 0.188 | 0.520 | −0.156 | 0.593 | 0.324 | 0.259 | −0.089 | 0.762 | −0.324 | 0.258 | |
| Volume -load | 40% | −0.221 | 0.447 | 0.007 | 0.981 | 0.124 | 0.674 | 0.269 | 0.353 | −0.122 | 0.679 | −0.271 | 0.350 |
| 60% | −0.313 | 0.276 | −0.093 | 0.753 | 0.054 | 0.854 | 0.214 | 0.462 | −0.054 | 0.855 | −0.214 | 0.462 | |
| 80% | 0.238 | 0.413 | 0.107 | 0.715 | 0.249 | 0.390 | 0.371 | 0.191 | 0.238 | 0.413 | −0.372 | 0.191 | |
Disclaimer/Publisher’s Note: The statements, opinions and data contained in all publications are solely those of the individual author(s) and contributor(s) and not of MDPI and/or the editor(s). MDPI and/or the editor(s) disclaim responsibility for any injury to people or property resulting from any ideas, methods, instructions or products referred to in the content. |
© 2024 by the authors. Licensee MDPI, Basel, Switzerland. This article is an open access article distributed under the terms and conditions of the Creative Commons Attribution (CC BY) license (https://creativecommons.org/licenses/by/4.0/).
Share and Cite
Güngör, A.K.; Topçu, H.; Aldhahi, M.I.; Al-Mhanna, S.B.; Gülü, M. Resistance Training to Muscle Failure with Variable Load Intensities: Implications for Post-Exercise Blood Pressure and Heart Rate Variability in Trained Men. J. Clin. Med. 2024, 13, 2296. https://doi.org/10.3390/jcm13082296
Güngör AK, Topçu H, Aldhahi MI, Al-Mhanna SB, Gülü M. Resistance Training to Muscle Failure with Variable Load Intensities: Implications for Post-Exercise Blood Pressure and Heart Rate Variability in Trained Men. Journal of Clinical Medicine. 2024; 13(8):2296. https://doi.org/10.3390/jcm13082296
Chicago/Turabian StyleGüngör, Ali Kamil, Hüseyin Topçu, Monira I. Aldhahi, Sameer Badri Al-Mhanna, and Mehmet Gülü. 2024. "Resistance Training to Muscle Failure with Variable Load Intensities: Implications for Post-Exercise Blood Pressure and Heart Rate Variability in Trained Men" Journal of Clinical Medicine 13, no. 8: 2296. https://doi.org/10.3390/jcm13082296
APA StyleGüngör, A. K., Topçu, H., Aldhahi, M. I., Al-Mhanna, S. B., & Gülü, M. (2024). Resistance Training to Muscle Failure with Variable Load Intensities: Implications for Post-Exercise Blood Pressure and Heart Rate Variability in Trained Men. Journal of Clinical Medicine, 13(8), 2296. https://doi.org/10.3390/jcm13082296