Article

Thicker Inner Nuclear Layer as a Predictor of Glaucoma Progression and the Impact of Intraocular Pressure Fluctuation

Department of Ophthalmology, Seoul St. Mary’s Hospital, College of Medicine, The Catholic University of Korea, Seoul 06591, Republic of Korea
*
Author to whom correspondence should be addressed.
J. Clin. Med. 2024, 13(8), 2312; https://doi.org/10.3390/jcm13082312
Submission received: 3 April 2024 / Revised: 10 April 2024 / Accepted: 13 April 2024 / Published: 17 April 2024
(This article belongs to the Section Ophthalmology)

Abstract

:
Background: Thickening of the inner nuclear layer (INL) or microcystic macular changes has been reported to be implicated in glaucoma patients, but their potential impact on disease progression remains unclear. We investigated the relationship between baseline microcystic macular edema in the INL or INL thickness and subsequent visual field (VF) progression in glaucoma patients. Methods: This retrospective observational study included primary open-angle glaucoma with follow-up exceeding 3 years. We identified macular cystic changes through Spectralis optical coherence tomography and measured the INL thickness using automated segmentation. Glaucoma progression was determined using the Guided Progression Analysis program of the Humphrey filed analyzer, calculating the mean deviation (MD) changes (dB/year). Results: Microcystic macular changes were observed in 12 (7.5%) of 162 patients. Patients with microcystic macular change had thicker INL thickness than those without it (p = 0.010). Progressors had a higher probability of having microcystic macular changes and a thicker average INL thickness than nonprogressors (p = 0.003, p = 0.019). Thicker INL thickness was associated with faster VF progression based on MD slope (dB/year) in the multivariate regression analysis (p = 0.045). Additionally, greater intraocular pressure (IOP) fluctuation was found to be associated with both a thicker INL and the presence of microcystic changes in the multivariate regression analysis (p = 0.003, 0.028). Conclusions: Increased macular INL thickness indicative of INL changes was linked to subsequent VF progression in glaucoma patients. These findings suggest that retinal inner nuclear change could serve as an indicator of progressive glaucoma.

1. Introduction

Glaucomatous optic neuropathy is characterized by selective loss of retinal ganglion cells (RGCs). In glaucoma, the degeneration of the axons, cell bodies, and dendrites of RGCs was observed mainly from the retinal nerve fiber layer (RNFL) to the inner plexiform layer (IPL), although outer retinal layer changes have been reported in a few studies [1,2].
A growing body of evidence has reported that microcystic macular changes were found in the inner nuclear layer (INL) in up to 10% of patients with several types of optic nerve diseases, including glaucoma [3]. RGCs synapse or connect to bipolar cells, amacrine cells, and Müller cells in the IPL, and their cell bodies were located in the INL. Retrograde transcellular degeneration of cells in the INL secondary to RGC loss, vitreoretinal traction, and Müller cell dysfunction has been suggested as the mechanism of microcystic macular changes detected in optic nerve degeneration [3,4,5,6]. The precise mechanism of experiencing microcystic macular changes in the INL has not been elucidated clearly.
It has been reported that microcystic macular changes were associated with a thinner RNFL or ganglion cell layer (GCL) or more severe visual field (VF) loss in optic neuropathies [3,4,6,7]. Our group previously found that a thicker INL correlates with more severe VF damage in patients with glaucoma [8]. Regarding the progression of glaucoma, one study reported that the presence of microcystic macular changes is associated with faster VF progression [9]. Another study found that the rate of global MD or VF index did not significantly differ according to the presence of microcystic macular changes, although superior central VF damage deteriorated rapidly in glaucoma patients with microcystic macular changes [7].
Microcystic macular changes were found to be associated with INL thickening in optic neuropathies of variable etiologies [3,4,5,6,9]. The presence of microcysts itself in the INL might contribute to an increased thickness of the INL [4,9]. In patients with multiple sclerosis, the INL was thicker in patients with relapsing–remitting multiple sclerosis than in healthy control subjects, even when microcystic macular changes had not been identified yet [5]. This finding suggests that INL thickening might precede the development of microcystic macular edema [5]. Having microcystic changes or not is a dichotomous classification partially dependent on optical coherence tomography (OCT) resolution. Quantitative assessment of the effects of INL thickness on glaucomatous VF progression might yield a clue about the pathogenesis of microcystic macular changes in the INL, and the existence of a correlation between the INL thickness and VF progression could reveal a biomarker for glaucoma progression. No study has evaluated the relationship between INL thickness and VF progression in patients with glaucoma.
In this study, we investigated the association between the presence of INL microcystic change or INL thickness and subsequent VF progression. Additionally, we tried to uncover the factors related to the presence of microcystic change or INL thickness in patients with glaucoma.

2. Materials and Methods

The institutional review board of the Catholic University of Korea, Seoul, Republic of Korea, approved this retrospective observational study and waived the need for written informed consent because of its retrospective design. This study followed the tenets of the Declaration of Helsinki. Among patients who visited a glaucoma clinic of Seoul St. Mary’s Hospital (Seoul, Republic of Korea) between January and March 2015, patients with a diagnosis of primary open-angle glaucoma who were imaged with the Spectralis spectral-domain OCT (SD-OCT) system (Heidelberg Engineering, Heidelberg, Germany) and met the inclusion criteria were enrolled into this study. The study inclusion criteria were the presence of an open angle under gonioscopic examination, axial length < 28 mm, and >3 years of follow-up. Exclusion criteria were corneal disease affecting vision; a history of or current uveitis, diabetic retinopathy, or other vitreoretinal diseases (e.g., retinal vein obstruction, central serous chorioretinopathy, age-related macular degeneration, retinal detachment); brain disease that could impact visual function; and a history of glaucoma or posterior segment surgery. Abnormal findings in the macular region, such as retinoschisis or cystoid macular edema after intraocular surgery, were also selected as exclusion criteria. Patients with an epiretinal membrane (ERM) were not excluded. Patients with a kind of optic nerve degeneration other than glaucoma, such as hereditary, inflammatory, or ischemic optic neuropathy, or optic disc drusen, were excluded.
All patients underwent a complete ophthalmic examination, including IOP measurement by Goldmann applanation tonometry, central corneal thickness measurement, axial length measurement, stereoscopic optic disc photography, and red-free photography. During their first visit to our clinic, each patient underwent blood pressure measurement in the sitting position using a standard automated blood pressure cuff after a 5 min rest. Eyes with a glaucomatous optic disc, such as rim loss, notching, and RNFL defects corresponding to VF loss in standard automated perimetry 24-2, were diagnosed as having glaucoma.
Long-term IOP fluctuation was determined as the standard deviation (SD) of all IOP values during visits. The high IOP fluctuation group and the low IOP fluctuation group were differentiated based on the median value of the IOP SD values of all patients.

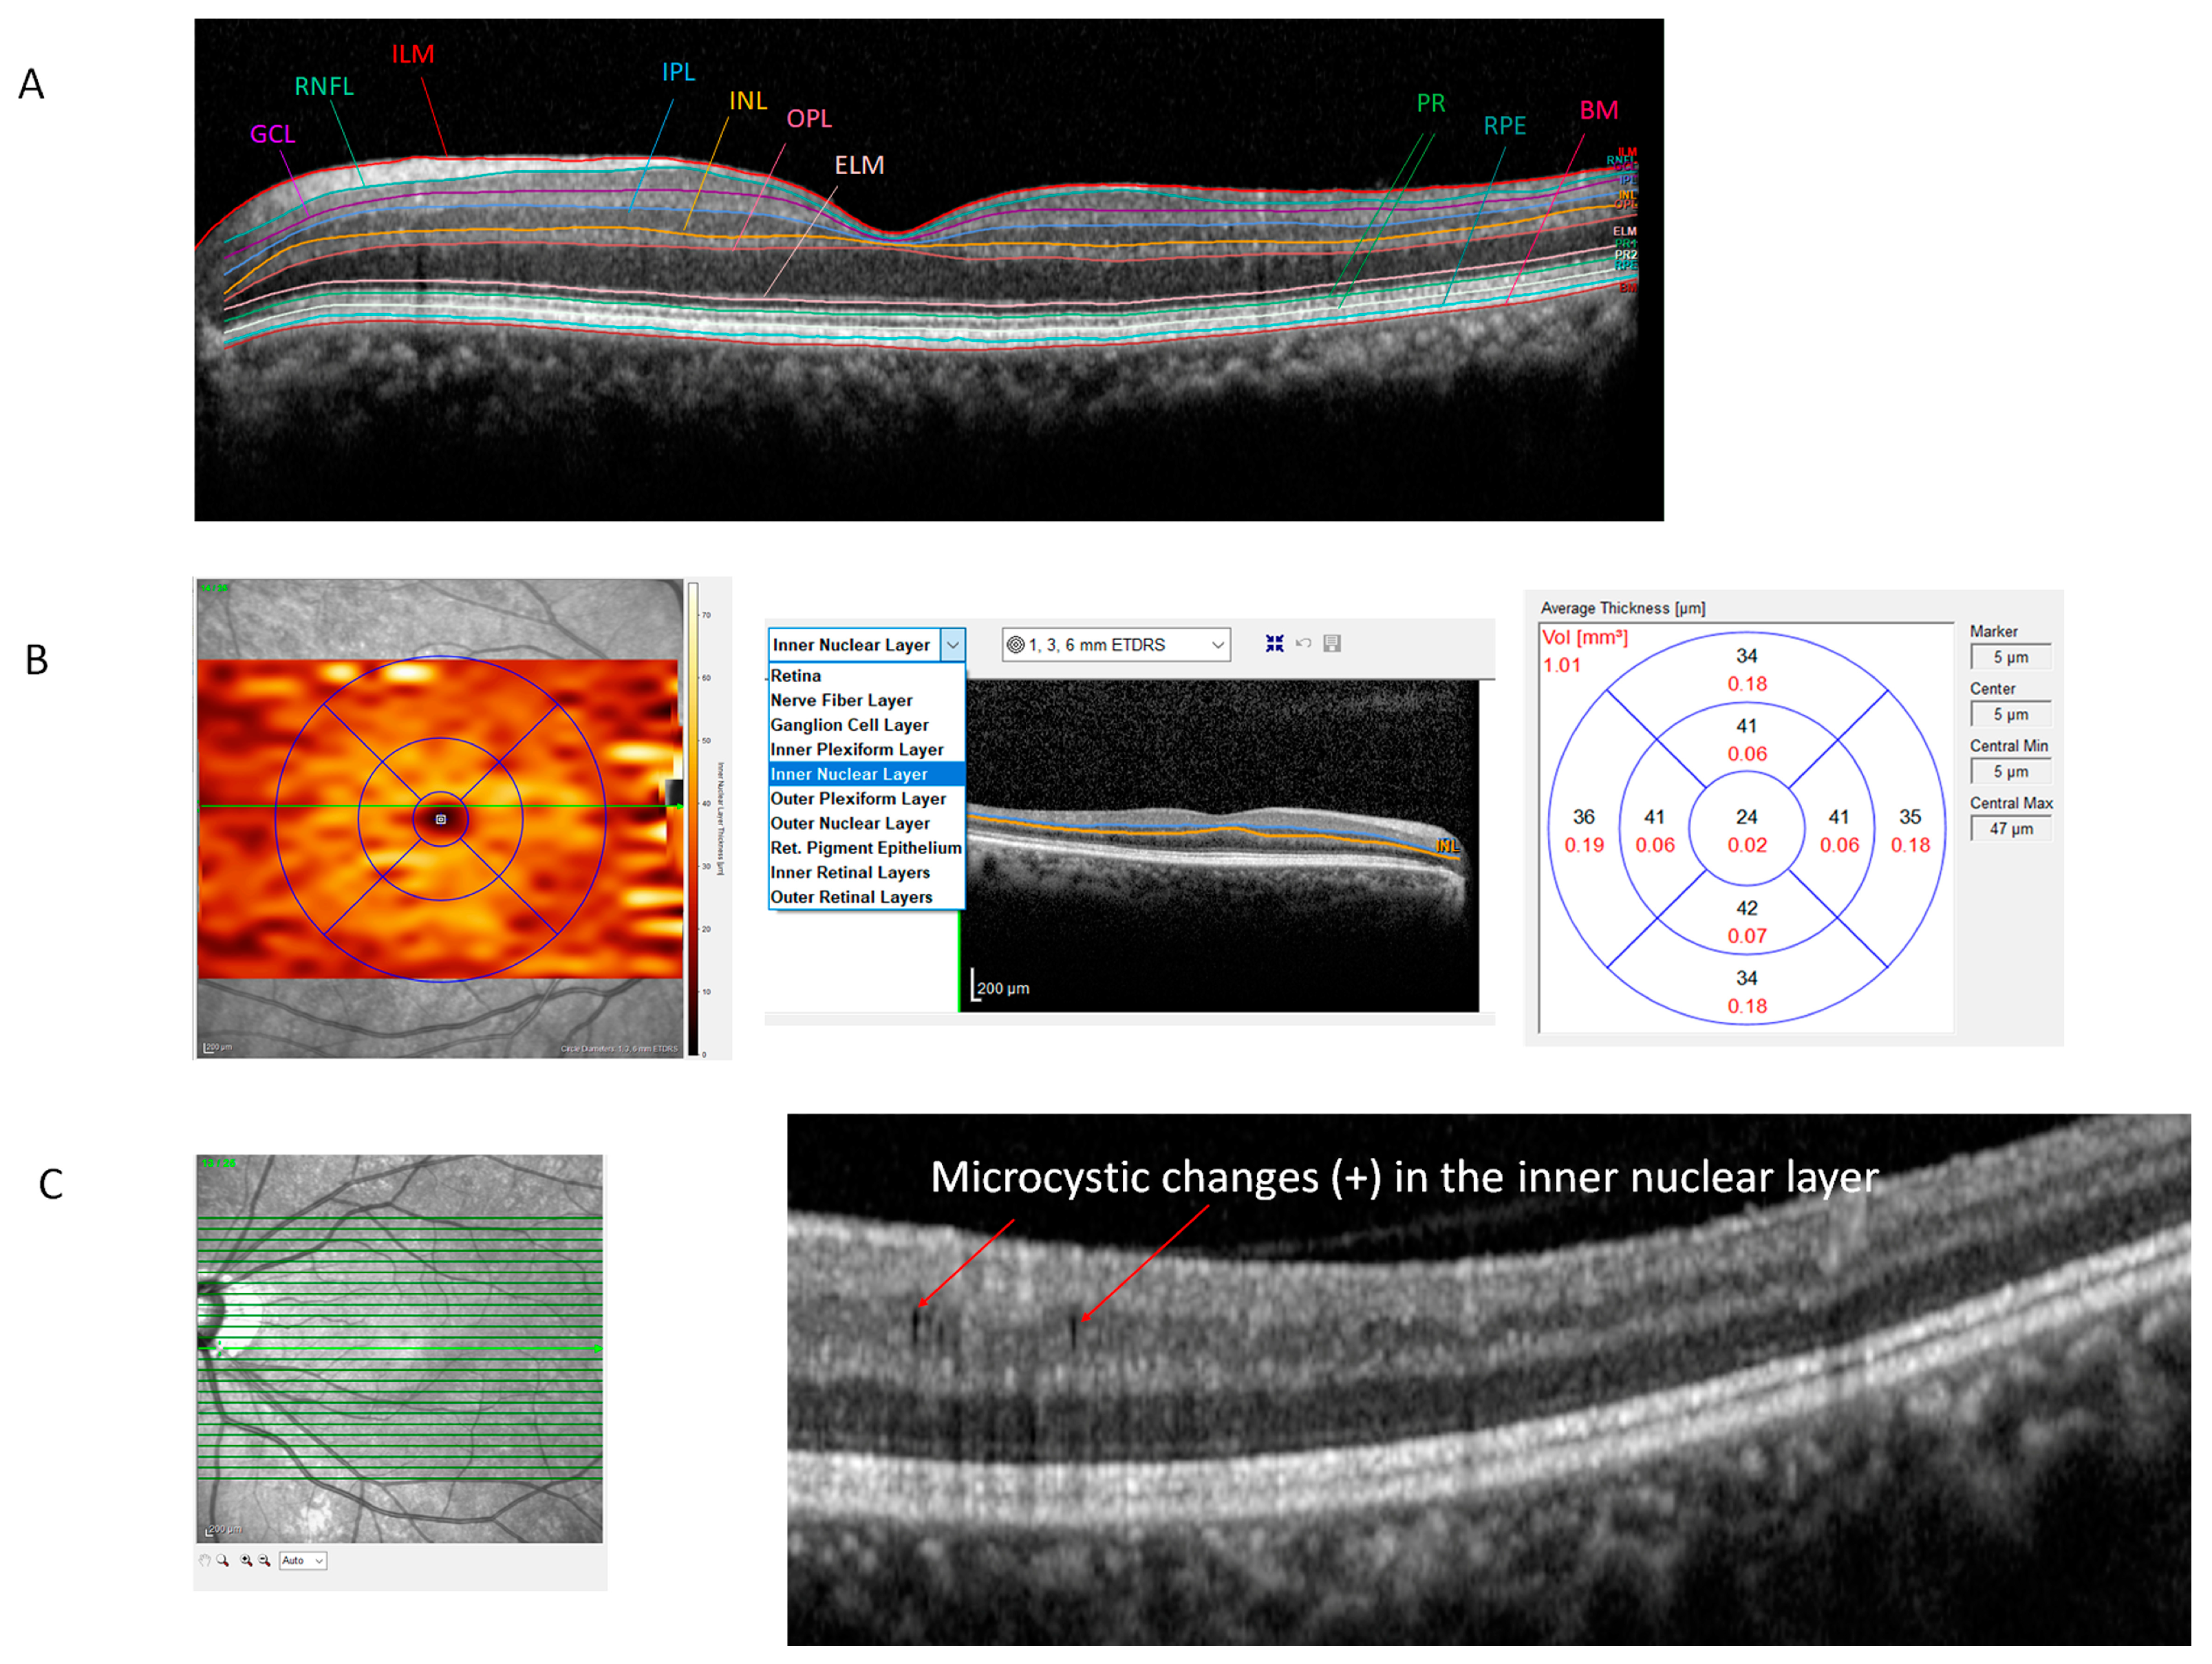
2.1. OCT and Automated Segmentation of the Retina

All subjects were examined with the Spectralis SD-OCT system (Heidelberg Engineering, Heidelberg, Germany) using the fast macular cube protocol. Real-time eye-tracking software yielded perifoveal volumetric retinal scans consisting of 25 single horizontal axial scans (scanning area, 666 mm2 centered at the fovea). Segmentation of the retinal layers was carried out automatically by a segmentation application (Segmentation Technology; Heidelberg Engineering). The automated segmentation program shows 11 different retinal demarcation lines: the inner limiting membrane, the boundaries between the RNFL and the ganglion cell layer (GCL); between the GCL and the inner plexiform layer (IPL); between the IPL and the INL; between the INL and the outer plexiform layer; between the outer plexiform layer and the outer nuclear layer; the external limiting membrane, two photoreceptor layers (PR1/2), the RPE, and Bruch’s membrane (Figure 1A). After automatic segmentation of the retinal layers, thickness measurements were displayed for every segmented retinal layer inside of the nine 1, 3, and 6 mm grid sectors defined by the Early Treatment Diabetic Retinopathy Study (ETDRS) grid on the thickness map (Figure 1B).
The segmentation process revealed each retinal layer thickness, including the overall retinal thickness and those of the RNFL, GCL, IPL, INL, outer plexiform layer, outer nuclear layer, outer limiting membrane, photoreceptor layers, retinal pigment epithelium, inner retinal layer, and outer retinal layer. The average total retinal, RNFL, GCL, IPL, and INL thickness values in nine sectors and the total volume were calculated and adopted in this study. The total volume of each retinal layer within the ETDRS circle was displayed on the thickness map.
The occurrence of microcystoid macular change was defined by the presence of multiple, small hyporeflective round or elliptical cystoid spaces without a cyst wall detected in the INL and not confluent with cystoid spaces in other retinal layers (Figure 1C) [10]. To avoid a false-positive result in the decision about the presence of microcysts, microcystoid macular change was determined to be present when microcysts were observed on more than two serial scans and when two observers (C.K.P. and K.I.J.) agreed on the presence of microcystoic macular changes.

2.2. VF Testing

All patients underwent an standard automated perimetry 24-2 test with a Humphrey field analyzer (Carl Zeiss Meditec, Doublin, CA, USA) using the Swedish interactive threshold algorithm standard strategy. Glaucomatous VF defects were defined as clusters of at least three points having sensitivities of <5% of the normal population on the pattern deviation plot. A single abnormal point should have a sensitivity of <1% of the normal population. The mean deviation (MD) and pattern standard deviation were analyzed. Reliable VFs were considered those with <15% fixation losses, false positives, or false negatives. A VF test performed from January to March 2015 was designated as the baseline VF test because segmentation of the retinal layers by the Spectralis SD-OCT system was available from January 2015 in our clinic. The baseline VF test and Spectralis SD-OCT exam were performed on the same day.
Progression of glaucoma was determined when “likely progression” alerts were shown by the Guided Progression Analysis program of the Humphrey field analyzer. The Guided Progression Analysis program is based on the Early Manifest Glaucoma Trial (EMGT) criteria (event-based analysis), which indicate progression when three or more points show a significant deterioration (at the p < 0.05 level) in at least three consecutive examinations compared to two baseline pattern deviation VFs [11]. Calculation of VF change rates was performed using MD change (dB) per year during follow-up periods.

2.3. Statistical Analysis
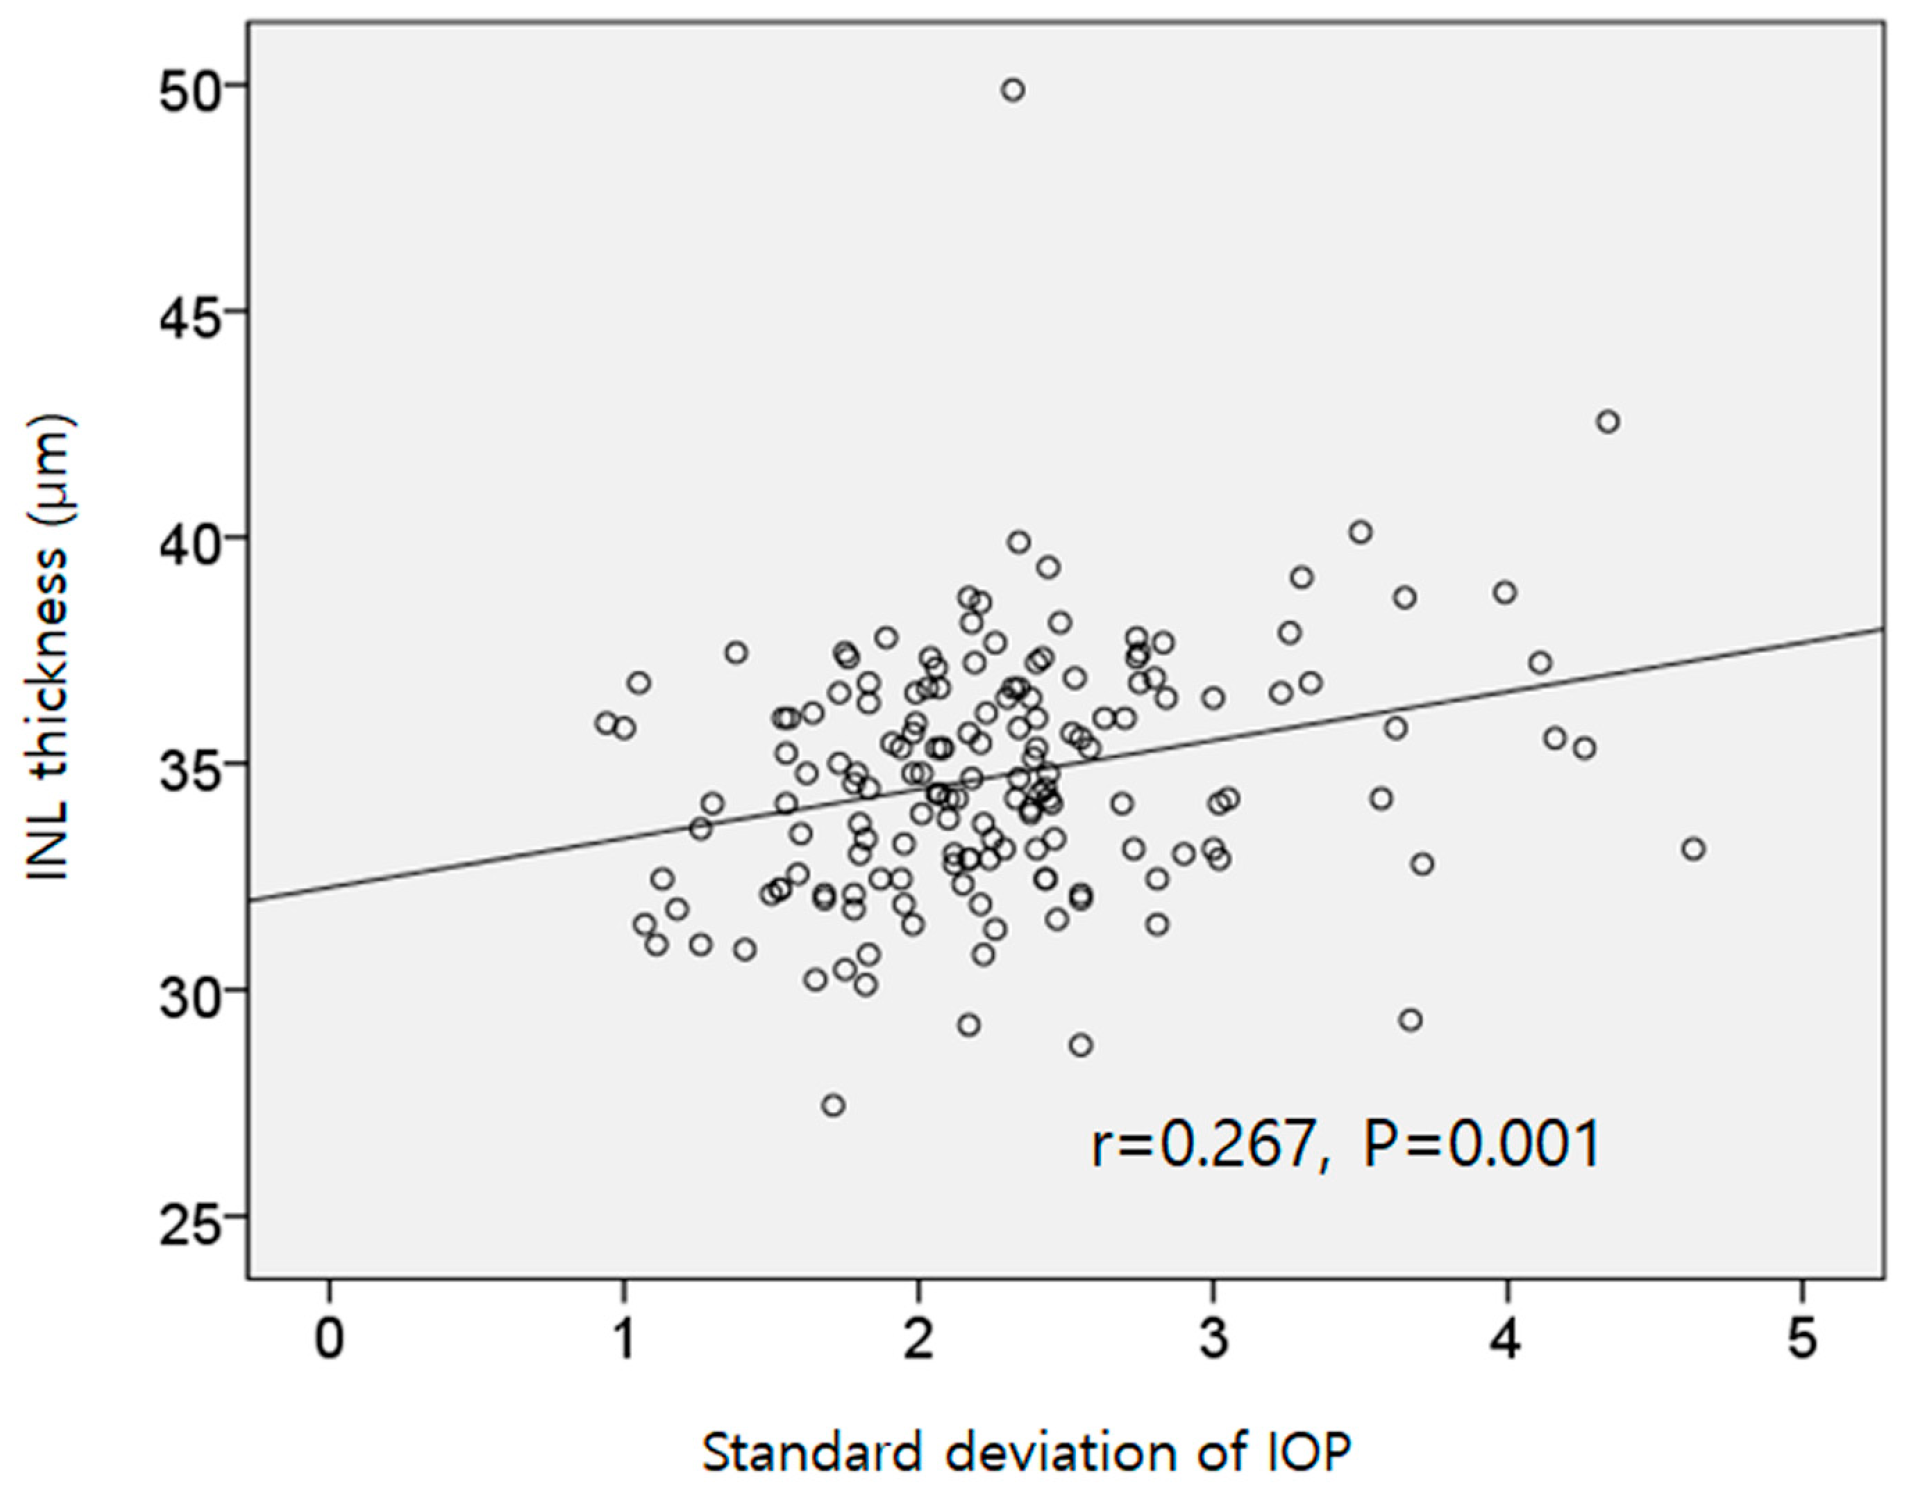
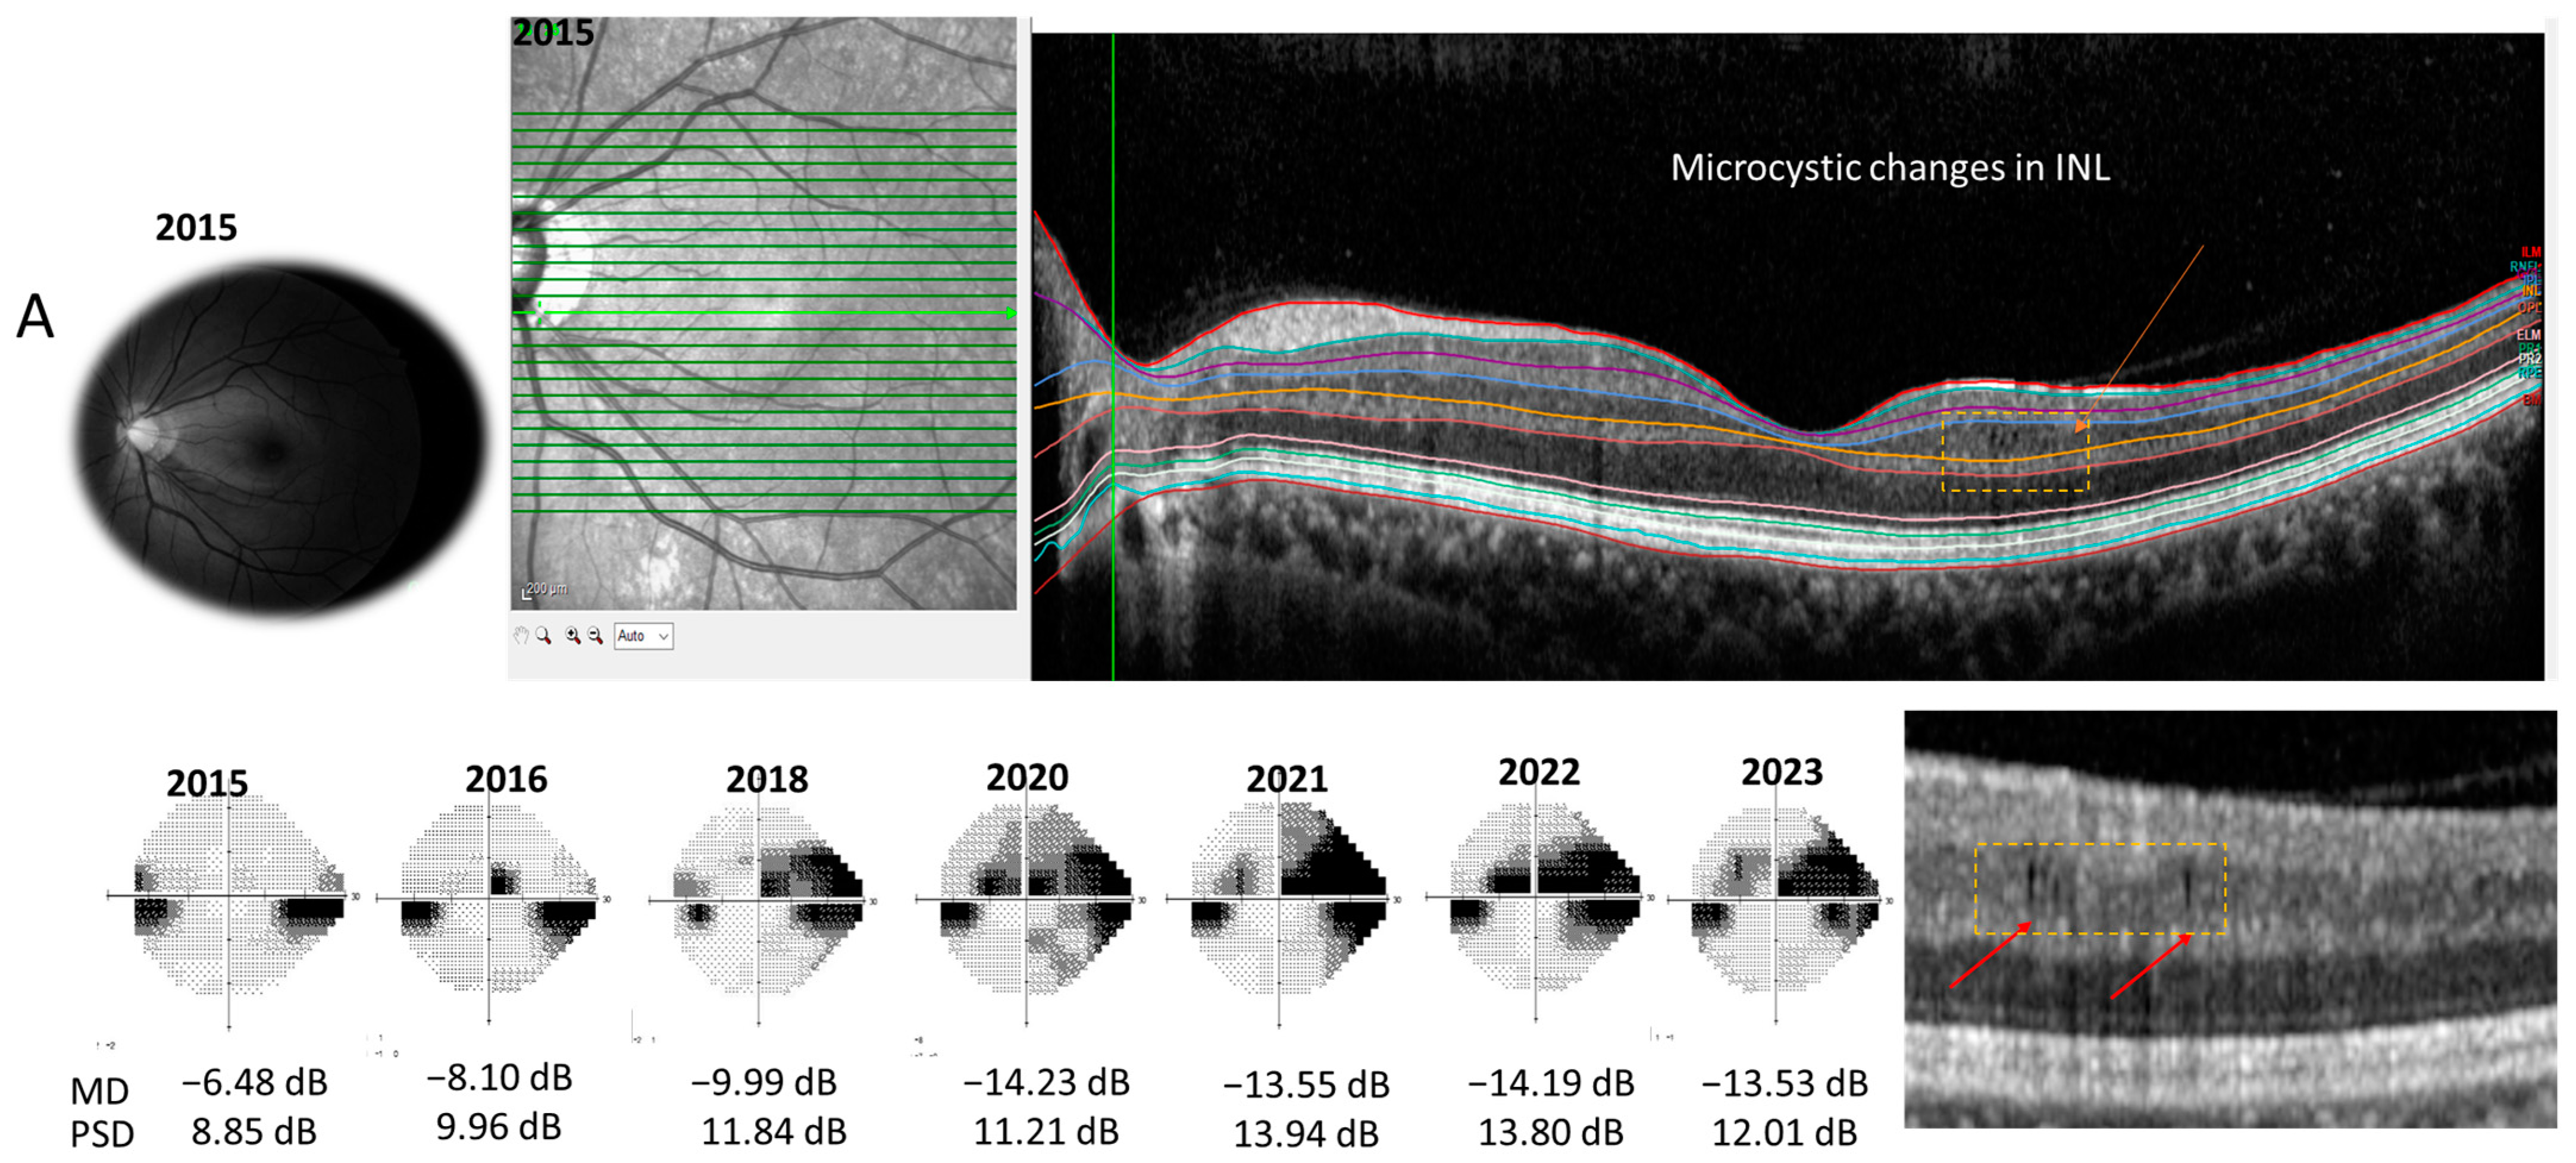
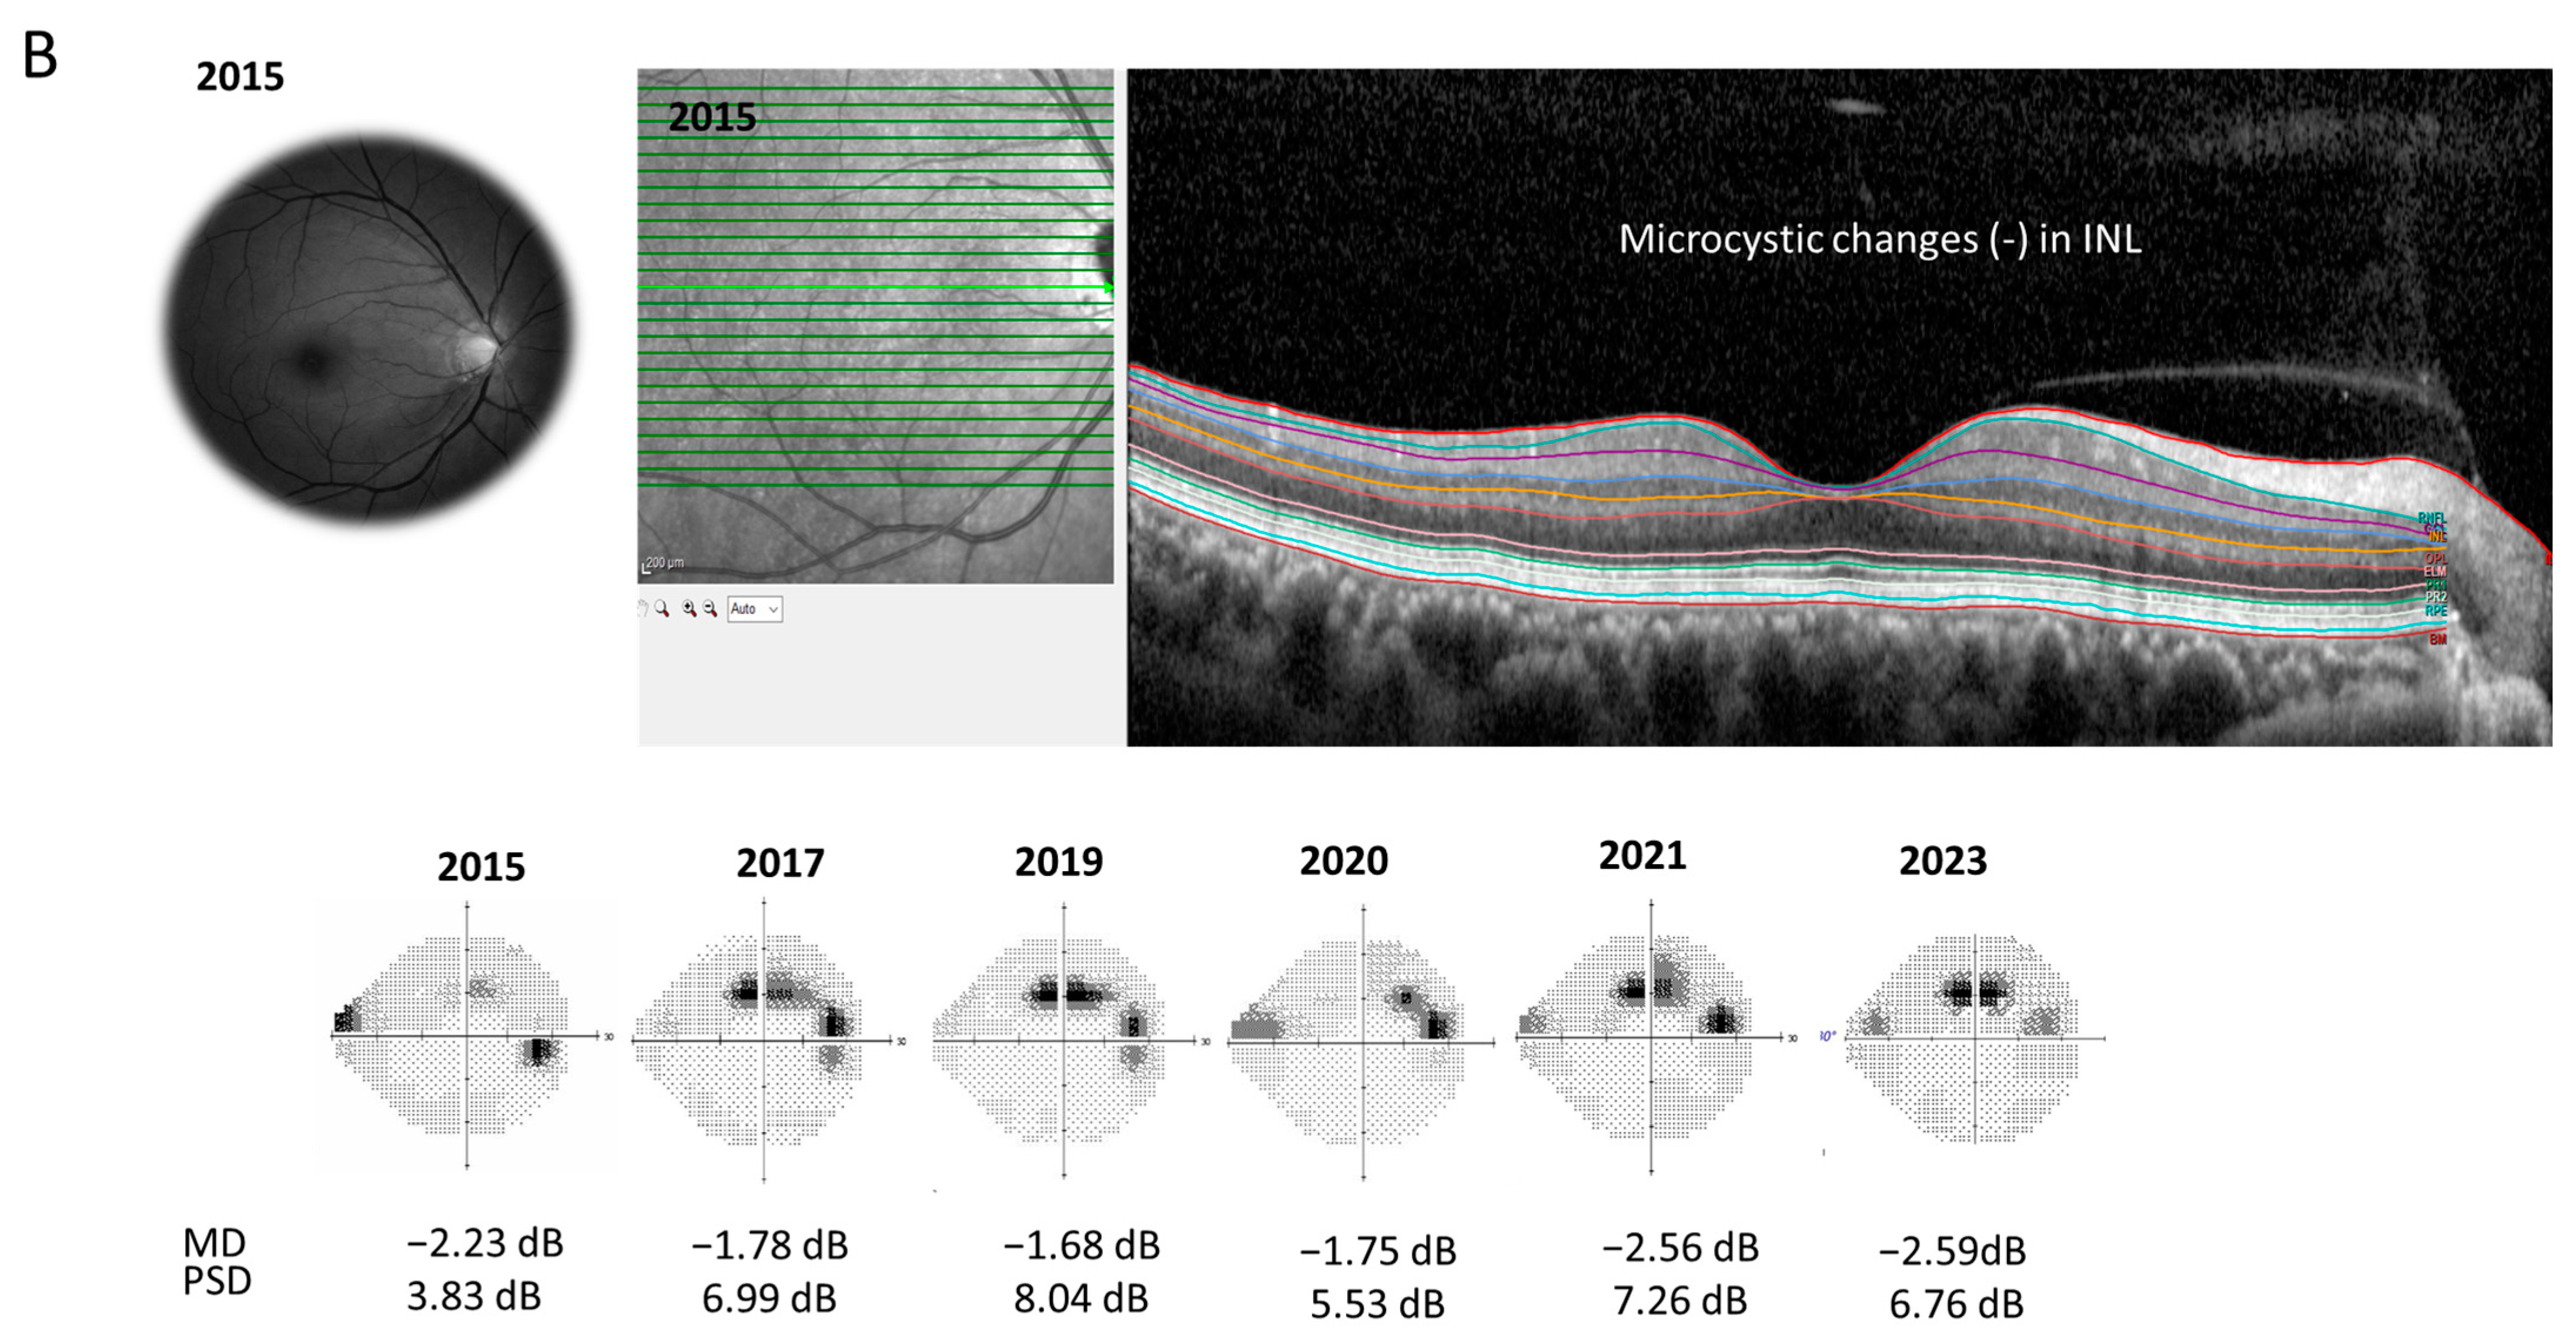
SPSS software (version 24.0; IBM Corporation, Armonk, NY, USA) was applied for statistical tests. Differences among the groups were assessed by independent t-test or the chi-squared test. Test–retest variability was determined using the intraclass correlation coefficient (ICC), with scores of ≥0.75, 0.40–0.75, and ≤0.40 points indicating excellent, moderate, and poor variability, respectively [12]. Correlations between variables were evaluated with Pearson correlation coefficients. Multivariate regression analysis was performed to compute the factors associated with the MD slope (MD change per year). Multiple logistic regression analysis was run to determine the factors associated with VF progression based on EMGT criteria. Factors with a difference of p < 0.05 between two groups were added into the multivariate regression analysis. p < 0.05 was considered to represent statistical significance.

3. Results

The mean age of the 162 patients enrolled in this study was 54.2 ± 13.6 years, and the baseline MD of the VF 24-2 test result was −4.0 ± 4.4 dB (Table 1). Among glaucoma patients, 139 patients (85.8%) were diagnosed with normal-tension glaucoma, with the remaining 23 patients (14.2%) diagnosed with primary open-angle glaucoma.
Each inner retinal layer thickness displayed excellent reproducibility for total retinal, RNFL, GCL, IPL, and INL thickness and volume measurements (ICC = 0.778–0.960; Table 2).
The baseline retinal thickness, RNFL thickness, GCL thickness, and IPL thickness each had a positive correlation with the baseline VF MD (r = 0.287–0.412, all p < 0.05; Table 3). Conversely, the baseline INL thickness had a negative correlation with the baseline VF MD (r = −0.166, p = 0.035).
Microcystic macular changes were observed in 12 (7.5%) of the 162 study participants. No patients showed microcystic macular changes on the fovea, and the mean distance from the foveal center to the nearest microcyst was 900 μm (453–1479 μm). Microcystic INL changes were found mostly in the inferior hemisphere (10 eyes, 93.3%), with one eye (8.3%) having changes in the superior hemisphere and one eye (8.3%) displaying changes in both hemispheres. Based on the foveal center, microcystic changes were predominantly found in the temporal area (7 eyes, 58.3%), being less common on the nasal side (2 eyes, 16.7%) or both sides (3 eyes, 25.0%). A correspondence between the location of microcystic changes (superior/inferior/both) and predominant VF defect location (superior/inferior/both) was observed in eight eyes (66.7%).
Patients with microcystic macular changes displayed greater proportions of having diabetes or a higher IOP SD, being in the high IOP fluctuation group based on the IOP median, having ERM, and having a lower baseline VF MD or a higher baseline PSD than those without microcystic macular changes (p = 0.004, p = 0.032, p = 0.005, p = 0.003, p = 0.003, and p = 0.008; Table 4).
Patients with microcystic macular changes had thicker average INLs and greater INL volumes than those without microcystic macular changes (p = 0.010 and p < 0.001, respectively; Table 5).
Of 162 total patients, 33 (20.4%) patients demonstrated VF progression (Table 6). The proportion of having cold hands was higher in the progressors (30.3%) compared to the nonprogressors (14.0%, p = 0.029).
Patients showing glaucoma progression had a thicker average INL and greater INL volume than those without glaucoma progression (p = 0.019 and p = 0.015; Table 7). The average INL thickness displayed a negative correlation with the MD slope (dB/year) (r = −0.244, p = 0.002). The presence of both microcystic macular changes and ERM was found more frequently in the progression group (21.2% and 12.1%) than in the nonprogression group (3.9% and 0.8%) (p = 0.003 and p = 0.006).
The univariate regression analysis (trend-based analysis) to determine the factors associated with MD slope (dB/year) revealed that patients showing microcystic macular changes, ERM, or a thicker INL were likely to have VF deterioration based on the MD slope (p = 0.016, p = 0.011, and p = 0.002, respectively; Table 8). However, only a thicker INL remained a relevant factor for VF progression in the multivariate regression analysis (p = 0.045). In the logistic regression analysis based on EMGT criteria (event-based analysis), having cold hands, microcystic macular changes, ERM, or a thicker INL, respectively, was associated with VF deterioration (p = 0.031, p = 0.002, p = 0.012, and p = 0.027, respectively). In the multiple logistic regression analysis, no factors showed a significant correlation with glaucoma progression, although the presence of microcystic macular changes was marginally associated with VF deterioration (p = 0.051).
Regarding the factors related to average INL thickness, a higher IOP SD and the presence of ERM or microcystic macular changes were associated with a thicker INL in the multivariate regression analysis (p = 0.003, p < 0.001, and p = 0.004; Table 9, Figure 2). In the subgroup analysis of patients without microcystic macular changes (n = 150), a shorter axial length and higher IOP SD were significantly related to a thicker INL in the multivariate regression analysis (p = 0.026 and p = 0.001, respectively).
Multiple logistic regression analysis revealed that having diabetes, ERM, or a higher IOP fluctuation correlates with the presence of microcystic macular changes in glaucoma patients (p = 0.021, p = 0.027, and p = 0.028, respectively; Table 10).
Representative cases are shown in Figure 3. A 36-year-old female patient with normal-tension glaucoma showed a moderate glaucomatous VF defect (MD = −6.48 dB, PSD = 8.85 dB). Progressive VF changes were observed along with microcystic macular changes in the INL of her left eye (Figure 3A). A 51-year-old female patient had early glaucomatous VF defects without microcytic macular changes in the INL (Figure 3B). Her VF defects did not progress rapidly. The average INL thickness was 37.3 μm in the first case (A) and 32.1 μm in the second case (B).

4. Discussion

In this study, glaucoma patients who showed VF progression had a higher probability of exhibiting microcystic macular changes and a greater INL thickness compared to nonprogressors. A thicker INL remained to be associated with faster VF progression in multivariate analysis. Furthermore, greater IOP fluctuation was found to be related to both a thicker INL and the presence of microcystic changes.
Patients with thicker INLs displayed more severe glaucomatous VF loss. Macular INL thickness was negatively related to baseline VF MD, whereas macular RNFL, GCL, and IPL thickness were positively associated with VF MD. This corresponds with our previous study showing the negative correlation between INL thickness and the corresponding paracentral VF sensitivities [8]. In patients with multiple sclerosis, an increased INL thickness is associated with more severe disease activity [5].
In the present study, microcystic macular changes were observed in 12 patients (7.5%). The prevalence of microcystic macula was about 2.8–8%, which can differ depending on OCT resolution and whether patients with ERM were excluded or not [3,6,7,9]. Patients with microcystic macular changes in the INL had more severe VF damage based on VF MD and PSD. The correlation between the presence of microcystic macular changes and more severe glaucomatous damage corresponds with findings of prior studies enrolling glaucoma patients [3,6,7,9]. The reason why microcystic changes in the INL or an increased INL thickness are found in diseases with optic nerve degeneration has not been elucidated definitively. Microcystic macular changes have not been linked to vascular leakage and do not involve the fovea, unlike the macular edema attributable to diabetic retinopathy or retinal vein occlusion [3,4]. In this study, there was no significant difference in best-corrected visual acuity between patients with and without microcystic macular changes (p = 0.589). Retinal vascular leakage can be excluded as the cause of microcystic changes in glaucoma patients because fluorescein angiography did not reveal dye leakage [3,13]. Several mechanisms have been suggested, such as vitreomacular traction, trans-synaptic retrograde degeneration of cells in the INL, and degeneration of Müller cells [3,4,5,6].
The presence of microcystic macular changes in the INL was marginally associated with VF deterioration based on event-based analysis (p = 0.051). The relationship between microcystic macular changes and VF progression in glaucoma is controversial. Hasegawa et al. reported that the VF MD slope was significantly worse in eyes with microcytic lesions (p = 0.013) [9]. Mahmoudinezhad et al. found that the presence of microcystic macular changes was not associated with MD and VFI decay rates, even though it is related to quicker VF progression in the superior central area [7].
In the multivariate analysis, an increased INL thickness was found to be independently associated with faster VF progression in glaucoma patients regardless of the presence of microcystic macular changes or ERM, according to the trend-based analysis (p = 0.045). This is noteworthy, even though a thicker INL was associated with the presence of microcystic changes in the univariate analysis. In patients with multiple sclerosis, increased baseline INL thickness predicts the occurrence of relapse, new brain magnetic resonance imaging T2 lesions, and disability progression, whereas the presence of microcystic macular edema is not associated with radiological disease activity or disability progression, consistent with our study [5]. No study to date has investigated the relationship between INL thickness and glaucoma progression, and the reason why glaucoma progression is associated with increased INL thickness rather than the presence of microcystic macular changes is not clear now. We speculate that an increased INL thickness might develop earlier than microcysts, or OCT resolution cannot detect the presence of very tiny microcysts in the INL when the INL thickness has already increased. Other mechanisms might exist in INL thickening, which is different from the formation of microcysts.
Regarding the factors related to INL thickness, higher IOP fluctuation was associated with a thicker INL in glaucoma patients with or without microcystic macular changes in the INL. Higher IOP fluctuations have been found to be associated with glaucoma because IOP fluctuates more in glaucoma patients than in healthy control subjects [14,15,16,17]. Controversies have existed about the effects of IOP fluctuation on glaucoma progression, even though the Advanced Glaucoma Intervention Study supported the relationship between greater IOP fluctuation and VF progression [18,19,20]. In the present study, IOP fluctuation itself was not directly related to the progression of glaucoma but showed relevance to increased INL thickness, which was a determinant of predicting more rapid VF progression. Higher IOP fluctuation could induce a kind of reactive gliosis in the retina or optic nerve head [21,22]. In a rodent glaucoma model with chronic ocular hypertension, hypertrophy of Müller cells was found from the inner limiting membrane to the outer nuclear layer, detected by increased expression of glial fibrillary acidic protein. In a glaucoma model, the dysfunction of Müller cells can be suspicious because they do not sustain increased glutamate/aspartate transporter activity as excitotoxicity is aggravated [23]. The cell bodies of Müller cells are located in the INL, and they play a role in fluid absorption of the inner retina through aquaporin channels or potassium channels [3,4,24]. We speculated that greater IOP fluctuation in glaucoma may lead to increased INL thickness, possibly by reactive gliosis or Müller cell dysfunction. Whether glial reactivation is protective or detrimental to RGCs remains unconfirmed. In a subgroup analysis of glaucoma patients without microcystic macular changes, patients with longer axial lengths had a higher probability of reduced INL thickness. Several studies have demonstrated that the INL is thinner in highly myopic eyes compared to emmetropic eyes, possibly because the INL could be made thinner by stretching [25,26].
The factors in the univariate logistic regression analysis that correlated with the presence of microcystic changes in the INL were diabetes, ERM, worse baseline MD, and higher IOP fluctuation. Among them, diabetes, ERM, and higher IOP fluctuation remained factors associated with the presence of microcystic changes in the multiple logistic regression analysis. Regarding diabetes, patients with diabetic retinopathy were excluded from this study, and microcystic changes in patients with diabetes did not involve the fovea. Previously, we reported that diabetic rats showed increased IOP fluctuations, RGC apoptosis, gliosis, and neuroinflammation [27]. Therefore, subclinical inflammation or IOP fluctuations associated with diabetes might affect the formation of microcystic changes in the INL, even though further studies are acquired to elucidate the precise mechanisms. Govetto et al. found that the likelihood of developing microcystic macular changes in the INL was greater in patients with advanced ERM stages and glaucoma, consistent with our study [24]. Mahmoudinezhad et al. reported no association between ERM and the presence of microcystic macular changes [7]. Given these findings and our results, the presence of ERM might help to decrease the threshold for the formation of microcystic macular changes, and other mechanisms may also play a role in the formation of microcystic changes in glaucoma patients. Being in the higher IOP fluctuation group (established based on the median SD of long-term IOP measurements) was associated with the presence of microcystic macular changes. Greater IOP fluctuation might induce a kind of reactive gliosis in the retina and could affect the formation of microcystic changes, as we assumed about the relationship between the IOP fluctuation and INL thickness, although this is just a speculation [21,22]. Further studies need to confirm the specific mechanism in the relationship between IOP fluctuation and microcystic changes or INL thickness. We found no relationship between age and the presence of microcystic changes, in accordance with the study by Hasegawa et al. [9], whereas another study reported that younger age correlates with microcystic changes [7]. Previous studies did not include systemic diseases such as diabetes or IOP fluctuations as variables when investigating factors related to the presence of microcystic changes in the INL [7,9].
To decrease bias associated with segmentation errors in automated layer segmentation, we confirmed the segmentation of all OCT scans and excluded the cases with artifacts or misalignment. In this study, we checked the variability of each retinal layer thickness, and each inner retinal layer thickness displayed excellent reproducibility.

5. Conclusions

A thicker INL was associated with subsequent VF progression in glaucoma patients. We found that higher IOP fluctuation contributes to both increased INL thickness and the formation of microcystic changes in glaucoma. Measurements of macular INL thickness or observation of microcystic changes might be helpful in predicting the future progression of glaucoma, especially in glaucoma patients with greater IOP fluctuation. Further prospective studies are necessary to establish the mechanisms behind increased INL thickness or the formation of microcysts and reveal longitudinal INL changes in glaucoma patients.

Author Contributions

K.I.J.: Writing—original draft, Funding acquisition, Formal analysis, and Validation; H.K.R.: Formal analysis and Methodology; S.E.O.: Validation, Methodology; H.J.S.: Formal analysis and Visualization; C.K.P.: Supervision. All authors have read and agreed to the published version of the manuscript.

Funding

This work was supported by the National Research Foundation of Korea (NRF) grant funded by the Korea government (MSIT) (No. 2020R1A2C1102368). The funders had no role in the study design, data collection and analysis, the decision to publish, or preparation of the manuscript.

Institutional Review Board Statement

The study was conducted in accordance with the Declaration of Helsinki and approved by the Institutional Review Board of the Catholic University of Korea, Seoul, Republic of Korea (KC23RISI0100) on 17 February 2023.

Informed Consent Statement

Patient consent was waived due to the retrospective nature of this study.

Data Availability Statement

The data presented in this study are available on request from the corresponding author. The data are not publicly available due to privacy.

Conflicts of Interest

The authors declare no conflicts of interest. The funders had no role in the design of the study; in the collection, analyses, or interpretation of data; in the writing of the manuscript; or in the decision to publish the results.

References

  1. Nork, T.M.; Ver Hoeve, J.N.; Poulsen, G.L.; Nickells, R.W.; Davis, M.D.; Weber, A.J.; Vaegan; Sarks, S.H.; Lemley, H.L.; Millecchia, L.L. Swelling and loss of photoreceptors in chronic human and experimental glaucomas. Arch. Ophthalmol. 2000, 118, 235–245. [Google Scholar] [CrossRef]
  2. Velten, I.M.; Korth, M.; Horn, F.K. The a-wave of the dark adapted electroretinogram in glaucomas: Are photoreceptors affected? Br. J. Ophthalmol. 2001, 85, 397–402. [Google Scholar] [CrossRef] [PubMed]
  3. Kessel, L.; Hamann, S.; Wegener, M.; Tong, J.; Fraser, C.L. Microcystic macular oedema in optic neuropathy: Case series and literature review. Clin. Exp. Ophthalmol. 2018, 46, 1075–1086. [Google Scholar] [CrossRef] [PubMed]
  4. Abegg, M.; Dysli, M.; Wolf, S.; Kowal, J.; Dufour, P.; Zinkernagel, M. Microcystic macular edema: Retrograde maculopathy caused by optic neuropathy. Ophthalmology 2014, 121, 142–149. [Google Scholar] [CrossRef]
  5. Saidha, S.; Sotirchos, E.S.; Ibrahim, M.A.; Crainiceanu, C.M.; Gelfand, J.M.; Sepah, Y.J.; Ratchford, J.N.; Oh, J.; Seigo, M.A.; Newsome, S.D.; et al. Microcystic macular oedema, thickness of the inner nuclear layer of the retina, and disease characteristics in multiple sclerosis: A retrospective study. Lancet Neurol. 2012, 11, 963–972. [Google Scholar] [CrossRef] [PubMed]
  6. Brazerol, J.; Iliev, M.E.; Hohn, R.; Frankl, S.; Grabe, H.; Abegg, M. Retrograde Maculopathy in Patients with Glaucoma. J. Glaucoma 2017, 26, 423–429. [Google Scholar] [CrossRef]
  7. Mahmoudinezhad, G.; Salazar, D.; Morales, E.; Tran, P.; Lee, J.; Hubschman, J.P.; Nouri-Mahdavi, K.; Caprioli, J. Risk factors for microcystic macular oedema in glaucoma. Br. J. Ophthalmol. 2023, 107, 505–510. [Google Scholar] [CrossRef]
  8. Kim, E.K.; Park, H.L.; Park, C.K. Relationship between Retinal Inner Nuclear Layer Thickness and Severity of Visual Field Loss in Glaucoma. Sci. Rep. 2017, 7, 5543. [Google Scholar] [CrossRef]
  9. Hasegawa, T.; Akagi, T.; Yoshikawa, M.; Suda, K.; Yamada, H.; Kimura, Y.; Nakanishi, H.; Miyake, M.; Unoki, N.; Ikeda, H.O.; et al. Microcystic Inner Nuclear Layer Changes and Retinal Nerve Fiber Layer Defects in Eyes with Glaucoma. PLoS ONE 2015, 10, e0130175. [Google Scholar] [CrossRef]
  10. Burggraaff, M.C.; Trieu, J.; de Vries-Knoppert, W.A.; Balk, L.; Petzold, A. The clinical spectrum of microcystic macular edema. Investig. Ophthalmol. Vis. Sci. 2014, 55, 952–961. [Google Scholar] [CrossRef]
  11. Heijl, A.; Leske, M.C.; Bengtsson, B.; Bengtsson, B.; Hussein, M.; Early Manifest Glaucoma Trial Group. Measuring visual field progression in the Early Manifest Glaucoma Trial. Acta Ophthalmol. Scand. 2003, 81, 286–293. [Google Scholar] [CrossRef] [PubMed]
  12. Fleiss, J.L. Reliability of Measurements. In The Design and Analysis of Clinical Experiments; Wiley: New York, NY, USA, 1986; pp. 1–32. [Google Scholar]
  13. Wolff, B.; Basdekidou, C.; Vasseur, V.; Mauget-Faysse, M.; Sahel, J.A.; Vignal, C. Retinal inner nuclear layer microcystic changes in optic nerve atrophy: A novel spectral-domain OCT finding. Retina 2013, 33, 2133–2138. [Google Scholar] [CrossRef] [PubMed]
  14. Agnifili, L.; Mastropasqua, R.; Frezzotti, P.; Fasanella, V.; Motolese, I.; Pedrotti, E.; Di Iorio, A.; Mattei, P.A.; Motolese, E.; Mastropasqua, L. Circadian intraocular pressure patterns in healthy subjects, primary open angle and normal tension glaucoma patients with a contact lens sensor. Acta Ophthalmol. 2015, 93, e14–e21. [Google Scholar] [CrossRef]
  15. Tojo, N.; Abe, S.; Ishida, M.; Yagou, T.; Hayashi, A. The Fluctuation of Intraocular Pressure Measured by a Contact Lens Sensor in Normal-Tension Glaucoma Patients and Nonglaucoma Subjects. J. Glaucoma 2017, 26, 195–200. [Google Scholar] [CrossRef]
  16. Moon, Y.; Lee, J.Y.; Jeong, D.W.; Kim, S.; Han, S.; Kook, M.S. Relationship Between Nocturnal Intraocular Pressure Elevation and Diurnal Intraocular Pressure Level in Normal-Tension Glaucoma Patients. Investig. Ophthalmol. Vis. Sci. 2015, 56, 5271–5279. [Google Scholar] [CrossRef] [PubMed]
  17. Kim, Y.W.; Kim, J.S.; Lee, S.Y.; Ha, A.; Lee, J.; Park, Y.J.; Kim, Y.K.; Jeoung, J.W.; Park, K.H. Twenty-four-Hour Intraocular Pressure-Related Patterns from Contact Lens Sensors in Normal-Tension Glaucoma and Healthy Eyes: The Exploring Nyctohemeral Intraocular pressure related pattern for Glaucoma Management (ENIGMA) Study. Ophthalmology 2020, 127, 1487–1497. [Google Scholar] [CrossRef]
  18. Sakata, R.; Yoshitomi, T.; Iwase, A.; Matsumoto, C.; Higashide, T.; Shirakashi, M.; Aihara, M.; Sugiyama, K.; Araie, M.; Lower Normal Pressure Glaucoma Study Members in Japan Glaucoma Society. Factors Associated with Progression of Japanese Open-Angle Glaucoma with Lower Normal Intraocular Pressure. Ophthalmology 2019, 126, 1107–1116. [Google Scholar] [CrossRef]
  19. Nouri-Mahdavi, K.; Hoffman, D.; Coleman, A.L.; Liu, G.; Li, G.; Gaasterland, D.; Caprioli, J.; Advanced Glaucoma Intervention Study. Predictive factors for glaucomatous visual field progression in the Advanced Glaucoma Intervention Study. Ophthalmology 2004, 111, 1627–1635. [Google Scholar] [CrossRef]
  20. Baek, S.U.; Ha, A.; Kim, D.W.; Jeoung, J.W.; Park, K.H.; Kim, Y.K. Risk factors for disease progression in low-teens normal-tension glaucoma. Br. J. Ophthalmol. 2020, 104, 81–86. [Google Scholar] [CrossRef]
  21. Shin, D.Y.; Park, H.L.; Shin, H.; Oh, S.E.; Kim, S.A.; Jung, Y.; Lee, M.Y.; Park, C.K. Fluctuation of Intraocular Pressure and Vascular Factors Are Associated with the Development of Epiretinal Membrane in Glaucoma. Am. J. Ophthalmol. 2023, 254, 69–79. [Google Scholar] [CrossRef]
  22. Joos, K.M.; Li, C.; Sappington, R.M. Morphometric changes in the rat optic nerve following short-term intermittent elevations in intraocular pressure. Investig. Ophthalmol. Vis. Sci. 2010, 51, 6431–6440. [Google Scholar] [CrossRef] [PubMed]
  23. Jung, K.I.; Kim, J.H.; Park, C.K. alpha2-Adrenergic modulation of the glutamate receptor and transporter function in a chronic ocular hypertension model. Eur. J. Pharmacol. 2015, 765, 274–283. [Google Scholar] [CrossRef] [PubMed]
  24. Govetto, A.; Su, D.; Farajzadeh, M.; Megerdichian, A.; Platner, E.; Ducournau, Y.; Virgili, G.; Hubschman, J.P. Microcystoid Macular Changes in Association with Idiopathic Epiretinal Membranes in Eyes with and without Glaucoma: Clinical Insights. Am. J. Ophthalmol. 2017, 181, 156–165. [Google Scholar] [CrossRef] [PubMed]
  25. Kim, T.Y.; Lee, M.W.; Baek, S.K.; Lee, Y.H. Comparison of Retinal Layer Thicknesses of Highly Myopic Eyes and Normal Eyes. Korean J. Ophthalmol. 2020, 34, 469–477. [Google Scholar] [CrossRef] [PubMed]
  26. Liu, X.; Shen, M.; Yuan, Y.; Huang, S.; Zhu, D.; Ma, Q.; Ye, X.; Lu, F. Macular Thickness Profiles of Intraretinal Layers in Myopia Evaluated by Ultrahigh-Resolution Optical Coherence Tomography. Am. J. Ophthalmol. 2015, 160, 53–61.e52. [Google Scholar] [CrossRef]
  27. Jung, K.I.; Woo, J.E.; Park, C.K. Intraocular pressure fluctuation and neurodegeneration in the diabetic rat retina. Br. J. Pharmacol. 2020, 177, 3046–3059. [Google Scholar] [CrossRef]
Figure 1. Segmentation of the retinal layers. (A) Segmentation was carried out automatically by a segmentation application (Segmentation Technology; Heidelberg Engineering). The automated segmentation program shows 11 different retinal demarcation lines: the inner limiting membrane, the boundaries between the RNFL and the ganglion cell layer (GCL); between the GCL and the inner plexiform layer (IPL); between the IPL and the inner nuclear layer (INL); between the INL and the outer plexiform layer; between the outer plexiform layer and the outer nuclear layer; and between the external limiting membrane, two photoreceptor layers (PR1/2), the RPE, and Bruch’s membrane. (B) After automatic segmentation of the retinal layers, thickness measurements were displayed for every segmented retinal layer inside of the nine 1, 3, and 6 mm grid sectors defined by the Early Treatment Diabetic Retinopathy Study (ETDRS) grid on the thickness map. (C) Microcystoid macular change (arrow) was defined by the presence of multiple, small hyporeflective round or elliptical cystoid spaces without a cyst wall observed in the INL and not confluent with cystoid spaces in other retinal layers.
Jcm 13 02312 g001
Figure 2. The relationship between intraocular pressure (IOP) fluctuations and the macular inner nuclear layer (INL) thickness. A higher standard deviation of IOP was associated with a thicker INL (r = 0.267, p = 0.001).
Jcm 13 02312 g002
Figure 3. A representative case. (A) A 36-year-old female patient showed macular microcystic changes (arrow) in the inner nuclear layer (INL) and moderate glaucomatous visual field (VF) defects in 2015. The average INL thickness was 37.3 μm. The patient showed VF progression from 2015 to 2023. (B) A 51-year-old female patient had early glaucomatous VF defects and did not display microcytic macular changes in the INL. The average INL thickness was 32.1 μm, which is relatively thin. Her VF defects did not progress significantly.
Jcm 13 02312 g003aJcm 13 02312 g003b
Table 1. Demographics of total patients with glaucoma.
Eyes with Glaucoma (n = 162)
Age (years)54.2 ± 13.6
Male/Female78/84
Diabetes (%)25 (15.4%)
Systemic hypertension (%)44 (27.2%)
Migraine (%)30 (18.5%)
Cold hand (%)28 (17.3%)
Cardiovascular disease (%)22 (13.6%)
Thyroid disease18 (11.1%)
Systolic blood pressure (mmHg)126.4 ± 15.0
Diastolic blood pressure (mmHg)79.1 ± 8.4
Body mass index (kg/m2)23.3 ± 3.0
Central corneal thickness (µm)536.4 ± 35.7
Axial length (mm)24.8 ± 1.5
Spherical equivalent (diopter)−2.5 ± 3.5
Mean IOP (mmHg)14.7 ± 2.4
SD of IOP (mmHg)2.3 ± 0.7
Presence of disc hemorrhage (%)21 (13.3%)
Presence of microcystic macular changes12 (7.4%)
Baseline MD of VF 24-2 (dB)−4.0 ± 4.4
Baseline PSD of VF 24-2 (dB)4.7 ± 4.0
IOP, intraocular pressure; MD, mean deviation; PSD, pattern standard deviation; SD, standard deviation.
Table 2. Reliability of each inner retinal layer thickness.
OCT ParametersICC95% CIp Value
RetinaAverage (µm)0.9060.821–0.951<0.001
Volume (mm3)0.9600.923–0.980<0.001
RNFLAverage (µm)0.7780.604–0.882<0.001
Volume (mm3)0.9070.823–0.952<0.001
GCLAverage (µm)0.9280.863–0.963<0.001
Volume (mm3)0.9510.905–0.975<0.001
IPLAverage (µm)0.9500.903–0.974<0.001
Volume (mm3)0.9600.922–0.980<0.001
INLAverage (µm)0.8840.782–0.940<0.001
Volume (mm3)0.9170.840–0.957<0.001
GCL, ganglion cell layer; ICC, intraclass correlation coefficient; INL, inner nuclear layer; IPL, inner plexiform layer; OCT, optical coherence tomography; RNFL, retinal nerve fiber layer. The variables that were statistically significant in the Pearson correlation coefficients were indicated in bold.
Table 3. The association between each retinal layer thickness and initial VF mean deviation.
OCT Parametersrp Value
Retinal thicknessAverage (µm)0.287<0.001
Volume (mm3)0.323<0.001
RNFL thicknessAverage (µm)0.295<0.001
Volume (mm3)0.384<0.001
GCL thicknessAverage (µm)0.406<0.001
Volume (mm3)0.412<0.001
IPL thicknessAverage (µm)0.377<0.001
Volume (mm3)0.350<0.001
INL thicknessAverage (µm)−0.1660.035
Volume (mm3)−0.1440.068
GCL, ganglion cell layer; INL, inner nuclear layer; IPL, inner plexiform layer; OCT, optical coherence tomography; RNFL, retinal nerve fiber layer; VF, visual field. The variables that were statistically significant in the Pearson correlation coefficients were indicated in bold.
Table 4. Baseline characteristics of glaucoma patients according to the presence of microcystic macular changes.
Microcystic Macular Changes (−)
(n = 150)
Microcystic Macular Changes (+)
(n = 12)
p Value
Age (years)54.1 ± 13.356.1 ± 16.80.628
Male/Female72/786/61.000
Diabetes (%)19 (12.7%)6 (50.0%)0.004
Systemic hypertension (%)40 (26.7%)4 (33.3%)0.736
Migraine (%)30 (20%)0 (0%)0.125
Cold hand (%)25 (16.7%)3 (25.0%)0.437
Cardiovascular disease (%)19 (12.7%)3 (25.0%)0.211
Thyroid disease18 (12.0%)0 (0.0%)0.364
Systolic blood pressure (mmHg)125.9 ± 15.1134.6 ± 7.80.207
Diastolic blood pressure (mmHg)79.0 ± 8.682.2 ± 3.50.416
Body mass index (kg/m2)23.4 ± 3.122.8 ± 1.10.615
Central corneal thickness (µm)535.8 ± 36.3543.9 ± 32.60.497
Axial length (mm)24.9 ± 1.524.9 ± 1.50.919
BCVA (log MAR)0.03 ± 0.050.03 ± 0.050.589
Spherical equivalent (diopter)−2.5 ± 3.5−3.8 ± 4.40.246
Mean IOP (mmHg)14.7 ± 2.414.7 ± 2.00.928
SD of IOP (mmHg)2.2 ± 0.72.7 ± 0.80.032
IOP fluctuation (Higher/lower)70 (46.7%)/80 (53.3%)11 (91.7%)/1 (8.3%)0.005
Presence of
disc hemorrhage (%)
19 (13.4%)1 (8.3%)1.000
Presence of ERM2 (1.3%)3 (25.0%)0.003
Baseline MD of VF 24-2 (dB)−3.7 ± 4.2−7.6 ± 5.00.003
Baseline PSD of VF 24-2 (dB)4.5 ± 3.97.8 ± 4.60.008
BCVA, best-corrected visual acuity; ERM, epiretinal membrane; IOP, intraocular pressure; MD, mean deviation; PSD, pattern standard deviation; SD, standard deviation; VF, visual field. Statistically significant differences between two groups (p < 0.05) by Student’s t-test for continuous variables or chi-squared test for categorical data are indicated in bold.
Table 5. Each retinal layer thickness according to the presence of microcystic macular changes.
OCT ParametersMicrocystic Macular Change (−)
(n = 150)
Microcystic Macular Change (+)
(n = 12)
p Value
RetinaAverage (µm)302.06 ± 15.03307.24 ± 25.990.283
Volume (mm3)8.30 ± 0.438.39 ± 0.660.509
RNFLAverage (µm)23.88 ± 4.1725.13 ± 7.230.351
Volume (mm3)0.80 ± 0.160.79 ± 0.190.566
GCLAverage (µm)34.96 ± 5.8433.50 ± 8.410.426
Volume (mm3)0.95 ± 0.150.92 ± 0.220.516
IPLAverage (µm)30.56 ± 3.7530.63 ± 5.620.950
Volume (mm3)0.82 ± 0.100.83 ± 0.150.748
INLAverage (µm)34.43 ± 2.3838.29 ± 4.280.010
Volume (mm3)0.96 ± 0.061.06 ± 0.10<0.001
GCL, ganglion cell layer; INL, inner nuclear layerIPL, inner plexiform layer; RNFL, retinal nerve fiber layer;. Statistically significant differences between two groups (p < 0.05) by Student’s t-test for continuous variables are indicated in bold.
Table 6. Baseline characteristics of glaucoma patients according to progression of visual field defects.
Nonprogressors
(n = 129)
Progressors
(n = 33)
p Value
Age (years)54.6 ± 13.053.0 ± 15.80.546
Male/Female65/6413/200.330
Diabetes (%)21 (16.3%)4 (12.1%)0.787
Systemic hypertension (%)36 (27.9%)8 (24.2%)0.827
Migraine (%)23 (17.8%)7 (21.2%)0.624
Cold hand (%)18 (14.0%)10 (30.3%)0.029
Cardiovascular disease (%)20 (15.5%)2 (6.1%)0.253
Thyroid disease15 (11.6%)3 (9.1%)1.000
Systolic blood pressure (mmHg)127.2 ± 15.3122.4 ± 12.10.279
Diastolic blood pressure (mmHg)79.4 ± 8.678.1 ± 7.30.580
Body mass index (kg/m2)23.4 ± 2.923.2 ± 3.70.787
Central corneal thickness (µm)534.7 ± 36.3540.3 ± 33.00.487
Axial length (mm)24.9 ± 1.524.8 ± 1.40.867
Spherical equivalent (diopter)−2.6 ± 3.6−2.6 ± 3.20.950
Mean IOP (mmHg)14.6 ± 2.514.7 ± 2.10.833
SD of IOP (mmHg)2.2 ± 0.72.4 ± 0.70.396
Presence of disc hemorrhage (%)16 (12.4%)5 (15.2%)0.771
Baseline MD of VF 24-2 (dB)−3.9 ± 4.3−4.5 ± 4.60.488
Baseline PSD of VF 24-2 (dB)4.5 ± 3.95.8 ± 4.50.096
Follow-up duration (months)97.1 ± 25.2104.2 ± 24.10.148
IOP, intraocular pressure; MD, mean deviation; PSD, pattern standard deviation; SD, standard deviation; VF, visual field. Statistically significant differences between two groups (p < 0.05) by Student’s t-test for continuous variables or chi-squared test for categorical data are indicated in bold.
Table 7. Each retinal layer thickness according to the progression of visual field defects.
Findings Observed on OCTNonprogressors
(n = 129)
Progressors
(n = 33)
p Value
Microcystic macular changes5 (3.9%)7 (21.2%)0.003
Epiretinal membrane1 (0.8%)4 (12.1%)0.006
Each retinal layer thicknessRetinaAverage (µm)302.08 ± 15.32303.88 ± 18.750.567
Volume (mm3)8.31 ± 0.438.33 ± 0.510.829
RNFLAverage (µm)24.00 ± 4.4823.87 ± 4.350.879
Volume (mm3)0.81 ± 0.160.78 ± 0.140.478
GCLAverage (µm)34.91 ± 6.0134.64 ± 6.290.827
Volume (mm3)0.95 ± 0.150.94 ± 0.160.783
IPLAverage (µm)30.57 ± 3.7830.52 ± 4.390.943
Volume (mm3)0.82 ± 0.100.81 ± 0.110.839
INLAverage (µm)34.47 ± 2.5535.72 ± 3.240.019
Volume (mm3)0.96 ± 0.060.99 ± 0.080.015
GCL, ganglion cell layer; INL, inner nuclear layer; IPL, inner plexiform layer; OCT, optical coherence tomography; RNFL, retinal nerve fiber layer. Statistically significant differences between two groups (p < 0.05) by Student’s t-test are indicated in bold.
Table 8. Multivariate analysis of factors associated with visual field progression.
ParametersTrend-Based Analysis (MD Change/Year)Event-Based Analysis (EMGT Criteria)
UnivariateMultivariateUnivariateMultivariate
β Coefficient (95% CI)p Valueβ Coefficient (95% CI)p Valueβ Coefficient (95% CI)p Valueβ Coefficient (95% CI)p Value
Presence of cold hand−0.180
(−0.377~0.017)
0.073 2.681
(1.097~6.555)
0.0312.283
(0.864~6.035)
0.096
Presence of microcystic macular changes−0.349
(−0.631~−0.066)
0.016−0.164
(−0.473~0.145)
0.2976.677
(1.965~22.685)
0.0024.037
(0.992~16.430)
0.051
Presence of ERM−0.554
(−0.981~−0.127)
0.011−0.286
(−0.755~0.183)
0.2306.378
(1.902~163.874)
0.0124.918
(0.419~57.681)
0.205
Average INL thickness−0.043
(−0.070~−0.016)
0.002−0.030
(−0.060~−0.001)
0.0451.176
(1.018~1.357)
0.0271.062
(0.893~1.262)
0.497
ERM, epiretinal membrane; INL, inner nuclear layer; MD, mean deviation. Multivariate regression analysis of factors associated with MD slope (dB/year) and multiple logistic regression analysis of factors associated with VF progression based on EMGT criteria were applied to the variables showing p value < 0.05 in each univariate analysis. The variables that were statistically significant in the multivariate regression analysis and multiple logistic regression analysis were indicated in bold.
Table 9. Factors associated with average inner nuclear thickness in patients with glaucoma.
ParametersTotal PatientsPatients without Microcystic Macular Changes
UnivariateMultivariateUnivariateMultivariate
β Coefficient (95% CI)p Valueβ Coefficient
(95% CI)
p Valueβ Coefficient (95% CI)p Valueβ Coefficient (95% CI)p Value
Age0.029
(−0.002~0.061)
0.064 0.019
(−0.009~0.048)
0.186
Sex−0.460
(−1.312~0.392)
0.288 −0.621
(−1.387~0.145)
0.111
Diabetes0.841
(−0.334~2.016)
0.160 0.748
(−0.406~1.901)
0.202
Systemic hypertension−0.053
(−1.013~0.908)
0.914 0.070
(−0.802~0.942)
0.874
Systolic BP (mmHg)0.012
(−0.022~0.046)
0.489 0.009
(−0.024~0.043)
0.576
Diastolic BP (mmHg)−0.005
(−0.065~0.055)
0.869 −0.008
(−0.067~0.051)
0.787
CCT (µm)0.007
(−0.007~0.020)
0.336 −0.002(−0.014~0.010)0.750
Axial length (mm)0.067
(−0.216~0.351)
0.639 −0.372
(−0.656~−0.088)
0.011−0.310
(−0.583~0.037)
0.026
Mean IOP (mmHg)0.072
(−0.105~0.249)
0.424 0.067
(−0.091~0.225)
0.401
SD of IOP (mmHg)1.081 (0.471~1.692)0.0010.861 (0.288~1.434)0.0030.815
(0.244~1.386)
0.0051.107
(0.477~1.737)
0.001
Presence of optic disc hemorrhage−0.735
(−2.029~0.559)
0.264 0.261
(−0.873~1.395)
0.650
Baseline VF MD−0.104
(−0.200~0.008)
0.0350.049
(0.130~0.227)
0.593−0.056
(−0.148~0.035)
0.225
Baseline VF PSD0.107 (0.002~0.211)0.0460.102
(0.090~0.294)
0.2950.061
(−0.038~0.159)
0.226
Presence of ERM5.884
(3.591~8.176)
<0.0014.331
(2.004~6.658)
<0.0013.332
(0.012~6.652)
0.0492.329
(−1.971~6.629)
0.285
Presence of microcystic macular changes3.852
(2.336~5.368)
<0.0012.315
(0.734~3.896)
0.004
BP, blood pressure; CCT, central corneal thickness; ERM, epiretinal membrane; IOP, intraocular pressure; MD, mean deviation; PSD, pattern standard deviation; SD, standard deviation; VF, visual field. The variables that were statistically significant in the univariate and multivariate regression analysis were indicated in bold.
Table 10. Logistic regression analysis of factors associated with the presence of microcystic macular changes.
VariablesUnivariateMultivariate
β Coefficient (95% CI)p Valueβ Coefficient (95% CI)p Value
Presence of diabetes6.895
(2.016~23.580)
0.0025.838
(1.301~26.201)
0.021
Presence of ERM24.667
(3.647~1666.834)
0.00114.590
(0.364~156.115)
0.027
Baseline MD0.860
(0.773~0.957)
0.0060.906
(0.796~1.041)
0.169
Higher IOP fluctuation12.571
(1.583~99.835)
0.01711.089
(1.288~95.430)
0.028
ERM, epiretinal membrane; IOP, intraocular pressure; MD, mean deviation. The variables that were statistically significant in the logistic regression analysis are indicated in bold.
Disclaimer/Publisher’s Note: The statements, opinions and data contained in all publications are solely those of the individual author(s) and contributor(s) and not of MDPI and/or the editor(s). MDPI and/or the editor(s) disclaim responsibility for any injury to people or property resulting from any ideas, methods, instructions or products referred to in the content.

