

Vascular Perfusion Variability in Diabetic Retinopathy: A Sequential Interscan Optical Coherence Tomography Angiography Assessment

 , , , , ,
 ,
,
Abstract
1. Introduction
2. Materials and Methods
2.1. Study Design
2.2. Study Population
2.3. OCT-A Acquisition
2.4. Quantitative Assessment of OCT-A Images
2.5. Statistical Analysis
3. Results
3.1. Demographic Data
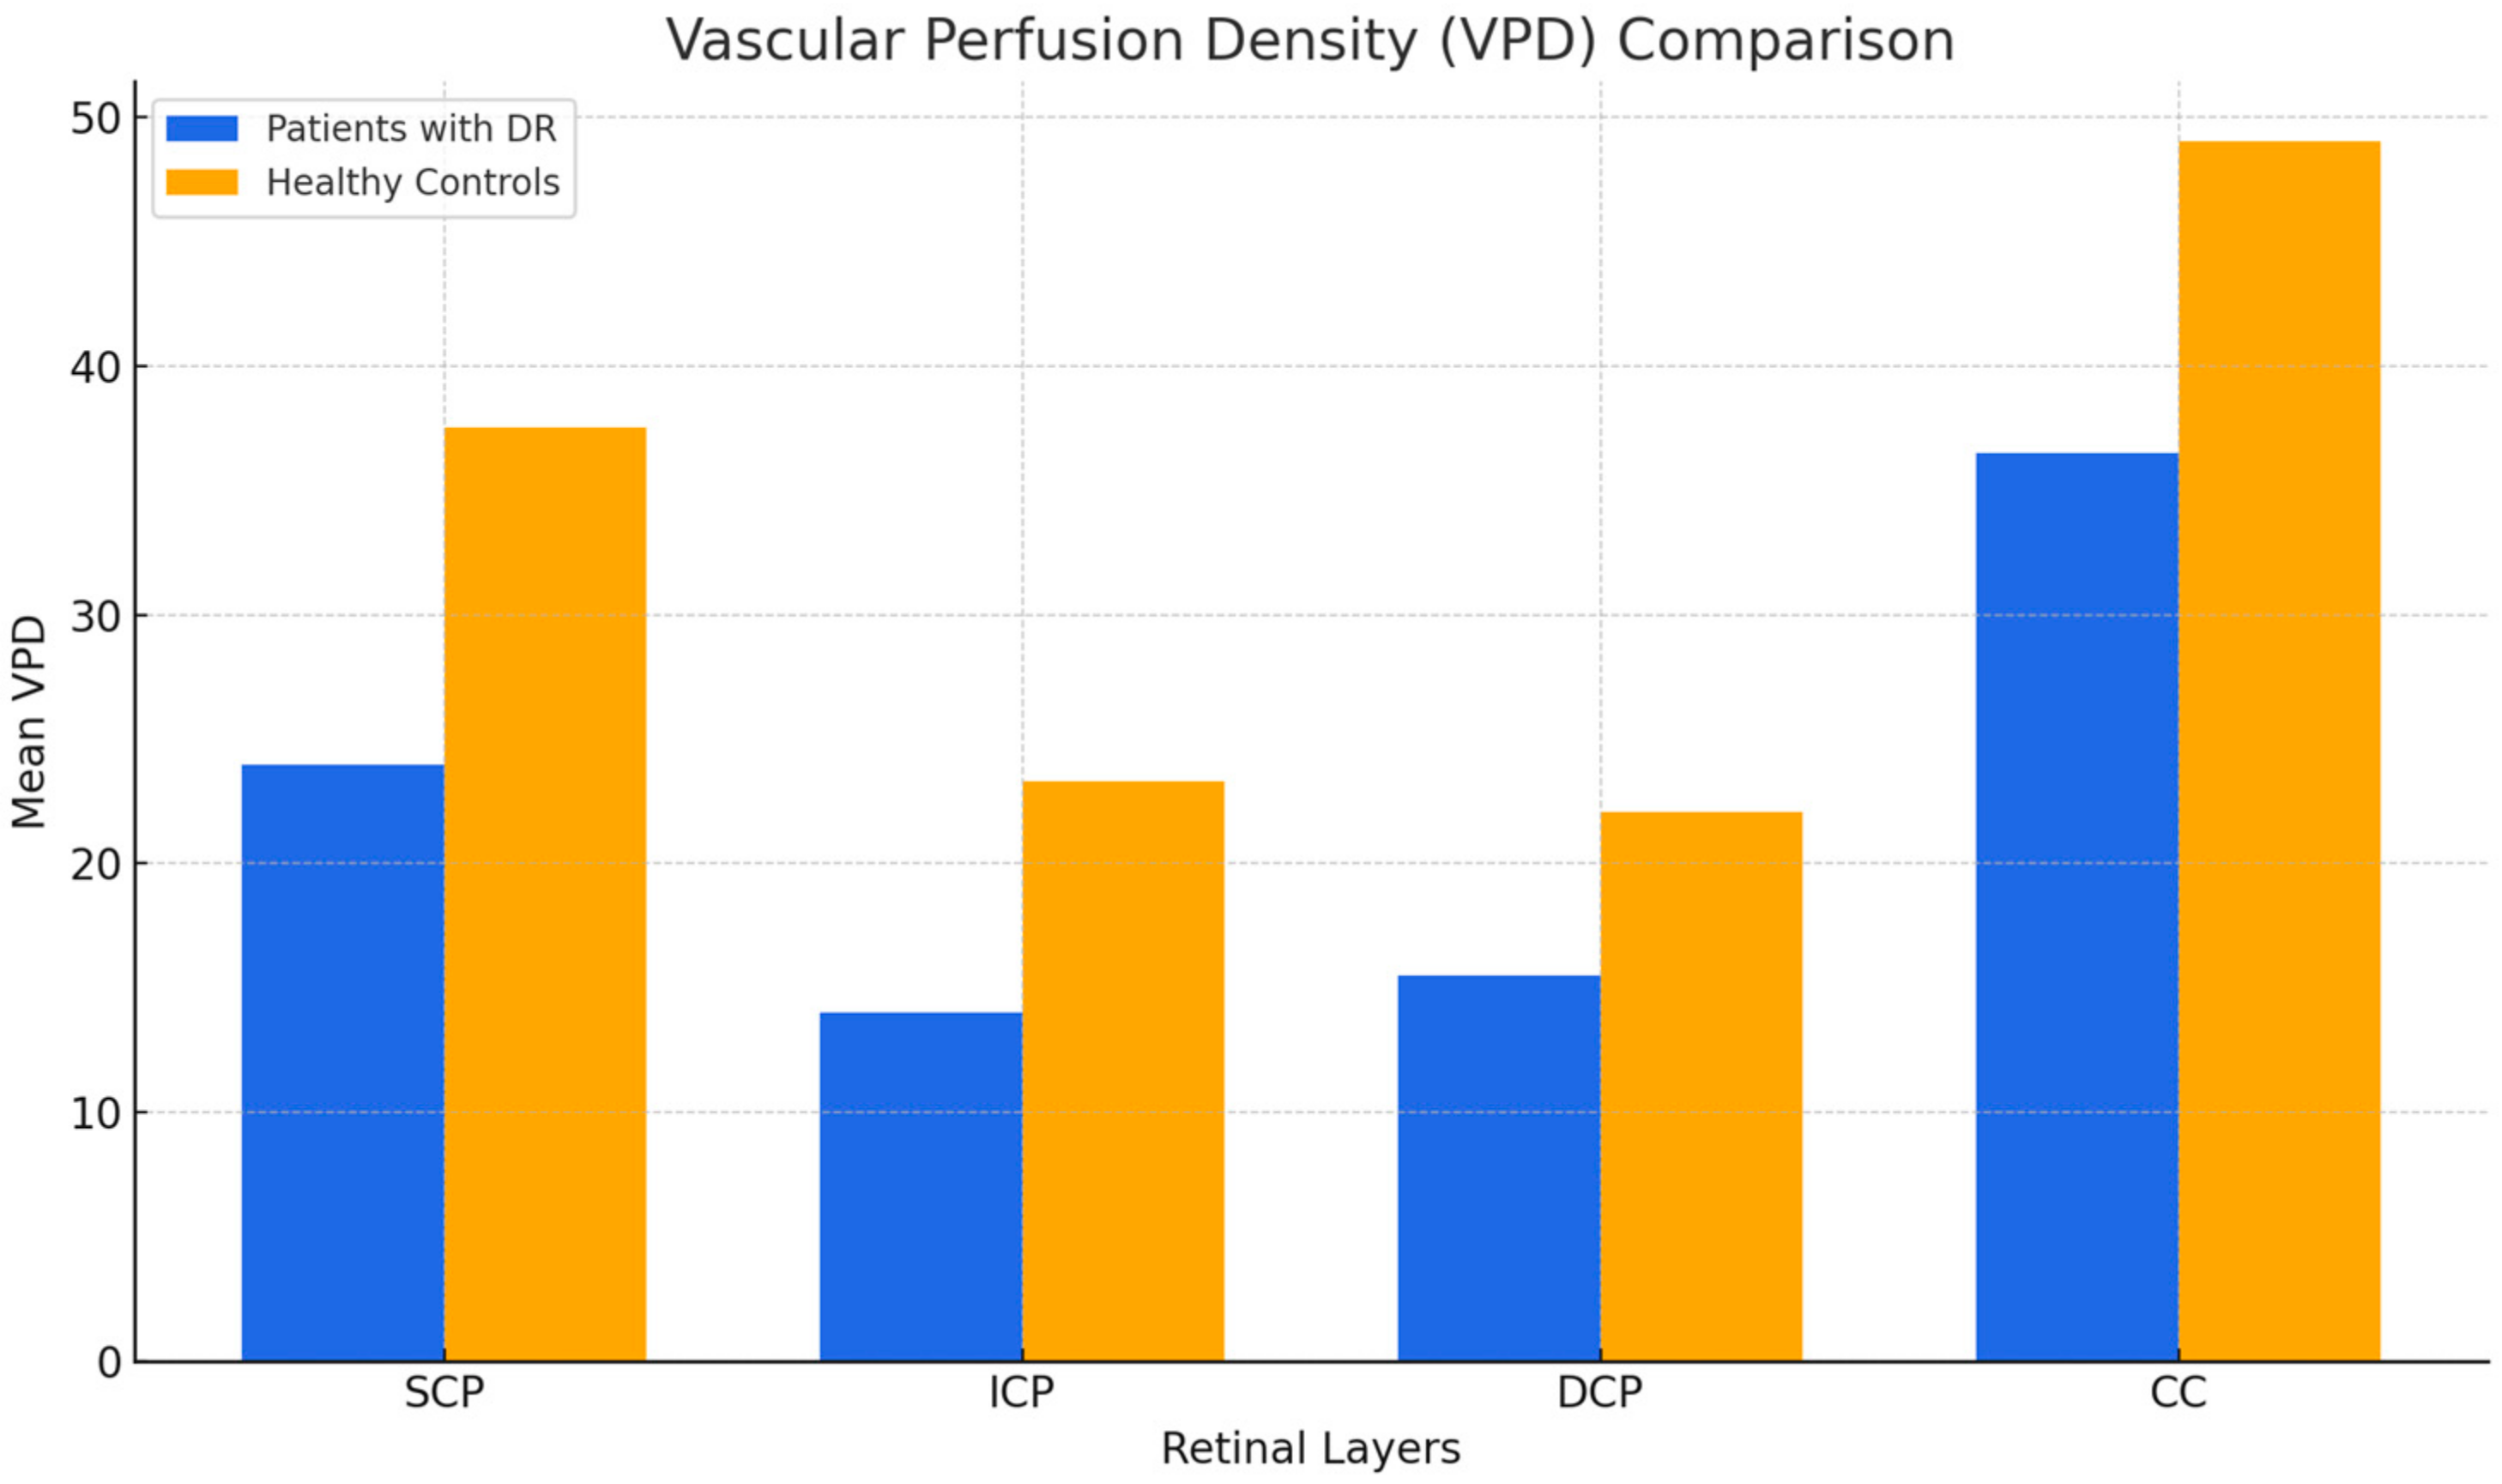
3.2. Vascular Perfusion Density (VPD)
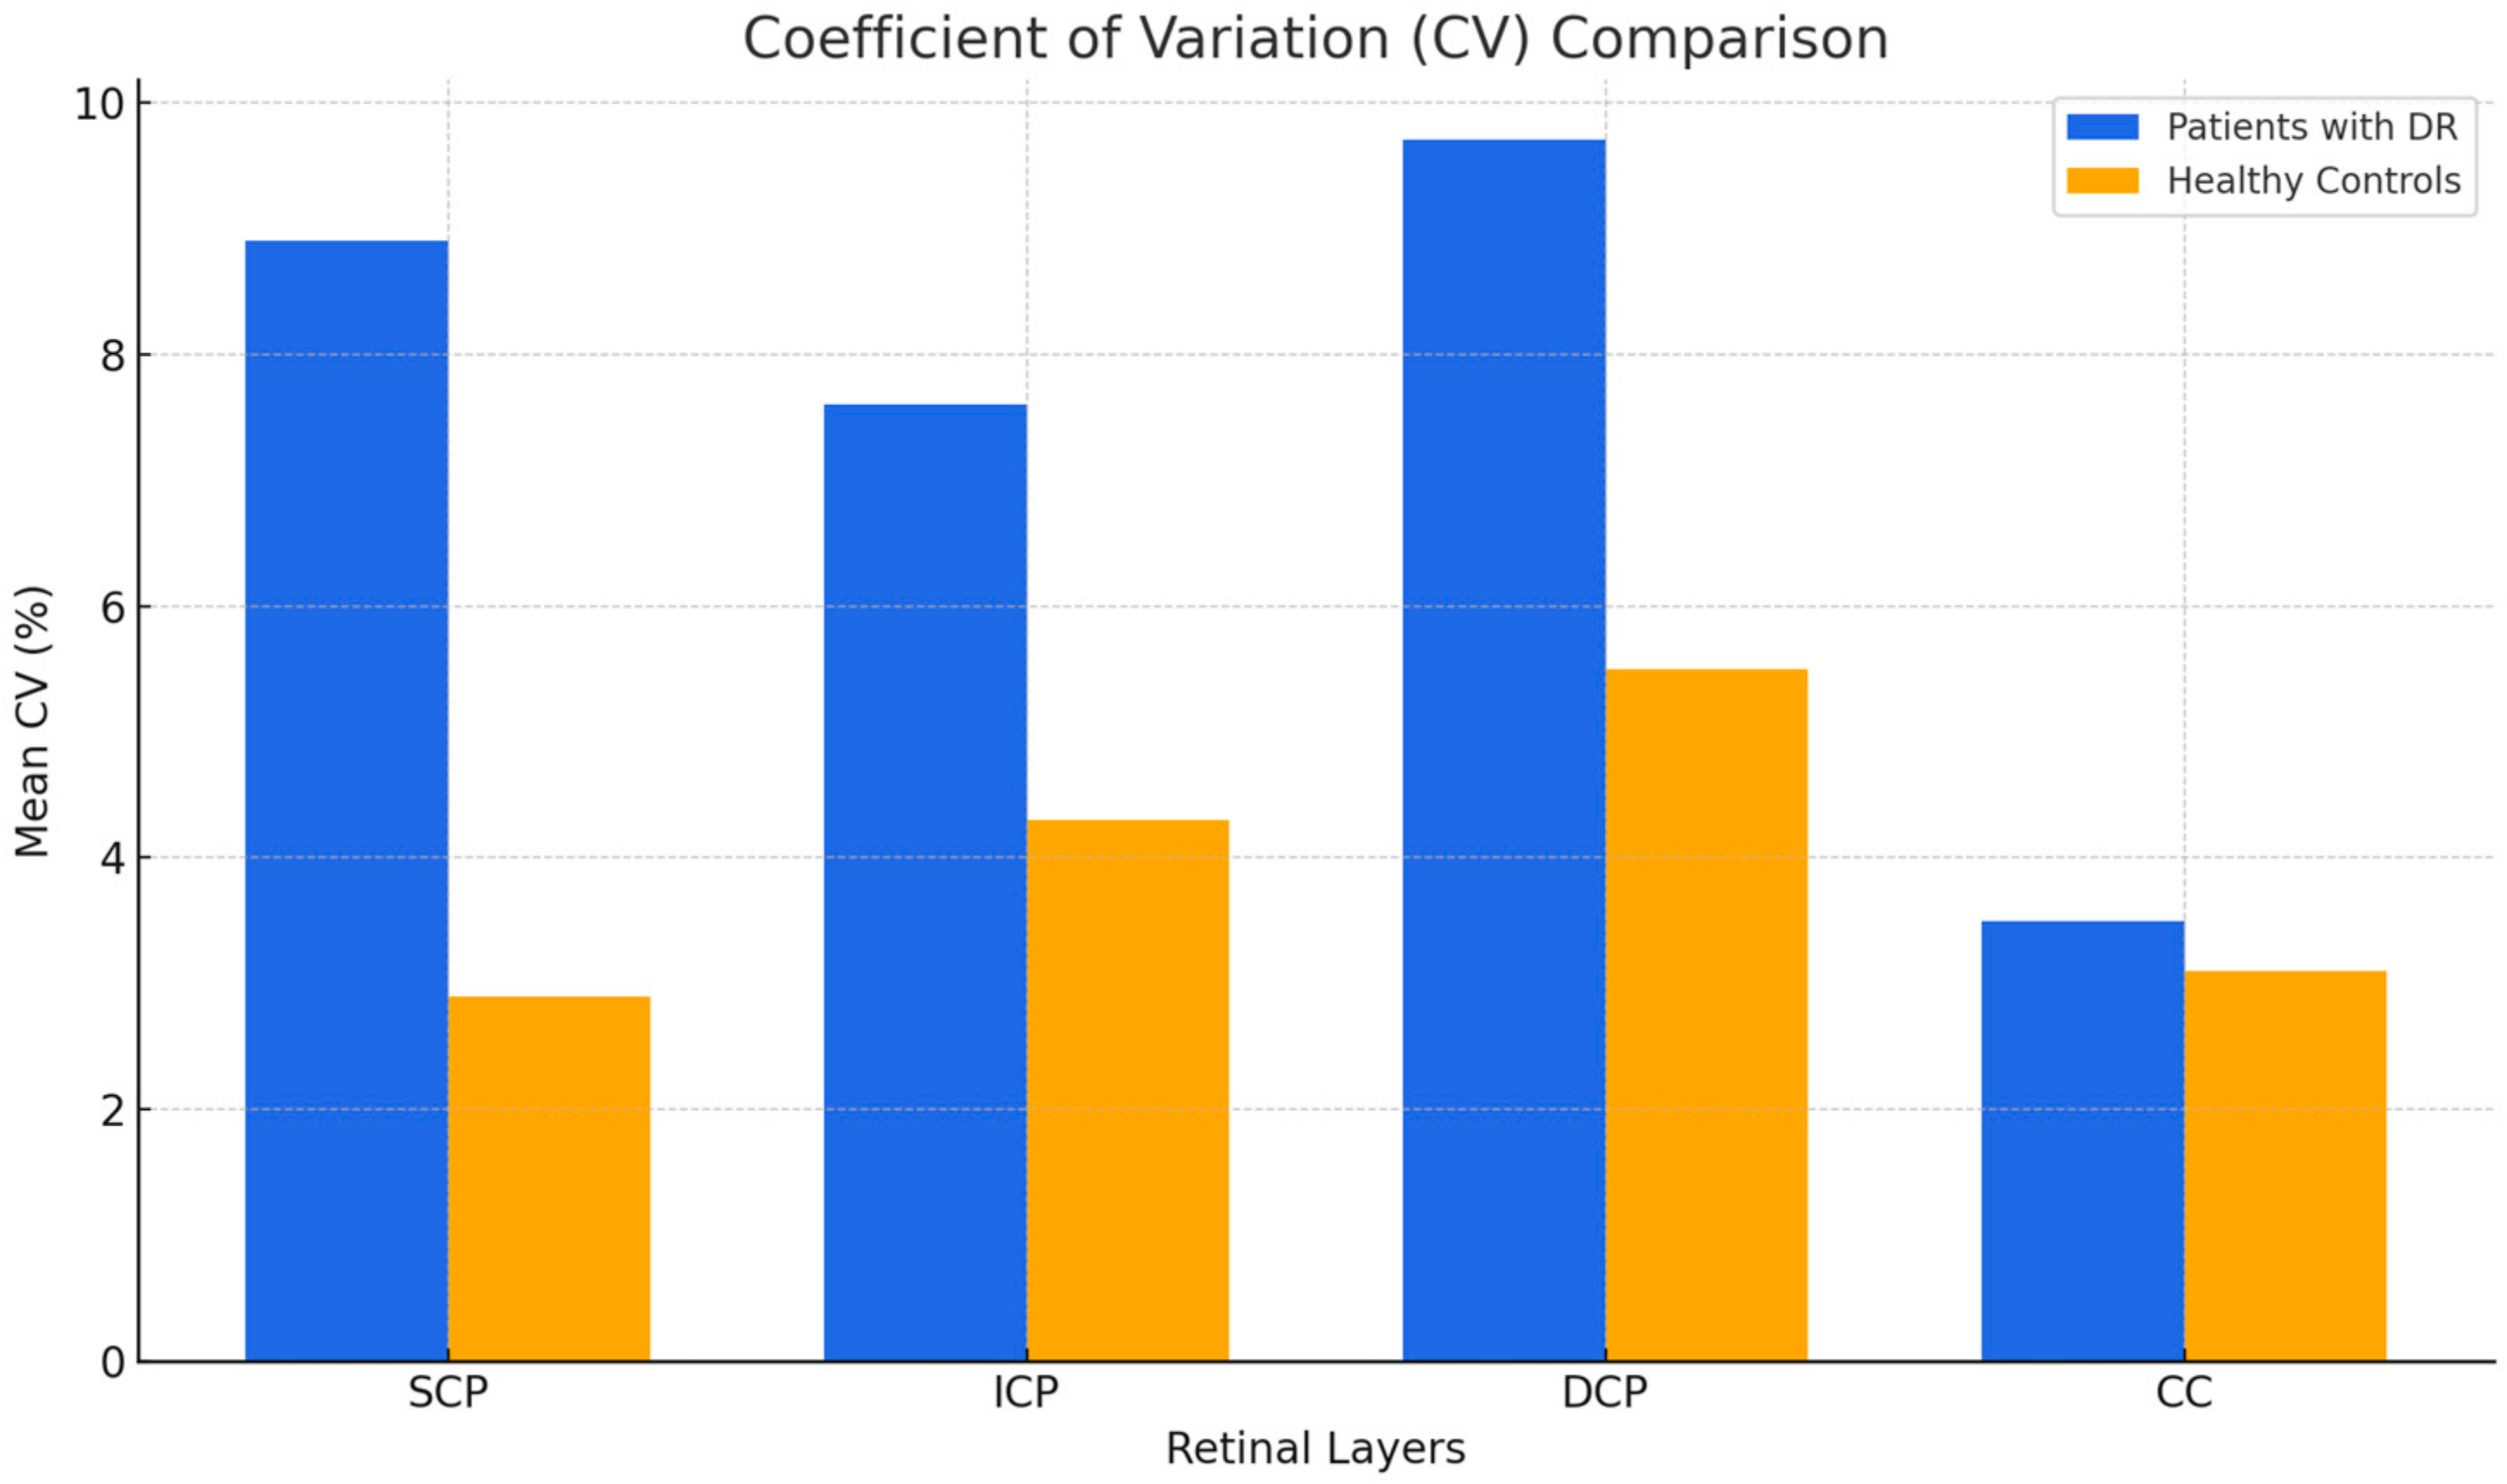
3.3. Coefficient of Variation
4. Discussion
5. Conclusions
Author Contributions
Funding
Institutional Review Board Statement
Informed Consent Statement
Data Availability Statement
Conflicts of Interest
References
- Engerman, R.L.; Kern, T.S. Retinopathy in Animal Models of Diabetes. Diabetes. Metab. Rev. 1995, 11, 109–120. [Google Scholar] [CrossRef] [PubMed]
- Klein, R.; Klein, B.E.; Moss, S.E.; Cruickshanks, K.J. The Wisconsin Epidemiologic Study of Diabetic Retinopathy. XIV. Ten-Year Incidence and Progression of Diabetic Retinopathy. Arch. Ophthalmol. 1994, 112, 1217–1228. [Google Scholar] [CrossRef] [PubMed]
- Tan, T.-E.; Wong, T.Y. Diabetic Retinopathy: Looking Forward to 2030. Front. Endocrinol. 2022, 13, 1077669. [Google Scholar] [CrossRef]
- Kuwabara, T.; Cogan, D.G. Retinal Vascular Patterns. VI. Mural Cells of the Retinal Capillaries. Arch. Ophthalmol. 1963, 69, 492–502. [Google Scholar] [CrossRef]
- Mizutani, M.; Kern, T.S.; Lorenzi, M. Accelerated Death of Retinal Microvascular Cells in Human and Experimental Diabetic Retinopathy. J. Clin. Investig. 1996, 97, 2883–2890. [Google Scholar] [CrossRef]
- Sambhav, K.; Grover, S.; Chalam, K.V. The Application of Optical Coherence Tomography Angiography in Retinal Diseases. Surv. Ophthalmol. 2017, 62, 838–866. [Google Scholar] [CrossRef]
- Spaide, R.F.; Fujimoto, J.G.; Waheed, N.K.; Sadda, S.R.; Staurenghi, G. Optical Coherence Tomography Angiography. Prog. Retin. Eye Res. 2018, 64, 1–55. [Google Scholar] [CrossRef]
- Spaide, R.F.; Fujimoto, J.G.; Waheed, N.K. Image Artifacts in Optical Coherence Tomography Angiography. Retina 2015, 35, 2163–2180. [Google Scholar] [CrossRef]
- Lee, J.; Rosen, R. Optical Coherence Tomography Angiography in Diabetes. Curr. Diab. Rep. 2016, 16, 123. [Google Scholar] [CrossRef]
- Vujosevic, S.; Muraca, A.; Alkabes, M.; Villani, E.; Cavarzeran, F.; Rossetti, L.; De Cilla’, S. Early Microvascular and Neural Changes in Patients with Type 1 and Type 2 Diabetes Mellitus without Clinical Signs of Diabetic Retinopathy. Retina 2019, 39, 435–445. [Google Scholar] [CrossRef]
- Simonett, J.M.; Scarinci, F.; Picconi, F.; Giorno, P.; De Geronimo, D.; Di Renzo, A.; Varano, M.; Frontoni, S.; Parravano, M. Early Microvascular Retinal Changes in Optical Coherence Tomography Angiography in Patients with Type 1 Diabetes Mellitus. Acta Ophthalmol. 2017, 95, e751–e755. [Google Scholar] [CrossRef] [PubMed]
- Lavia, C.; Couturier, A.; Erginay, A.; Dupas, B.; Tadayoni, R.; Gaudric, A. Reduced Vessel Density in the Superficial and Deep Plexuses in Diabetic Retinopathy Is Associated with Structural Changes in Corresponding Retinal Layers. PLoS ONE 2019, 14, e0219164. [Google Scholar] [CrossRef]
- Coscas, F.; Sellam, A.; Glacet-Bernard, A.; Jung, C.; Goudot, M.; Miere, A.; Souied, E.H. Normative Data for Vascular Density in Superficial and Deep Capillary Plexuses of Healthy Adults Assessed by Optical Coherence Tomography Angiography. Investig. Ophthalmol. Vis. Sci. 2016, 57, OCT211–OCT223. [Google Scholar] [CrossRef]
- Shiihara, H.; Sakamoto, T.; Yamashita, T.; Kakiuchi, N.; Otsuka, H.; Terasaki, H.; Sonoda, S. Reproducibility and Differences in Area of Foveal Avascular Zone Measured by Three Different Optical Coherence Tomographic Angiography Instruments. Sci. Rep. 2017, 7, 9853. [Google Scholar] [CrossRef]
- Lei, J.; Durbin, M.K.; Shi, Y.; Uji, A.; Balasubramanian, S.; Baghdasaryan, E.; Al-Sheikh, M.; Sadda, S.R. Repeatability and Reproducibility of Superficial Macular Retinal Vessel Density Measurements Using Optical Coherence Tomography Angiography En Face Images. JAMA Ophthalmol. 2017, 135, 1092–1098. [Google Scholar] [CrossRef]
- Mihailovic, N.; Brand, C.; Lahme, L.; Schubert, F.; Bormann, E.; Eter, N.; Alnawaiseh, M. Repeatability, Reproducibility and Agreement of Foveal Avascular Zone Measurements Using Three Different Optical Coherence Tomography Angiography Devices. PLoS ONE 2018, 13, e0206045. [Google Scholar] [CrossRef]
- Zhao, Q.; Yang, W.L.; Wang, X.N.; Wang, R.K.; You, Q.S.; Chu, Z.D.; Xin, C.; Zhang, M.Y.; Li, D.J.; Wang, Z.Y.; et al. Repeatability and Reproducibility of Quantitative Assessment of the Retinal Microvasculature Using Optical Coherence Tomography Angiography Based on Optical Microangiography. Biomed. Environ. Sci. 2018, 31, 407–412. [Google Scholar] [CrossRef]
- Ishii, H.; Shoji, T.; Yoshikawa, Y.; Kanno, J.; Ibuki, H.; Shinoda, K. Automated Measurement of the Foveal Avascular Zone in Swept-Source Optical Coherence Tomography Angiography Images. Transl. Vis. Sci. Technol. 2019, 8, 28. [Google Scholar] [CrossRef]
- Hosari, S.; Hohberger, B.; Theelke, L.; Sari, H.; Lucio, M.; Mardin, C.Y. OCT Angiography: Measurement of Retinal Macular Microvasculature with Spectralis II OCT Angiography—Reliability and Reproducibility. Ophthalmol. J. Int. Z. Augenheilkd. 2020, 243, 75–84. [Google Scholar] [CrossRef]
- Czakó, C.; Sándor, G.; Ecsedy, M.; Récsán, Z.; Horváth, H.; Szepessy, Z.; Nagy, Z.Z.; Kovács, I. Intrasession and Between-Visit Variability of Retinal Vessel Density Values Measured with OCT Angiography in Diabetic Patients. Sci. Rep. 2018, 8, 10598. [Google Scholar] [CrossRef]
- Koo, T.K.; Li, M.Y. A Guideline of Selecting and Reporting Intraclass Correlation Coefficients for Reliability Research. J. Chiropr. Med. 2016, 15, 155–163. [Google Scholar] [CrossRef] [PubMed]
- Chen, F.K.; Menghini, M.; Hansen, A.; Mackey, D.A.; Constable, I.J.; Sampson, D.M. Intrasession Repeatability and Interocular Symmetry of Foveal Avascular Zone and Retinal Vessel Density in OCT Angiography. Transl. Vis. Sci. Technol. 2018, 7, 6. [Google Scholar] [CrossRef]
- Lee, T.H.; Lim, H.B.; Nam, K.Y.; Kim, K.; Kim, J.Y. Factors Affecting Repeatability of Assessment of the Retinal Microvasculature Using Optical Coherence Tomography Angiography in Healthy Subjects. Sci. Rep. 2019, 9, 16291, Erratum in Sci. Rep. 2020, 10, 4791. [Google Scholar] [CrossRef]
- You, Q.; Freeman, W.R.; Weinreb, R.N.; Zangwill, L.; Manalastas, P.I.C.; Saunders, L.J.; Nudleman, E. Reproducibility of Vessel Density Measurement with Optical Coherence Tomography Angiography in Eyes with and without Retinopathy. Retina 2017, 37, 1475–1482. [Google Scholar] [CrossRef]
- Yuan, P.H.S.; Athwal, A.; Shalaby, M.; Mehnert, A.; Yu, D.-Y.; Preti, R.C.; Sarunic, M.; Navajas, E.V. Retinal Capillary Perfusion Heterogeneity in Diabetic Retinopathy Detected by Optical Coherence Tomography Angiography. Int. J. Retina Vitr. 2024, 10, 12. [Google Scholar] [CrossRef]
- Dubow, M.; Pinhas, A.; Shah, N.; Cooper, R.F.; Gan, A.; Gentile, R.C.; Hendrix, V.; Sulai, Y.N.; Carroll, J.; Chui, T.Y.P.; et al. Classification of Human Retinal Microaneurysms Using Adaptive Optics Scanning Light Ophthalmoscope Fluorescein Angiography. Invest. Ophthalmol. Vis. Sci. 2014, 55, 1299–1309. [Google Scholar] [CrossRef]
- Uji, A.; Balasubramanian, S.; Lei, J.; Baghdasaryan, E.; Al-Sheikh, M.; Sadda, S.R. Impact of Multiple En Face Image Averaging on Quantitative Assessment from Optical Coherence Tomography Angiography Images. Ophthalmology 2017, 124, 944–952. [Google Scholar] [CrossRef]
- Sim, D.A.; Keane, P.A.; Zarranz-Ventura, J.; Fung, S.; Powner, M.B.; Platteau, E.; Bunce, C.V.; Fruttiger, M.; Patel, P.J.; Tufail, A.; et al. The Effects of Macular Ischemia on Visual Acuity in Diabetic Retinopathy. Investig. Ophthalmol. Vis. Sci. 2013, 54, 2353–2360. [Google Scholar] [CrossRef]
- Tang, F.Y.; Ng, D.S.; Lam, A.; Luk, F.; Wong, R.; Chan, C.; Mohamed, S.; Fong, A.; Lok, J.; Tso, T.; et al. Determinants of Quantitative Optical Coherence Tomography Angiography Metrics in Patients with Diabetes. Sci. Rep. 2017, 7, 2575. [Google Scholar] [CrossRef]
- Al-Sheikh, M.; Akil, H.; Pfau, M.; Sadda, S.R. Swept-Source OCT Angiography Imaging of the Foveal Avascular Zone and Macular Capillary Network Density in Diabetic Retinopathy. Investig. Ophthalmol. Vis. Sci. 2016, 57, 3907–3913. [Google Scholar] [CrossRef]
- Takase, N.; Nozaki, M.; Kato, A.; Ozeki, H.; Yoshida, M.; Ogura, Y. Enlargement of Foveal Avascular Zone in Diabetic Eyes Evaluated by en Face Optical Coherence Tomography Angiography. Retina 2015, 35, 2377–2383. [Google Scholar] [CrossRef] [PubMed]
- Bhanushali, D.; Anegondi, N.; Gadde, S.G.K.; Srinivasan, P.; Chidambara, L.; Yadav, N.K.; Sinha Roy, A. Linking Retinal Microvasculature Features with Severity of Diabetic Retinopathy Using Optical Coherence Tomography Angiography. Investig. Ophthalmol. Vis. Sci. 2016, 57, OCT519–OCT525. [Google Scholar] [CrossRef] [PubMed]
- Al-Sheikh, M.; Tepelus, T.C.; Nazikyan, T.; Sadda, S.R. Repeatability of Automated Vessel Density Measurements Using Optical Coherence Tomography Angiography. Br. J. Ophthalmol. 2017, 101, 449–452. [Google Scholar] [CrossRef] [PubMed]
- Lee, M.-W.; Kim, K.-M.; Lim, H.-B.; Jo, Y.-J.; Kim, J.-Y. Repeatability of Vessel Density Measurements Using Optical Coherence Tomography Angiography in Retinal Diseases. Br. J. Ophthalmol. 2018, 103, 704–710. [Google Scholar] [CrossRef]

| SCP | ICP | DCP | CC | |||||||||
|---|---|---|---|---|---|---|---|---|---|---|---|---|
| Mean | SD | CV | Mean | SD | CV | Mean | SD | CV | Mean | SD | CV | |
| Eye 1 | 24.40 | 3.23 | 13.2% | 13.21 | 1.62 | 12.3% | 12.47 | 0.84 | 6.7% | 37.30 | 0.57 | 1.5% |
| Eye 2 | 25.18 | 0.61 | 2.4% | 13.58 | 0.79 | 5.8% | 14.91 | 1.03 | 6.9% | 31.29 | 1.93 | 6.2% |
| Eye 3 | 29.32 | 1.56 | 5.3% | 17.39 | 0.35 | 2.0% | 21.92 | 0.34 | 1.5% | 38.40 | 1.05 | 2.7% |
| Eye 4 | 14.96 | 2.29 | 15.3% | 7.71 | 1.14 | 14.7% | 9.65 | 1.97 | 20.5% | 33.63 | 1.14 | 3.4% |
| Eye 5 | 19.34 | 2.69 | 13.9% | 10.12 | 1.27 | 12.6% | 9.27 | 1.29 | 14.0% | 29.63 | 3.26 | 1.0% |
| Eye 6 | 18.54 | 3.62 | 19.5% | 10.88 | 2.42 | 22.2% | 10.05 | 2.22 | 22.1% | 30.49 | 2.85 | 9.3% |
| Eye 7 | 24.39 | 0.66 | 2.7% | 14.37 | 0.42 | 2.9% | 18.30 | 0.15 | 0.8% | 44.15 | 0.53 | 1.2% |
| Eye 8 | 28.85 | 2.37 | 8.2% | 13.82 | 0.93 | 6.8% | 18.77 | 1.21 | 6.5% | 44.13 | 0.92 | 2.1% |
| Eye 9 | 23.88 | 2.70 | 11.3% | 16.89 | 1.19 | 7.1% | 16.69 | 1.28 | 7.7% | 34.90 | 0.76 | 2.2% |
| Eye 10 | 25.79 | 3.14 | 12.2% | 11.20 | 1.08 | 9.6% | 7.31 | 1.81 | 24.8% | 29.37 | 0.56 | 1.9% |
| Eye 11 | 26.73 | 2.57 | 9.6% | 15.90 | 0.85 | 5.3% | 17.43 | 0.81 | 4.7% | 47.32 | 1.73 | 3.7% |
| Eye 12 | 31.77 | 0.62 | 1.9% | 15.35 | 0.35 | 2.3% | 18.99 | 0.72 | 3.8% | 45.52 | 0.35 | 0.8% |
| Eye 13 | 20.19 | 0.41 | 2.0% | 12.72 | 0.44 | 3.5% | 13.16 | 0.45 | 3.4% | 39.96 | 0.74 | 1.9% |
| Eye 14 | 22.78 | 0.41 | 1.8% | 13.49 | 0.49 | 3.7% | 15.91 | 2.75 | 17.3% | 39.32 | 0.86 | 2.2% |
| Eye 15 | 16.68 | 2.73 | 16.3% | 15.21 | 1.21 | 8.0% | 19.53 | 2.26 | 11.6% | 30.92 | 1.15 | 3.7% |
| Eye 16 | 25.37 | 1.57 | 6.2% | 16.36 | 0.59 | 3.6% | 20.58 | 0.76 | 3.7% | 28.80 | 0.88 | 3.0% |
| Mean value | 23.64 | 13.64 | 15.31 | 36.57 | ||||||||
| SCP | ICP | DCP | CC | |||||||||
|---|---|---|---|---|---|---|---|---|---|---|---|---|
| Mean | SD | CV | Mean | SD | CV | Mean | SD | CV | Mean | SD | CV | |
| Eye 1 | 36.03 | 1.32 | 3.7% | 24.70 | 1.17 | 4.7% | 25.14 | 1.36 | 5.4% | 59.16 | 1.27 | 2.1% |
| Eye 2 | 37.01 | 1.37 | 3.7% | 23.86 | 1.50 | 6.3% | 23.21 | 1.36 | 5.8% | 51.41 | 1.16 | 2.2% |
| Eye 3 | 39.52 | 1.29 | 3.3% | 24.87 | 0.34 | 1.4% | 24.01 | 1.12 | 4.7% | 51.37 | 0.48 | 0.9% |
| Eye 4 | 35.97 | 1.33 | 3.7% | 21.75 | 0.70 | 3.2% | 18.41 | 1.59 | 8.6% | 46.91 | 3.55 | 7.6% |
| Eye 5 | 38.19 | 1.71 | 4.5% | 22.69 | 0.67 | 3.0% | 19.31 | 0.47 | 2.4% | 46.48 | 2.17 | 4.7% |
| Eye 6 | 41.30 | 0.29 | 0.7% | 24.46 | 0.29 | 1.2% | 23.13 | 0.44 | 1.9% | 55.51 | 0.91 | 1.6% |
| Eye 7 | 40.70 | 0.77 | 1.9% | 24.08 | 0.33 | 1.4% | 23.28 | 0.56 | 2.4% | 55.51 | 0.97 | 1.8% |
| Eye 8 | 34.44 | 0.85 | 2.5% | 23.13 | 0.20 | 0.9% | 23.12 | 0.48 | 2.1% | 44.18 | 0.98 | 2.2% |
| Eye 9 | 34.90 | 0.46 | 1.3% | 23.20 | 0.45 | 1.9% | 21.77 | 0.51 | 2.3% | 43.99 | 1.10 | 2.5% |
| Eye 10 | 36.49 | 1.01 | 2.8% | 23.62 | 0.73 | 3.1% | 20.45 | 0.72 | 3.5% | 47.99 | 0.90 | 1.9% |
| Eye 11 | 37.55 | 1.62 | 4.3% | 24.86 | 0.50 | 2.0% | 21.84 | 0.55 | 2.5% | 48.63 | 0.61 | 1.3% |
| Eye 12 | 36.78 | 2.37 | 6.5% | 20.82 | 2.45 | 11.8% | 21.24 | 2.36 | 11.1% | 38.44 | 2.05 | 5.3% |
| Eye 13 | 41.00 | 1.09 | 2.7% | 23.67 | 0.96 | 4.1% | 26.72 | 4.74 | 17.7% | 49.27 | 1.45 | 2.9% |
| Eye 14 | 36.73 | 1.00 | 2.7% | 21.17 | 3.05 | 14.4% | 19.85 | 0.57 | 2.9% | 44.17 | 1.75 | 4.0% |
| Eye 15 | 37.39 | 0.83 | 2.2% | 23.76 | 1.24 | 5.2% | 21.52 | 2.73 | 12.7% | 51.69 | 3.02 | 5.8% |
| Eye 16 | 38.42 | 0.22 | 0.6% | 22.42 | 0.93 | 4.2% | 19.81 | 0.47 | 2.4% | 49.29 | 1.20 | 2.4% |
| Mean value | 37.65 | 23.32 | 22.05 | 49.00 | ||||||||
| p | Diabetic Patients | Control Patients | |||
|---|---|---|---|---|---|
| Mean | SD | Mean | SD | ||
| SCP | <0.001 * | 23.64 | 4.67 | 37.65 | 2.08 |
| ICP | <0.001 * | 13.64 | 2.65 | 23.32 | 1.26 |
| DCP | <0.001 * | 15.32 | 4.50 | 22.05 | 2.23 |
| CC | <0.001 * | 36.57 | 6.33 | 49.00 | 5.18 |
| p | Diabetic Patients | Control Patients | |||
|---|---|---|---|---|---|
| Mean | SD | Mean | SD | ||
| SCP | 0.0093 * | 8.9% | 0.06 | 2.9% | 0.01 |
| ICP | 0.0226 * | 7.6% | 0.06 | 4.3% | 0.04 |
| DCP | 0.0434 * | 9.7% | 0.08 | 5.5% | 0.05 |
| CC | 0.8653 | 3.5% | 0.03 | 3.1% | 0.02 |
| Diabetic Patients | Control Patients | |||||
|---|---|---|---|---|---|---|
| ICC1 | l.r.l.2 | u.r.l.3 | ICC | l.r.l. | u.r.l | |
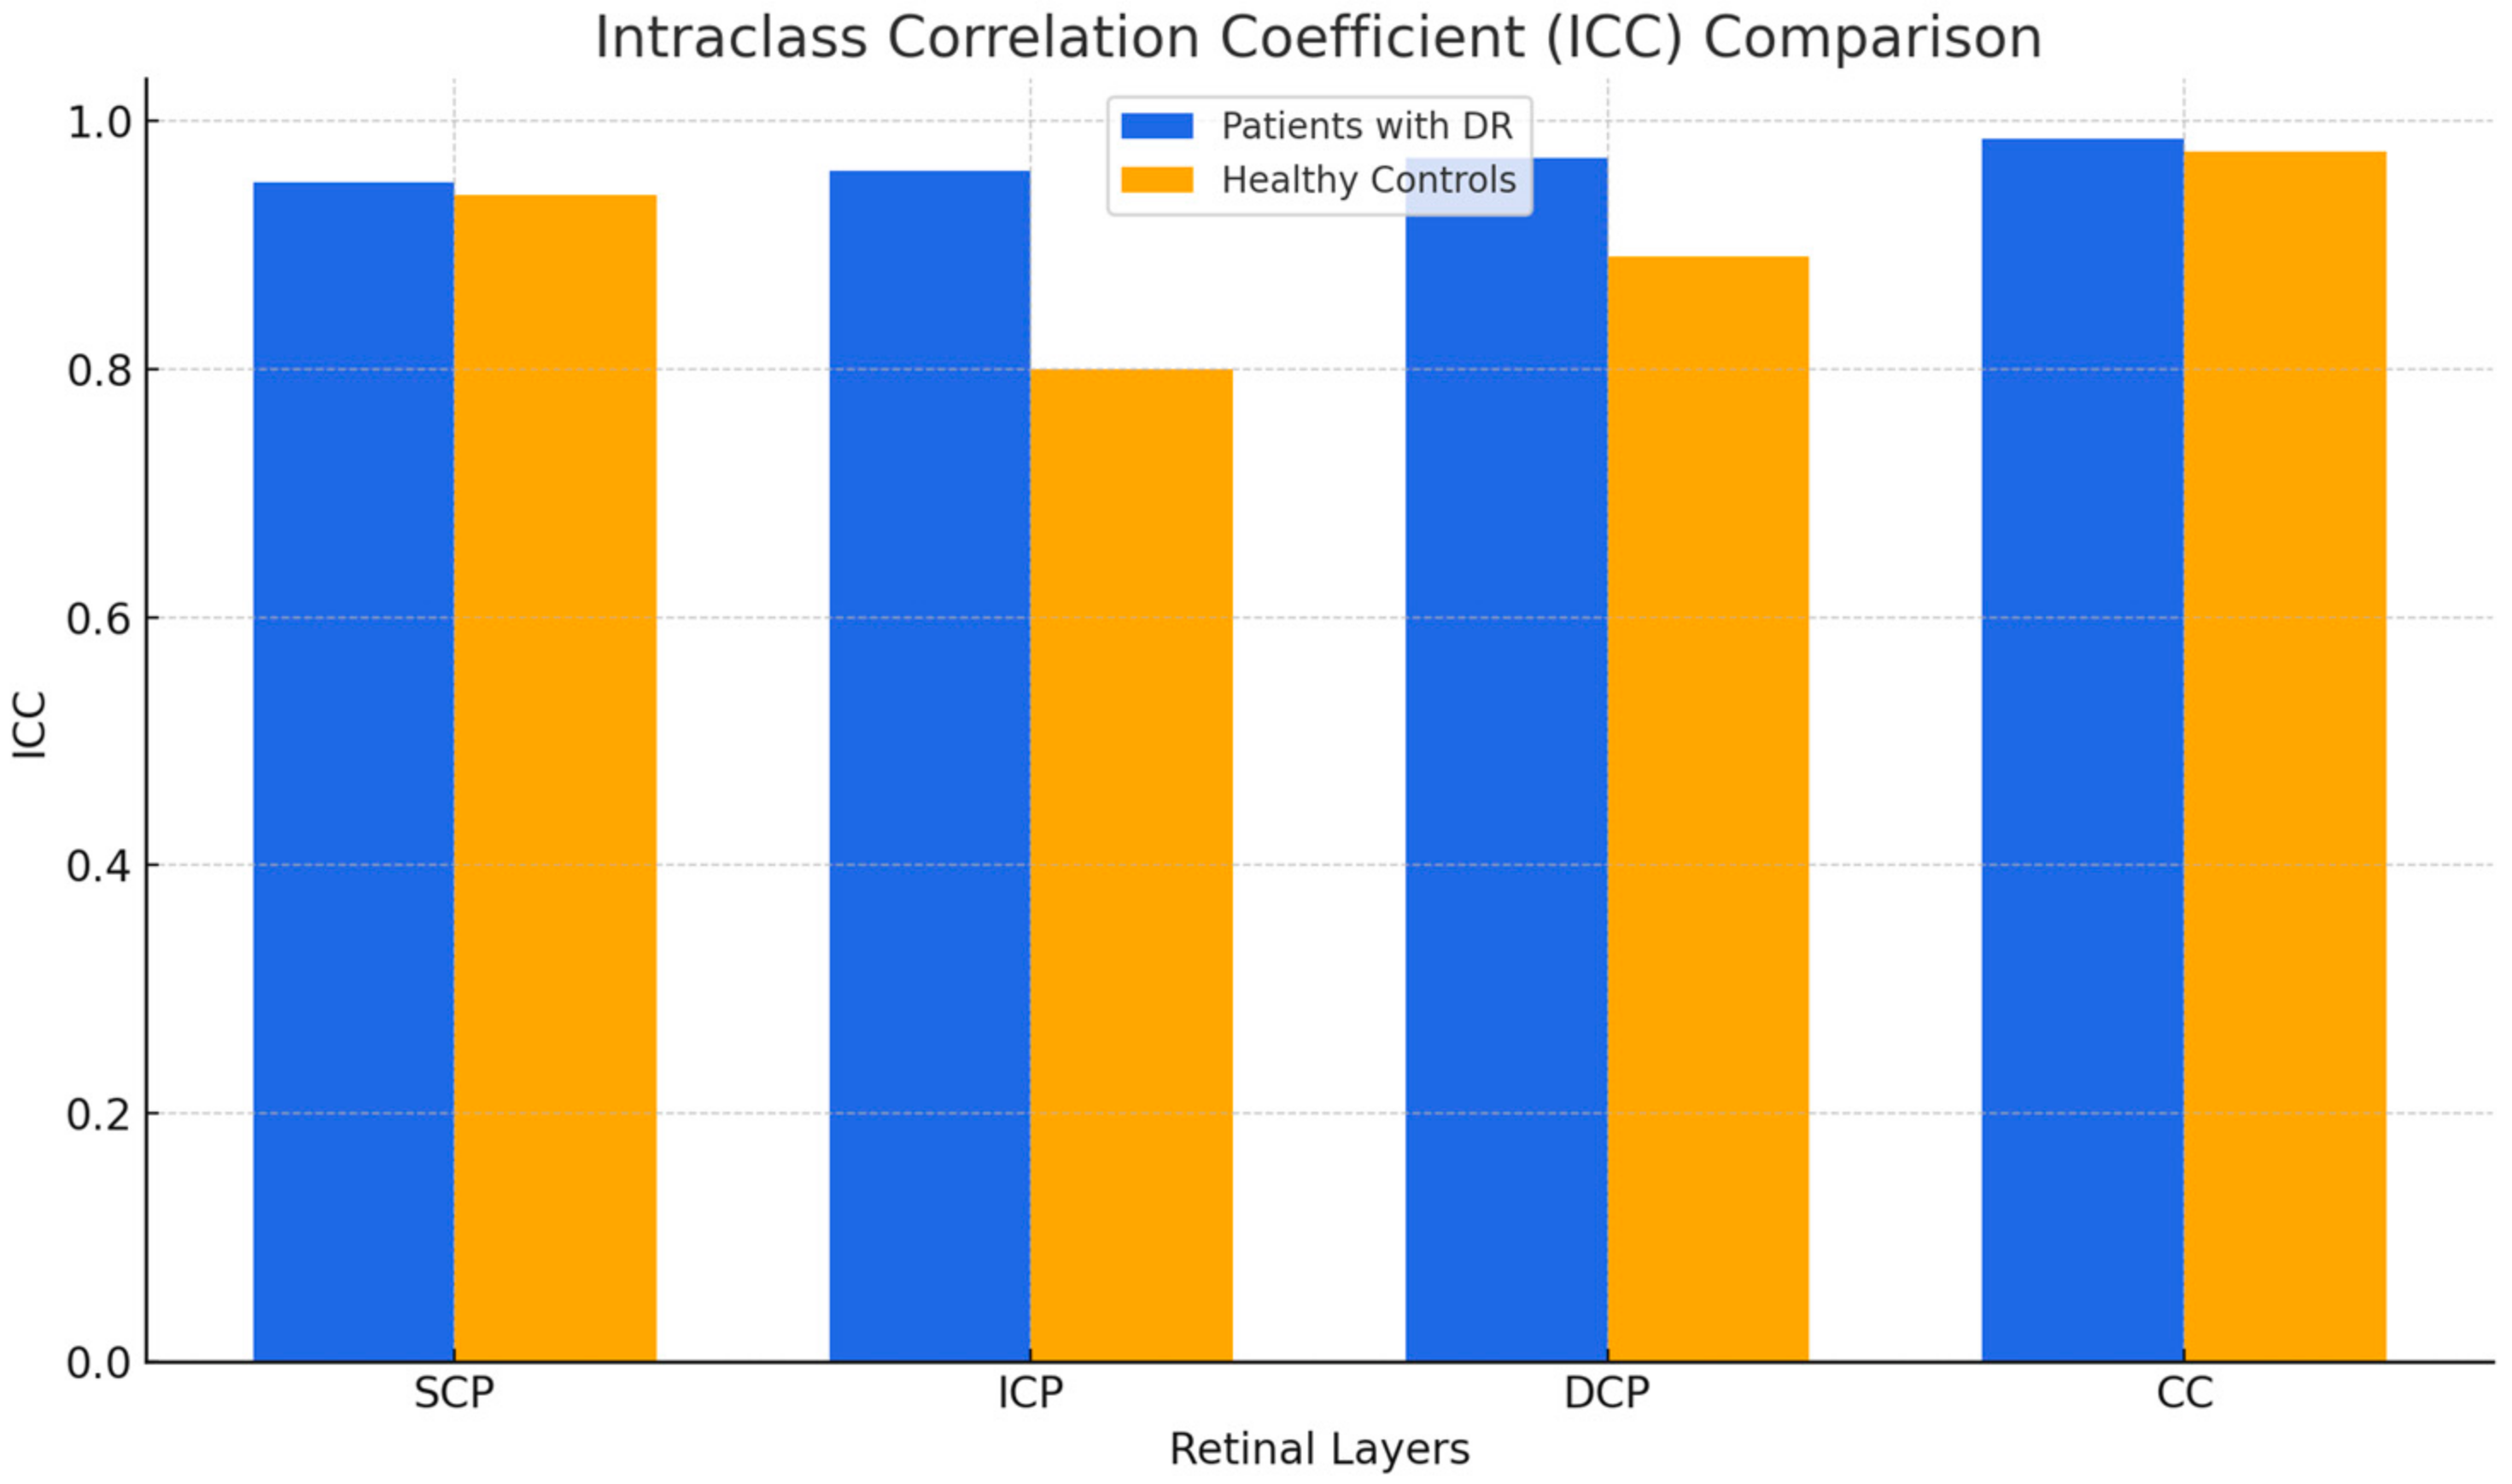
| SCP | 0.954 | 0.905 | 0.982 | 0.944 | 0.884 | 0.978 |
| ICP | 0.965 | 0.928 | 0.986 | 0.803 | 0.594 | 0.922 |
| DCP | 0.979 | 0.956 | 0.992 | 0.891 | 0.775 | 0.957 |
| CC | 0.989 | 0.977 | 0.996 | 0.979 | 0.957 | 0.992 |
Disclaimer/Publisher’s Note: The statements, opinions and data contained in all publications are solely those of the individual author(s) and contributor(s) and not of MDPI and/or the editor(s). MDPI and/or the editor(s) disclaim responsibility for any injury to people or property resulting from any ideas, methods, instructions or products referred to in the content. |
© 2025 by the authors. Licensee MDPI, Basel, Switzerland. This article is an open access article distributed under the terms and conditions of the Creative Commons Attribution (CC BY) license (https://creativecommons.org/licenses/by/4.0/).
Share and Cite
Gregori, G.; Mangoni, L.; Muzi, A.; Mogetta, V.; Gujar, R.; Chiapponi, M.; Fruttini, D.; Dolz-Marco, R.; Chhablani, J.; Mariotti, C.; et al. Vascular Perfusion Variability in Diabetic Retinopathy: A Sequential Interscan Optical Coherence Tomography Angiography Assessment. J. Clin. Med. 2025, 14, 2312. https://doi.org/10.3390/jcm14072312
Gregori G, Mangoni L, Muzi A, Mogetta V, Gujar R, Chiapponi M, Fruttini D, Dolz-Marco R, Chhablani J, Mariotti C, et al. Vascular Perfusion Variability in Diabetic Retinopathy: A Sequential Interscan Optical Coherence Tomography Angiography Assessment. Journal of Clinical Medicine. 2025; 14(7):2312. https://doi.org/10.3390/jcm14072312
Chicago/Turabian StyleGregori, Giulia, Lorenzo Mangoni, Alessio Muzi, Veronica Mogetta, Ramkailash Gujar, Mario Chiapponi, Daniela Fruttini, Rosa Dolz-Marco, Jay Chhablani, Cesare Mariotti, and et al. 2025. "Vascular Perfusion Variability in Diabetic Retinopathy: A Sequential Interscan Optical Coherence Tomography Angiography Assessment" Journal of Clinical Medicine 14, no. 7: 2312. https://doi.org/10.3390/jcm14072312
APA StyleGregori, G., Mangoni, L., Muzi, A., Mogetta, V., Gujar, R., Chiapponi, M., Fruttini, D., Dolz-Marco, R., Chhablani, J., Mariotti, C., & Lupidi, M. (2025). Vascular Perfusion Variability in Diabetic Retinopathy: A Sequential Interscan Optical Coherence Tomography Angiography Assessment. Journal of Clinical Medicine, 14(7), 2312. https://doi.org/10.3390/jcm14072312