
Cardiometabolic Risk in Chronic Spinal Cord Injury: A Systematic Review with Meta-Analysis and Temporal and Geographical Trends

 ,
,  , , , , ,
  , , ,
, , ,  and
and 
Abstract
:1. Introduction
2. Methods
2.1. Study Outcomes
2.2. Study Eligibility Criteria
2.3. Study Searches
2.4. Study Selection
2.5. Data Extraction and Management
2.6. Quality Assessment
2.7. Cardiometabolic Risk Stratification in SCI
2.8. Statistical Analysis
3. Results
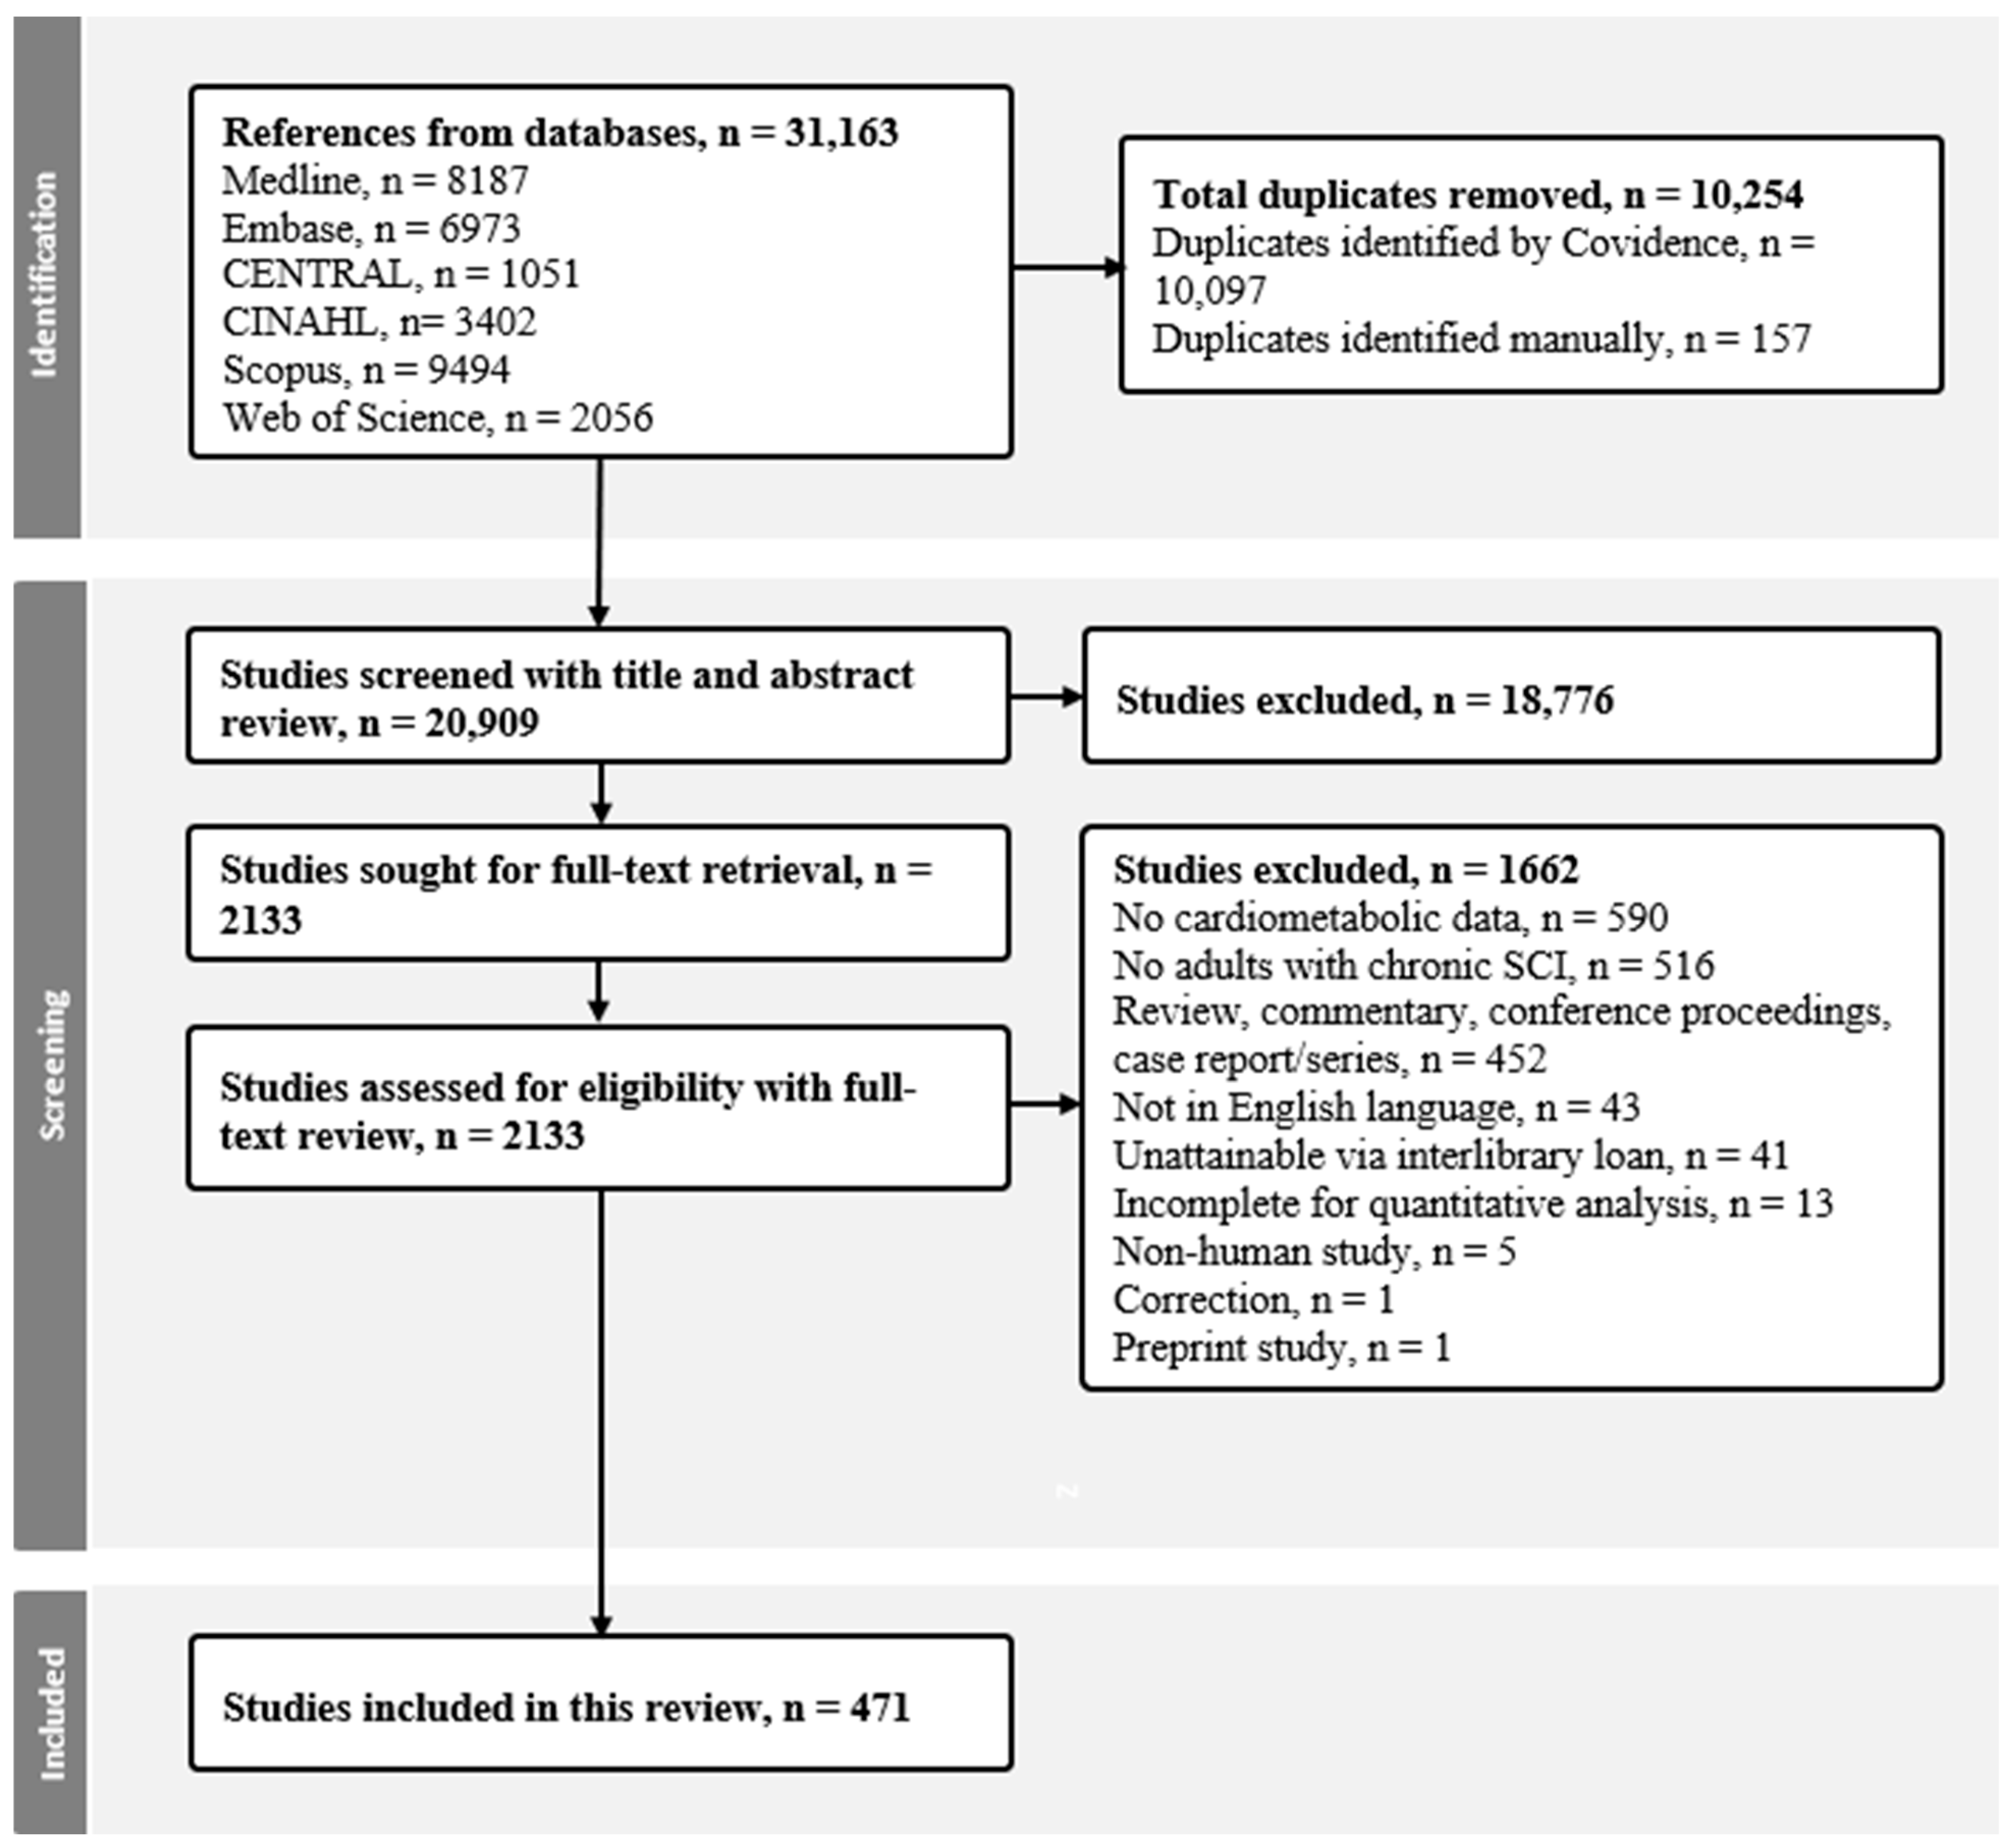
3.1. Search Results
3.2. Study Descriptions
3.3. Quality Assessment Results
3.4. Weighted Risk Factors of Cardiometabolic Syndrome (Aim 1)
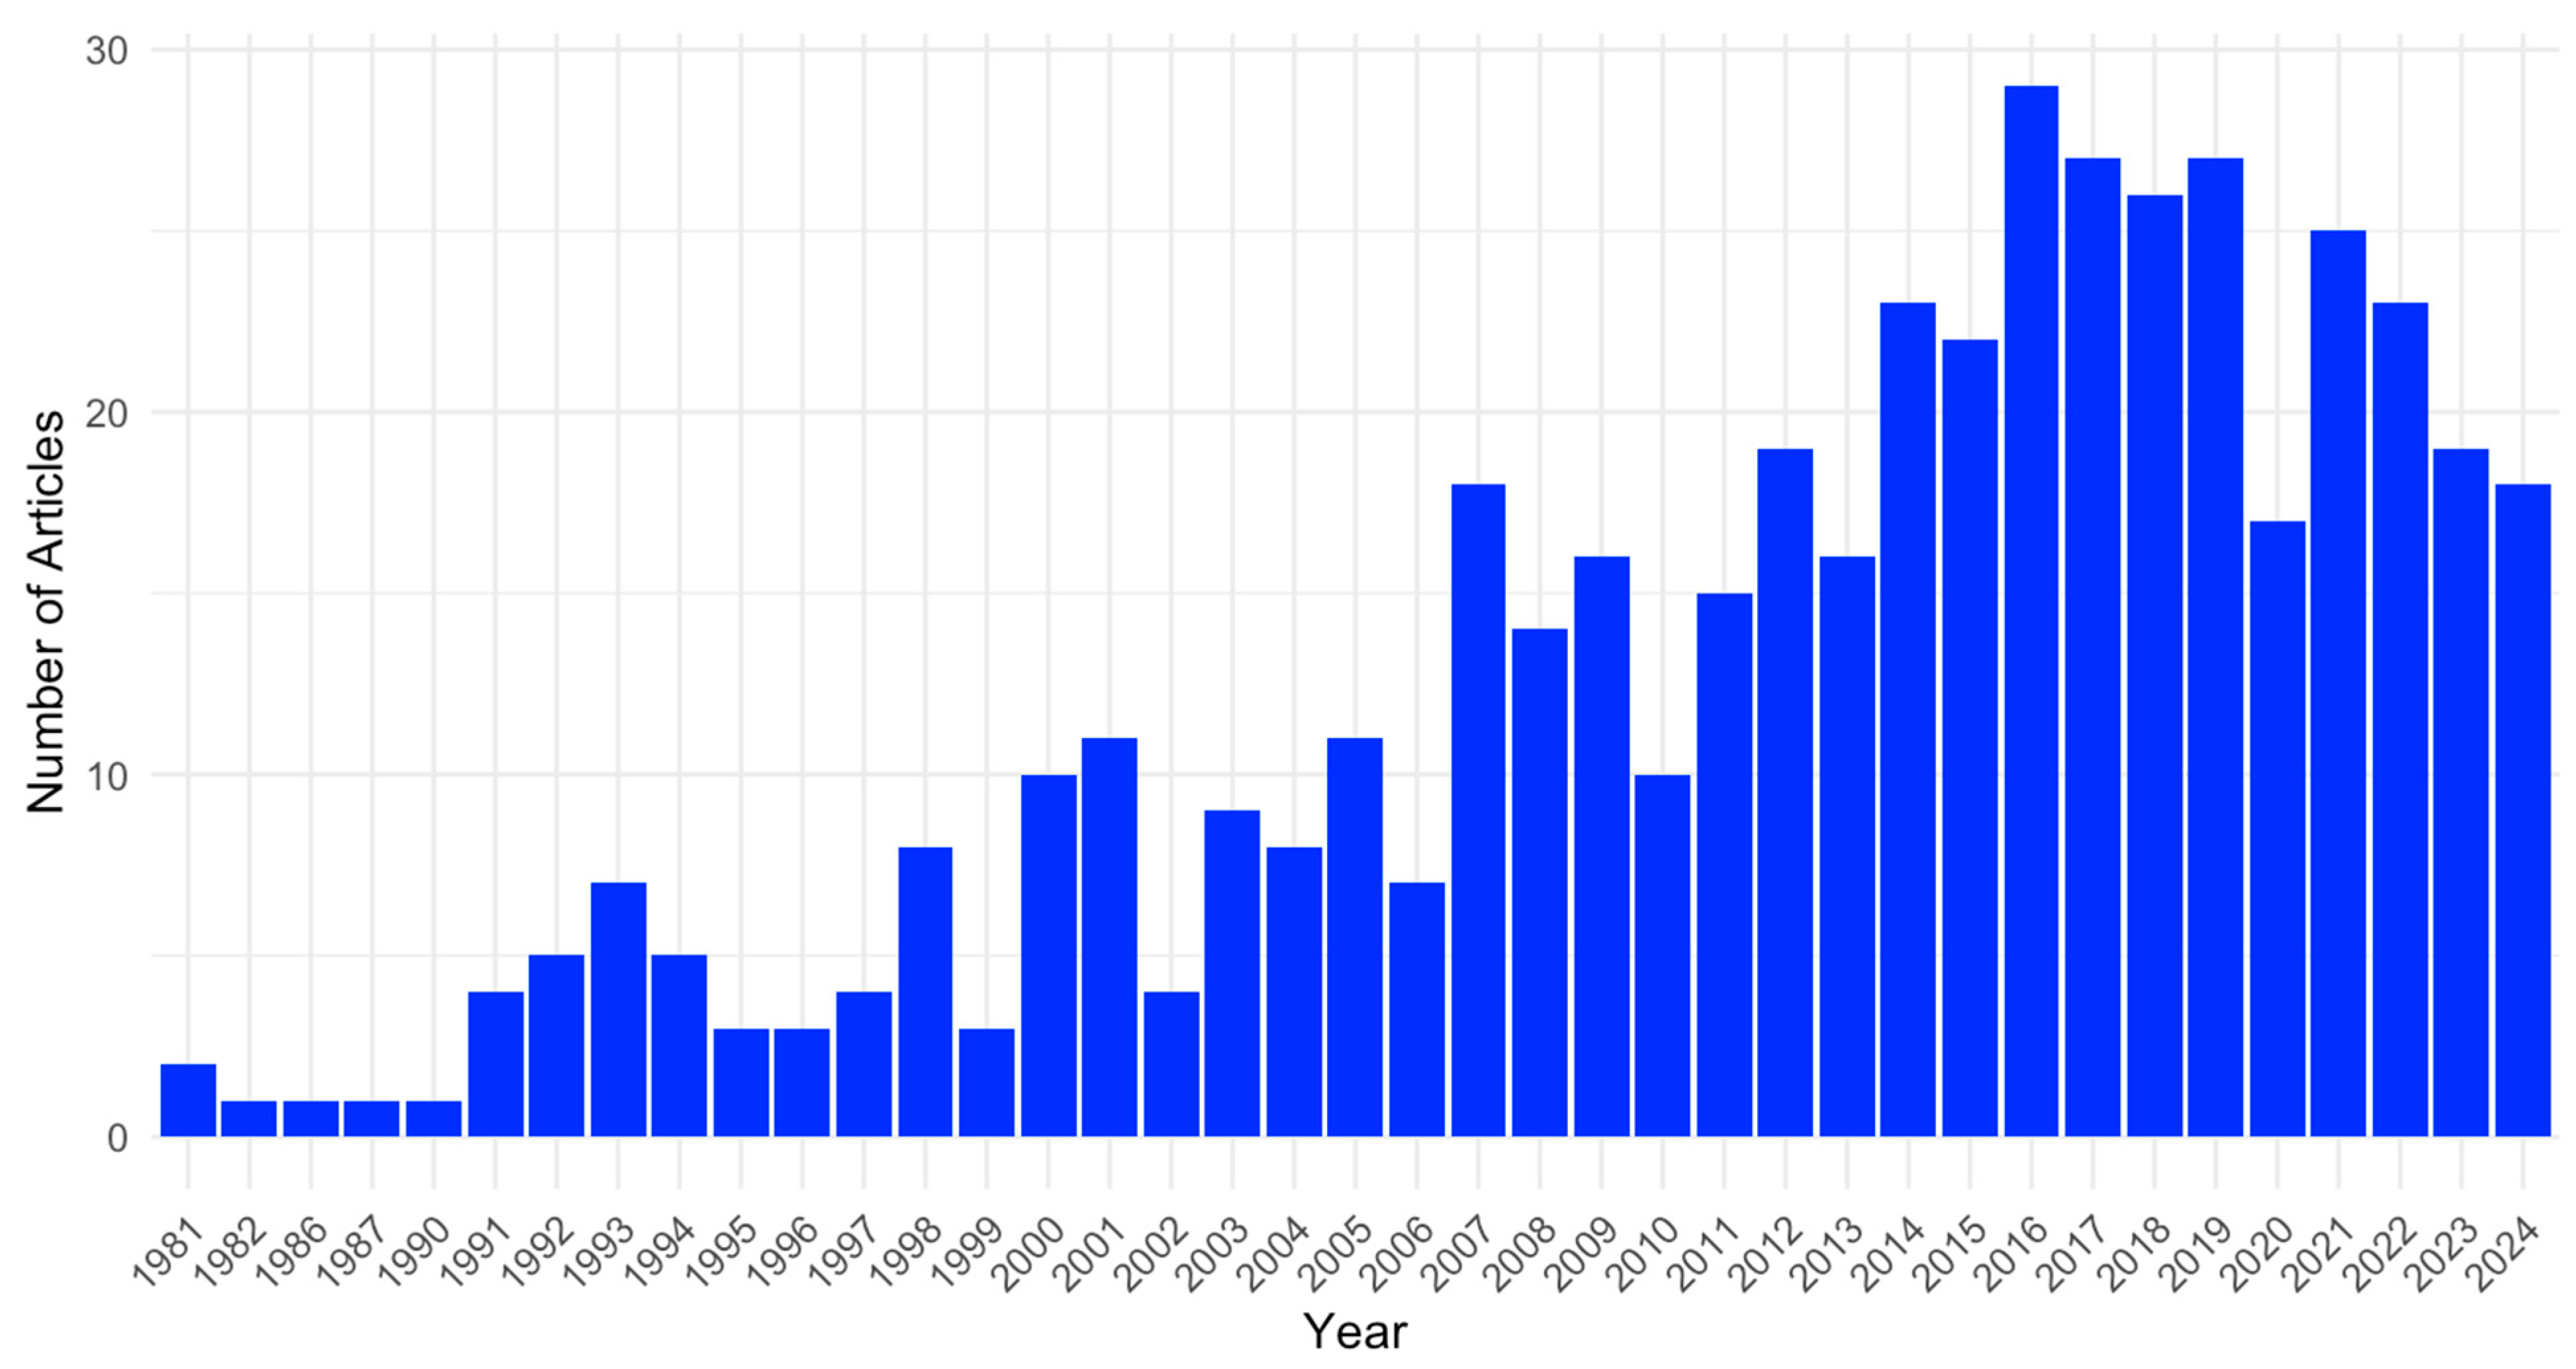
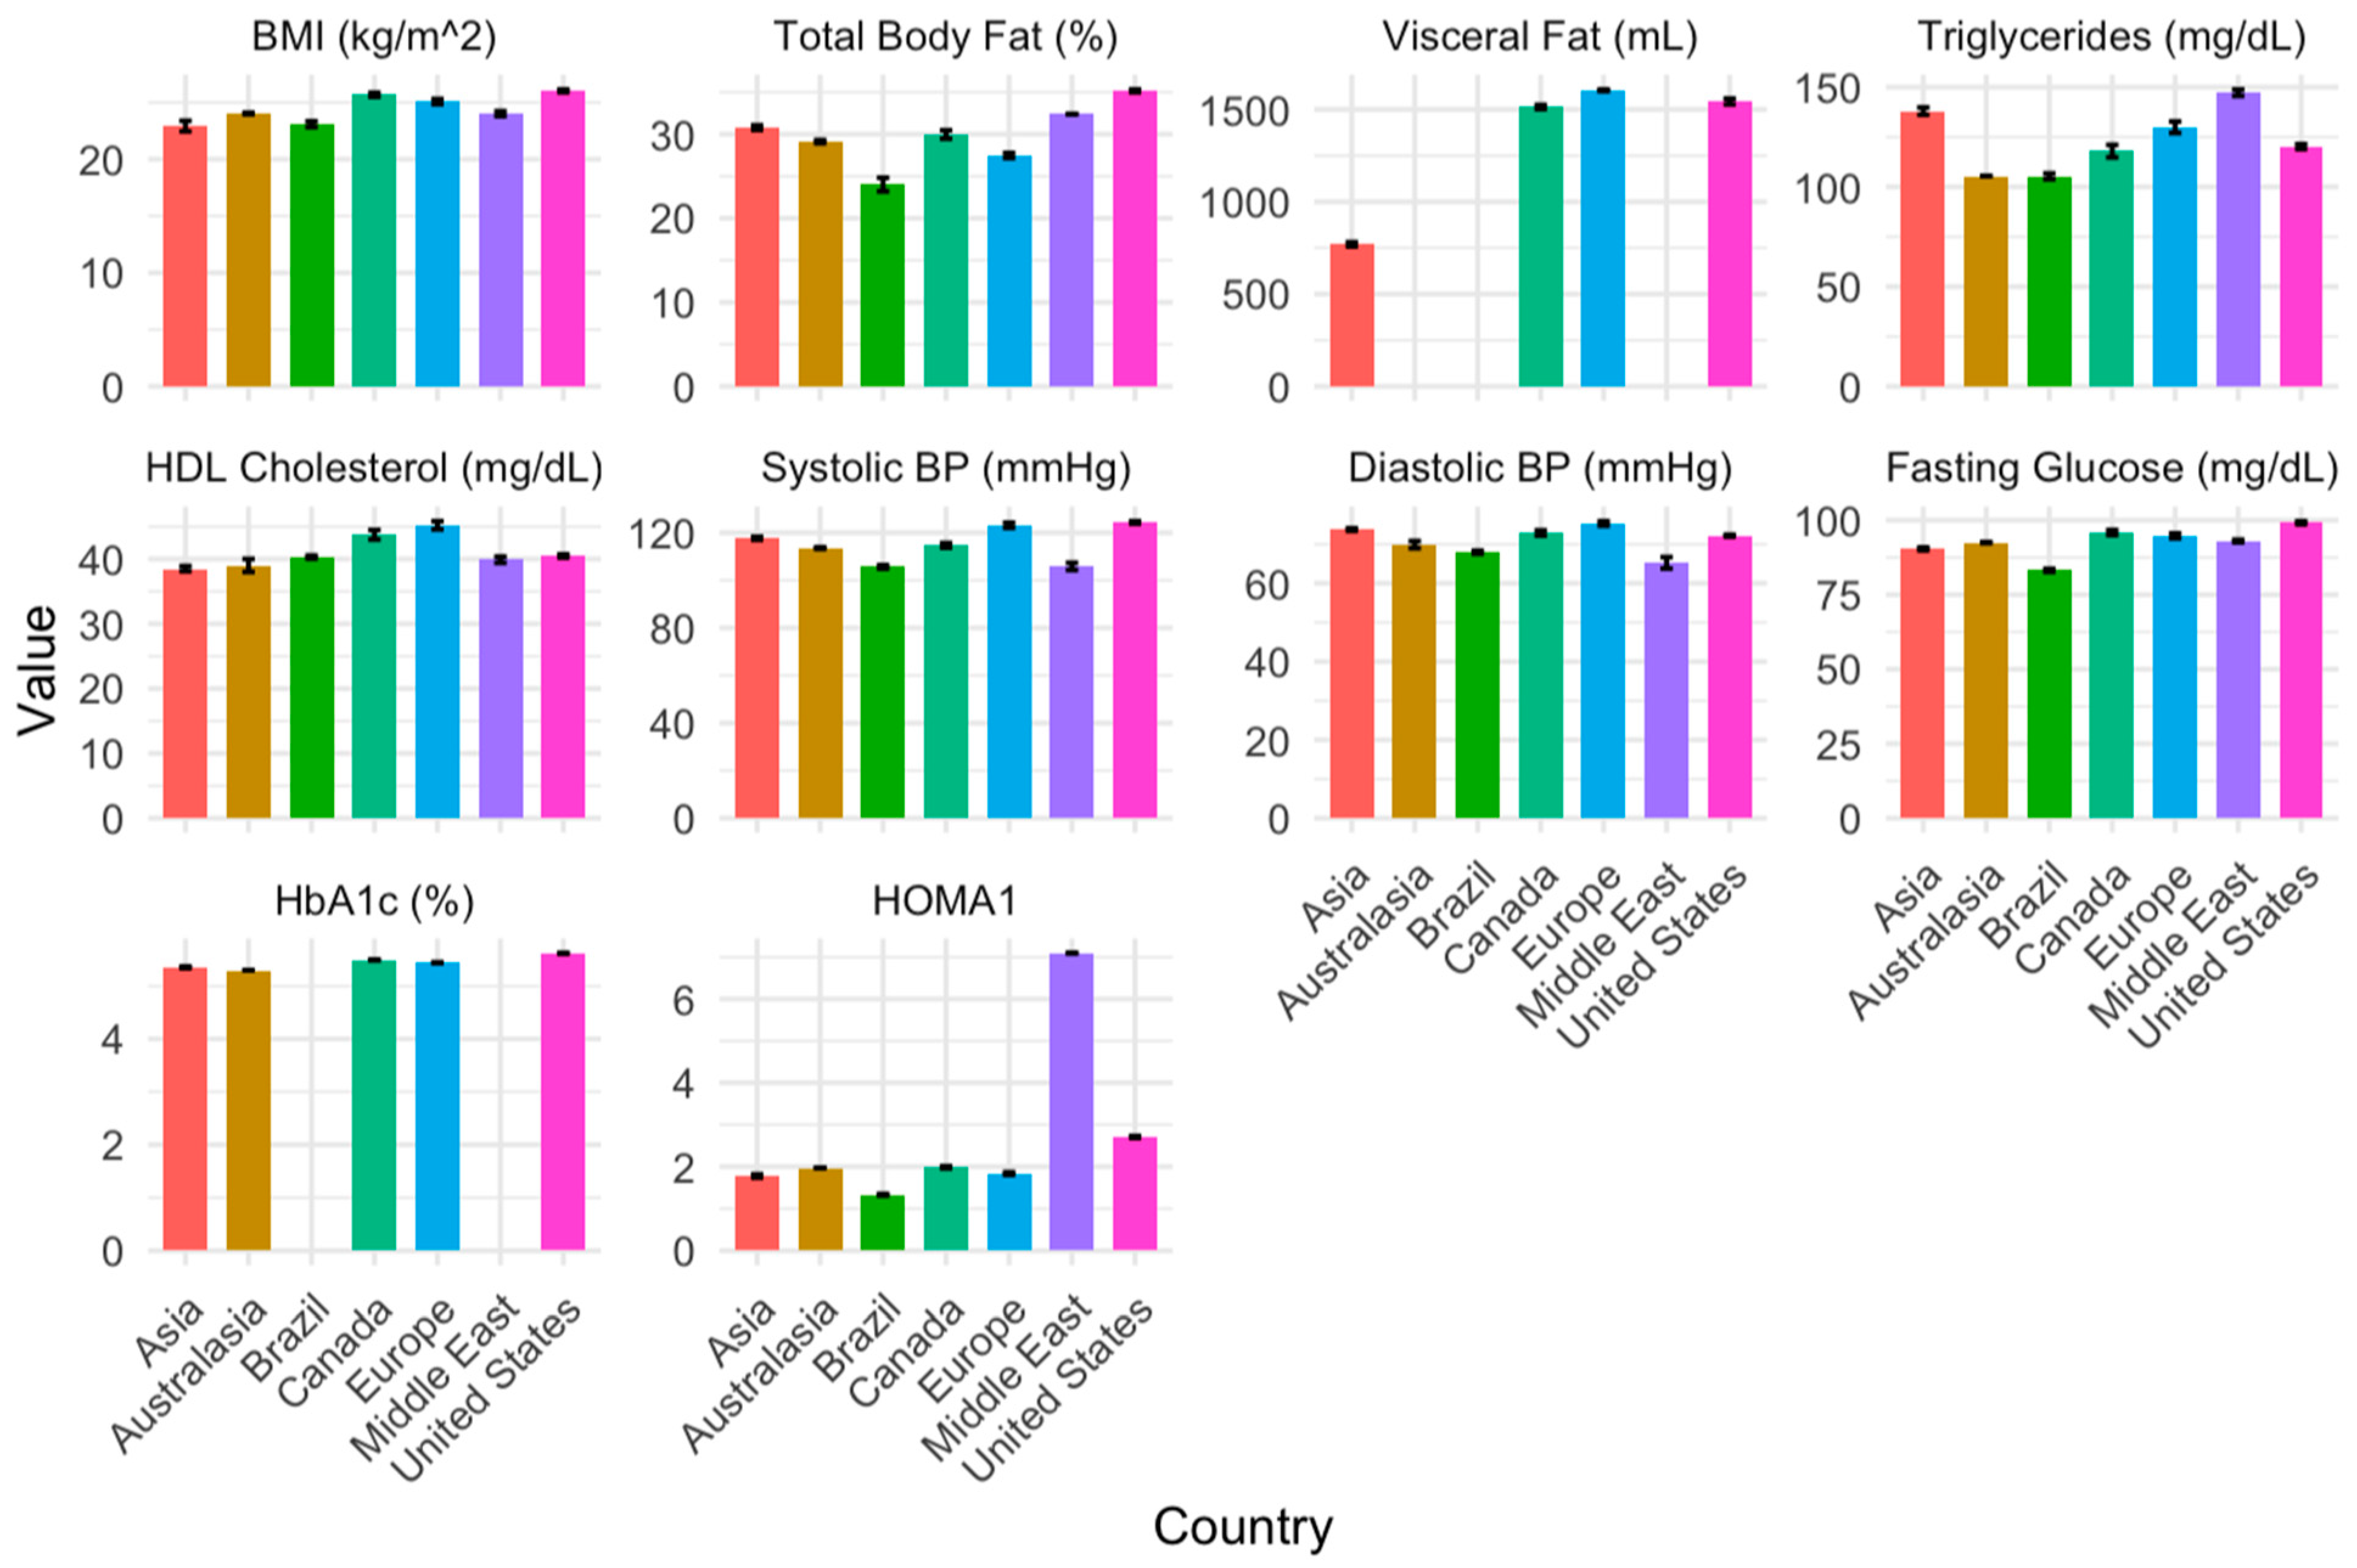
3.5. Temporal and Geographical Risk Factors of Cardiometabolic Syndrome (Aim 2)
3.6. Meta-Analysis of Risk Factors of Cardiometabolic Syndrome (Aim 3)
4. Discussion
4.1. Body Composition
4.2. Vascular Health
4.3. Insulin Resistance and Glycemic Health
4.4. Lipid Health
4.5. Temporal and Geographical Trends
Strengths and Limitations
5. Conclusions
Supplementary Materials
Author Contributions
Funding
Acknowledgments
Conflicts of Interest
References
- Henke, A.M.; Billington, Z.J.; Gater, D.R., Jr. Autonomic Dysfunction and Management after Spinal Cord Injury: A Narrative Review. J. Pers. Med. 2022, 12, 1110. [Google Scholar] [CrossRef] [PubMed]
- Castro, M.J.; Apple, D.F.; Hillegass, E.A.; Dudley, G.A. Influence of complete spinal cord injury on skeletal muscle cross-sectional area within the first 6 months of injury. J. Appl. Physiol. 1999, 80, 373–378. [Google Scholar] [CrossRef] [PubMed]
- Pelletier, C.A.; Hicks, A.L. Importance of Exercise in the Rehabilitation Process after Spinal Cord Injury. Crit. Rev. Phys. Rehabil. Med. 2013, 25, 143–158. [Google Scholar] [CrossRef]
- Farkas, G.J.; Gorgey, A.S.; Dolbow, D.R.; Berg, A.S.; Gater, D.R. Caloric intake relative to total daily energy expenditure using a spinal cord injury-specific correction factor: An analysis by level of injury. Am. J. Phys. Med. Rehabil. 2019, 98, 947–952. [Google Scholar] [CrossRef]
- Monroe, M.B.; Tataranni, P.A.; Pratley, R.; Manore, M.M.; Skinner, J.S.; Ravussin, E. Lower daily energy expenditure as measured by a respiratory chamber in subjects with spinal cord injury compared with control subjects. Am. J. Clin. Nutr. 1998, 68, 1223–1227. [Google Scholar] [CrossRef] [PubMed]
- Buchholz, A.C.; McGillivray, C.F.; Pencharz, P.B. Differences in resting metabolic rate between paraplegic and able-bodied subjects are explained by differences in body composition. Am. J. Clin. Nutr. 2003, 77, 371–378. [Google Scholar] [CrossRef]
- Jeon, J.Y.; Steadward, R.D.; Wheeler, G.D.; Bell, G.; McCargar, L.; Harber, V. Intact sympathetic nervous system is required for leptin effects on resting metabolic rate in people with spinal cord injury. J. Clin. Endocrinol. Metab. 2003, 88, 402–407. [Google Scholar] [CrossRef]
- Groah, S.L.; Nash, M.S.; Ward, E.A.; Libin, A.; Mendez, A.J.; Burns, P.; Elrod, M.; Hamm, L.F. Cardiometabolic risk in community-dwelling persons with chronic spinal cord injury. J. Cardiopulm. Rehabil. Prev. 2011, 31, 73–80. [Google Scholar] [CrossRef]
- Farkas, G.J.; Gater, D.R. Neurogenic obesity and systemic inflammation following spinal cord injury: A review. J. Spinal Cord Med. 2018, 41, 378–387. [Google Scholar] [CrossRef]
- Gater, D.R.; Farkas, G.J.; Tiozzo, E. Pathophysiology of Neurogenic Obesity After Spinal Cord Injury. Top. Spinal Cord Inj. Rehabil. 2021, 27, 1–10. [Google Scholar] [CrossRef]
- Nash, M.S.; Groah, S.L.; Gater, D.R.; Dyson-Hudson, T.A.; Lieberman, J.A.; Myers, J.; Sabharwal, S.; Taylor, A.J. Identification and management of cardiometabolic risk after spinal cord injury. J. Spinal Cord Med. 2019, 42, 643–677. [Google Scholar] [CrossRef] [PubMed]
- Farkas, G.J.; Burton, A.M.; McMillan, D.W.; Sneij, A.; Gater, D.R., Jr. The Diagnosis and Management of Cardiometabolic Risk and Cardiometabolic Syndrome after Spinal Cord Injury. J. Pers. Med. 2022, 12, 1088. [Google Scholar] [CrossRef] [PubMed]
- Farkas, G.J.; Caldera, L.J.; Nash, M.S. Assessing the efficacy of duration and intensity prescription for physical activity in mitigating cardiometabolic risk after spinal cord injury. Curr. Opin. Neurol. 2023, 36, 531–540. [Google Scholar] [CrossRef]
- Kuller, L.H. AHA symposium/epidemiology meeting: Atherosclerosis. Discussion: Why measure atherosclerosis? Circulation 1993, 87, Ii34–Ii37. [Google Scholar]
- Varadarajan, V.; Gidding, S.S.; Wu, C.; Carr, J.J.; Lima, J.A.C. Imaging Early Life Cardiovascular Phenotype. Circ. Res. 2023, 132, 1607–1627. [Google Scholar] [CrossRef]
- Blight, A.R.; Hsieh, J.; Curt, A.; Fawcett, J.W.; Guest, J.D.; Kleitman, N.; Kurpad, S.N.; Kwon, B.K.; Lammertse, D.P.; Weidner, N.; et al. The challenge of recruitment for neurotherapeutic clinical trials in spinal cord injury. Spinal Cord 2019, 57, 348–359. [Google Scholar] [CrossRef]
- Tuszynski, M.H.; Steeves, J.D.; Fawcett, J.W.; Lammertse, D.; Kalichman, M.; Rask, C.; Curt, A.; Ditunno, J.F.; Fehlings, M.G.; Guest, J.D.; et al. Guidelines for the conduct of clinical trials for spinal cord injury as developed by the ICCP Panel: Clinical trial inclusion/exclusion criteria and ethics. Spinal Cord 2007, 45, 222–231. [Google Scholar] [CrossRef]
- Cardenas, D.; Yilmaz, B. Recruitment of spinal cord injury patients to clinical trials: Challenges and solutions. Top. Spinal Cord Inj. Rehabil. 2006, 11, 12–23. [Google Scholar] [CrossRef]
- Reinhardt, J.D.; Middleton, J.; Bökel, A.; Kovindha, A.; Kyriakides, A.; Hajjioui, A.; Kouda, K.; Kujawa, J. Environmental Barriers Experienced by People with Spinal Cord Injury Across 22 Countries: Results From a Cross-Sectional Survey. Arch. Phys. Med. Rehabil. 2020, 101, 2144–2156. [Google Scholar] [CrossRef]
- Bauman, W.A.; La Fountaine, M.F.; Spungen, A.M. Age-related prevalence of low testosterone in men with spinal cord injury. J. Spinal Cord Med. 2014, 37, 32–39. [Google Scholar] [CrossRef]
- Liang, H.; Mojtahedi, M.C.; Chen, D.; Braunschweig, C.L. Elevated C-reactive protein associated with decreased high-density lipoprotein cholesterol in men with spinal cord injury. Arch. Phys. Med. Rehabil. 2008, 89, 36–41. [Google Scholar] [CrossRef] [PubMed]
- Radulovic, M.; Bauman, W.A.; Wecht, J.M.; LaFountaine, M.; Kahn, N.; Hobson, J.; Singh, K.; Renzi, C.; Yen, C.; Schilero, G.J. Biomarkers of inflammation in persons with chronic tetraplegia. J. Breath Res. 2015, 9, 036001. [Google Scholar] [CrossRef]
- Cirnigliaro, C.M.; La Fountaine, M.F.; Hobson, J.C.; Kirshblum, S.C.; Dengel, D.R.; Spungen, A.M.; Bauman, W.A. Predicting cardiometabolic risk from visceral abdominal adiposity in persons with chronic spinal cord injury. J. Clin. Densitom. 2021, 24, 442–452. [Google Scholar] [CrossRef] [PubMed]
- Cirnigliaro, C.M.; LaFountaine, M.F.; Dengel, D.R.; Bosch, T.A.; Emmons, R.R.; Kirshblum, S.C.; Sauer, S.; Asselin, P.; Spungen, A.M.; Bauman, W.A. Visceral adiposity in persons with chronic spinal cord injury determined by dual energy X-ray absorptiometry. Obesity 2015, 23, 1811–1817. [Google Scholar] [CrossRef] [PubMed]
- Farkas, G.J.; Gorgey, A.S.; Dolbow, D.R.; Berg, A.S.; Gater, D.R. The influence of level of spinal cord injury on adipose tissue and its relationship to inflammatory adipokines and cardiometabolic profiles. J. Spinal Cord Med. 2018, 41, 407–415. [Google Scholar] [CrossRef]
- Farkas, G.J.; Gorgey, A.S.; Dolbow, D.R.; Berg, A.S.; Gater, D.R. Sex dimorphism in the distribution of adipose tissue and its influence on proinflammatory adipokines and cardiometabolic profiles in motor complete spinal cord injury. J. Spinal Cord Med. 2019, 42, 430–436. [Google Scholar] [CrossRef]
- Gorgey, A.S.; Gater, D.R. A preliminary report on the effects of the level of spinal cord injury on the association between central adiposity and metabolic profile. PM&R 2011, 3, 440–446. [Google Scholar] [CrossRef]
- Gater, D.R., Jr.; Farkas, G.J.; Dolbow, D.R.; Berg, A.S.; Gorgey, A.S. Body composition and metabolic assessment after motor complete spinal cord injury: Development of a clinically relevant equation to estimate body fat. Top. Spinal Cord Inj. Rehabil. 2021, 27, 11–22. [Google Scholar] [CrossRef]
- Hosier, H.; Groah, S.L.; Libin, A.V.; Tinsley, E.; Burns, P.; Nash, M.S. Cardiometabolic Risk Profiles in Pre- Versus Postmenopausal Women with Spinal Cord Injury: Preliminary Findings. Top. Spinal Cord Inj. Rehabil. 2012, 18, 322–330. [Google Scholar] [CrossRef]
- La Fountaine, M.F.; Cirnigliaro, C.M.; Kirshblum, S.C.; McKenna, C.; Bauman, W.A. Effect of functional sympathetic nervous system impairment of the liver and abdominal visceral adipose tissue on circulating triglyceride-rich lipoproteins. PLoS ONE 2017, 12, e0173934. [Google Scholar] [CrossRef]
- Nash, M.S.; Tractenberg, R.E.; Mendez, A.J.; David, M.; Ljungberg, I.H.; Tinsley, E.A.; Burns-Drecq, P.A.; Betancourt, L.F.; Groah, S.L. Cardiometabolic syndrome in people with spinal cord injury/disease: Guideline-derived and nonguideline risk components in a pooled sample. Arch. Phys. Med. Rehabil. 2016, 97, 1696–1705. [Google Scholar] [CrossRef]
- Nightingale, T.; Walhin, J.; Thompson, D.; Bilzon, J. Biomarkers of cardiometabolic health are associated with body composition characteristics but not physical activity in persons with spinal cord injury. J. Spinal Cord Med. 2019, 42, 328–337. [Google Scholar] [CrossRef]
- Raguindin, P.F.; Mueller, G.; Stoyanov, J.; Eriks-Hoogland, I.; Jordan, X.; Stojic, S.; Hund-Georgiadis, M.; Muka, T.; Stucki, G.; Glisic, M. The burden of cardiovascular risk in individuals with spinal cord injury (SCI) and its association with rehabilitation outcomes—Results from the Swiss SCI Cohort. Am. J. Phys. Med. Rehabil. 2023, 102, 1043–1054. [Google Scholar] [CrossRef]
- Yahiro, A.M.; Wingo, B.C.; Kunwor, S.; Parton, J.; Ellis, A.C. Classification of obesity, cardiometabolic risk, and metabolic syndrome in adults with spinal cord injury. J. Spinal Cord Med. 2020, 43, 485–496. [Google Scholar] [CrossRef] [PubMed]
- Yoon, E.S.; Heffernan, K.S.; Jae, S.Y.; Kim, H.J.; Bunsawat, K.; Fernhall, B. Metabolically healthy obesity and subclinical atherosclerosis in persons with spinal cord injury. J. Rehabil. Med. 2018, 50, 613–618. [Google Scholar] [CrossRef] [PubMed]
- Wallace, S.S.; Barak, G.; Truong, G.; Parker, M.W. Hierarchy of Evidence Within the Medical Literature. Hosp. Pediatr. 2022, 12, 745–750. [Google Scholar] [CrossRef]
- Wahl, U.; Hirsch, T. A systematic review of cardiovascular risk factors in patients with traumatic spinal cord injury. Vasa 2022, 51, 46–55. [Google Scholar] [CrossRef] [PubMed]
- Raguindin, P.F.; Bertolo, A.; Zeh, R.M.; Fränkl, G.; Itodo, O.A.; Capossela, S.; Bally, L.; Minder, B.; Brach, M.; Eriks-Hoogland, I.; et al. Body Composition According to Spinal Cord Injury Level: A Systematic Review and Meta-Analysis. J. Clin. Med. 2021, 10, 3911. [Google Scholar] [CrossRef]
- Raguindin, P.F.; Fränkl, G.; Itodo, O.A.; Bertolo, A.; Zeh, R.M.; Capossela, S.; Minder, B.; Stoyanov, J.; Stucki, G.; Franco, O.H.; et al. The neurological level of spinal cord injury and cardiovascular risk factors: A systematic review and meta-analysis. Spinal Cord 2021, 59, 1135–1145. [Google Scholar] [CrossRef]
- Gilbert, O.; Croffoot, J.R.; Taylor, A.J.; Nash, M.; Schomer, K.; Groah, S. Serum lipid concentrations among persons with spinal cord injury—A systematic review and meta-analysis of the literature. Atherosclerosis 2014, 232, 305–312. [Google Scholar] [CrossRef]
- West, C.R.; Mills, P.; Krassioukov, A.V. Influence of the neurological level of spinal cord injury on cardiovascular outcomes in humans: A meta-analysis. Spinal Cord 2012, 50, 484–492. [Google Scholar] [CrossRef]
- Cadotte, D.W.; Fehlings, M.G. Spinal cord injury: A systematic review of current treatment options. Clin. Orthop. Relat. Res. 2011, 469, 732–741. [Google Scholar] [CrossRef] [PubMed]
- Rabadi, M.H.; Mayanna, S.K.; Vincent, A.S. Predictors of mortality in veterans with traumatic spinal cord injury. Spinal Cord 2013, 51, 784–788. [Google Scholar] [CrossRef] [PubMed]
- Zeilig, G.; Dolev, M.; Weingarden, H.; Blumen, N.; Shemesh, Y.; Ohry, A. Long-term morbidity and mortality after spinal cord injury: 50 years of follow-up. Spinal Cord 2000, 38, 563–566. [Google Scholar] [CrossRef]
- Peterson, M.D.; Berri, M.; Lin, P.; Kamdar, N.; Rodriguez, G.; Mahmoudi, E.; Tate, D. Cardiovascular and metabolic morbidity following spinal cord injury. Spine J. 2021, 21, 1520–1527. [Google Scholar] [CrossRef]
- Barton, T.J.; Low, D.A.; Bakker, E.A.; Janssen, T.; de Groot, S.; van der Woude, L.; Thijssen, D.H.J. Traditional Cardiovascular Risk Factors Strongly Underestimate the 5-Year Occurrence of Cardiovascular Morbidity and Mortality in Spinal Cord Injured Individuals. Arch. Phys. Med. Rehabil. 2021, 102, 27–34. [Google Scholar] [CrossRef] [PubMed]
- Sabre, L.; Rekand, T.; Asser, T.; Kõrv, J. Mortality and causes of death after traumatic spinal cord injury in Estonia. J. Spinal Cord Med. 2013, 36, 687–694. [Google Scholar] [CrossRef]
- Lidal, I.B.; Snekkevik, H.; Aamodt, G.; Hjeltnes, N.; Biering-Sørensen, F.; Stanghelle, J.K. Mortality after spinal cord injury in Norway. J. Rehabil. Med. 2007, 39, 145–151. [Google Scholar] [CrossRef]
- Ahoniemi, E.; Pohjolainen, T.; Kautiainen, H. Survival after spinal cord injury in Finland. J. Rehabil. Med. 2011, 43, 481–485. [Google Scholar] [CrossRef]
- Garshick, E.; Kelley, A.; Cohen, S.A.; Garrison, A.; Tun, C.G.; Gagnon, D.; Brown, R. A prospective assessment of mortality in chronic spinal cord injury. Spinal Cord 2005, 43, 408–416. [Google Scholar] [CrossRef]
- Savic, G.; DeVivo, M.J.; Frankel, H.L.; Jamous, M.A.; Soni, B.M.; Charlifue, S. Causes of death after traumatic spinal cord injury-a 70-year British study. Spinal Cord 2017, 55, 891–897. [Google Scholar] [CrossRef] [PubMed]
- Thietje, R.; Pouw, M.H.; Schulz, A.P.; Kienast, B.; Hirschfeld, S. Mortality in patients with traumatic spinal cord injury: Descriptive analysis of 62 deceased subjects. J. Spinal Cord Med. 2011, 34, 482–487. [Google Scholar] [CrossRef] [PubMed]
- DeVivo, M.J.; Chen, Y.; Wen, H. Cause of Death Trends Among Persons with Spinal Cord Injury in the United States: 1960–2017. Arch. Phys. Med. Rehabil. 2022, 103, 634–641. [Google Scholar] [CrossRef] [PubMed]
- Cao, Y.; DiPiro, N.; Krause, J.S. Association of Secondary Health Conditions with Future Chronic Health Conditions Among Persons with Traumatic Spinal Cord Injury. Top. Spinal Cord Inj. Rehabil. 2020, 26, 283–289. [Google Scholar] [CrossRef]
- Aidinoff, E.; Bluvshtein, V.; Bierman, U.; Gelernter, I.; Front, L.; Catz, A. Coronary artery disease and hypertension in a non-selected spinal cord injury patient population. Spinal Cord 2017, 55, 321–326. [Google Scholar] [CrossRef]
- Wang, C.C.; Chang, C.T.; Lin, C.L.; Huang, B.R.; Kao, C.H. Spinal cord injury is associated with an increased risk of atrial fibrillation: A population-based cohort study. Heart Rhythm 2016, 13, 416–423. [Google Scholar] [CrossRef]
- Higgins, J.P.; Lasserson, T.; Chandler, J.; Tovey, D.; Churchill, R. Methodological Expectations of Cochrane Intervention Reviews; Cochrane: London, UK, 2023. [Google Scholar]
- Page, M.J.; Moher, D.; Bossuyt, P.M.; Boutron, I.; Hoffmann, T.C.; Mulrow, C.D.; Shamseer, L.; Tetzlaff, J.M.; Akl, E.A.; Brennan, S.E.; et al. PRISMA 2020 explanation and elaboration: Updated guidance and exemplars for reporting systematic reviews. BMJ 2021, 372, n160. [Google Scholar] [CrossRef]
- Esene, I.N.; Kotb, A.; ElHusseiny, H. Five is the maximum sample size for case reports: Statistical justification, epidemiologic rationale, and clinical importance. World Neurosurg. 2014, 82, e659–e665. [Google Scholar] [CrossRef]
- McGowan, J.; Sampson, M.; Salzwedel, D.M.; Cogo, E.; Foerster, V.; Lefebvre, C. PRESS Peer Review of Electronic Search Strategies: 2015 Guideline Statement. J. Clin. Epidemiol. 2016, 75, 40–46. [Google Scholar] [CrossRef]
- Clark, J.M.; Sanders, S.; Carter, M.; Honeyman, D.; Cleo, G.; Auld, Y.; Booth, D.; Condron, P.; Dalais, C.; Bateup, S.; et al. Improving the translation of search strategies using the Polyglot Search Translator: A randomized controlled trial. J. Med. Libr. Assoc. 2020, 108, 195–207. [Google Scholar] [CrossRef]
- The EndNote Team, Version 20. EndNote [64-bit software]. Clarivate: London, UK, 2013.
- Covidence Systematic Review Software. Available online: http://www.covidence.org (accessed on 27 July 2021).
- Farkas, G.J.; Pitot, M.A.; Berg, A.S.; Gater, D.R. Nutritional status in chronic spinal cord injury: A systematic review and meta-analysis. Spinal Cord 2019, 57, 3–17. [Google Scholar] [CrossRef] [PubMed]
- Farkas, G.J.; Pitot, M.A.; Gater, D.R., Jr. A systematic review of the accuracy of estimated and measured resting metabolic rate in chronic spinal cord injury. Int. J. Sport Nutr. Exerc. Metab. 2019, 29, 548–558. [Google Scholar] [CrossRef] [PubMed]
- Dijkers, M. Duplicate publications and systematic reviews: Problems and proposals. KT Update 2018, 6, 1–12. [Google Scholar]
- Shi, J.; Luo, D.; Wan, X.; Liu, Y.; Liu, J.; Bian, Z.; Tong, T. Detecting the skewness of data from the five-number summary and its application in meta-analysis. Stat. Methods Med. Res. 2023, 32, 1338–1360. [Google Scholar] [CrossRef]
- Shi, J.; Luo, D.; Weng, H.; Zeng, X.T.; Lin, L.; Chu, H.; Tong, T. Optimally estimating the sample standard deviation from the five-number summary. Res. Synth. Methods 2020, 11, 641–654. [Google Scholar] [CrossRef] [PubMed]
- Luo, D.; Wan, X.; Liu, J.; Tong, T. Optimally estimating the sample mean from the sample size, median, mid-range, and/or mid-quartile range. Stat. Methods Med. Res. 2018, 27, 1785–1805. [Google Scholar] [CrossRef]
- Wan, X.; Wang, W.; Liu, J.; Tong, T. Estimating the sample mean and standard deviation from the sample size, median, range and/or interquartile range. BMC Med. Res. Methodol 2014, 14, 135. [Google Scholar] [CrossRef]
- Rupp, R.; Biering-Sørensen, F.; Burns, S.P.; Graves, D.E.; Guest, J.; Jones, L.; Read, M.S.; Rodriguez, G.M.; Schuld, C.; Tansey-Md, K.E.; et al. International Standards for Neurological Classification of Spinal Cord Injury: Revised 2019. Top. Spinal Cord Inj. Rehabil. 2021, 27, 1–22. [Google Scholar] [CrossRef]
- Krassioukov, A.; Claydon, V.E. The clinical problems in cardiovascular control following spinal cord injury: An overview. Prog. Brain Res. 2006, 152, 223–229. [Google Scholar] [CrossRef]
- Paulson, T.A.W.; Goosey-Tolfrey, V.L.; Lenton, J.P.; Leicht, C.A.; Bishop, N.C. Spinal cord injury level and the circulating cytokine response to strenuous exercise. Med. Sci. Sports Exerc. 2013, 45, 1649–1655. [Google Scholar] [CrossRef]
- Steinberg, L.L.; Lauro, F.A.; Sposito, M.M.; Tufik, S.; Mello, M.T.; Naffah-Mazzacoratti, M.G.; Cavalheiro, E.A.; Silva, A.C. Catecholamine response to exercise in individuals with different levels of paraplegia. Braz. J. Med. Biol. Res. 2000, 33, 913–918. [Google Scholar] [CrossRef] [PubMed]
- Wecht, J.M.; Harel, N.Y.; Guest, J.; Kirshblum, S.C.; Forrest, G.F.; Bloom, O.; Ovechkin, A.V.; Harkema, S. Cardiovascular Autonomic Dysfunction in Spinal Cord Injury: Epidemiology, Diagnosis, and Management. Semin. Neurol. 2020, 40, 550–559. [Google Scholar] [CrossRef] [PubMed]
- Martin Ginis, K.A.; Phang, S.H.; Latimer, A.E.; Arbour-Nicitopoulos, K.P. Reliability and validity tests of the leisure time physical activity questionnaire for people with spinal cord injury. Arch. Phys. Med. Rehabil. 2012, 93, 677–682. [Google Scholar] [CrossRef]
- Martin Ginis, K.A.; van der Ploeg, H.P.; Foster, C.; Lai, B.; McBride, C.B.; Ng, K.; Pratt, M.; Shirazipour, C.H.; Smith, B.; Vásquez, P.M.; et al. Participation of people living with disabilities in physical activity: A global perspective. Lancet 2021, 398, 443–455. [Google Scholar] [CrossRef]
- Carty, C.; van der Ploeg, H.P.; Biddle, S.J.H.; Bull, F.; Willumsen, J.; Lee, L.; Kamenov, K.; Milton, K. The First Global Physical Activity and Sedentary Behavior Guidelines for People Living with Disability. J. Phys. Act. Health 2021, 18, 86–93. [Google Scholar] [CrossRef]
- Kmet, L.; Lee, R.C.; Cook, L.S. Standard Quality Assessment Criteria for Evaluating Primary Research Papers From a Variety of Fields; Alberta Heritage Foundation for Medical Research: Edmonton, AB, Canada, 2004. [Google Scholar]
- Laughton, G.E.; Buchholz, A.C.; Martin Ginis, K.A.; Goy, R.E.; Group, S.S.R. Lowering body mass index cutoffs better identifies obese persons with spinal cord injury. Spinal Cord 2009, 47, 757–762. [Google Scholar] [CrossRef]
- Classification and Diagnosis of Diabetes: Standards of Medical Care in Diabetes-2020. Diabetes Care 2020, 43, S14–S31. [CrossRef] [PubMed]
- Gordon, P.S.; Farkas, G.J.; Gater, D.R., Jr. Neurogenic obesity-induced insulin resistance and type 2 diabetes mellitus in chronic spinal cord injury. Top. Spinal Cord Inj. Rehabil. 2021, 27, 36–56. [Google Scholar] [CrossRef]
- Farkas, G.J.; Gordon, P.S.; Trewick, N.; Gorgey, A.S.; Dolbow, D.R.; Tiozzo, E.; Berg, A.S.; Gater, D.R., Jr. Comparison of Various Indices in Identifying Insulin Resistance and Diabetes in Chronic Spinal Cord Injury. J. Clin. Med. 2021, 10, 5591. [Google Scholar] [CrossRef]
- R Core Team R: A Language and Environment for Statistical Computing; R Foundation for Statistical Computing: Vienna, Austria, 2022.
- Wickham, H. ggplot2: Elegant Graphics for Data Analysis; Springer International Publishing: New York, NY, USA, 2016. [Google Scholar] [CrossRef]
- Viechtbauer, W. Conducting meta-analyses in R with the metafor package. J. Stat. Softw. 2010, 36, 1–48. [Google Scholar] [CrossRef]
- DerSimonian, R.; Laird, N. Meta-analysis in clinical trials. Control. Clin. Trials 1986, 7, 177–188. [Google Scholar] [CrossRef] [PubMed]
- Valentine, J.C.; Pigott, T.D.; Rothstein, H.R. How Many Studies Do You Need?: A Primer on Statistical Power for Meta-Analysis. J. Educ. Behav. Stat. 2010, 35, 215–247. [Google Scholar] [CrossRef]
- Davey, J.; Turner, R.M.; Clarke, M.J.; Higgins, J.P.T. Characteristics of meta-analyses and their component studies in the Cochrane Database of Systematic Reviews: A cross-sectional, descriptive analysis. BMC Med. Res. Methodol. 2011, 11, 160. [Google Scholar] [CrossRef] [PubMed]
- Higgins, J.P.T.; Thomas, J.; Chandler, J.; Cumpston, M.; Li, T.; Page, M.J.; Welch, V.A. (Eds.) Cochrane Handbook for Systematic Reviews of Interventions; John Wiley & Sons: Chichester, UK, 2019. [Google Scholar]
- Gater, D.R. Obesity after spinal cord injury. Phys. Med. Rehabil. Clin. N. Am. 2007, 18, 333–351. [Google Scholar] [CrossRef]
- Oda, E. The metabolic syndrome as a concept of adipose tissue disease. Hypertens. Res. 2008, 31, 1283–1291. [Google Scholar] [CrossRef]
- Pearson, T.A.; Mensah, G.A.; Alexander, R.W.; Anderson, J.L.; Cannon, R.O.; Criqui, M.; Fadl, Y.Y.; Fortmann, S.P.; Hong, Y.; Myers, G.L.; et al. Markers of inflammation and cardiovascular disease: Application to clinical and public health practice: A statement for healthcare professionals from the Centers for Disease Control and Prevention and the American Heart Association. Circulation 2003, 107, 499–511. [Google Scholar] [CrossRef]
- Berg, A.H.; Scherer, P.E. Adipose tissue, inflammation, and cardiovascular disease. Circ. Res. 2005, 96, 939–949. [Google Scholar] [CrossRef] [PubMed]
- Blüher, M. Adipose tissue dysfunction contributes to obesity related metabolic diseases. Best Pract. Res. Clin. Endocrinol. Metab. 2013, 27, 163–177. [Google Scholar] [CrossRef]
- Booth, A.; Magnuson, A.; Fouts, J.; Foster, M. Adipose tissue, obesity and adipokines: Role in cancer promotion. Horm. Mol. Biol. Clin. Investig. 2015, 21, 57–74. [Google Scholar] [CrossRef]
- Dolbow, D.R.; Farkas, G.J.; Berg, A.S.; Welsch, M.A.; Gorgey, A.S.; Gater, D.R. Fat to lean mass ratio in spinal cord injury: Possible interplay of components of body composition that may instigate systemic inflammation and metabolic syndrome. J. Spinal Cord Med. 2022, 45, 833–839. [Google Scholar] [CrossRef]
- Pedersen, B.K. Muscles and their myokines. J. Exp. Biol. 2011, 214, 337–346. [Google Scholar] [CrossRef]
- Fiuza-Luces, C.; Santos-Lozano, A.; Joyner, M.; Carrera-Bastos, P.; Picazo, O.; Zugaza, J.L.; Izquierdo, M.; Ruilope, L.M.; Lucia, A. Exercise benefits in cardiovascular disease: Beyond attenuation of traditional risk factors. Nat. Rev. Cardiol. 2018, 15, 731–743. [Google Scholar] [CrossRef] [PubMed]
- Perret, C.; Stoffel-Kurt, N. Comparison of nutritional intake between individuals with acute and chronic spinal cord injury. J. Spinal Cord Med. 2011, 34, 569–575. [Google Scholar] [CrossRef] [PubMed]
- Westerterp, K.R. Control of energy expenditure in humans. Eur. J. Clin. Nutr. 2017, 71, 340–344. [Google Scholar] [CrossRef]
- Webb, P. Energy expenditure and fat-free mass in men and women. Am. J. Clin. Nutr. 1981, 34, 1816–1826. [Google Scholar] [CrossRef]
- Schoeller, D.A.; Fjeld, C.R. Human energy metabolism: What have we learned from the doubly labeled water method? Annu. Rev. Nutr. 1991, 11, 355–373. [Google Scholar] [CrossRef]
- Wang, Z.; Ying, Z.; Bosy-Westphal, A.; Zhang, J.; Schautz, B.; Later, W.; Heymsfield, S.B.; Müller, M.J. Specific metabolic rates of major organs and tissues across adulthood: Evaluation by mechanistic model of resting energy expenditure. Am. J. Clin. Nutr. 2010, 92, 1369–1377. [Google Scholar] [CrossRef] [PubMed]
- Gallagher, D.; Visser, M.; Wang, Z.; Harris, T.; Pierson, R.N., Jr.; Heymsfield, S.B. Metabolically active component of fat-free body mass: Influences of age, adiposity, and gender. Metabolism 1996, 45, 992–997. [Google Scholar] [CrossRef]
- Wink, J.; van Delft, R.; Notenboom, R.G.E.; Wouters, P.F.; DeRuiter, M.C.; Plevier, J.W.M.; Jongbloed, M.R.M. Human adult cardiac autonomic innervation: Controversies in anatomical knowledge and relevance for cardiac neuromodulation. Auton. Neurosci. 2020, 227, 102674. [Google Scholar] [CrossRef]
- Eichmann, A.; Brunet, I. Arterial innervation in development and disease. Sci. Transl. Med. 2014, 6, 252–259. [Google Scholar] [CrossRef]
- Phillips, A.A.; Krassioukov, A.V. Contemporary Cardiovascular Concerns after Spinal Cord Injury: Mechanisms, Maladaptations, and Management. J. Neurotrauma. 2015, 32, 1927–1942. [Google Scholar] [CrossRef]
- Krassioukov, A.V.; Bunge, R.P.; Pucket, W.R.; Bygrave, M.A. The changes in human spinal sympathetic preganglionic neurons after spinal cord injury. Spinal Cord 1999, 37, 6–13. [Google Scholar] [CrossRef]
- Mathias, C.J. Orthostatic hypotension and paroxysmal hypertension in humans with high spinal cord injury. Prog. Brain Res. 2006, 152, 231–243. [Google Scholar] [CrossRef] [PubMed]
- Phillips, A.A.; Matin, N.; Jia, M.; Squair, J.W.; Monga, A.; Zheng, M.M.Z.; Sachdeva, R.; Yung, A.; Hocaloski, S.; Elliott, S.; et al. Transient Hypertension after Spinal Cord Injury Leads to Cerebrovascular Endothelial Dysfunction and Fibrosis. J. Neurotrauma. 2018, 35, 573–581. [Google Scholar] [CrossRef] [PubMed]
- Currie, K.D.; Hubli, M.; MacDonald, M.J.; Krassioukov, A.V. Associations between arterial stiffness and blood pressure fluctuations after spinal cord injury. Spinal Cord 2019, 57, 1057–1063. [Google Scholar] [CrossRef]
- Wang, S.; Wecht, J.M.; Ugiliweneza, B.; Legg Ditterline, B. Increased Prevalence of Blood Pressure Instability Over Twenty-Four Hours in Chronic Spinal Cord Injury. Neurotrauma. Rep. 2022, 3, 522–533. [Google Scholar] [CrossRef]
- Gater, D.R.; Farkas, G.J.; Berg, A.S.; Castillo, C. Prevalence of metabolic syndrome in veterans with spinal cord injury. J. Spinal Cord Med. 2018, 42, 86–93. [Google Scholar] [CrossRef] [PubMed]
- Adriaansen, J.J.; Douma-Haan, Y.; van Asbeck, F.W.; van Koppenhagen, C.F.; de Groot, S.; Smit, C.A.; Visser-Meily, J.M.; Post, M.W. Prevalence of hypertension and associated risk factors in people with long-term spinal cord injury living in the Netherlands. Disabil. Rehabil. 2017, 39, 919–927. [Google Scholar] [CrossRef]
- Barry, W.; St Andre, J.R.; Evans, C.T.; Sabharwal, S.; Miskevics, S.; Weaver, F.M.; Smith, B.M. Hypertension and antihypertensive treatment in veterans with spinal cord injury and disorders. Spinal Cord 2013, 51, 109–115. [Google Scholar] [CrossRef]
- Olive, J.L.; Dudley, G.A.; McCully, K.K. Vascular remodeling after spinal cord injury. Med. Sci. Sports Exerc. 2003, 35, 901–907. [Google Scholar] [CrossRef]
- West, C.R.; Alyahya, A.; Laher, I.; Krassioukov, A. Peripheral vascular function in spinal cord injury: A systematic review. Spinal Cord 2013, 51, 10–19. [Google Scholar] [CrossRef]
- Matos-Souza, J.R.; Pithon, K.R.; Ozahata, T.M.; Oliveira, R.T.; Téo, F.H.; Blotta, M.H.; Cliquet, A., Jr.; Nadruz, W., Jr. Subclinical atherosclerosis is related to injury level but not to inflammatory parameters in spinal cord injury subjects. Spinal Cord 2010, 48, 740–744. [Google Scholar] [CrossRef] [PubMed]
- Bauman, W.A.; Spungen, A.M. Carbohydrate and lipid metabolism in chronic spinal cord injury. J. Spinal Cord Med. 2001, 24, 266–277. [Google Scholar] [CrossRef]
- Bluvshtein, V.; Korczyn, A.D.; Pinhas, I.; Vered, Y.; Gelernter, I.; Catz, A. Insulin resistance in tetraplegia but not in mid-thoracic paraplegia: Is the mid-thoracic spinal cord involved in glucose regulation? Spinal Cord 2011, 49, 648–652. [Google Scholar] [CrossRef]
- Karlsson, A.K. Insulin resistance and sympathetic function in high spinal cord injury. Spinal Cord 1999, 37, 494–500. [Google Scholar] [CrossRef] [PubMed]
- Karlsson, A.K.; Attvall, S.; Jansson, P.A.; Sullivan, L.; Lönnroth, P. Influence of the sympathetic nervous system on insulin sensitivity and adipose tissue metabolism: A study in spinal cord-injured subjects. Metabolism 1995, 44, 52–58. [Google Scholar] [CrossRef]
- Ikeda, Y.; Suehiro, T.; Nakamura, T.; Kumon, Y.; Hashimoto, K. Clinical significance of the insulin resistance index as assessed by homeostasis model assessment. Endocr. J. 2001, 48, 81–86. [Google Scholar] [CrossRef] [PubMed]
- Bauman, W.A.; Spungen, A.M. Coronary heart disease in individuals with spinal cord injury: Assessment of risk factors. Spinal Cord 2008, 46, 466–476. [Google Scholar] [CrossRef]
- Koyuncu, E.; Nakipoğlu Yüzer, G.F.; Yenigün, D.; Özgirgin, N. The analysis of serum lipid levels in patients with spinal cord injury. J. Spinal Cord Med. 2017, 40, 567–572. [Google Scholar] [CrossRef]
- Demirel, S.; Demirel, G.; Tükek, T.; Erk, O.; Yilmaz, H. Risk factors for coronary heart disease in patients with spinal cord injury in Turkey. Spinal Cord 2001, 39, 134–138. [Google Scholar] [CrossRef]
- Schmid, A.; Halle, M.; Stutzle, C.; Konig, D.; Baumstark, M.W.; Storch, M.J.; Schmidt-Trucksass, A.; Lehmann, M.; Berg, A.; Keul, J. Lipoproteins and free plasma catecholamines in spinal cord injured men with different injury levels. Clin. Physiol. 2000, 20, 304–310. [Google Scholar] [CrossRef] [PubMed]
- Wang, Y.H.; Chen, S.Y.; Wang, T.D.; Hwang, B.S.; Huang, T.S.; Su, T.C. The relationships among serum glucose, albumin concentrations and carotid atherosclerosis in men with spinal cord injury. Atherosclerosis 2009, 206, 528–534. [Google Scholar] [CrossRef] [PubMed]
- Zlotolow, S.P.; Levy, E.; Bauman, W.A. The serum lipoprotein profile in veterans with paraplegia: The relationship to nutritional factors and body mass index. J. Am. Paraplegia Soc. 1992, 15, 158–162. [Google Scholar] [CrossRef]
- Liang, H.; Chen, D.; Wang, Y.; Rimmer, J.H.; Braunschweig, C.L. Different risk factor patterns for metabolic syndrome in men with spinal cord injury compared with able-bodied men despite similar prevalence rates. Arch. Phys. Med. Rehabil. 2007, 88, 1198–1204. [Google Scholar] [CrossRef]
- Heldenberg, D.; Rubinstein, A.; Levtov, O.; Werbin, B.; Tamir, I. Serum lipids and lipoprotein concentrations in young quadriplegic patients. Atherosclerosis 1981, 39, 163–167. [Google Scholar] [CrossRef]
- Bauman, W.A.; Adkins, R.H.; Spungen, A.M.; Herbert, R.; Schechter, C.; Smith, D.; Kemp, B.J.; Gambino, R.; Maloney, P.; Waters, R.L. Is immobilization associated with an abnormal lipoprotein profile? Observations from a diverse cohort. Spinal Cord 1999, 37, 485–493. [Google Scholar] [CrossRef] [PubMed]
- Bauman, W.A.; Spungen, A.M.; Zhong, Y.G.; Rothstein, J.L.; Petry, C.; Gordon, S.K. Depressed serum high density lipoprotein cholesterol levels in veterans with spinal cord injury. Paraplegia 1992, 30, 697–703. [Google Scholar] [CrossRef]
- Collins, E.G.; Gater, D.; Kiratli, B.J.; Butler, J.; Hanson, K.; Langbein, W. Energy cost of physical activities in persons with spinal cord injury. Med. Sci. Sports Exerc. 2010, 42, 691–700. [Google Scholar] [CrossRef]
- Ruiz-Ramie, J.J.; Barber, J.L.; Sarzynski, M.A. Effects of exercise on HDL functionality. Curr. Opin. Lipidol. 2019, 30, 16–23. [Google Scholar] [CrossRef]
- Muscella, A.; Stefàno, E.; Marsigliante, S. The effects of exercise training on lipid metabolism and coronary heart disease. Am. J. Physiol. Heart Circ. Physiol. 2020, 319, H76–H88. [Google Scholar] [CrossRef]
- Jeppesen, J.; Kiens, B. Regulation and limitations to fatty acid oxidation during exercise. J. Physiol. 2012, 590, 1059–1068. [Google Scholar] [CrossRef]
- Bauman, W.A.; Spungen, A.M. Disorders of carbohydrate and lipid metabolism in veterans with paraplegia or quadriplegia: A model of premature aging. Metabolism 1994, 43, 749–756. [Google Scholar] [CrossRef] [PubMed]
- Agarwala, A.; Petersen, K.S.; Jafari, F.; Kris-Etherton, P.M. Dietary management of dyslipidemia and the impact of dietary patterns on lipid disorders. Prog. Cardiovasc. Dis. 2022, 75, 49–58. [Google Scholar] [CrossRef] [PubMed]
- Farkas, G.J.; Gordon, P.S.; Swartz, A.M.; Berg, A.S.; Gater, D.R. Influence of mid and low paraplegia on cardiorespiratory fitness and energy expenditure. Spinal Cord Ser. Cases 2020, 6, 110. [Google Scholar] [CrossRef]
- Doherty, J.G.; Burns, A.S.; O’Ferrall, D.M.; Ditunno, J.F., Jr. Prevalence of upper motor neuron vs lower motor neuron lesions in complete lower thoracic and lumbar spinal cord injuries. J. Spinal Cord Med. 2002, 25, 289–292. [Google Scholar] [CrossRef]
- Gorgey, A.S.; Dudley, G.A. Spasticity may defend skeletal muscle size and composition after incomplete spinal cord injury. Spinal Cord 2008, 46, 96–102. [Google Scholar] [CrossRef] [PubMed]
- Hodgkiss, D.D.; Bhangu, G.S.; Lunny, C.; Jutzeler, C.R.; Chiou, S.Y.; Walter, M.; Lucas, S.J.E.; Krassioukov, A.V.; Nightingale, T.E. Exercise and aerobic capacity in individuals with spinal cord injury: A systematic review with meta-analysis and meta-regression. PLoS Med. 2023, 20, e1004082. [Google Scholar] [CrossRef]
- Deng, P.; Fu, Y.; Chen, M.; Wang, D.; Si, L. Temporal trends in inequalities of the burden of cardiovascular disease across 186 countries and territories. Int. J. Equity Health 2023, 22, 164. [Google Scholar] [CrossRef]
- Mensah, G.A.; Wei, G.S.; Sorlie, P.D.; Fine, L.J.; Rosenberg, Y.; Kaufmann, P.G.; Mussolino, M.E.; Hsu, L.L.; Addou, E.; Engelgau, M.M.; et al. Decline in Cardiovascular Mortality: Possible Causes and Implications. Circ. Res. 2017, 120, 366–380. [Google Scholar] [CrossRef]
- Roth, G.A.; Mensah, G.A.; Johnson, C.O.; Addolorato, G.; Ammirati, E.; Baddour, L.M.; Barengo, N.C.; Beaton, A.Z.; Benjamin, E.J.; Benziger, C.P.; et al. Global Burden of Cardiovascular Diseases and Risk Factors, 1990-2019: Update From the GBD 2019 Study. J. Am. Coll. Cardiol. 2020, 76, 2982–3021. [Google Scholar] [CrossRef]
- Aggarwal, R.; Yeh, R.W.; Joynt Maddox, K.E.; Wadhera, R.K. Cardiovascular Risk Factor Prevalence, Treatment, and Control in US Adults Aged 20 to 44 Years, 2009 to March 2020. JAMA 2023, 329, 899–909. [Google Scholar] [CrossRef]
- Gao, Y.; Isakadze, N.; Duffy, E.; Sheng, Q.; Ding, J.; MacFarlane, Z.T.; Sang, Y.; McClure, S.T.; Selvin, E.; Matsushita, K.; et al. Secular Trends in Risk Profiles Among Adults with Cardiovascular Disease in the United States. J. Am. Coll. Cardiol. 2022, 80, 126–137. [Google Scholar] [CrossRef]
- Afshin, A.; Forouzanfar, M.H.; Reitsma, M.B.; Sur, P.; Estep, K.; Lee, A.; Marczak, L.; Mokdad, A.H.; Moradi-Lakeh, M.; Naghavi, M.; et al. Health Effects of Overweight and Obesity in 195 Countries over 25 Years. N. Engl. J. Med. 2017, 377, 13–27. [Google Scholar] [CrossRef]
- Hruby, A.; Hu, F.B. The Epidemiology of Obesity: A Big Picture. Pharmacoeconomics 2015, 33, 673–689. [Google Scholar] [CrossRef]
- Reutrakul, S.; Van Cauter, E. Sleep influences on obesity, insulin resistance, and risk of type 2 diabetes. Metabolism 2018, 84, 56–66. [Google Scholar] [CrossRef]
- Young-Hyman, D.; de Groot, M.; Hill-Briggs, F.; Gonzalez, J.S.; Hood, K.; Peyrot, M. Psychosocial Care for People with Diabetes: A Position Statement of the American Diabetes Association. Diabetes Care 2016, 39, 2126–2140. [Google Scholar] [CrossRef]
- Rosengren, A.; Teo, K.; Rangarajan, S.; Kabali, C.; Khumalo, I.; Kutty, V.R.; Gupta, R.; Yusuf, R.; Iqbal, R.; Ismail, N.; et al. Psychosocial factors and obesity in 17 high-, middle- and low-income countries: The Prospective Urban Rural Epidemiologic study. Int. J. Obes. 2015, 39, 1217–1223. [Google Scholar] [CrossRef]
- Zakariah, G.; Dianna, S.; Sarah, F.; Valentina, G. Association between urbanisation and type 2 diabetes: An ecological study. BMJ Glob. Health 2017, 2, e000473. [Google Scholar] [CrossRef]
- Anekwe, C.V.; Jarrell, A.R.; Townsend, M.J.; Gaudier, G.I.; Hiserodt, J.M.; Stanford, F.C. Socioeconomics of Obesity. Curr. Obes. Rep. 2020, 9, 272–279. [Google Scholar] [CrossRef]
- Autret, K.; Bekelman, T.A. Socioeconomic Status and Obesity. J. Endocr. Soc. 2024, 8, bvae176. [Google Scholar] [CrossRef]
- Lee, A.; Cardel, M.; Donahoo, W.T. Social and Environmental Factors Influencing Obesity. In Endotext; Feingold, K.R., Anawalt, B., Blackman, M.R., Boyce, A., Chrousos, G., Corpas, E., de Herder, W.W., Dhatariya, K., Dungan, K., Hofland, J., et al., Eds.; MDText.com, Inc.: South Dartmouth, MA, USA, 2000. [Google Scholar]
- Ogden, C.L.; Lamb, M.M.; Carroll, M.D.; Flegal, K.M. Obesity and Socioeconomic Status in Adults: United States, 2005–2008; US Department of Health and Human Services, Centers for Disease Control and Prevention, National Center for Health Statistics: Washington, DC, USA, 2010; pp. 1–8.
- Volaco, A.; Cavalcanti, A.M.; Filho, R.P.; Précoma, D.B. Socioeconomic Status: The Missing Link Between Obesity and Diabetes Mellitus? Curr. Diabetes Rev. 2018, 14, 321–326. [Google Scholar] [CrossRef] [PubMed]
- Bull, F.C.; Al-Ansari, S.S.; Biddle, S.; Borodulin, K.; Buman, M.P.; Cardon, G.; Carty, C.; Chaput, J.P.; Chastin, S.; Chou, R.; et al. World Health Organization 2020 guidelines on physical activity and sedentary behaviour. Br. J. Sports Med. 2020, 54, 1451–1462. [Google Scholar] [CrossRef]
- Hu, F.B. Globalization of diabetes: The role of diet, lifestyle, and genes. Diabetes Care 2011, 34, 1249–1257. [Google Scholar] [CrossRef]
- Kopp, W. How Western Diet And Lifestyle Drive The Pandemic Of Obesity And Civilization Diseases. Diabetes Metab. Syndr. Obes. 2019, 12, 2221–2236. [Google Scholar] [CrossRef]
- Shafazand, S.; Anderson, K.D.; Nash, M.S. Sleep Complaints and Sleep Quality in Spinal Cord Injury: A Web-Based Survey. J. Clin. Sleep Med. 2019, 15, 719–724. [Google Scholar] [CrossRef]
- Sankari, A.; Bascom, A.; Oomman, S.; Badr, M.S. Sleep disordered breathing in chronic spinal cord injury. J. Clin. Sleep Med. 2014, 10, 65–72. [Google Scholar] [CrossRef]
- Budd, M.A.; Gater, D.R., Jr.; Channell, I. Psychosocial Consequences of Spinal Cord Injury: A Narrative Review. J. Pers. Med. 2022, 12, 1178. [Google Scholar] [CrossRef]
- Li, J.; Demirel, A.; Azuero, A.; Womack, E.D.; Kroeger, E.N.; McLain, A.; Yarar-Fisher, C. Limited Association between the Total Healthy Eating Index-2015 Score and Cardiovascular Risk Factors in Individuals with Long-Standing Spinal Cord Injury: An Exploratory Study: An Exploratory Study. J. Acad. Nutr. Diet. 2021, 121, 2260–2266. [Google Scholar] [CrossRef]
- Farkas, G.J.; Cunningham, P.M.; Sneij, A.M.; Hayes, J.E.; Nash, M.S.; Berg, A.S.; Gater, D.R.; Rolls, B.J. Reasons for meal termination, eating frequency, and typical meal context differ between persons with and without a spinal cord injury. Appetite 2024, 192, 107110. [Google Scholar] [CrossRef]
- Lee, H.A.; Park, H. Metabolically healthy obese individuals are still at high risk for diabetes: Application of the marginal structural model. Diabetes Obes. Metab. 2024, 26, 431–440. [Google Scholar] [CrossRef]
- Marcus, Y.; Segev, E.; Shefer, G.; Eilam, D.; Shenkerman, G.; Buch, A.; Shenhar-Tsarfaty, S.; Zeltser, D.; Shapira, I.; Berliner, S.; et al. Metabolically Healthy Obesity Is a Misnomer: Components of the Metabolic Syndrome Linearly Increase with BMI as a Function of Age and Gender. Biology 2023, 12, 719. [Google Scholar] [CrossRef] [PubMed]
- Kelly, H. The classical definition of a pandemic is not elusive. Bull. World Health Organ. 2011, 89, 540–541. [Google Scholar] [CrossRef] [PubMed]
- National Spinal Cord Injury Statistical Center. Traumatic Spinal Cord Injury Facts and Figures at a Glance: 2023 SCI Data Sheet; National Spinal Cord Injury Statistical Center: Birmingham, UK, 2023; p. 1. [Google Scholar]
- Lopez-Neyman, S.M.; Davis, K.; Zohoori, N.; Broughton, K.S.; Moore, C.E.; Miketinas, D. Racial disparities and prevalence of cardiovascular disease risk factors, cardiometabolic risk factors, and cardiovascular health metrics among US adults: NHANES 2011-2018. Sci. Rep. 2022, 12, 19475. [Google Scholar] [CrossRef] [PubMed]


| Category | Outcomes |
|---|---|
| Body Composition | Fat: total body, visceral, subcutaneous, upper limb, lower limb, intramuscular, visceral/subcutaneous ratio, and android/gynoid ratio Fat-free mass Lean body mass |
| Cardiovascular (resting) | Blood pressure: systolic and diastolic Heart rate |
| Dysglycemia/Insulin Resistance | Fasting glucose, fasting insulin, and hemoglobin A1c OGTT: glucose and insulin area under the curve, peak glucose, glucose at 120 min, and Matsuda index IVGTT: insulin sensitivity and glucose effectiveness HOMA1, HOMA2, and QUICKI |
| Lipids | Triglycerides |
| Cholesterol: total and high-density, low-density, and very low-density lipoprotein | |
| Non-esterified free fatty acids | |
| Inflammation | C-reactive protein, tumor necrosis factor-α, and interleukin-6 |
| SCI Cohort | Obesity | HTG | Low HDL-C | HTN | Dysglycemia/IR | Risk Factors | CMS |
|---|---|---|---|---|---|---|---|
| General, non-athletic | ✓ (All/♂/♀) | ✗ | ✓ (♂), ✗ (♀) | ✗ | ✓ (All) | 3 (♂), 2 (♀) | ✓ (♂) ✗ (♀) |
| Paraplegia NLOI | ✓ (All/♂/♀) | ✗ | ✓ (♂), ✗ (♀) | ✗ | ✓ (All) | 3 (♂), 2 (♀) | ✓ (♂) ✗ (♀) |
| Tetraplegia NLOI | ✓ (All/♂), Ø (♀) | ✗ | ✓ (♂), ✗ (♀) | ✗ | ✓ (All) | 3 (♂), 2 (♀) | ✓ (♂), Ø (♀) |
| Incomplete (AIS B-D) | ✓ (All), Ø (♀/♂) | ✗ | ✗ (♂), Ø (♀) | ✗ | ✓ (All) | 2 (♂), 3 (♀) | ✗ (♂), Ø (♀) |
| Complete (AIS A) | ✓ (All/♂), Ø (♀) | ✗ | ✓ (♂), Ø (♀) | ✗ | ✓ (All) | 3 (♂), 2 (♀) | ✓ (♂), Ø (♀) |
| Motor-incomplete (AIS C-D) | ✓ (All), Ø (♂/♀) | ✗ | ✗ (♂), Ø (♀) | ✗ | ✓ (All) | 2 (♂), 2 (♀) | Ø (♂), Ø (♀) |
| Motor-complete (AIS A-B) | ✓ (All/♂/♀) | ✗ | ✓ (♂), ✓ (♀) | ✗ | ✓ (All) | 3 (♂), 3 (♀) | ✓ (♂), ✓ (♀) |
| Low SLOI (<T6) | ✓ (All/♂/♀) | ✗ | ✗ (♂), Ø (♀) | ✗ | ✓ (All) | 2 (♂), 2 (♀) | ✗ (♂), Ø (♀) |
| High SLOI (≥T6) | ✓ (All/♂), Ø (♀) | ✗ | ✓ (♂), ✗ (♀) | ✗ | ✓ (All) | 3 (♂), 2 (♀) | ✓ (♂), ✗ (♀) |
| Athletes | ✓ (All/♂/♀) | ✗ | ✗ (♂), Ø (♀) | ✗ | ✓ (All) | 2 (♂), 2 (♀) | ✗ (♂), Ø (♀) |
| Asia | Australasia | Brazil | Canada | Europe | Middle East | |
|---|---|---|---|---|---|---|
| Body mass index | −3.79 (0.21, <0.001) | −1.21 (0.88, 0.171) | −1.88 (0.44, <0.001) | −0.21 (0.25, 0.395) | −1.14 (0.17, <0.001) | −1.55 (0.31, <0.001) |
| Total body fat percentage | −3.27 (1.08, 0.003) | −2.10 (1.78, 0.240) | −6.45 (1.64, <0.001) | −5.11 (0.82, <0.001) | −5.93 (1.26, <0.001) | 2.47 (4.13, 0.551) |
| Visceral fat | −743.32 (251.53, 0.007) | NA | NA | −455.64 (236.73, 0.066) | 78.5 (538.41, 0.885) | NA |
| Triglycerides | 19.85 (5.29, <0.001) | −11.22 (29.80, 0.707) | −10.29 (11.73, 0.382) | 6.98 (5.42, 0.199) | 12.27 (3.73, 0.001) | 29.7 (4.91, <0.001) |
| HDL-C | −2.23 (1.06, 0.037) | 2.03 (3.97, 0.609) | 1.46 (1.73, 0.401) | 3.42 (1.01, 0.001) | 3.49 (0.65, <0.001) | 0.01 (1.10, 0.993) |
| Systolic blood pressure | 2.74 (3.27, 0.404) | 4.17 (5.34, 0.436) | −4.96 (3.67, 0.178) | −1.02 (2.03, 0.615) | 4.36 (1.51, 0.004) | −9.34 (2.68, 0.001) |
| Diastolic blood pressure | 3.68 (2.87, 0.202) | −1.07 (4.45, 0.809) | −1.35 (3.07, 0.661) | 2.85 (1.75, 0.105) | 5.06 (1.27, 0.000) | −6.16 (2.24, 0.007) |
| Fasting glucose | −4.02 (2.54, 0.116) | 3.68 (6.18, 0.553) | −4.81 (3.36, 0.154) | −4.96 (2.24, 0.028) | −6.00 (1.79, 0.001) | −1.19 (2.37, 0.616) |
| Hemoglobin A1c | −0.19 (0.15, 0.214) | −0.34 (0.18, 0.067) | NA | −0.08 (0.11, 0.444) | −0.19 (0.10, 0.063) | NA |
| HOMA1 | −0.52 (0.45, 0.256) | −0.19 (0.84, 0.825) | −0.49 (1.18, 0.682) | −0.55 (0.59, 0.358) | −0.89 (0.42, 0.040) | 5.24 (1.20, <0.001) |
| Sample Size (n) | WMD | p-Value | 95% Bootstrap CI | I2 | Weighted Mean | Weighted SD | ||||||
|---|---|---|---|---|---|---|---|---|---|---|---|---|
| SCI | HC | Studies | Low | High | SCI | HC | SCI | HC | ||||
| Body Composition | ||||||||||||
| Body mass (kg) | 2564 | 2334 | 106 | −3.44 | <0.001 | −4.68 | −2.20 | 72.99 | 76.87 | 79.35 | 3.87 | 3.57 |
| Body mass index (kg/m2) | 3842 | 3060 | 87 | −0.84 | <0.001 | −1.26 | −0.42 | 85.96 | 24.99 | 26.24 | 2.17 | 1.97 |
| Total body fat (kg) | 703 | 884 | 19 | 6.13 | <0.001 | 4.49 | 7.78 | 79.49 | 25.94 | 18.85 | 3.10 | 2.61 |
| Total body fat (%) | 975 | 1203 | 32 | 7.89 | <0.001 | 6.80 | 8.99 | 63.62 | 32.39 | 24.95 | 2.72 | 2.66 |
| Upper limb fat (%) | 43 | 70 | 4 | 6.19 | 0.031 | 0.55 | 11.83 | 66.63 | 25.82 | 22.82 | 2.98 | 2.63 |
| Lower limb fat (%) | 43 | 70 | 4 | 16.09 | <0.001 | 12.74 | 19.44 | 7.66 | 39.89 | 27.05 | 3.13 | 2.45 |
| Total lean body mass (kg) | 405 | 411 | 18 | −11.40 | <0.001 | −13.55 | −9.24 | 86.03 | 43.79 | 54.68 | 2.44 | 2.21 |
| Total fat-free mass (kg) | 114 | 188 | 6 | −4.78 | 0.195 | −12.02 | 2.45 | 89.18 | 54.83 | 57.53 | 3.05 | 2.94 |
| Bone mineral content (kg) | 163 | 133 | 2 | −0.91 | 0.126 | −2.07 | 0.26 | 99.64 | 1.41 | 2.58 | 0.62 | 0.61 |
| Visceral fat (mL) | 324 | 282 | 5 | 439.16 | <0.001 | 206.61 | 671.71 | 97.13 | 1645.24 | 1099.34 | 28.62 | 20.14 |
| Subcutaneous fat (mL) | 281 | 246 | 4 | −171.74 | 0.196 | −432.16 | 88.67 | 85.02 | 1280.90 | 1561.83 | 27.67 | 16.98 |
| Visceral fat (%) | 134 | 59 | 2 | 3.23 | 0.220 | −1.93 | 8.39 | 62.32 | 11.57 | 6.59 | 1.96 | 1.78 |
| Visceral/subcutaneous fat ratio | 115 | 67 | 2 | 0.36 | 0.106 | −0.08 | 0.80 | 90.01 | 1.25 | 0.66 | 0.90 | 0.71 |
| Cardiovascular Health (Resting) | ||||||||||||
| Systolic blood pressure (mmHg) | 1844 | 1608 | 57 | −7.46 | <0.001 | −9.48 | −5.43 | 90.64 | 115.48 | 123.23 | 3.86 | 3.50 |
| Diastolic blood pressure (mmHg) | 1637 | 1506 | 52 | −4.51 | <0.001 | −5.90 | −3.12 | 87.39 | 71.08 | 75.38 | 3.24 | 3.03 |
| Heart rate (bpm) | 1388 | 1102 | 66 | 1.12 | 0.099 | −0.21 | 2.45 | 84.81 | 70.42 | 68.51 | 3.16 | 3.05 |
| Lipid Metabolism | ||||||||||||
| Triglycerides (mg/dL) | 2370 | 1420 | 33 | 14.53 | 0.002 | 5.51 | 23.54 | 85.32 | 118.09 | 108.50 | 8.17 | 7.12 |
| Total cholesterol (mg/dL) | 2426 | 1595 | 30 | −9.33 | <0.001 | −13.87 | −4.78 | 73.85 | 182.10 | 196.30 | 6.06 | 6.07 |
| HDL-C (mg/dL) | 2564 | 1592 | 35 | −6.37 | <0.001 | −7.58 | −5.16 | 79.83 | 41.05 | 47.47 | 3.19 | 3.31 |
| LDL-C (mg/dL) | 2371 | 1418 | 31 | −1.94 | 0.289 | −5.53 | 1.65 | 74.02 | 116.05 | 122.89 | 5.71 | 5.71 |
| VLDL-C (mg/dL) | 112 | 52 | 2 | 4.92 | 0.374 | −5.92 | 15.75 | 60.02 | 19.62 | 13.37 | 2.92 | 3.49 |
| Non-esterified fatty acids (mg/dL) | 38 | 44 | 5 | 4.14 | <0.001 | 2.93 | 5.35 | 0 | 36.47 | 31.80 | 3.49 | 4.63 |
| Carbohydrate Metabolism | ||||||||||||
| Fasting insulin (mU/L) | 694 | 506 | 22 | 1.72 | 0.004 | 0.53 | 2.90 | 84.01 | 10.20 | 9.17 | 2.68 | 2.36 |
| Fasting glucose (mg/dL) | 1122 | 1027 | 35 | −0.73 | 0.541 | −3.05 | 1.60 | 92.65 | 88.10 | 92.22 | 4.37 | 3.22 |
| Hemoglobin A1C (%) | 177 | 83 | 4 | 0.14 | 0.036 | 0.01 | 0.27 | 0.00 | 5.42 | 5.37 | 1.00 | 0.76 |
| Glucose AUC during OGTT | 44 | 25 | 2 | 106.10 | 0.230 | −67.17 | 279.37 | 88.16 | 489.61 | 576.34 | 11.13 | 10.66 |
| Insulin AUC during OGTT | 44 | 25 | 2 | 1863.52 | 0.331 | −1890.78 | 5617.82 | 94.00 | 3602.41 | 3131.56 | 42.24 | 35.66 |
| Glucose at 120 min OGTT | 148 | 98 | 4 | 35.59 | <0.001 | 22.73 | 48.45 | 73.46 | 137.68 | 97.02 | 6.74 | 4.69 |
| Matsuda Index OGTT | 32 | 30 | 2 | −2.80 | <0.001 | −3.64 | −1.96 | 0.00 | 4.10 | 6.97 | 1.25 | 2.61 |
| HOMA1 | 337 | 230 | 8 | 0.24 | 0.0178 | 0.04 | 0.44 | 38.52 | 1.84 | 1.58 | 1.10 | 0.96 |
| Inflammatory Profile | ||||||||||||
| Tumor necrosis factor-α (pg/mL) | 46 | 36 | 4 | 0.30 | 0.002 | 0.11 | 0.48 | 0 | 4.88 | 5.61 | 1.74 | 1.43 |
| Interleukin-6 (mg/mL) | 81 | 67 | 5 | 0.61 | 0.092 | −0.10 | 1.32 | 23.31 | 6.29 | 12.20 | 2.39 | 4.18 |
| C-reactive protein (mg/L) | 561 | 557 | 13 | 2.03 | <0.001 | 1.03 | 3.02 | 92.60 | 6.68 | 1.86 | 3.06 | 1.43 |
| Sample Size (n) | WMD | p-Value | 95% Bootstrap CI | I2 | Weighted Mean | Weighted SD | ||||||
|---|---|---|---|---|---|---|---|---|---|---|---|---|
| Tetra | Para | Studies | Low | High | Tetra | Para | Tetra | Para | ||||
| Body Composition | ||||||||||||
| Body mass (kg) | 960 | 1384 | 49 | −1.24 | 0.070 | −2.59 | 0.10 | 15.97 | 75.31 | 74.92 | 3.97 | 3.83 |
| Body mass index (kg/m2) | 1715 | 2349 | 49 | −0.90 | <0.001 | −1.32 | −0.47 | 53.09 | 24.80 | 25.36 | 2.19 | 2.18 |
| Total body fat (kg) | 330 | 384 | 14 | 2.80 | 0.189 | −1.38 | 6.98 | 89.44 | 27.24 | 24.68 | 3.05 | 3.07 |
| Total body fat (%) | 435 | 613 | 17 | 0.24 | 0.749 | −1.25 | 1.74 | 59.97 | 33.12 | 32.17 | 2.68 | 2.68 |
| Upper limb fat (%) | 95 | 112 | 3 | 2.18 | 0.456 | −3.55 | 7.91 | 84.79 | 28.91 | 21.21 | 3.51 | 3.16 |
| Lower limb fat (%) | 81 | 106 | 3 | 0.84 | 0.608 | −2.37 | 4.05 | 0 | 38.38 | 37.24 | 2.87 | 3.55 |
| Total lean body mass (kg) | 277 | 383 | 14 | −3.21 | <0.001 | −5.04 | −1.38 | 51.38 | 46.42 | 48.62 | 2.92 | 2.71 |
| Total fat-free mass (kg) | 103 | 119 | 6 | −4.93 | 0.310 | −14.46 | 4.60 | 92.86 | 38.81 | 45.81 | 3.13 | 3.10 |
| Android/gynoid fat (kg) | 86 | 96 | 3 | 0.10 | 0.003 | 0.03 | 0.17 | 0 | 1.69 | 1.56 | 0.76 | 0.73 |
| Bone mineral content (kg) | 149 | 144 | 5 | −0.06 | 0.561 | −0.27 | 0.15 | 65.20 | 2.08 | 2.20 | 0.71 | 0.67 |
| Visceral fat (mL) | 97 | 139 | 5 | 297.82 | 0.004 | 93.98 | 501.66 | 0 | 1773.96 | 1484.42 | 29.62 | 28.62 |
| Subcutaneous fat (mL) | 26 | 56 | 3 | −84.84 | 0.628 | −428.37 | 258.68 | 18.33 | 2267.60 | 2897.98 | 31.81 | 38.58 |
| Visceral/subcutaneous fat ratio | 26 | 56 | 3 | 0.18 | 0.059 | −0.01 | 0.36 | 0 | 0.79 | 0.61 | 0.62 | 0.63 |
| Cardiovascular Health (Resting) | ||||||||||||
| Systolic blood pressure (mmHg) | 623 | 701 | 22 | −14.34 | <0.001 | −17.34 | −11.34 | 87.77 | 110.42 | 121.01 | 3.39 | 3.40 |
| Diastolic blood pressure (mmHg) | 603 | 682 | 21 | −7.46 | <0.001 | −9.46 | −5.46 | 83.35 | 67.46 | 72.82 | 2.89 | 2.99 |
| Heart rate (bpm) | 490 | 445 | 22 | −7.80 | <0.001 | −11.02 | −4.58 | 93.03 | 68.93 | 74.88 | 2.75 | 3.00 |
| Lipid Metabolism | ||||||||||||
| Triglycerides (mg/dL) | 1038 | 1466 | 24 | −5.81 | 0.211 | −14.92 | 3.29 | 52.40 | 125.84 | 130.70 | 8.64 | 8.84 |
| Total cholesterol (mg/dL) | 1026 | 1435 | 23 | −12.51 | <0.001 | −16.81 | −8.20 | 39.70 | 175.05 | 187.29 | 6.05 | 6.22 |
| HDL-C (mg/dL) | 1038 | 1466 | 24 | −2.05 | <0.001 | −3.20 | −0.90 | 42.00 | 40.04 | 42.17 | 3.29 | 3.25 |
| LDL-C (mg/dL) | 996 | 1417 | 23 | −8.89 | <0.001 | −12.35 | −5.43 | 29.31 | 109.98 | 117.02 | 5.64 | 5.82 |
| VLDL-C (mg/dL) | 123 | 215 | 5 | 3.44 | 0.369 | −4.07 | 10.96 | 84.66 | 27.45 | 22.58 | 3.55 | 3.28 |
| Carbohydrate Metabolism | ||||||||||||
| Fasting insulin (mU/L) | 152 | 310 | 5 | 0.38 | 0.263 | −0.29 | 1.06 | 17.87 | 9.33 | 8.28 | 1.98 | 2.00 |
| Fasting glucose (mg/dL) | 473 | 783 | 13 | −0.31 | 0.674 | −1.77 | 1.15 | 8.99 | 98.95 | 95.07 | 4.76 | 4.35 |
| Hemoglobin A1C (%) | 205 | 205 | 5 | 0.12 | 0.071 | −0.01 | 0.25 | 0 | 5.54 | 5.54 | 1.06 | 0.93 |
| Insulin sensitivity (min−1/µU/mL−1 × 10−4) | 20 | 49 | 2 | −5.91 | 0.007 | −10.23 | −1.60 | 0 | 3.03 | 8.66 | 1.77 | 4.29 |
| Glucose AUC during OGTT | 13 | 32 | 2 | 132.00 | 0.012 | 29.48 | 234.52 | 35.99 | 720.08 | 536.94 | 10.50 | 10.87 |
| Insulin AUC during OGTT | 13 | 32 | 2 | 36.35 | 0.380 | −44.79 | 117.49 | 0 | 394.08 | 360.53 | 9.98 | 14.38 |
| HOMA1 | 52 | 141 | 2 | 0.17 | 0.723 | −0.75 | 1.08 | 65.80 | 2.13 | 1.61 | 1.35 | 1.14 |
| Inflammatory Profiles | ||||||||||||
| Tumor necrosis factor-α (pg/mL) | 21 | 45 | 2 | 0.10 | 0.628 | −0.31 | 0.51 | 0 | 5.57 | 7.01 | 0.90 | 0.85 |
| Interleukin-6 (mg/mL) | 50 | 168 | 4 | 0.08 | 0.833 | −0.67 | 0.83 | 0 | 4.58 | 2.95 | 2.44 | 1.47 |
| C-reactive protein (mg/L) | 119 | 209 | 5 | −0.23 | 0.428 | −0.81 | 0.34 | 4.46 | 3.27 | 5.01 | 1.73 | 2.57 |
| Sample Size | WMD | p-Value | 95% Bootstrap CI | I2 | Weighted Mean | Weighted SD | ||||||
|---|---|---|---|---|---|---|---|---|---|---|---|---|
| C | IC | Studies | Low | High | C | IC | C | IC | ||||
| Body Composition | ||||||||||||
| Body mass (kg) | 163 | 88 | 4 | 0.37 | 0.875 | −4.27 | 5.02 | 21.07 | 75.07 | 75.38 | 4.09 | 4.01 |
| Body mass index (kg/m2) | 512 | 250 | 3 | −0.53 | 0.412 | −1.79 | 0.74 | 78.93 | 24.53 | 25.50 | 1.97 | 2.07 |
| Cardiovascular Health (Resting) | ||||||||||||
| Systolic BP (mmHg) | 23 | 16 | 2 | −1.48 | 0.807 | −13.32 | 10.36 | 0 | 111.83 | 113.00 | 4.43 | 4.79 |
| Diastolic BP (mmHg) | 23 | 16 | 2 | −0.48 | 0.916 | −9.31 | 8.35 | 0 | 67.91 | 70.38 | 3.99 | 3.88 |
| Heart rate (bpm) | 18 | 18 | 2 | 5.05 | 0.194 | −2.57 | 12.66 | 32.01 | 67.67 | 61.22 | 3.36 | 2.95 |
| Sample Size (n) | WMD | p-Value | 95% Bootstrap CI | I2 | Weighted Mean | Weighted SD | ||||||
|---|---|---|---|---|---|---|---|---|---|---|---|---|
| MC | MIC | Studies | Low | High | MC | MIC | MC | MIC | ||||
| Body Composition | ||||||||||||
| Body mass (kg) | 149 | 44 | 2 | −2.92 | 0.362 | −9.22 | 3.37 | 40.65 | 75.32 | 76.01 | 4.14 | 3.95 |
| Body mass index (kg/m2) | 511 | 132 | 3 | −1.27 | 0.007 | −2.19 | −0.34 | 49.61 | 24.50 | 26.13 | 1.97 | 2.09 |
| Lipid Metabolism | ||||||||||||
| Triglycerides (mg/dL) | 371 | 96 | 2 | 0.92 | 0.928 | −18.95 | 20.79 | 18.72 | 120.10 | 126.65 | 9.40 | 10.10 |
| Total cholesterol (mg/dL) | 371 | 96 | 2 | −14.93 | 0.005 | −25.29 | −4.57 | 0 | 188.83 | 202.21 | 6.00 | 6.98 |
| HDL-C (mg/dL) | 371 | 96 | 2 | −6.10 | <0.001 | −9.36 | −2.84 | 3.79 | 41.29 | 47.07 | 3.47 | 3.64 |
| LDL-C (mg/dL) | 371 | 96 | 2 | −7.21 | 0.126 | −16.47 | 2.04 | 0 | 123.17 | 129.33 | 6.00 | 6.52 |
| Carbohydrate Metabolism | ||||||||||||
| Fasting insulin (mU/L) | 149 | 44 | 2 | −0.60 | 0.0623 | −1.24 | 0.03 | 0 | 9.28 | 9.65 | 1.10 | 1.50 |
| Fasting glucose (mg/dL) | 149 | 44 | 2 | −6.91 | 0.036 | −13.38 | −0.44 | 52.70 | 96.55 | 103.31 | 1.41 | 2.58 |
| Sample Size (n) | WMD | p-Value | 95% Bootstrap CI | I2 | Weighted Mean | Weighted SD | ||||||
|---|---|---|---|---|---|---|---|---|---|---|---|---|
| aSLOI | bSLOI | Studies | Low | High | aSLOI | bSLOI | aSLOI | bSLOI | ||||
| Body Composition | ||||||||||||
| Body mass (kg) | 422 | 275 | 17 | −1.38 | 0.219 | −3.59 | 0.82 | 0 | 74.71 | 75.80 | 4.01 | 3.93 |
| Body mass index (kg/m2) | 657 | 467 | 14 | −0.57 | 0.153 | −1.34 | 0.21 | 37.30 | 24.56 | 25.30 | 2.19 | 2.19 |
| Total body fat (kg) | 102 | 80 | 3 | −3.59 | 0.205 | −9.14 | 1.97 | 69.46 | 24.00 | 28.36 | 3.24 | 3.22 |
| Total body fat (%) | 77 | 47 | 3 | −4.45 | 0.298 | −12.84 | 3.94 | 86.84 | 22.87 | 27.83 | 2.83 | 2.81 |
| Total lean body mass (kg) | 90 | 54 | 4 | −0.69 | 0.573 | −3.08 | 1.70 | 0 | 50.46 | 49.80 | 2.70 | 2.62 |
| Cardiovascular Health (Resting) | ||||||||||||
| Systolic blood pressure (mmHg) | 282 | 193 | 10 | −16.52 | <0.001 | −21.68 | −11.36 | 62.13 | 108.71 | 125.71 | 3.99 | 4.17 |
| Diastolic blood pressure (mmHg) | 197 | 136 | 8 | −7.12 | <0.001 | −10.59 | −3.65 | 24.93 | 71.09 | 78.21 | 3.46 | 3.66 |
| Heart rate (bpm) | 202 | 113 | 10 | −5.23 | 0.085 | −11.19 | 0.73 | 74.22 | 73.51 | 76.50 | 3.58 | 3.47 |
| Lipid Metabolism | ||||||||||||
| Triglycerides (mg/dL) | 440 | 360 | 6 | −7.50 | 0.625 | −37.60 | 22.59 | 96.54 | 127.06 | 138.21 | 7.86 | 8.03 |
| Total cholesterol (mg/dL) | 440 | 360 | 6 | −9.30 | 0.024 | −17.37 | −1.24 | 73.12 | 176.92 | 185.75 | 5.61 | 5.89 |
| HDL-C (mg/dL) | 440 | 360 | 6 | −0.54 | 0.260 | −1.49 | 0.40 | 21.42 | 38.74 | 39.65 | 2.92 | 2.84 |
| LDL-C (mg/dL) | 440 | 360 | 6 | −5.14 | 0.086 | −11.01 | 0.73 | 62.56 | 110.58 | 115.45 | 5.25 | 5.42 |
| VLDL-C (mg/dL) | 52 | 52 | 2 | −2.56 | 0.321 | −7.63 | 2.50 | 0.00 | 27.70 | 30.34 | 3.32 | 3.86 |
| Carbohydrate Metabolism | ||||||||||||
| Fasting insulin (mU/L) | 165 | 130 | 3 | 0.78 | <0.001 | 0.32 | 1.24 | 0.00 | 10.02 | 8.84 | 2.29 | 1.85 |
| Fasting glucose (mg/dL) | 165 | 130 | 3 | −0.98 | 0.817 | −9.27 | 7.32 | 92.69 | 83.54 | 84.63 | 3.49 | 2.96 |
| HOMA1 | 165 | 130 | 3 | 0.21 | 0.336 | −0.22 | 0.64 | 72.96 | 1.79 | 1.52 | 1.18 | 0.84 |
| Inflammatory Profile | ||||||||||||
| C-reactive protein (mg/L) | 110 | 82 | 2 | 0.63 | 0.019 | 0.10 | 1.16 | 0.00 | 6.36 | 6.20 | 2.74 | 2.47 |
| Sample Size (n) | WMD | p-Value | 95% Bootstrap CI | I2 | Weighted Mean | Weighted SD | ||||||
|---|---|---|---|---|---|---|---|---|---|---|---|---|
| SCI | Athletes | Studies | Low | High | SCI | Athletes | SCI | Athletes | ||||
| Body Composition | ||||||||||||
| Body mass (kg) | 134 | 151 | 8 | 4.27 | 0.037 | 0.26 | 8.28 | 46.90 | 76.52 | 71.15 | 3.58 | 3.32 |
| Body mass index (kg/m2) | 177 | 189 | 8 | 1.08 | <0.001 | 0.68 | 1.48 | 23.91 | 23.85 | 22.52 | 1.63 | 1.51 |
| Total body fat (kg) | 68 | 67 | 3 | 4.84 | <0.001 | 2.41 | 7.27 | 25.42 | 21.41 | 16.40 | 2.22 | 2.40 |
| Total body fat (%) | 63 | 55 | 2 | 5.68 | 0.224 | −3.47 | 14.84 | 90.87 | 23.88 | 21.24 | 2.13 | 2.09 |
| Total fat-free mass (kg) | 59 | 58 | 2 | −0.26 | 0.931 | −6.25 | 5.73 | 65.84 | 60.16 | 58.50 | 2.99 | 2.94 |
| Cardiovascular Health (Resting) | ||||||||||||
| Systolic blood pressure (mmHg) | 121 | 135 | 7 | −3.45 | <0.001 | −4.74 | −2.16 | 0 | 107.53 | 109.14 | 3.69 | 3.44 |
| Diastolic blood pressure (mmHg) | 121 | 135 | 7 | −1.85 | 0.002 | −3.02 | −0.68 | 10.99 | 67.19 | 67.29 | 3.18 | 2.91 |
| Heart rate (bpm) | 133 | 144 | 8 | 7.63 | <0.001 | 6.73 | 8.54 | 0 | 73.93 | 67.15 | 3.52 | 2.78 |
| Lipid Metabolism | ||||||||||||
| Triglycerides (mg/dL) | 50 | 61 | 3 | 6.70 | 0.419 | −9.54 | 22.93 | 0 | 101.61 | 95.30 | 7.24 | 6.19 |
| Total cholesterol (mg/dL) | 21 | 32 | 2 | 5.53 | 0.487 | −10.06 | 21.11 | 0 | 168.79 | 159.22 | 5.67 | 5.27 |
| HDL-C (mg/dL) | 114 | 134 | 6 | −0.04 | 0.942 | −1.13 | 1.05 | 41.32 | 39.81 | 40.99 | 2.25 | 2.50 |
| LDL-C (mg/dL) | 114 | 134 | 6 | 9.90 | <0.001 | 5.44 | 14.37 | 39.03 | 108.80 | 97.58 | 4.50 | 4.29 |
| Carbohydrate Metabolism | ||||||||||||
| Fasting glucose (mg/dL) | 114 | 134 | 6 | 2.86 | <0.001 | 1.47 | 4.25 | 53.19 | 83.68 | 82.55 | 2.53 | 2.12 |
| Inflammatory Profile | ||||||||||||
| C-reactive protein (mg/L) | 63 | 78 | 3 | 2.38 | 0.253 | −1.70 | 6.46 | 97.24 | 4.26 | 1.92 | 4.15 | 4.00 |
Disclaimer/Publisher’s Note: The statements, opinions and data contained in all publications are solely those of the individual author(s) and contributor(s) and not of MDPI and/or the editor(s). MDPI and/or the editor(s) disclaim responsibility for any injury to people or property resulting from any ideas, methods, instructions or products referred to in the content. |
© 2025 by the authors. Licensee MDPI, Basel, Switzerland. This article is an open access article distributed under the terms and conditions of the Creative Commons Attribution (CC BY) license (https://creativecommons.org/licenses/by/4.0/).
Share and Cite
Farkas, G.J.; Caldera, L.J.; Hodgkiss, D.D.; Mitchell, J.R.; Pelaez, T.F.; Cusnier, M.A.; Cole, A.J.; Daniel, S.G.; Farrow, M.T.; Gee, C.M.; et al. Cardiometabolic Risk in Chronic Spinal Cord Injury: A Systematic Review with Meta-Analysis and Temporal and Geographical Trends. J. Clin. Med. 2025, 14, 2872. https://doi.org/10.3390/jcm14092872
Farkas GJ, Caldera LJ, Hodgkiss DD, Mitchell JR, Pelaez TF, Cusnier MA, Cole AJ, Daniel SG, Farrow MT, Gee CM, et al. Cardiometabolic Risk in Chronic Spinal Cord Injury: A Systematic Review with Meta-Analysis and Temporal and Geographical Trends. Journal of Clinical Medicine. 2025; 14(9):2872. https://doi.org/10.3390/jcm14092872
Chicago/Turabian StyleFarkas, Gary J., Lizeth J. Caldera, Daniel D. Hodgkiss, Jessica R. Mitchell, Thomas F. Pelaez, Maxwell A. Cusnier, Alex J. Cole, Scott G. Daniel, Matthew T. Farrow, Cameron M. Gee, and et al. 2025. "Cardiometabolic Risk in Chronic Spinal Cord Injury: A Systematic Review with Meta-Analysis and Temporal and Geographical Trends" Journal of Clinical Medicine 14, no. 9: 2872. https://doi.org/10.3390/jcm14092872
APA StyleFarkas, G. J., Caldera, L. J., Hodgkiss, D. D., Mitchell, J. R., Pelaez, T. F., Cusnier, M. A., Cole, A. J., Daniel, S. G., Farrow, M. T., Gee, C. M., Kincaid-Sharp, E. A., Green Logan, A. M., McMillan, D. W., Nightingale, T. E., Perdue, B., Portes, P., Walson, F. T., Volmrich, A. M., Reynolds, J. M., ... Berg, A. S. (2025). Cardiometabolic Risk in Chronic Spinal Cord Injury: A Systematic Review with Meta-Analysis and Temporal and Geographical Trends. Journal of Clinical Medicine, 14(9), 2872. https://doi.org/10.3390/jcm14092872