1. Introduction
Olanzapine and quetiapine belong to the second-generation of antipsychotics, the most frequently applied drugs in personality disorders. Oral bioavailability of olanzapine is 60% and the highest blood concentration after oral administration is reached within 6 h. For quetiapine, the values are 9% and 1.5 h, respectively. Both drugs give a quick healing effect and improve the patient’s emotional state and cause a smaller number of side effects than the previous generations of antipsychotics. However, due to the frequent use of polypharmacy and the high risk of side effects when maximum doses are used [
1], it is advisable to constantly monitor both side effects and drug concentrations in patients. Therapeutic drug monitoring (TDM) allows adjusting the dose of the drug to the individual needs of the patient, avoiding severe side effects or drug interactions. Indications that the treatment of antipsychotic drugs should be monitored include a lack of cooperation between the patient and the attending physician, lack or insufficiency of clinical response at normal doses, as well as in the treatment of children, adolescents, and elderly patients [
2]. However, it should be remembered that levels of the drug in the blood may vary not only according to the dose used, but also the sex, age, or weight of the patient.
Research on the relationship between drug levels in the body and the dose, weight, age, or levels of additional drugs in the system is usually conducted in the blood. It has been shown that in women, as well as in people over 60 years of age, the concentration of olanzapine in the blood is higher than in men and younger people [
3,
4,
5,
6,
7,
8,
9]. It was also noted that in smokers, the metabolism of olanzapine is faster and the drug concentration is lower than in non-smokers [
3,
4,
6,
7,
10,
11]. Moreover, olanzapine shows very high variability of its concentration in blood, reaching as much as 47% [
3,
12], which was found when serum samples were collected multiple times (up to 24) from the same person, treated with the same dose, over a period of several months.
Similarly, quetiapine shows higher drug concentrations in women than in men [
8,
9,
13,
14]. Age is another factor that prolongs its metabolism, resulting in higher quetiapine levels in individuals over 65 years of age [
8,
9,
13,
14].
The concentrations of olanzapine and quetiapine in blood also depend on the applied dose. Quetiapine has been shown to have a weak correlation between the dose and the blood concentration [
15,
16,
17,
18]. However, the quetiapine’s metabolite, N-desalkylquetiapine, is more strongly correlated with the dose than the parent compound [
15]. In patients treated with olanzapine, the drug’s concentration in blood shows a linear correlation with the applied dose [
3].
All studies on the relationships between the dose, age, or sex of the patient and olanzapine and quetiapine levels have been carried out in the blood. This approach allows us to determine the total concentration of the substance in the body of both the free and the protein-bound fraction. However, only a free fraction is responsible for the compound’s activity and is subject to metabolism. Therefore, the simultaneous use of other drugs metabolized by the same isoenzymes will be visible in the form of fluctuations in the concentration of the main metabolite of the analyzed drug. In addition, the rate of metabolism of the compound is indicated by the metabolite’s level. Both substances, free fraction and metabolite, are present in saliva. Usually, there is a correlation between the drug concentration in blood and saliva, and there is one available study that confirms it for quetiapine [
19,
20].
Blood collection is more cumbersome and requires the presence of qualified personnel. There are no problems with taking saliva. The patient may sample their saliva themselves at a specific time of day and then take it for analysis. In addition, saliva collection, which does not require needles, is much less stressful to patients who are then more frequently willing to participate in sampling. Determination of the concentration of drugs in saliva is also recommended for children. In this age group, the use of quetiapine and olanzapine is often associated with an improper dosage of drugs resulting in excessive olanzapine and insufficient quetiapine levels in the body [
21]. This may cause an increase in side effects or a lack of response to the treatment.
Given the above, the aim of the study was to determine the relationship between the concentration of the drug determined in saliva and the dose, age, and sex of patients. The results obtained will be used to assess the possibility of using saliva as a biological material, allowing to monitor the concentration of drugs in the body.
3. Results
In total, 798 saliva samples from 57 people (24 F and 33 M) were tested to determine the concentration of olanzapine and its metabolite (12 F and 20 M) and quetiapine and its metabolite (12 F and 13 M). Samples were taken once a day from people starting treatment—about 2 h after drug administration for 14 days. In the case of people regularly treated with olanzapine or quetiapine for several years, samples were taken twice a day for 14 days—15 min before administration and about 2 h after its application. The results of the research and statistical analysis are presented in
Table 2.
3.1. The Concentration of Olanzapine and N-demethyl olanzapine in Saliva
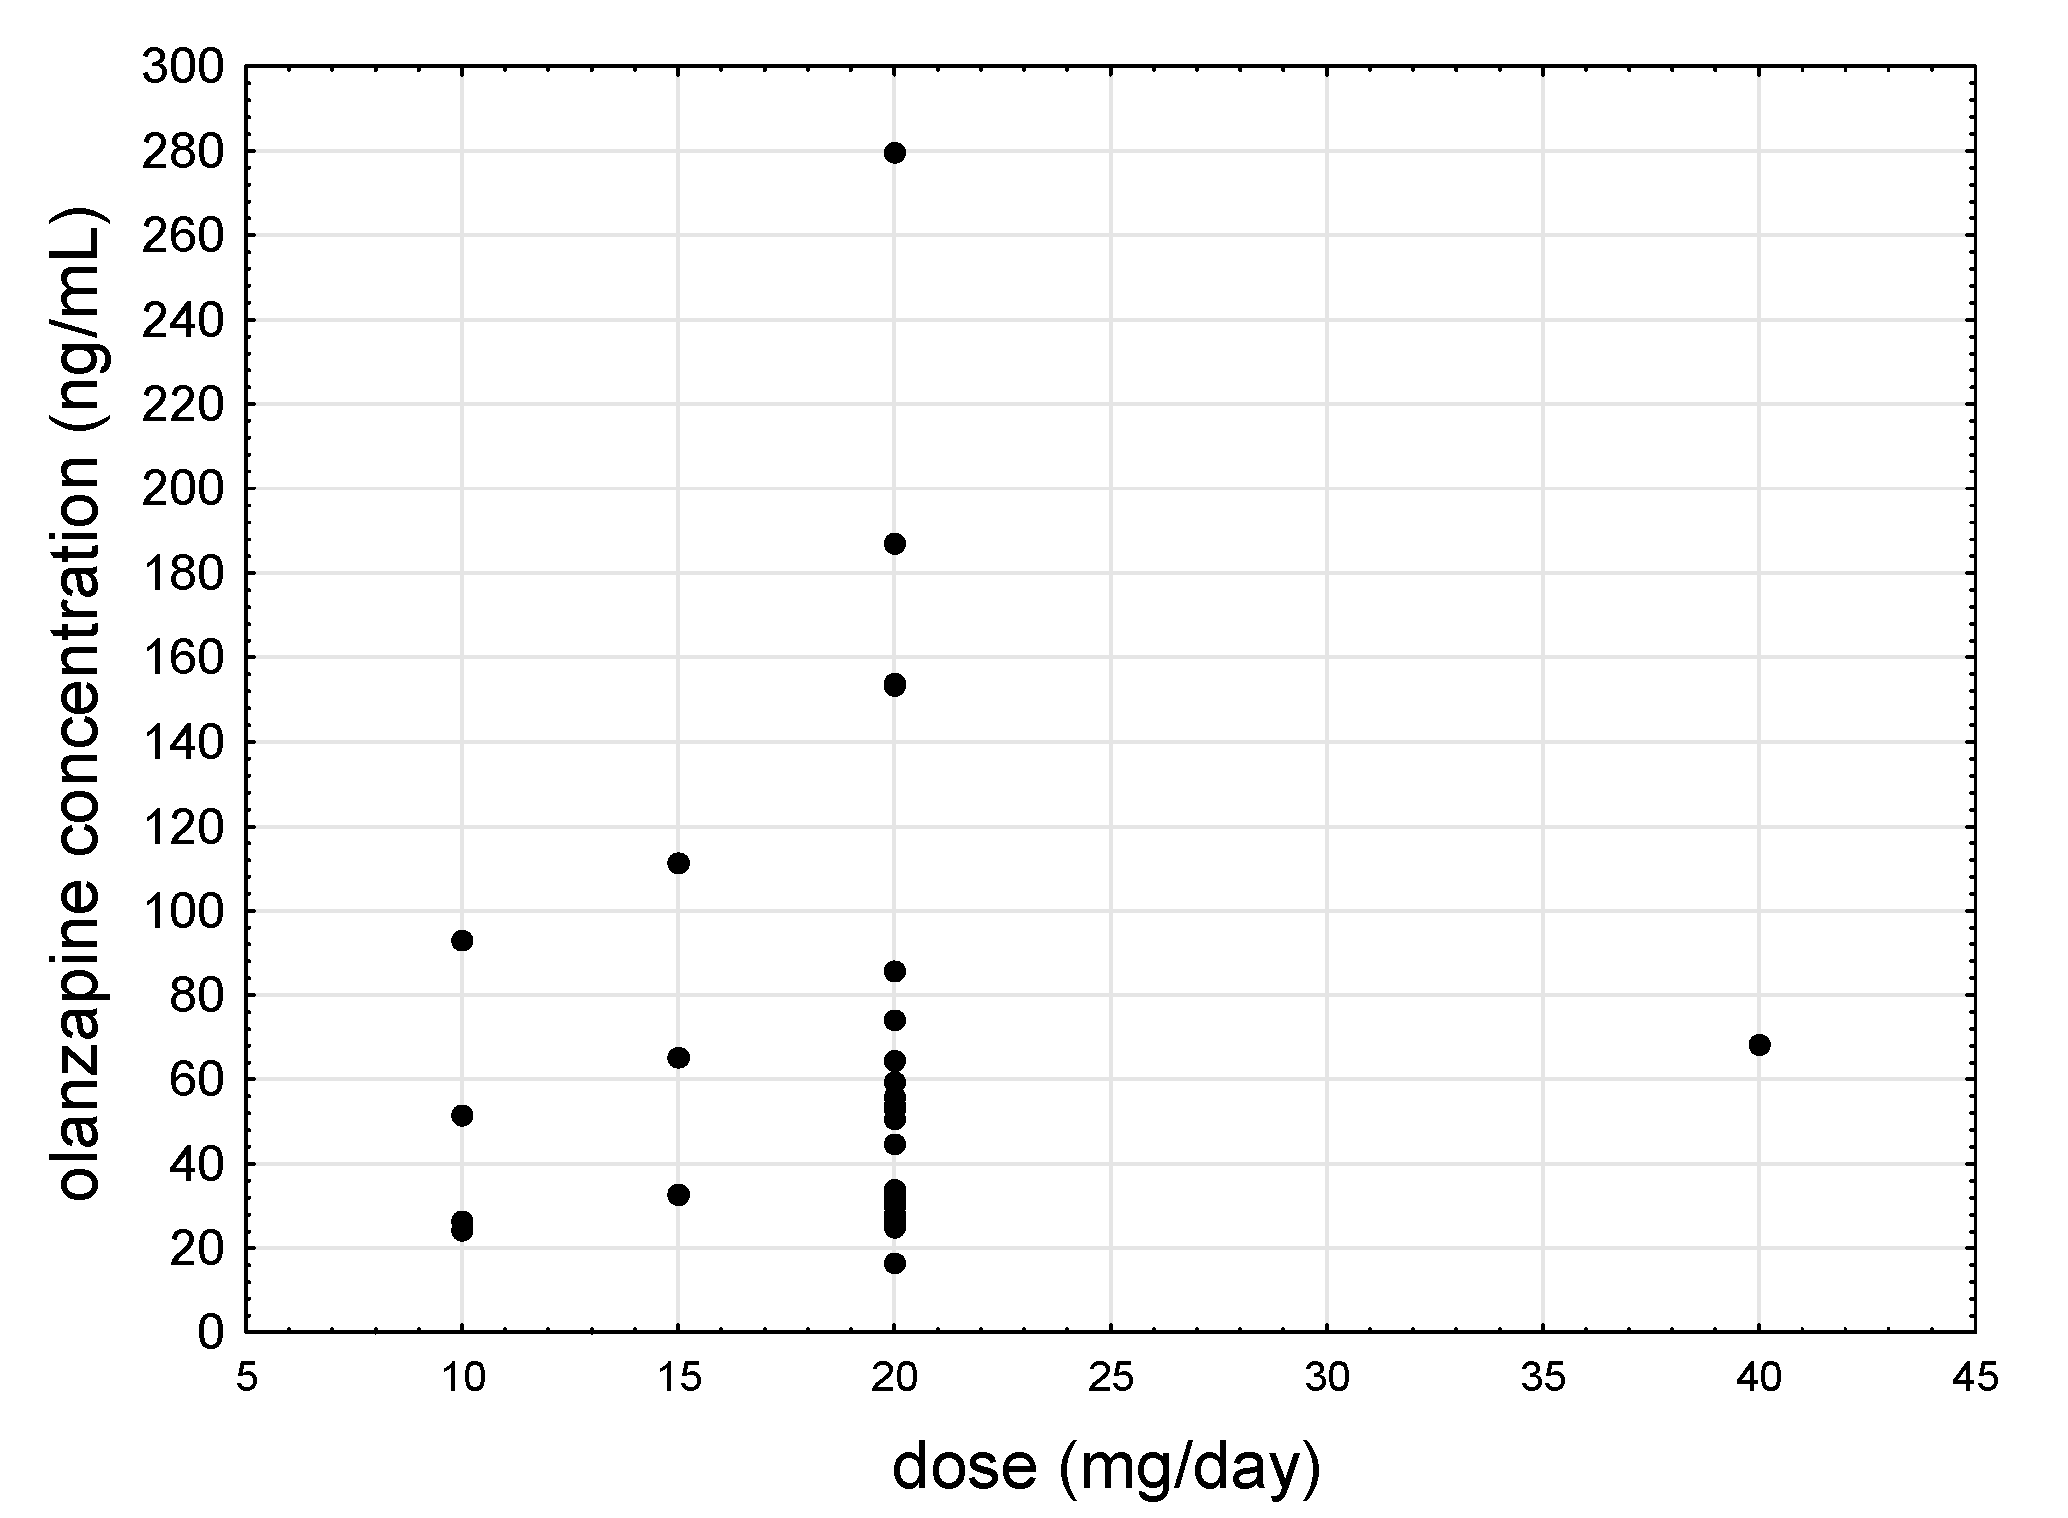
In subjects starting treatment (mean age ± SD was 52 ± 11 years), the mean concentration of olanzapine and its metabolite, N-demethyl olanzapine, (mean ± SD) was 32.3 ± 11.7 and 6.7 ± 3.7 ng/mL, respectively. In patients regularly treated with olanzapine (mean age ± SD was 54 ± 11 years), the mean concentration of the analytes in salivary samples taken 15 min before drug application was 57.9 ± 40.3 ng/mL (olanzapine) and 20.3 ± 11.8 ng/mL (N-demethyl olanzapine), and 2 h after the administration the respective levels were 112.9 ± 98.3 and 23.1 ± 16.1 ng/mL.
Figure 1 shows the relationship between the daily dose of olanzapine and saliva concentration.
3.2. Correlation between Olanzapine and N-demethyl olanzapine Concentrations and Age, Gender and Dose
Statistical analysis showed that the mean olanzapine concentration in saliva samples before drug administration were statistically significantly lower than after the drug (p < 0.05, Wilcoxon test). The differences in the levels of its metabolite, N-demethyl olanzapine, were not statistically significant.
Statistically significant differences were observed in the concentration of olanzapine between samples taken from patients starting treatment with olanzapine (in the latter group we took into account the concentrations determined after the administration of the drug) (Mann-Whitney U-test). Then, the concentration of olanzapine in the saliva of patients starting treatment and continuing in the samples taken before drug administration was compared, considering only the marked concentration of the compound. Additionally, in the case of the concentration, differences were statistically significant. A similar relationship was found when the active metabolite, N-demethyl olanzapine (p < 0.05), was determined. Dose-corrected values also showed statistically significant differences in the concentrations of both analytes between patients entering and continuing treatment.
The mean olanzapine concentration in women was statistically significantly lower than in men — 33.4 ± 11.7 compared to 86.1 ± 63.6 ng/mL (
Figure 2). The use of dose-corrected values confirmed the statistically significant difference between sexes.
Statistical analysis of olanzapine and N-demethyl olanzapine in patients over 60 years of age and 70 years of age showed no significant differences in both raw values and dose-corrected values.
On the basis of Spearman’s rank order correlation, a strong negative correlation between sex and mean concentration of olanzapine and N-demethyl olanzapine was found (r = −0.6082 and r = −0.6012). Similarly, when using dose-corrected values, the correlation was also significant (r = −0.5383 for olanzapine and r = −0.5593 for the metabolite).
The age of the patients was strongly negatively correlated with the average concentration of the olanzapine metabolite in saliva collected from patients two hours after drug administration (the group of long-time users).
The mean concentration of N-demethyl olanzapine determined in women was 9.8 ± 11.3 ng/mL, compared to 20.0 ± 9.8 ng/mL in men (
Figure 3). The Mann-Whitney U test showed significant statistical differences for dose-corrected values.
A strong positive correlation was observed between the mean concentration of olanzapine and its metabolite for the entire population (
Figure 4), r = 0.5880 and in the group starting treatment (r = 0.7091). A high positive correlation was also found between the mean olanzapine concentration (raw values) and (i) dose-corrected values of olanzapine (r = 0.8911) and (ii) dose-corrected values of its metabolite (r = 0.5469).
The mean concentration of N-demethyl olanzapine showed an additional strong positive correlation with dose-corrected values of olanzapine and N-demethyl olanzapine, r = 0.5169 and r = 0.9322, respectively.
In people entering treatment, there was a strong positive correlation between the mean concentration of olanzapine (raw values) and the dose-corrected values of olanzapine (r = 0.7273) and between the concentration of olanzapine (raw values) and N-demethyl olanzapine (r = 0.8364, respectively).
3.3. Quetiapine and Norquetiapine Concentration in Saliva
The mean quetiapine and norquetiapine levels in patients who were starting the treatment (mean age ± SD was 49 ± 7 years) were 51.8 ± 61.3 ng/mL and 25.2 ± 15.8 ng/mL, respectively. In patients who were constantly treated with quetiapine (mean age ± SD was 49 ± 11 years), the mean concentration of analytes in saliva samples taken 15 min before drug application was 110.4 ± 126.9 ng/mL for quetiapine and 54.3 ± 48.3 ng/mL for norquetiapine. Analysis of saliva samples obtained 2 h after drug administration showed the mean quetiapine level at 115.1 ± 137.8 and norquetiapine at 57.6 ± 76.9 ng/mL.
3.4. Correlation between Quetiapine and Norquetiapine Concentration and Age, Gender and Dose
Statistical analysis showed no statistically significant differences in the mean concentration of quetiapine and its metabolite between saliva samples obtained before and after drug administration (p < 0.05, Wilcoxon test). Comparing the average concentration of quetiapine in saliva samples of patients entering treatment and those continuing it, the latter group showed statistically significantly higher levels after the administration of the drug. There was no statistically significant difference for its metabolite, norquetiapine (p < 0.05). Dose-corrected values also did not show statistically significant differences in the concentrations of both analytes between patients entering and continuing treatment.
Quetiapine showed lower levels in women than in men, i.e., 50.6 ± 55.7 ng/mL vs. 123.2 ± 105.1 ng/mL (
Figure 5), although the difference was statistically significant only for raw values. For norquetiapine, whose mean concentration in women was 24.00 ng/mL ± 14.6 ng/mL and in men 61.8 ± 58.9 ng/mL (
Figure 6), the difference was not statistically significant for both raw and dose-corrected values.
The concentrations of quetiapine and norquetiapine were statistically significantly higher for people over 40 years of age in relation to those below 40.
Spearman’s rank correlation coefficient showed that mean quetiapine levels strongly positively correlated with the dose (r = 0.7568) (
Figure 7) and the mean concentration of norquetiapine (r = 0.6492) (
Figure 8). In addition, in the saliva of patients entering treatment, the average concentration of quetiapine strongly positively correlated with the average concentration of norquetiapine (r = 0.9030) and the dose of the drug used (r = 0.6138). A negative correlation was found between norquetiapine and the age of patients (r = −0.4070). Analysis of quetiapine concentration in saliva taken 15 min before drug administration showed a strong positive correlation with norquetiapine determined in the same saliva samples (r = 0.8357). In addition, norquetiapine concentration determined in samples before drug administration strongly positively correlated with the metabolite determined two hours after the administration of quetiapine (r = 0.8893). Among women, a strong positive correlation was noted between the mean concentration of quetiapine (raw values) and dose-corrected values (r = 0.6396). Among men, a strong positive correlation was observed between the raw averaged values of quetiapine (before and after administration) and the concentration of this compound in the saliva taken before drug application (r = 0.6264).
4. Discussion
As a diagnostic material, saliva can be used as an indicator of mental health. Endogenous compound levels such as cortisol and alpha-amylase may play an important role as biomarkers of stress, depression and anxiety disorders [
24]. In contrast, in patients with schizophrenia, bipolar and ADHD, genetic changes were observed in four genes [
25]. On the other hand, determination of drugs and metabolites in saliva allows for monitoring their concentration and, consequently, individualization of therapy.
Previous studies on the dependence of olanzapine or quetiapine on the dose, sex or age of patients have been conducted only through the blood. However, given the inconvenience associated with its extraction, it is advisable to look for alternative biological materials, and thus, the aim of this study was to determine the relationships between sex, patient age, drug dose and time of sampling, and the concentration of olanzapine, quetiapine and their major metabolites in saliva. The study involved the analysis of olanzapine, quetiapine and their metabolites (N-demethyl olanzapine and norquetiapine, respectively) in 798 saliva samples from both sexes.
Our results showed that olanzapine and quetiapine had lower concentrations in the saliva of women. This sex-related difference was also observed for olanzapine when using dose-corrected values—these were also lower in women. Raw levels of its metabolite, N-demethyl olanzapine, were also lower in women. However, literature data show that their blood levels are higher in women than in men [
3,
4,
5,
6,
7,
8,
9,
14,
15], which may be associated with a certain limitation of our study, where the group starting the treatment consisted solely of women, and the group of long-time users was predominantly male.
After adjusting for the dose, quetiapine levels in women did remain lower, but the differences were not statistically significant. Literature data do not indicate whether the differences in blood quetiapine levels in men and women are statistically significant, but usually the concentration in women is higher, although not in all cases [
14].
Available literature data rarely describe the analysis of olanzapine and quetiapine together with their metabolites, the level of which could indicate their rate of metabolism and possible interactions with other substances. There is only one available publication that shows that blood norquetiapine levels are not statistically significantly dependent on sex [
15].
The study also aimed to determine the relationship between patient age and analyte concentration. For olanzapine, the age of the patients affected neither the level of the parent compound nor its metabolite. Except for N-demethyl olanzapine measured in saliva taken 2 h after drug administration from patients who continued treatment. Some literature data indicate a decrease in olanzapine metabolism in patients over the age of 60 years [
3,
4,
8]. However, other authors indicate a relatively weak relationship between age and olanzapine levels [
8].
In our study, all samples came from smokers, and literature data indicate a faster metabolism of olanzapine and a lower concentration of the compound in the smokers’ body [
3,
4,
10,
11].
There is no available information in the literature on the effects of smoking on the metabolism of quetiapine. This research indicates that the concentrations of both the parent compound and metabolite were higher in the saliva of people over 40. This observation is in line with literature reports on blood levels [
8,
13].
Literature reports emphasize the high individual variability of olanzapine blood concentrations [
3,
9,
12]. This study showed a small correlation between the dose and concentration of this analyte in saliva, which can be explained by this high individual variation. At the same time, however, a high correlation was observed between the concentration of the parent compound and its metabolite, the strongest correlation being for those entering treatment (Spearman r = 0.7091). This means that the simultaneous determination of olanzapine and N-demethyl olanzapine can be used to monitor the metabolism of the parent compound in this group of patients. Analysis of olanzapine and metabolite levels in a given patient in the following days (the group entering the treatment) also showed a significant correlation between analytes, with r = 0.7 at
p < 0.05.
A comparison of saliva olanzapine levels collected 15 min before and 2 h after application of the drug show a considerable and statistically significant difference which was not observed for its metabolite, N-demethyl olanzapine. This observation is in line with literature data, which indicate the significance of time elapsed from the application of the drug to the collection of samples for the determined blood drug levels [
7].
Blood quetiapine levels are known to weakly correlate with the dose of the drug [
16,
17,
18], although Spearman’s rank correlation in our study showed a strong positive correlation between the dose and the concentrations of quetiapine and its metabolite in saliva. This strong correlation may indicate a potential benefit of determining and monitoring changes in saliva quetiapine levels. Some literature data indicate a correlation of quetiapine concentration in saliva and blood, which indicates that saliva could be used to monitor quetiapine levels and its metabolisms [
19,
21].
This study showed no strong fluctuations in analyte levels in patients continuing quetiapine treatment. Comparing the concentrations determined before and after drug administration, no statistically significant differences were noticed. However, such differences were observed between the patients entering and continuing the treatment, with the latter group showing much higher levels, which suggests that optimal and stable levels of the drug in the patient’s body can be achieved only in long-term administration. Such a relationship was not observed with norquetiapine, which may be due to faster metabolism of the parent substance compared to the metabolite, which confirms the literature report on the lower pharmacokinetic variability for blood norquetiapine levels compared to its parent compound [
14].
The study has several limitations. First of all, the patients starting the treatment are women, while the patients continuing it are mostly men. The study showed that the concentration of both drugs in saliva of women was lower. On the one hand, this shows differences in terms of sex, but also shows that the concentration in the case of people starting the treatment is lower. Therefore, in order to clarify whether the differences in the concentrations of the parent compounds are due to the effect of sex on drug metabolism or due to the duration of the treatment, the analyzed substances should be determined in the saliva of men starting treatment in the next stage of the study.
The secretory efficiency of the salivary glands as well as the antipsychotic drugs used may affect the amount of saliva secreted and its composition. At enrollment in the study, no testing for function of the salivary glands was performed. In any case, the examined patients did not show problems with dry mouth. However, if these problems arise, using cotton swabs for the sampling should be considered, as that would facilitate the process.
Another important aspect is the observation of a correlation between the concentration of quetiapine and its metabolite in saliva. The literature data indicate only a weak correlation between the measured concentration and the dose of the drug. However, the time between the administration of quetiapine and the sampling was 7 h [
16] or 10–12 h [
17], but the time when quetiapine reaches its highest concentration in the blood after oral administration is 1.5 h [
1] or even 2 h [
16]. Accordingly, a significant part of the drug was already metabolized. Sampling 2 h after drug application allowed to find the correlation between dose and concentration. Therefore, in order to confirm the obtained results, similar studies with more volunteers will be performed in the next time.
The literature data show that the highest concentration of olanzapine in the blood is reached after approximately 6 h. In this study, saliva samples were collected 15 min before and 2 h after drug administration. This slight time difference showed that even here the differences between the pre- and post-concentration were statistically significant. Determining the level of olanzapine before application and when it reaches the highest concentration in the blood may confirm statistically significant differences.
The majority of the patients were taking other medications beside olanzapine or quetiapine. However, the individual additional medications were administered to a small number of subjects, and therefore, it is not possible to draw conclusions about their effects. In addition, nursing home residents are an isolated population. This made it possible to exclude the influence of consumed food, drinks and lifestyle on the results obtained. On the other hand, all these factors should also be taken into account, which would reflect the transfer of insights to a more diverse population.


