Abstract
Background and Objective: Accurate retinal vessel segmentation is often considered to be a reliable biomarker of diagnosis and screening of various diseases, including cardiovascular diseases, diabetic, and ophthalmologic diseases. Recently, deep learning (DL) algorithms have demonstrated high performance in segmenting retinal images that may enable fast and lifesaving diagnoses. To our knowledge, there is no systematic review of the current work in this research area. Therefore, we performed a systematic review with a meta-analysis of relevant studies to quantify the performance of the DL algorithms in retinal vessel segmentation. Methods: A systematic search on EMBASE, PubMed, Google Scholar, Scopus, and Web of Science was conducted for studies that were published between 1 January 2000 and 15 January 2020. We followed the Preferred Reporting Items for Systematic Reviews and Meta-analyses (PRISMA) procedure. The DL-based study design was mandatory for a study’s inclusion. Two authors independently screened all titles and abstracts against predefined inclusion and exclusion criteria. We used the Quality Assessment of Diagnostic Accuracy Studies (QUADAS-2) tool for assessing the risk of bias and applicability. Results: Thirty-one studies were included in the systematic review; however, only 23 studies met the inclusion criteria for the meta-analysis. DL showed high performance for four publicly available databases, achieving an average area under the ROC of 0.96, 0.97, 0.96, and 0.94 on the DRIVE, STARE, CHASE_DB1, and HRF databases, respectively. The pooled sensitivity for the DRIVE, STARE, CHASE_DB1, and HRF databases was 0.77, 0.79, 0.78, and 0.81, respectively. Moreover, the pooled specificity of the DRIVE, STARE, CHASE_DB1, and HRF databases was 0.97, 0.97, 0.97, and 0.92, respectively. Conclusion: The findings of our study showed the DL algorithms had high sensitivity and specificity for segmenting the retinal vessels from digital fundus images. The future role of DL algorithms in retinal vessel segmentation is promising, especially for those countries with limited access to healthcare. More compressive studies and global efforts are mandatory for evaluating the cost-effectiveness of DL-based tools for retinal disease screening worldwide.
1. Introduction
1.1. Rationale
Visual impairment is a public health concern that has a negative impact on physical and mental health [1]. Visual impairment is associated with a high risk of chronic health conditions, including death. The prevalence and economic burden of visual impairment are exponentially increasing with an increasing number of aging populations [2]. It is estimated that the number of people with visual impairment will double by 2050 [3]. Several potential factors, such as cataract, age-related macular degeneration (AMD), diabetic retinopathy (DR), and glaucoma, are responsible for an increased risk of blindness [4,5]. This highlights the important public health burden that visual impairment and blindness place on our health care system. Therefore, the early detection and quantitative diagnosis of retinal diseases can help to develop more preventive measures, thereby reducing the number of newly diagnosed cases and the associated financial burden [6].
1.2. Solution Statement
Retinal fundus images are often used for early diagnosis of different ophthalmologic diseases, including DR and glaucoma [7]. Among various features in digital fundus images, retinal blood vessels provide useful information that is an important prerequisite for a number of clinical applications [8]. However, manual segmentation of retinal vessels by a trained human expert is time-consuming and highly variable [9,10]. The lack of human observers, infrastructure, and awareness are key challenges that need to be overcome. Over the past decades, automatic retinal vessel segmentation methods were mainly classified into two categories: supervised and unsupervised. Unsupervised methods are always dependent on threshold filter responses, handcrafted features, or other rule-based techniques. In contrast, supervised methods train a classifier to obtain discrimination between the vessel and non-vessel pixels. Recently, deep learning (DL) has achieved tremendous diagnostic performance in segmenting the retinal vessel [11,12]. The diagnostic accuracy of DL in retinal vessel segmentation has been shown to be comparable to the accuracy that was achieved by human experts. DL-based automatic systems offer potential benefits by reducing the manual work and achieving faster segmentation with reduced costs and resources. DL-based automatic tools can be incorporated into real-world screening programs that are not widely implemented or routinely practiced [13].
1.3. Goal of Investigation
Herein, we report the results of a comprehensive systematic review of DL algorithms studies that investigated the performance of DL algorithms for retinal vessel segmentation in digital fundus photographs. Our primary objective was to precisely gauge the performance of DL methods for retinal vessel segmentation from color fundus images. The evaluation of DL performance can help policymakers to understand how DL could be a clinically effective tool for segmenting retinal vessels in under-resourced areas with a severe shortage of experts and infrastructure.
2. Deep Learning (DL)
2.1. Artificial Neural Network (ANN)
ANNs are one of the main tools used in AI. ANNs are inspired by the neurons of a biological brain that is intended to mimic the way that humans learn. ANN consists of input, hidden, and output layers. The input layer is the first layer that receives inputs in the form of numbers, documents, texts, images, or audio files. The middle layer is called the hidden layer, and a single layer neural network is called a perceptron. However, it can consist of multiple layers and output single or multiple outcomes.
In Figure 1, , and represent four inputs (independent variables) to the network. Each of the four inputs is multiplied by a random weight. The weights are represented as , , , and . Weight represents the strength of each node, while b is called the bias. A bias value lets the activation function go up or down. The following output is generated in the activation function:
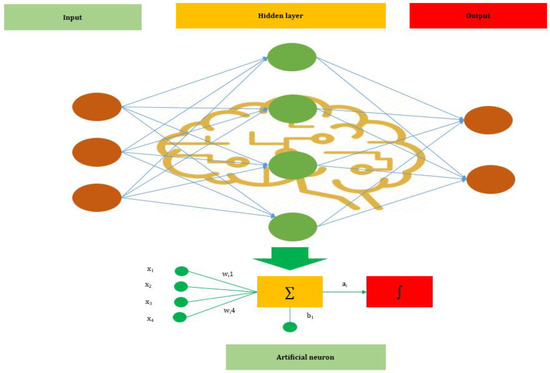
Figure 1.
The basic structure of an Artificial Neural Network (ANN).
The activation function determines where a neuron would be activated or not by the sum of weights and with the addition of the bias. The primary objective is to introduce non-linearity into the output of each neuron.
2.2. Convolutional Neural Network (CNN)
A CNN algorithm consists of several network layers, such as input, convolutional, max pooling, average pooling, and output layers. The total number of layers can be increased or decreased based on the size of the input used to train the model. Usually, a deeper network will perform better with large datasets. The advantage of using a CNN is that it does not need any feature extraction. In the CNN model, the features are automatically hierarchically extracted from the input and they are further classified using a fully connected layer. Figure 2 shows the architecture of the CNN model.
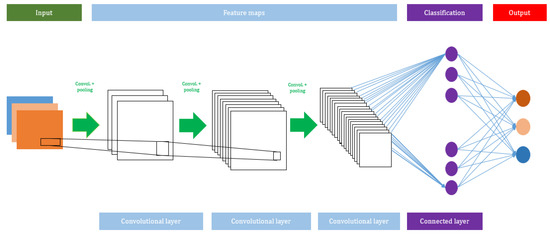
Figure 2.
A schematic view of the Convolutional Neural Network (CNN) model.
2.2.1. Convolutional Layer
The convolutional layer always utilizes a convolutional function on the given input variables, such as digital images. A filter is moved over the given input variables with a stride (which describes how many pixels a filter will be translating horizontally and vertically), and the size of the stride is usually determined by the providers. It generates feature maps and it is used as the input of the subsequent layer.
2.2.2. Activation Function
Different types of activation functions are applied in the convolutional layers. They help to create a non-linear relationship between the data and the output class.
Let layer be a non-linearity layer that takes the feature volume from a convolutional layer and generates the activation volume .
There are several types of activation functions, such as tanh, sigmoid, or ReLu, which are used to classify output variables. However, ReLu is a widely used activation function, because of its capability to reduce the exploding/vanishing gradient problem.
2.2.3. Max Pooling
A Max pooling layer is used to reduce the size of a feature. The value of the stride is selected according to the maximum value/average value (Figure 3). The maximum/average value is taken by the stride to generate a matrix. However, the output size of the layer is smaller than the previous layer.
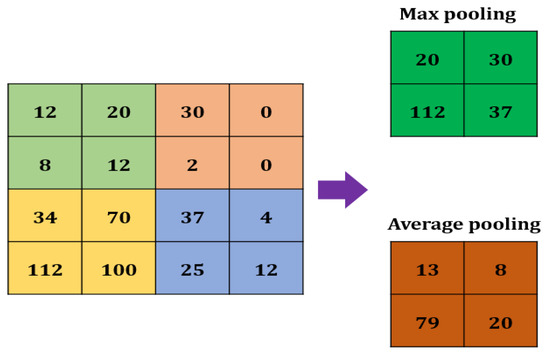
Figure 3.
Max pooling in CNN.
2.2.4. Fully Connected Layer
The neuron of the previous layer i.e., the max-pooling layer is connected to each and every neuron in this layer. The output layer of the MLP will have outputs. In the output neurons, denotes the number of the layer in the MLP (Figure 4).
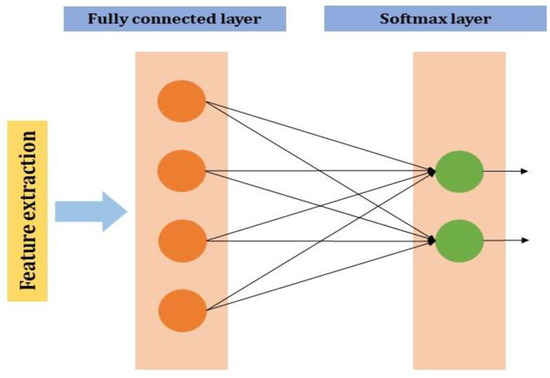
Figure 4.
Fully connected layer in CNN.
If is a fully connected layer;
2.3. Retinal Image Processing
The retinal vessel structure is compounded, and there are always immense differences between the vessels in various local areas in terms of size, shape, and intensity [14]. Thus, it is very difficult to build a model that can explain the compounded vessel structure. Some features are similar in shape and intensity with vessels (e.g., striped hemorrhage). Moreover, micro-vessels are very thin, and the width of the vessels varies (from one to several pixels), depending on the sizes and image resolutions. Therefore, it is challenging to differentiate retinal vessels from other similar features or noises. Multiple methods that were developed using vector geometry, image filters, and machine learning techniques have been used to generate the low-level feature vectors, which can detect the vessels [15,16]. The performance of these models sometimes relied on high-quality image features or heuristic presumptions. However, these traditional methods did not utilize generalized learning patterns to create feature vectors. Recently, deep learning algorithms have been used in retinal vessel segmentation, due to their ability to higher-level abstractions from diverse data by using multiple layers. Retinal vessel segmentation is conducted through pixel-wise processing. Vessel segmentation is considered to b a pixel-wise binary classification problem (vessel pixel versus non-vessel pixel). The CNN model with multiple layers differentiates images by analyzing them pixel by pixel, without considering the whole structure of the retinal vasculature [17]. The CNN model also combines multi-level features to provide higher segmentation performance. It can produce a vessel probability map while using the same size retinal images and a single forward propagation process.
3. Methods
3.1. Research Design
The Preferred Reporting Items for Systematic Reviews and Meta-Analyses (PRISMA), which is based on the Cochrane’s Handbook for Systematic Reviews, was used to conduct the current study [18,19]. A review of the written protocol was drafted (Supplementary Table S1). The process of this study is given below:
3.2. Search Methods for Identification of Studies
3.2.1. Electronic Database Search
We systematically searched in the widely used search engines, namely EMBASE, PubMed, Google Scholar, Scopus, and Web of Science, to obtain potentially relevant studies that were published between 1 January 2000 and 15 January 2020, using the most appropriate free keywords (“Retinal vessel segmentation” or “Retinal blood segmentation” and (“Deep learning” or “DL” or “Convolutional neural network” or “CNN”, or “Deep neural network”, or “Automated technique”, or “Artificial intelligence”) (Figure 5).
Figure 5.
Search terms.
3.2.2. Searching for Other Sources
We also carefully searched the bibliography of obtained studies that we deemed to be eligible and relevant previous review studies for additional study inclusion.
3.3. Eligibility Criteria
Eligibility was restricted to studies that examined the performance of DL algorithms for retinal vessel segmentation while using digital images. Studies were included if they fulfilled the following inclusion criteria: (1) published in English, (2) provided an outcome of DL algorithms and retinal vessel segmentation, (3) provided information on any of the evaluation metrics, such as accuracy, the area under receiver operating curve, sensitivity, or specificity, (4) provided clear information about the image database and the number of images, (5) provided a clear definition of retinal vessel segmentation, and (6) clearly described the DL algorithms and process used in the retinal vessel segmentation.
Studies were excluded if they were published in the form of a review, editorial, research letter, letter to editor, or short communication.
3.4. Selection Process
Two authors (MMI, TNP) independently screened all of the titles and abstracts of previously obtained studies for inclusion in our systematic review and meta-analysis. They selected relevant studies that are based on the predefined selection criteria. Any disagreement at this stage was resolved by discussion with a prior agreement; any unsettled conflict was finally settled by discussion with the chief investigator (YC, L).
The same two authors used data collection forms to extract the relevant information from the previously obtained studies. MMI and TNP then assessed the obtained studies for duplication by comparing the publication date, author name, journal name, and sample sizes. Any duplicated study was excluded.
3.5. Data Extraction
The primary outcome measures were AUROC, sensitivity, and specificity of the performance of the DL algorithms for retinal vessel segmentation. We also recorded the total number of images used in the training and testing set. We also recorded data regarding the true positive, true negative, false positive, and false negative rate. Other data of interest included general information: author name, publication year, location, sensitivity, specificity, accuracy, AUROC, DL model, camera information, image pixels, and database.
3.6. Assessment of Bias Risk
Systematic reviews with meta-analysis of diagnostic studies might have heterogeneous findings due to differences in their study design [20]. Therefore, MMI and TNP independently utilized the Quality Assessment of Diagnostic Accuracy Studies-2 (QUADAS-2) tool for assessing the quality of the included diagnostic studies. The QUADAS-2 scale [21] comprises four domains: patient selection, index test, reference standard, and flow and timing. The first three domains are used for evaluating the risk of bias in terms of concerns regarding applicability. The overall risk of bias was categorized into three groups (low, high, and unclear risk bias) (Supplementary Table S2).
3.7. Statistical Analysis
The Meta-Disc (Version: 1.4, U. de Bioestadística, Madrid (España)) software was used to calculate the evaluation metrics, such as AUROC, sensitivity, specificity, and diagnostic odds ratio. The Meta-Disc was used to (a) perform statistical pooling from each individual study, (b) assess the homogeneity with a variety of statistics, including chi-square and I-squared. Six evaluation criteria were developed, including the area under the ROC (AUROC) curve, sensitivity (SN), specificity (SP), positive likelihood ratio (LR+), negative likelihood ratio (LR−), and diagnostic odds ratio.
The value of the AUROC curve ≥90, <0.90, <0.80, <0.70, and <0.60 were considered to be excellent, good, fair, poor, and failed, respectively. An I2 value was calculated to assess the statistical heterogeneity among the included studies. An I2 value of 0∼25%, 25∼50%, 50∼75%, and >75% were considered as very low, low, medium, and high heterogeneity, respectively [7]. The value of I2 was computed, as follows:
Here, = Cochrane’s heterogeneity statistic and = degree of freedom. Negative values of are considered as zero; the value is between 0% (no observed heterogeneity) and 100% (maximum heterogeneity). It allows for calculating the AUC and Q* index, along with their standard errors.
The SE, SP, LR+, LR−, and diagnostic odds ratio are defined, as follows:
where TP = Vessel pixels classified correctly, FN = Vessel pixels misclassified as non-vessel pixels, TN = Non-vessel pixels classified correctly, and FP = Non-vessel pixels misclassified as vessel pixels. The diagnostic odds ratio (DOR) was also computed for assessing how much greater the odds of having DR are for the people with a positive test result than for the people with a negative test result. DOR is calculated by the following equation,
The likelihood ratios were calculated to express how much more frequent the respective finding is among the individuals with DR than among the individuals without DR.
The pooled AUROC was plotted with the SE versus (1 − SP) by varying the threshold. The perfect classifier achieved an AUC value that was equal to 1.
4. Results
4.1. Study Screening
Our initial studies search of the five search engines yielded 2637 studies. 2520 studies were excluded because of duplication, and 82 out of 117 studies were excluded after reviewing the titles and abstracts that were based on our pre-specified inclusion criteria. We then reviewed the remaining 35 full-text studies and checked their reference lists for further relevant studies. However, we did not find any additional potential study. Three more studies were excluded for insufficient data, and one study was excluded because it was a review. Consequently, we included the remaining 31 studies for this systematic review and meta-analysis [11,12,13,22,23,24,25,26,27,28,29,30,31,32,33,34,35,36,37,38,39,40,41,42,43,44,45,46,47,48,49]. Figure 6 presents the flow diagram of the systematic studies search.
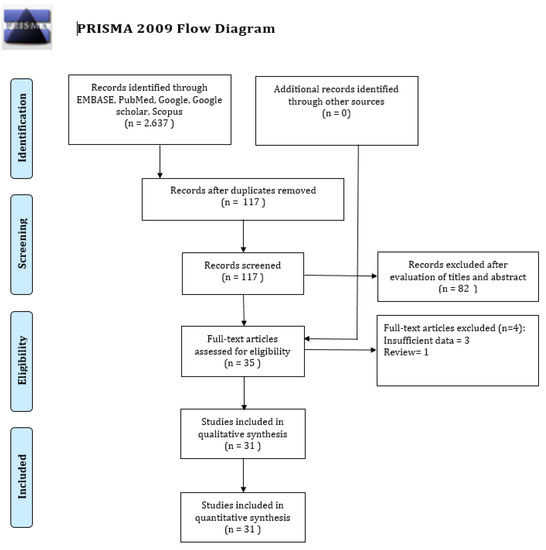
Figure 6.
PRISMA (Preferred Reporting Items for Systematic Reviews and Meta-Analyses) flow diagram for study selection.
4.2. Study Characteristics
Table 1 presents a total of 31 studies that evaluated the performance of DL algorithms for retinal vessel segmentation. The publication years ranged from 2015 to 2019. All of the studies used DL algorithms, like CNN, MResU-Net, or U-Net, for retinal vessel segmentation. The range of accuracy and AUROC was between 0.85 and 0.99. Seven types of publicly available databases, such as DRIVE, STARE, CHASEDB1, HRF, TONGREN, DRIONS, and REVIEW, were used in their studies (Table 2). The REVIEW database only had 16 images and the DRIONS database had a maximum number of 110 images. Each image had pixel-level vessel annotation provided by experts, and ground truth was used for image annotation (Figure 7).

Table 1.
Characteristic of included studies.
Table 2.
Description of databases.
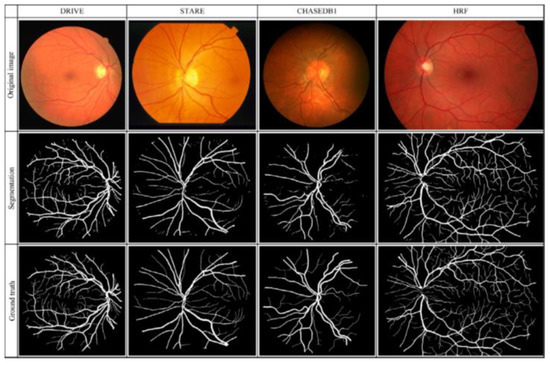
Figure 7.
Original retinal, segmentation, and ground truth images in the four different databases.
4.3. Deep Learning Performance in Retinal Vessel Segmentation
The summary estimate for the retinal vessel segmentation sensitivity of DL systems was 0.77 (95% CI: 0.77–0.77) and the specificity was 0.97 (95%CI, 0.97–0.97) based on the 23 studies that utilized the DRIVE data set (Table 3). The summarized AUROC was 0.96 (Figure 8).
Table 3.
Summary Estimates of DL performance in retinal vessel segmentation.
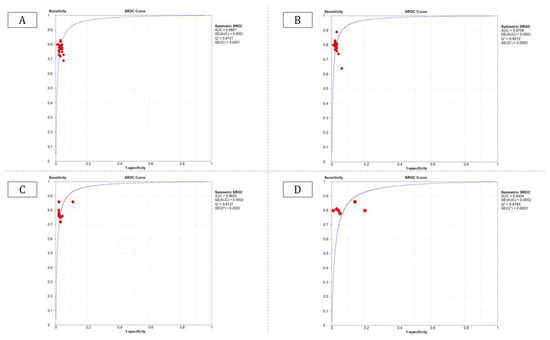
Figure 8.
Summarized ROC curve of deep learning (DL) algorithms (A) DRIVE, (B) STARE, (C) CHASE_DB1, and (D) HRF.
The 18 studies that used the STARE data sets had significantly higher sensitivity but the same specificity as the DRIVE data set. The summarized AUROC was 0.97, and the pooled sensitivity and specificity were 0.79 (95% CI: 0.79–0.79) and 0.97 (95%CI, 0.97–0.97), respectively (Figure 9). The 10 studies that used the CHASEDB1 data set for evaluating the performance of DL in retinal vessel segmentation had a summarized AUROC of 0.96, and the pooled sensitivity and specificity were 0.78 (95%CI, 0.78–0.78) and 0.97 (95%CI, 0.97–0.97), respectively (Figure 10). Furthermore, six studies that used the HRF data set to assess the performance of DL in retinal vessel segmentation had a summarized AUROC of 0.94, and the pooled sensitivity and specificity were 0.81 (95%CI, 0.81–0.81) and 0.92 (95%CI, 0.92–0.92) (Table 3), respectively (Supplementary Figure F1-F4).
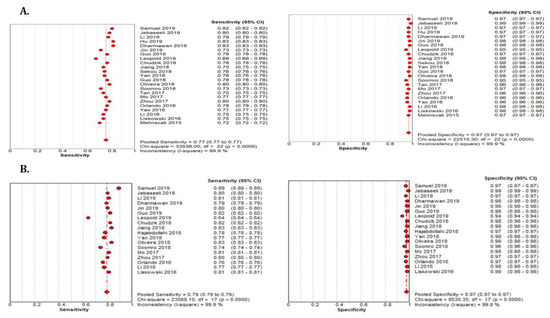
Figure 9.
Performance of the DL model retinal vessel segmentation (A) pooled sensitivity and specificity of DRIVE dataset (B) pooled sensitivity and specificity of the STARE dataset.
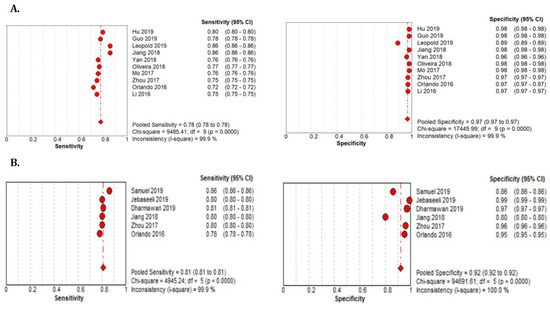
Figure 10.
Performance of the DL model retinal vessel segmentation (A) pooled sensitivity and specificity of CHASEDB1 dataset (B) pooled sensitivity and specificity of the HRF dataset.
4.4. Performance Comparison for Models in the Different Databases
Table 4 provides the performance of the unsupervised models that were proposed in the literature in relations of the typical incoherency measurements.
Table 4.
Performance comparison with unsupervised methods for retinal vessel segmentation.
5. Discussion
5.1. Principal Findings
This systematic review with meta-analysis assessed the performance of the automated DL algorithms for retinal vessel segmentation from fundus retinal images. Our key findings are: (a) DL algorithms showed great performance when they assessed images that were available from four publicly available databases in terms of sensitivity and specificity; and, (b) the performance of DL was comparable to that of human experts (Table 3). Our findings suggest that the application of DL-based tools for retinal vessel segmentation could provide a substitute solution for eye screening, especially in clinical settings with a limited number of ophthalmologists and a scarcity of resources. The implementation of AI screening tools in real-world clinical settings can speed up the screening process, reduce cost, and improve patients care, since the performances of DL-based tools and human graders were similar.
5.2. Research and Clinical Implications
Automatic segmentation of retinal vessels is one of the most important elements in precision treatment dealing with huge datasets of retinal images. Manual segmentation is time-consuming and complex due to its structure and variability across human graders [41,53]. The automatic tool is clinically effective in segmenting retinal images, and identification might improve accurate diagnosis by non-retinal experts; therefore, the application of automatic tools to analysis of retinal images could provide an alternative solution for large-scale fundus images screening, especially in areas with limited access to ophthalmologic experts [6]. However, the automatic segmentation of retinal images is not an easy task, and several factors, including light exposure, camera focus, motion artifact, and existing diseases, can hamper the image quality [54,55,56]. These potential factors are often responsible for inhomogeneous image quality and, thus, hamper vessel segmentation. Accordingly, extensive efforts have been made to segment retinal vessels automatically while using machine learning techniques, but failed to show superior performance over human graders.
The DL algorithms have shown promising performance comparable to expert segmentation in fundus images [28,38]. The most unique advantage of DL is the ability to precisely learn and capture a huge amount of image features with varying hierarchies and locations. It has the great ability to optimally integrate these features to obtain a desirable finding. The results of our study show that the DL algorithms were able to segment retinal vessels with performances that were comparable to that of human experts. The accurate segmentation of retinal vessels assists in making appropriate clinical decisions. It will help for screening high-risk patients that need to receive proper treatment, such as retinopathy, whereas accurate segmentation can guide retinal disease management. DL-based automatic tools in retinal vessel segmentation could markedly change how retinal disease diagnosis and management is conducted in the near future. Automatic segmentation of retinal vessels could become popular in an era where fast, accurate, and low-cost treatment is recommended [40]. It would be particularly helpful for ophthalmologists who are not trained experts in retinal image identification. It would also assist experienced eye specialists to make a decision quicker and more accurately. Precise risk stratification for eye disease treatment, such as glaucoma, DR, would become possible. However, high quality of the image database is a prerequisite for successfully implementing DL-based automatic tools into retinal vessel segmentation.
5.3. Strengths and Limitations
Our study has several strengths that need to be addressed. First, this is the first systematic review and meta-analysis that addressed DL performance in retinal vessels detection. Second, this study included a total of 31 studies that had used seven different databases to assess the performance of DL. Our results indicate that DL has immense potential to improve care. Third, we have compared the DL performance with the performance of human experts and other types of unsupervised methods. Our study also has some limitations. First, more than two-thirds of the included studies used the same three databases (namely, DRIVE, STARE, HRF); therefore, we cannot generalize our results as much as if more databases had been involved in our meta-analysis. However, some studies used the remaining four databases and achieved similar performances. Second, we did not include any study that evaluated a machine learning model to assess retinal vessels detection. Third, inherited retinal degeneration diseases are genetically heterogeneous. Therefore, changes in retinal vessels in fundus images could be different between patients with the same retinal diseases, and the performance of deep learning could vary. However, a robust design and a trained CNN model or novel post-processing can solve this problem.
6. Conclusions
Our current study findings show that DL algorithms achieved clinically acceptable performances in retinal vessel segmentation. The implementation of DL-based tools in retinal vessel segmentation can reduce manpower, the cost of retinal vessel screening, and resolve the problem of intra-grader and inter-grader variability. In the near future, DL techniques may play a significant role in determining ophthalmological diseases and predicting the prognosis for eye disease patients in an individualized manner. More careful, comprehensive designs and planning are needed in order to expedite this process.
Supplementary Materials
The following are available online at https://www.mdpi.com/2077-0383/9/4/1018/s1. Table S1: PRISMA 2009 Checklist; Table S2: Quality Assessment of Diagnostic Accuracy Studies-2 for Included Studies; Supplementary Figure F1-F4: Performance of DL in Retinal Vessel Segmentation:
Author Contributions
M.M.I., T.N.P., H.C.Y. and Y.-C.L. conceived the idea for and designed the study, supervised the study intervention, and revised drafts of article; M.M.I. designed the study, analyzed the data, interpreted the data, wrote the first draft, and revised the article; T.N.P. designed the study, analyzed the data, performed the statistical analysis, interpreted the data, and revised the article. B.A.W. proofread the study. All authors have read and agreed to the published version of the manuscript.
Funding
This research is granted in part by the Ministry of Education (MOE) under grant MOE 108-6604-001-400 and Ministry of Science and Technology (MOST) under grant MOST 109-2222-E-038-002-MY2.
Acknowledgments
We want to thank our colleagues who are native English speakers for editing our manuscripts.
Conflicts of Interest
The authors declare no conflict of interest.
Ethical Approval
All procedures were in accordance with the ethical standards of the institutional and national committee on human experimentation and with the 1964 Helsinki Declaration. There was no interaction with patients directly, as we acquired data from already published studies.
References
- Tsai, S.-Y.; Cheng, C.-Y.; Hsu, W.-M.; Su, T.; Liu, J.-H.; Chou, P. Association between visual impairment and depression in the elderly. J. Formos. Med. Assoc. 2003, 102, 86–90. [Google Scholar] [PubMed]
- Rein, D.B.; Wittenborn, J.S.; Zhang, X.; Honeycutt, A.A.; Lesesne, S.B.; Saaddine, J. Forecasting age-related macular degeneration through the year 2050: The potential impact of new treatments. Arch. Ophthalmol. 2009, 127, 533–540. [Google Scholar] [CrossRef] [PubMed]
- Varma, R.; Vajaranant, T.S.; Burkemper, B.; Wu, S.; Torres, M.; Hsu, C.; Choudhury, F.; McKean-Cowdin, R. Visual impairment and blindness in adults in the United States: Demographic and geographic variations from 2015 to 2050. JAMA Ophthalmol. 2016, 134, 802–809. [Google Scholar] [CrossRef] [PubMed]
- Le, A.; Mukesh, B.N.; McCarty, C.A.; Taylor, H.R. Risk factors associated with the incidence of open-angle glaucoma: The visual impairment project. Invest. Ophthalmol. Vis. Sci. 2003, 44, 3783–3789. [Google Scholar] [CrossRef] [PubMed]
- Bailey, R.; Indian, R.; Zhang, X.; Geiss, L.; Duenas, M.; Saaddine, J.B. Visual impairment and eye care among older adults-five States, 2005. MMWR. Morb. Mortal. Wkly. Rep. 2006, 55, 1321–1325. [Google Scholar]
- Guo, Y.; Budak, Ü.; Vespa, L.J.; Khorasani, E.; Şengür, A. A retinal vessel detection approach using convolution neural network with reinforcement sample learning strategy. Measurement 2018, 125, 586–591. [Google Scholar] [CrossRef]
- Islam, M.M.; Yang, H.-C.; Poly, T.N.; Jian, W.-S.; Li, Y.-C.J. Deep Learning Algorithms for Detection of Diabetic Retinopathy in Retinal Fundus Photographs: A Systematic Review and Meta-Analysis. Comput. Methods Programs Biomed. 2020, 105320. [Google Scholar] [CrossRef]
- Miri, M.; Amini, Z.; Rabbani, H.; Kafieh, R. A comprehensive study of retinal vessel classification methods in fundus images. J. Med Signals Sens. 2017, 7, 59. [Google Scholar]
- Xiao, S.; Bucher, F.; Wu, Y.; Rokem, A.; Lee, C.S.; Marra, K.V.; Fallon, R.; Diaz-Aguilar, S.; Aguilar, E.; Friedlander, M. Fully automated, deep learning segmentation of oxygen-induced retinopathy images. JCI Insight 2017, 2. [Google Scholar] [CrossRef]
- Memari, N.; Ramli, A.R.; Saripan, M.I.B.; Mashohor, S.; Moghbel, M. Retinal Blood Vessel Segmentation by Using Matched Filtering and Fuzzy C-means Clustering with Integrated Level Set Method for Diabetic Retinopathy Assessment. J. Med Biol. Eng. 2019, 39, 713–731. [Google Scholar] [CrossRef]
- Fu, H.; Xu, Y.; Lin, S.; Wong, D.W.K.; Liu, J. Deepvessel: Retinal vessel segmentation via deep learning and conditional random field. In International Conference on Medical Image Computing and Computer-Assisted Intervention; Springer: Cham, Germany, 2016; pp. 132–139. [Google Scholar]
- Melinščak, M.; Prentašić, P.; Lončarić, S. Retinal vessel segmentation using deep neural networks. In Proceedings of the 10th International Conference on Computer Vision Theory and Applications (VISAPP 2015), Berlin, Germany, 11–14 March 2015. [Google Scholar]
- Dasgupta, A.; Singh, S. A fully convolutional neural network based structured prediction approach towards the retinal vessel segmentation. In Proceedings of the 2017 IEEE 14th International Symposium on Biomedical Imaging (ISBI 2017), Melbourne, Australia, 18–21 April 2017; pp. 248–251. [Google Scholar]
- Kirbas, C.; Quek, F. A review of vessel extraction techniques and algorithms. ACM Comput. Surv. (CSUR) 2004, 36, 81–121. [Google Scholar] [CrossRef]
- Patton, N.; Aslam, T.M.; MacGillivray, T.; Deary, I.J.; Dhillon, B.; Eikelboom, R.H.; Yogesan, K.; Constable, I.J. Retinal image analysis: Concepts, applications and potential. Prog. Retin. Eye Res. 2006, 25, 99–127. [Google Scholar] [CrossRef] [PubMed]
- Abramoff, M.; Garvin, M.; Sonka, M. Retinal imaging and image analysis. IEEE Rev. Biomed. Eng. 2010, 3, 169–208. [Google Scholar] [CrossRef] [PubMed]
- Vega, R.; Sanchez-Ante, G.; Falcon-Morales, L.E.; Sossa, H.; Guevara, E. Retinal vessel extraction using lattice neural networks with dendritic processing. Comput. Biol. Med. 2015, 58, 20–30. [Google Scholar] [CrossRef]
- Suh, C.H.; Park, S.H. Successful publication of systematic review and meta-analysis of studies evaluating diagnostic test accuracy. Korean J. Radiol. 2016, 17, 5–6. [Google Scholar] [CrossRef]
- DerSimonian, R.; Laird, N. Meta-analysis in clinical trials. Control. Clin. Trials 1986, 7, 177–188. [Google Scholar] [CrossRef]
- Islam, M.M.; Nasrin, T.; Walther, B.A.; Wu, C.-C.; Yang, H.-C.; Li, Y.-C. Prediction of sepsis patients using machine learning approach: A meta-analysis. Comput. Methods Programs Biomed. 2019, 170, 1–9. [Google Scholar] [CrossRef]
- Whiting, P.F.; Rutjes, A.W.; Westwood, M.E.; Mallett, S.; Deeks, J.J.; Reitsma, J.B.; Leeflang, M.M.; Sterne, J.A.; Bossuyt, P.M. QUADAS-2: A revised tool for the quality assessment of diagnostic accuracy studies. Ann. Intern. Med. 2011, 155, 529–536. [Google Scholar] [CrossRef]
- Samuel, P.M.; Veeramalai, T. Multilevel and Multiscale Deep Neural Network for Retinal Blood Vessel Segmentation. Symmetry 2019, 11, 946. [Google Scholar] [CrossRef]
- Jebaseeli, T.J.; Durai, C.A.D.; Peter, J.D. Retinal blood vessel segmentation from diabetic retinopathy images using tandem PCNN model and deep learning based SVM. Optik 2019, 199, 163328. [Google Scholar] [CrossRef]
- Li, D.; Dharmawan, D.A.; Ng, B.P.; Rahardja, S. Residual U-Net for Retinal Vessel Segmentation. In Proceedings of the 2019 IEEE International Conference on Image Processing (ICIP), Taipei, Taiwan, 22–25 September 2019; pp. 1425–1429. [Google Scholar]
- Hu, J.; Wang, H.; Gao, S.; Bao, M.; Liu, T.; Wang, Y.; Zhang, J. S-UNet: A Bridge-Style U-Net Framework With a Saliency Mechanism for Retinal Vessel Segmentation. IEEE Access 2019, 7, 174167–174177. [Google Scholar] [CrossRef]
- Dharmawan, D.A.; Li, D.; Ng, B.P.; Rahardja, S. A new hybrid algorithm for retinal vessels segmentation on fundus images. IEEE Access 2019, 7, 41885–41896. [Google Scholar] [CrossRef]
- Jin, Q.; Chen, Q.; Meng, Z.; Wang, B.; Su, R. Construction of retinal vessel segmentation models based on convolutional neural network. Neural Process. Letters 2019, 4, 1–18. [Google Scholar] [CrossRef]
- Guo, S.; Wang, K.; Kang, H.; Zhang, Y.; Gao, Y.; Li, T. BTS-DSN: Deeply supervised neural network with short connections for retinal vessel segmentation. Int. J. Med. Inform. 2019, 126, 105–113. [Google Scholar] [CrossRef]
- Leopold, H.A.; Orchard, J.; Zelek, J.S.; Lakshminarayanan, V. Pixelbnn: Augmenting the pixelcnn with batch normalization and the presentation of a fast architecture for retinal vessel segmentation. J. Imaging 2019, 5, 26. [Google Scholar] [CrossRef]
- Lin, Y.; Zhang, H.; Hu, G. Automatic retinal vessel segmentation via deeply supervised and smoothly regularized network. IEEE Access 2018, 7, 57717–57724. [Google Scholar] [CrossRef]
- Jiang, Z.; Zhang, H.; Wang, Y.; Ko, S.-B. Retinal blood vessel segmentation using fully convolutional network with transfer learning. Comput. Med. Imaging Graph. 2018, 68, 1–15. [Google Scholar] [CrossRef]
- Sekou, T.B.; Hidane, M.; Olivier, J.; Cardot, H. Retinal Blood Vessel Segmentation Using a Fully Convolutional Network–Transfer Learning from Patch-to Image-Level. In International Workshop on Machine Learning in Medical Imaging; Springer: Cham, Germany, 2018; pp. 170–178. [Google Scholar]
- Hajabdollahi, M.; Esfandiarpoor, R.; Najarian, K.; Karimi, N.; Samavi, S.; Reza-Soroushmeh, S. Low complexity convolutional neural network for vessel segmentation in portable retinal diagnostic devices. In Proceedings of the 2018 25th IEEE International Conference on Image Processing (ICIP), Athens, Greece, 7–10 October 2018; pp. 2785–2789. [Google Scholar]
- Yan, Z.; Yang, X.; Cheng, K.-T. A three-stage deep learning model for accurate retinal vessel segmentation. IEEE J. Biomed. Health Inform. 2018, 23, 1427–1436. [Google Scholar] [CrossRef]
- Guo, Y.; Budak, Ü.; Şengür, A. A novel retinal vessel detection approach based on multiple deep convolution neural networks. Comput. Methods Programs Biomed. 2018, 167, 43–48. [Google Scholar] [CrossRef]
- Oliveira, A.; Pereira, S.; Silva, C.A. Retinal vessel segmentation based on fully convolutional neural networks. Expert Syst. Appl. 2018, 112, 229–242. [Google Scholar] [CrossRef]
- Soomro, T.A.; Hellwich, O.; Afifi, A.J.; Paul, M.; Gao, J.; Zheng, L. Strided U-Net model: Retinal vessels segmentation using dice loss. In Proceedings of the 2018 Digital Image Computing: Techniques and Applications (DICTA), Canberra, Australia, 10–13 December 2018; pp. 1–8. [Google Scholar]
- Tan, J.H.; Acharya, U.R.; Bhandary, S.V.; Chua, K.C.; Sivaprasad, S. Segmentation of optic disc, fovea and retinal vasculature using a single convolutional neural network. J. Comput. Sci. 2017, 20, 70–79. [Google Scholar] [CrossRef]
- Mo, J.; Zhang, L. Multi-level deep supervised networks for retinal vessel segmentation. Int. J. Comput. Assist. Radiol. Surg. 2017, 12, 2181–2193. [Google Scholar] [CrossRef] [PubMed]
- Zhou, L.; Yu, Q.; Xu, X.; Gu, Y.; Yang, J. Improving dense conditional random field for retinal vessel segmentation by discriminative feature learning and thin-vessel enhancement. Comput. Methods Programs Biomed. 2017, 148, 13–25. [Google Scholar] [CrossRef] [PubMed]
- Şengür, A.; Guo, Y.; Budak, Ü.; Vespa, L.J. A retinal vessel detection approach using convolution neural network. In Proceedings of the 2017 International Artificial Intelligence and Data Processing Symposium (IDAP), Malatya, Turkey, 16–17 September 2017; pp. 1–4. [Google Scholar]
- Orlando, J.I.; Prokofyeva, E.; Blaschko, M.B. A discriminatively trained fully connected conditional random field model for blood vessel segmentation in fundus images. IEEE Trans. Biomed. Eng. 2016, 64, 16–27. [Google Scholar] [CrossRef] [PubMed]
- Yao, Z.; Zhang, Z.; Xu, L.-Q. Convolutional neural network for retinal blood vessel segmentation. In Proceedings of the 2016 9th international symposium on Computational intelligence and design (ISCID), Hangzhou, China, 10–11 December 2016; pp. 406–409. [Google Scholar]
- Li, Q.; Feng, B.; Xie, L.; Liang, P.; Zhang, H.; Wang, T. A cross-modality learning approach for vessel segmentation in retinal images. IEEE Trans. Med. Imaging 2015, 35, 109–118. [Google Scholar] [CrossRef] [PubMed]
- Maji, D.; Santara, A.; Mitra, P.; Sheet, D. Ensemble of deep convolutional neural networks for learning to detect retinal vessels in fundus images. arXiv 2016, arXiv:1603.04833. [Google Scholar]
- Lahiri, A.; Roy, A.G.; Sheet, D.; Biswas, P.K. Deep neural ensemble for retinal vessel segmentation in fundus images towards achieving label-free angiography. In Proceedings of the 2016 38th Annual International Conference of the IEEE Engineering in Medicine and Biology Society (EMBC), Orlando, FL, USA, 16–20 August 2016; pp. 1340–1343. [Google Scholar]
- Liskowski, P.; Krawiec, K. Segmenting retinal blood vessels with deep neural networks. IEEE Trans. Med. Imaging 2016, 35, 2369–2380. [Google Scholar] [CrossRef]
- Fu, H.; Xu, Y.; Wong, D.W.K.; Liu, J. Retinal vessel segmentation via deep learning network and fully-connected conditional random fields. In Proceedings of the 2016 IEEE 13th international symposium on biomedical imaging (ISBI), Prague, Czech, 13–16 April 2016; pp. 698–701. [Google Scholar]
- Chudzik, P.; Al-Diri, B.; Calivá, F.; Hunter, A. DISCERN: Generative framework for vessel segmentation using convolutional neural network and visual codebook. In Proceedings of the 2018 40th Annual International Conference of the IEEE Engineering in Medicine and Biology Society (EMBC), Honolulu, HI, USA, 18–21 July 2018; pp. 5934–5937. [Google Scholar]
- Azzopardi, G.; Strisciuglio, N.; Vento, M.; Petkov, N. Trainable COSFIRE filters for vessel delineation with application to retinal images. Med. Image Anal. 2015, 19, 46–57. [Google Scholar] [CrossRef]
- Zhang, J.; Dashtbozorg, B.; Bekkers, E.; Pluim, J.P.; Duits, R.; ter Haar Romeny, B.M. Robust retinal vessel segmentation via locally adaptive derivative frames in orientation scores. IEEE Trans. Med. Imaging 2016, 35, 2631–2644. [Google Scholar] [CrossRef]
- Roychowdhury, S.; Koozekanani, D.D.; Parhi, K.K. Iterative vessel segmentation of fundus images. IEEE Trans. Biomed. Eng. 2015, 62, 1738–1749. [Google Scholar] [CrossRef]
- Gargeya, R.; Leng, T. Automated identification of diabetic retinopathy using deep learning. Ophthalmology 2017, 124, 962–969. [Google Scholar] [CrossRef] [PubMed]
- Solanki, K.M.; Ramachandra, C.A.; Krupakar, S.B. Systems and Methods for Automated Interest Region Detection in Retinal Images. Google Patents U.S. 8879813, 4 November 2014. [Google Scholar]
- Sánchez Brea, L.; Andrade De Jesus, D.; Shirazi, M.F.; Pircher, M.; van Walsum, T.; Klein, S. Review on retrospective procedures to correct retinal motion artefacts in OCT imaging. Appl. Sci. 2019, 9, 2700. [Google Scholar] [CrossRef]
- Solanki, K.M.; Ramachandra, C.A.; Krupakar, S.B. Systems and Methods for Automated Detection of Regions of Interest in Retinal Images. Google Patents U.S. 14/500929, 23 April 2017. [Google Scholar]


© 2020 by the authors. Licensee MDPI, Basel, Switzerland. This article is an open access article distributed under the terms and conditions of the Creative Commons Attribution (CC BY) license (http://creativecommons.org/licenses/by/4.0/).