The Brazilian Research Agricultural Corporation (EMBRAPA) released the
Brachiaria brizantha cultivars Piatã and BRS Paiaguás, while the Matsuda Group launched the cultivar MG13 Braúna. These cultivars are largely adopted in grazing fields in the Brazilian Cerrado due to their recognized nutritional value, and their claimed biomass yield during dry seasons. The general adaptation characteristics and yield patterns of these cultivars obey the rule of increasing pasture and animal productivity. These features are based on the well-documented biomass yield and pasture quality achieved by the
Brachiaria genus in tropical savannahs [
2,
5,
14,
15].
2.1. Experimental Design and General Soil Properties
A greenhouse experiment was conducted at the Federal University of Mato Grosso campus in Rondonópolis, Brazil (16° 28’ S, 50° 34’ W; 248 m above sea level). The Köppen climate type is Aw—tropical zone with dry winter [
16]. Throughout the experiment, the greenhouse presented an average relative humidity and air temperature of 61% and 26.4 °C, respectively.
For the purpose of this research, we selected a coarse-textured soil classified as Fluvisol according to the IUSS Working Group WRB [
17], which is prone to waterlogging during the rainy season and drought during the dry season. This soil group occupies large areas in the Cerrado biome and is usually located at and nearby river flood plains. Consequently, this soil group is generally used for forage production (grazing) due to the risks related to yield failures that it offers to cash crops (e.g., soybean, maize, and cotton), which are more resource-demanding.
Disturbed soil samples were collected from the top soil layer (0–0.2 m), and then passed through a 4 mm sieve for the composition of the experimental units. Additional soil samples passed through a 2 mm sieve for natural chemical status and particle-size distribution analysis,
Table 1.
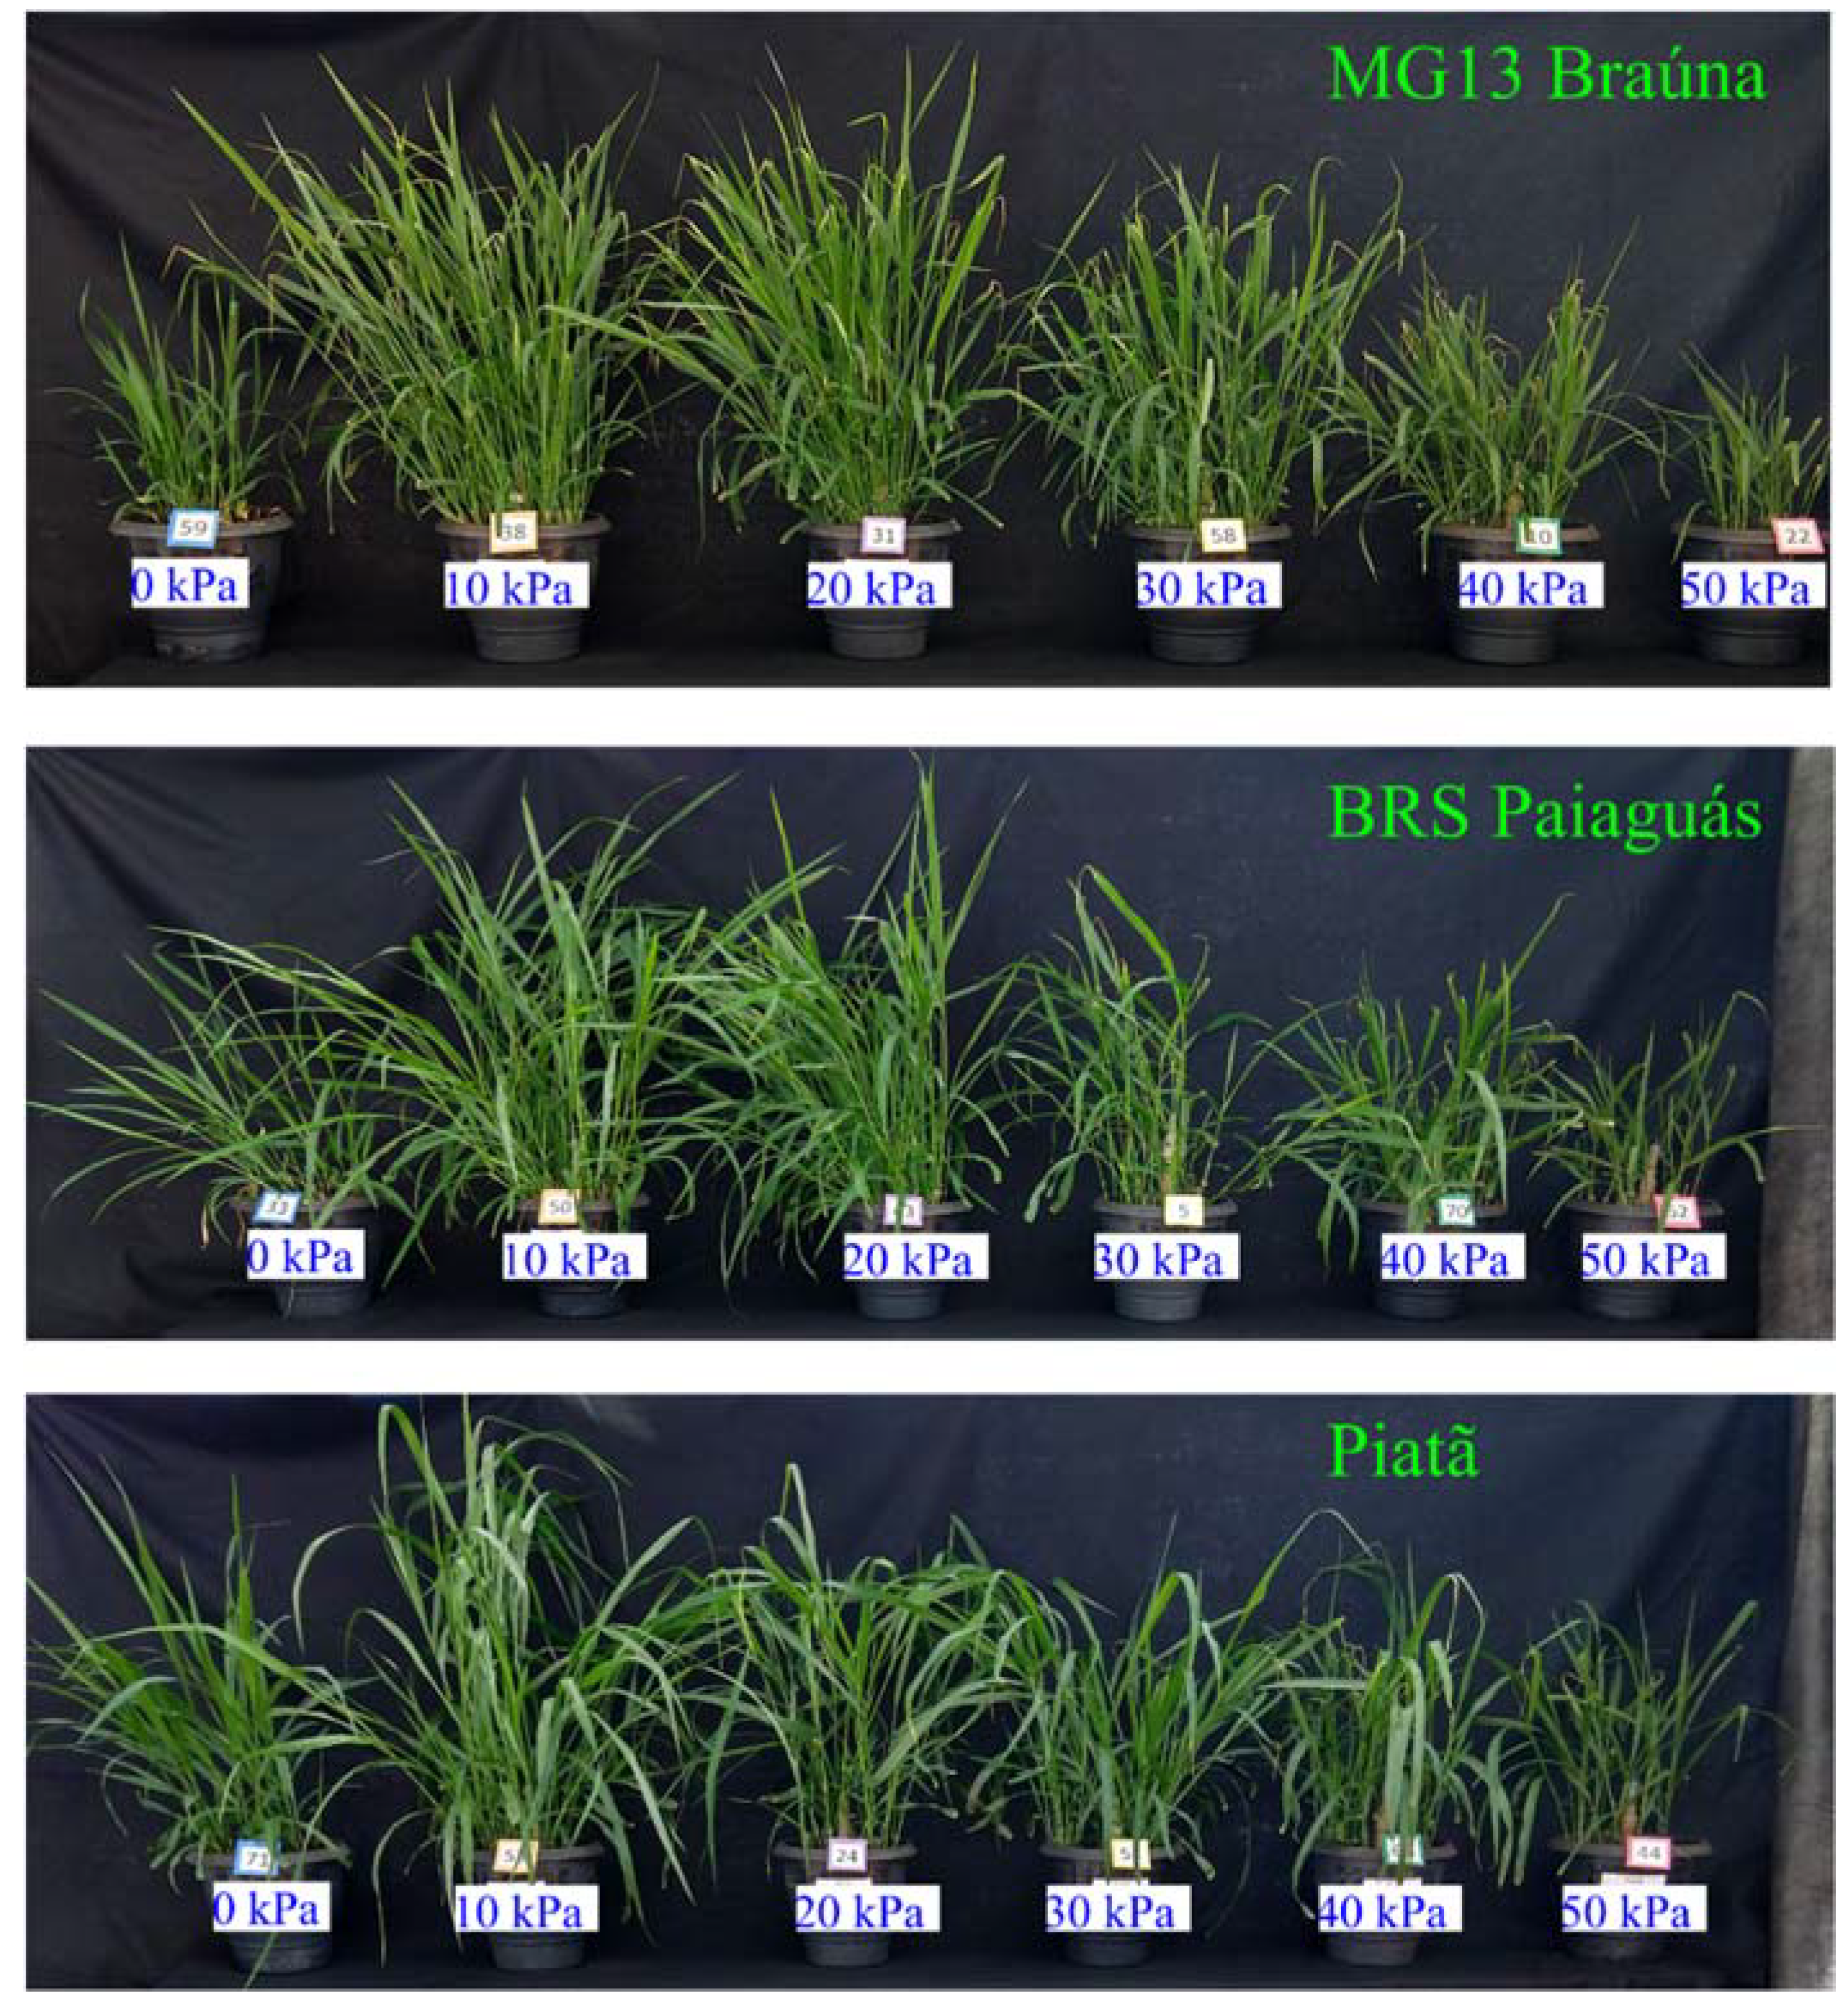
Nitrogen, phosphorus, and potassium were supplied according to the demand required by the Brachiaria spp. The following nutrient doses were applied for all plants: 200 mg·dm−3 of nitrogen, 150 mg·dm−3 of phosphorus applied in unique dose at sowing, and 100 mg·dm−3 of potassium. The used mineral sources were urea, single superphosphate, and potassium chloride, respectively. The sieved soil and the single superphosphate were mixed together, and this homogenized material was used to fill 72 pots of 5 L each (5 kg of soil material for each pot). The potassium chloride and urea were diluted in water and applied at the beginning of the experiment and as restitution minerals throughout the crop cycles (growth and regrowth) for all treatments. A randomized block design (with four replicates) was used for this experiment, adopting a factorial scheme 3 × 6 (three Brachiaria cultivars: MG13 Braúna, BRS Paiaguás, and Piatã; and six values of soil water pressure heads: 0, −10, −20, −30, −40, and −50 kPa), totaling 72 pots, where each pot was considered as an experimental unit.
The soil water retention curve
h(
θ), the analytical relationship between soil water content (
θ) and the soil water pressure head (
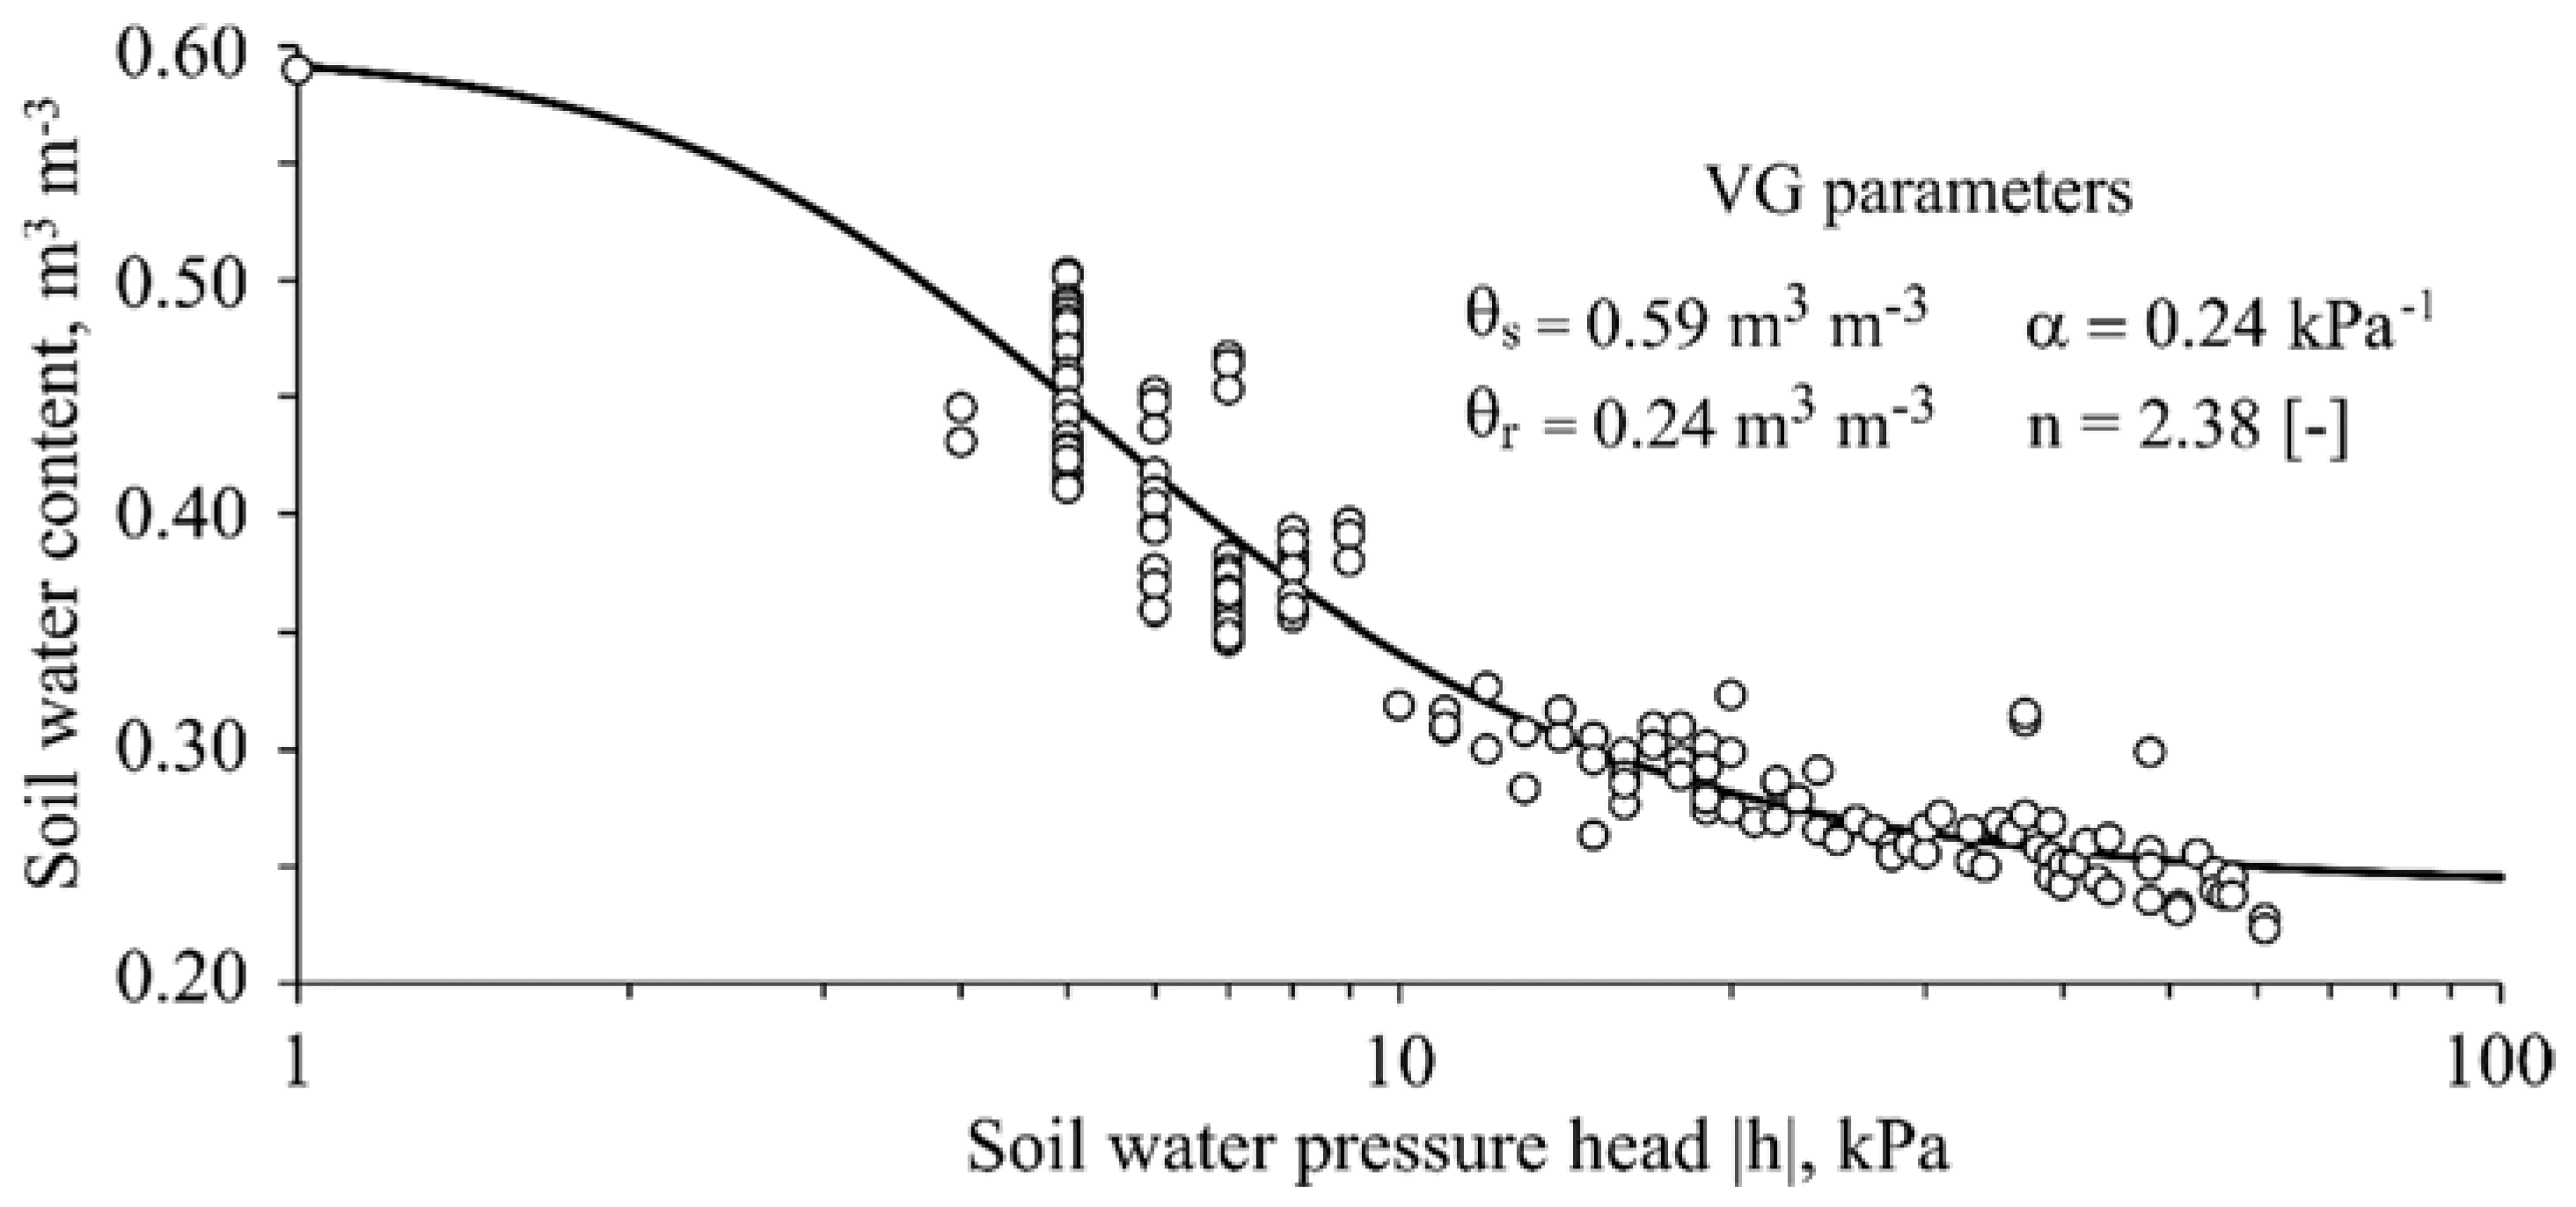
h), were obtained using a different set of pots with similar volumetric capacity. Water-filled tensiometers were installed in those pots (four replicas) with previously saturated soil. The soil water content was monitored by recording the weight change over time while the soil water pressure head was measured twice a day. The gravimetric water content was then converted to volumetric unit using the relation between bulk soil density and water density. The lowest value of pressure head recorded by the tensiometers was −61 kPa, therefore, the soil water retention curve ranged from soil saturation to this lower bound of −61 kPa. The soil water retention curve was described by the analytical
θ-h function defined by [
18], Equation (1), which was fitted to the obtained data-pairs (
θ-h) minimizing the sum of squared errors using the RETC software [
19]:
where
is the effective saturation,
θ (m
3 m
−3) is the water content,
h (kPa) is the pressure head,
θr is the residual water content,
θs is the saturated water content, and
α (kPa
−1), and
n are shape parameters.
Figure 1 shows the fitted soil water retention curve of the soil material after accommodation in the pots. The high values of parameters
α and
n confirm the expected hydraulic characteristic for a coarse-textured soil. It also shows that under the lowest applied pressure head during the experiment (−50 kPa) the used soil material still holds water content over 20%.
2.2. Cultivars Sowing and Plant Establishment
Approximately 50 seeds were sowed in each experimental unit (pot); four days after emergence (DAE), the seedlings were thinned out, leaving five vigorous plants in each experimental unit. At the 10th DAE, when plants were uniform and around 10 cm height, the soil water pressure head treatments were applied (0, −10, −20, −30, −40, and −50 kPa). The pressure head measurements were recorded twice a day (early in the morning and by the end of the afternoon) during the entire experimental period (90 day); after the readings, the water inside the tensiometer tubes was replenished. A thin 1 cm water depth over the soil surface simulated the flooded condition treatment throughout the experiment, whereas the negative h values simulated the moderate dehydration stress.
2.3. Response Variables
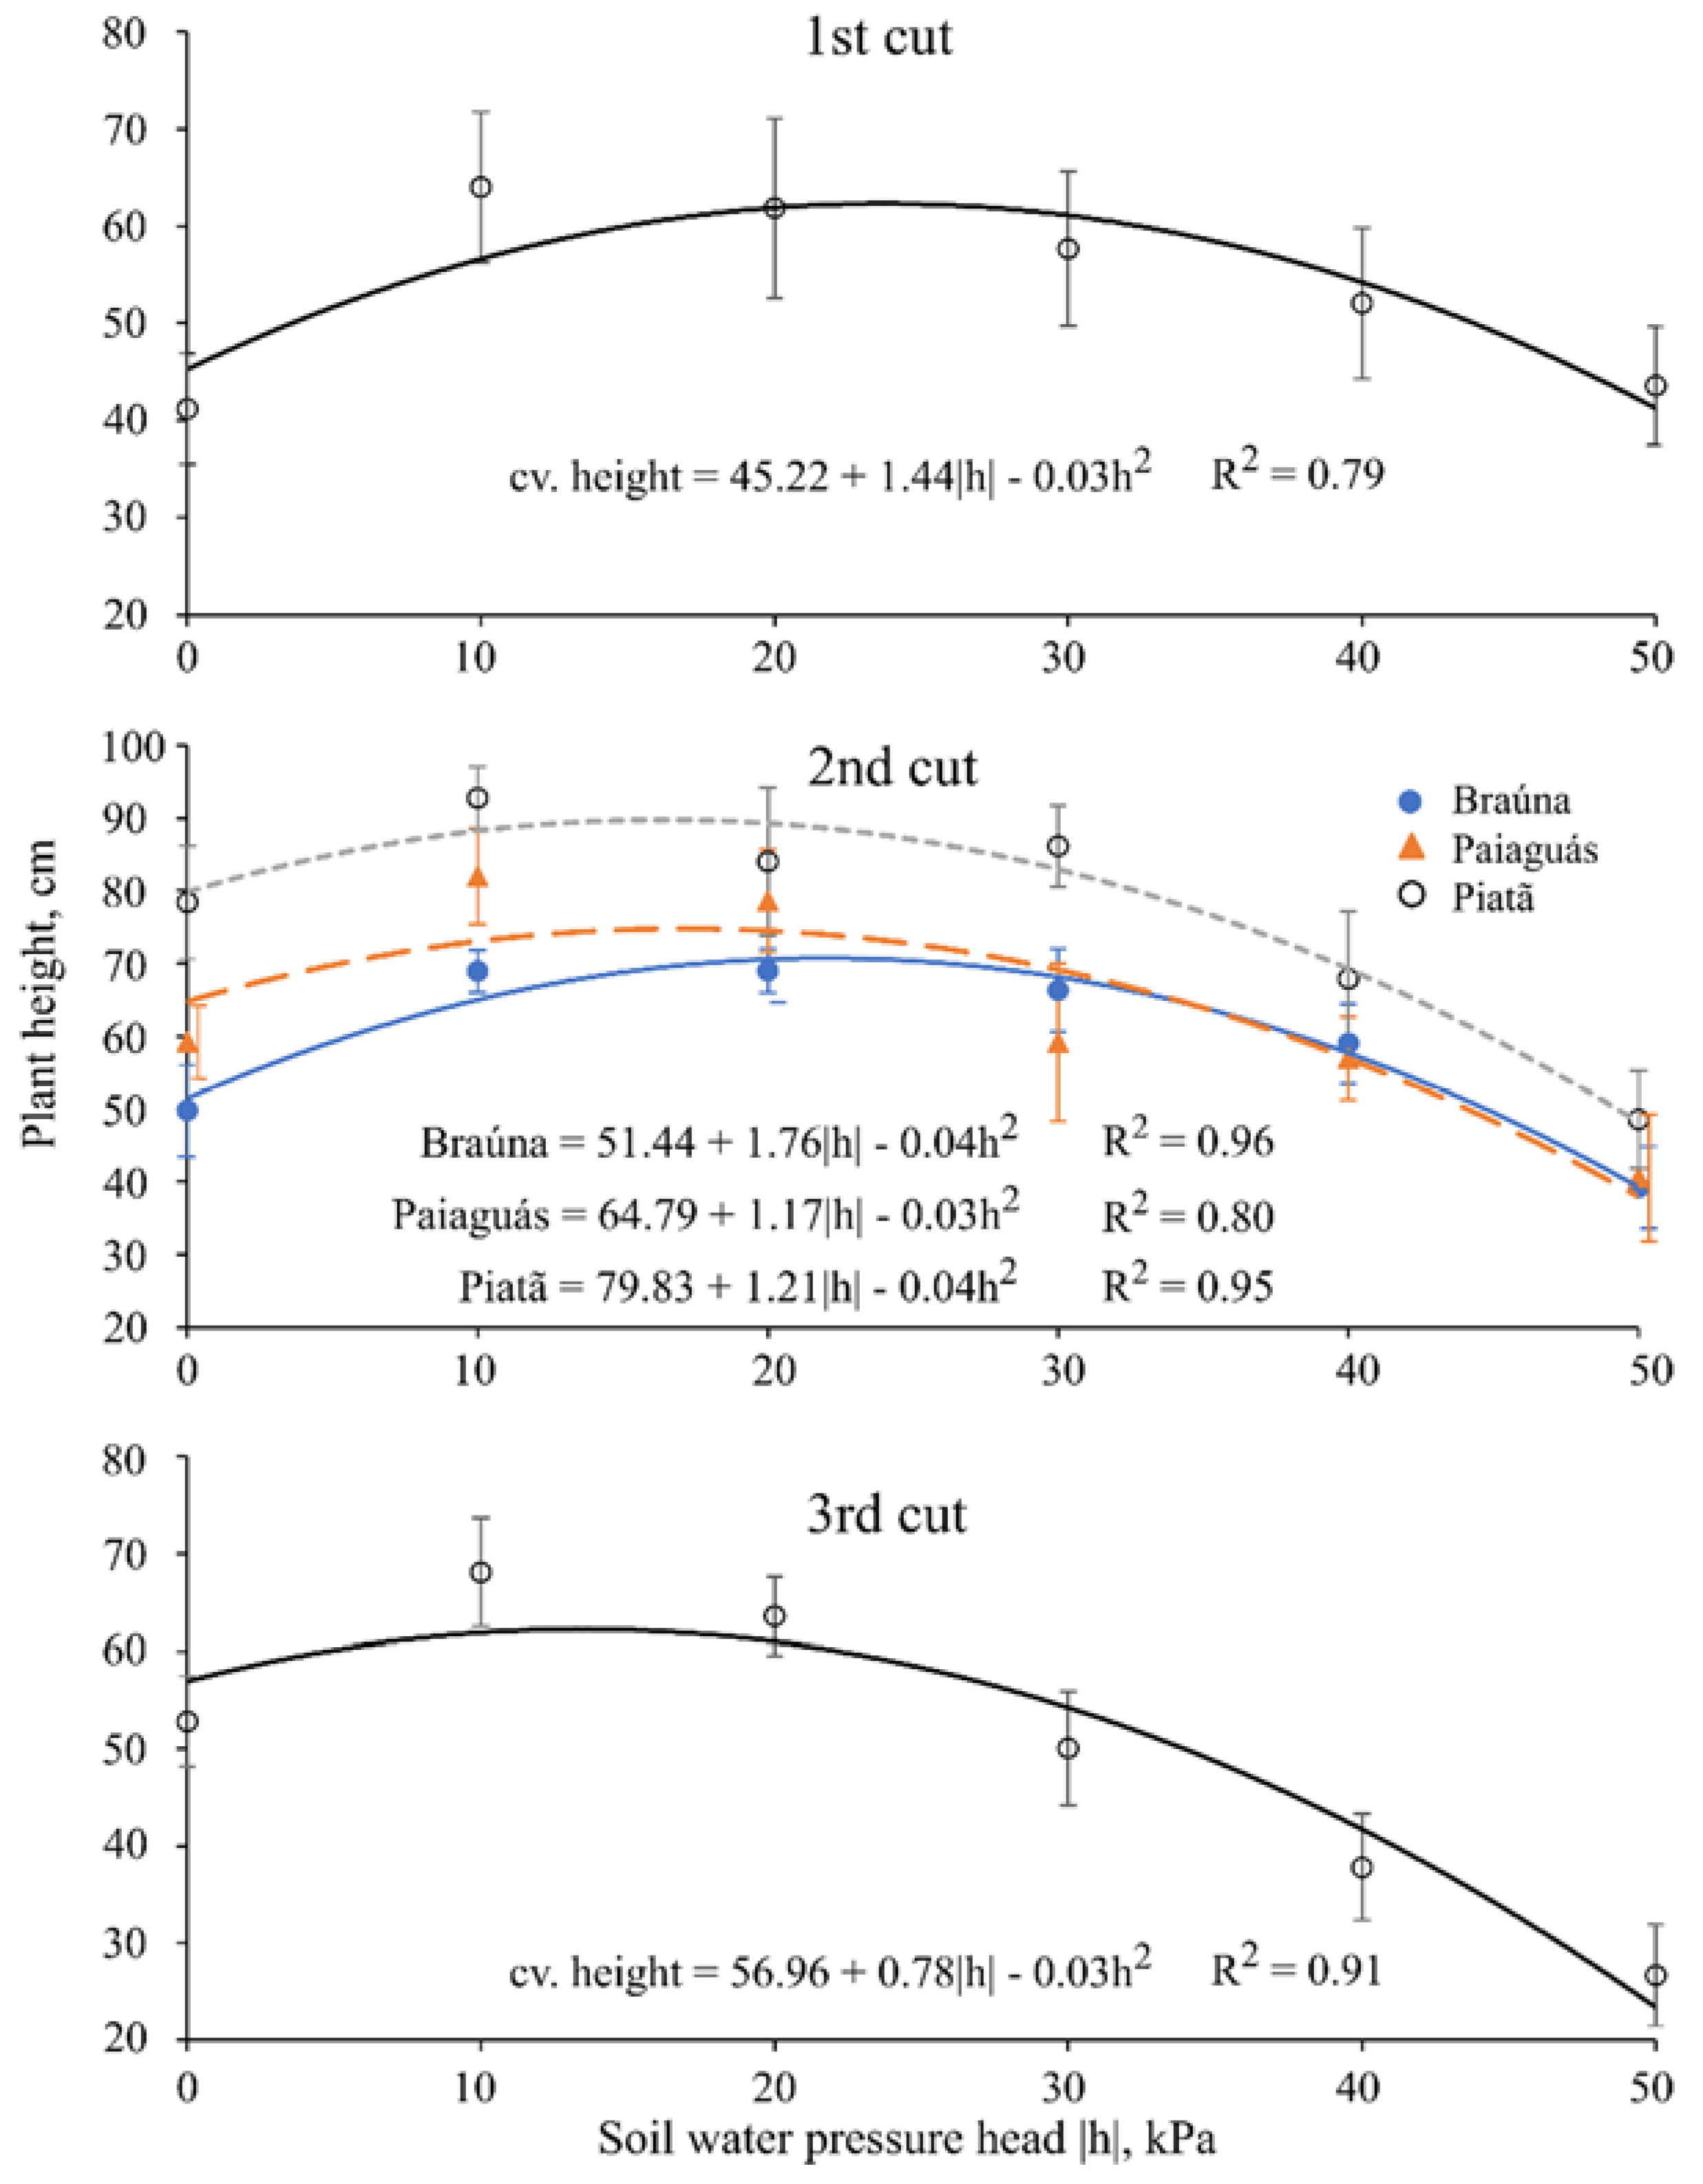
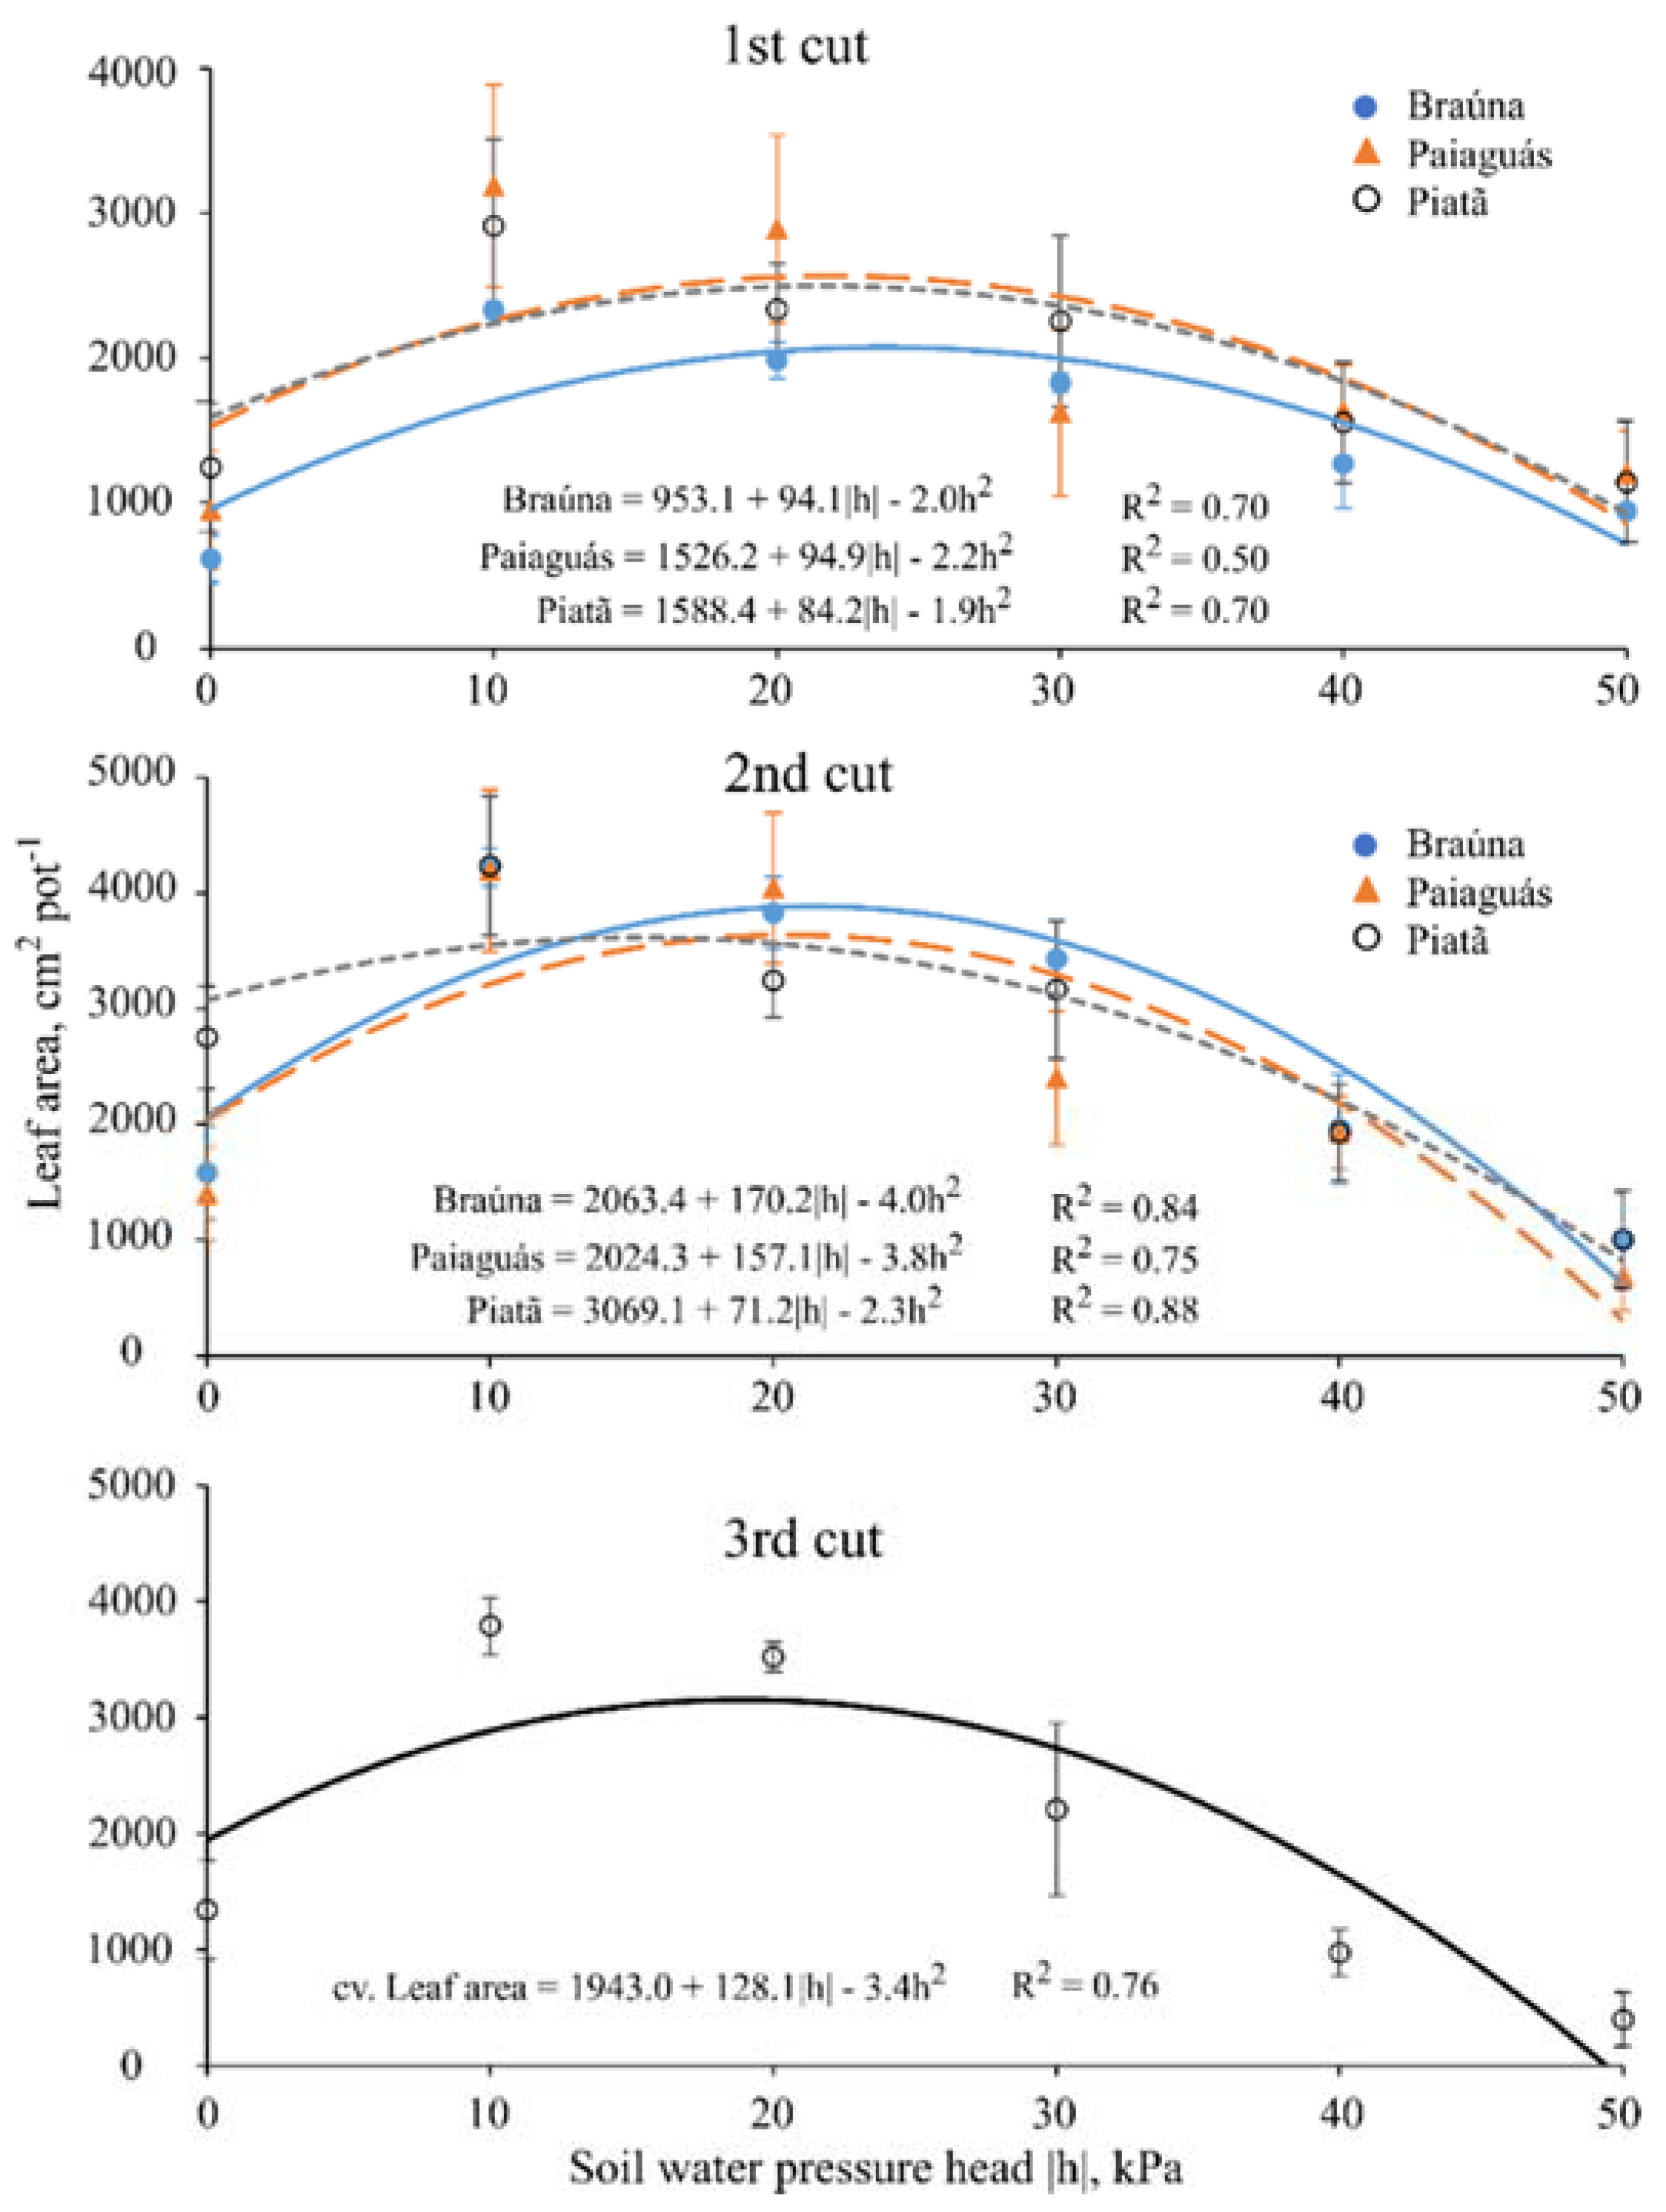
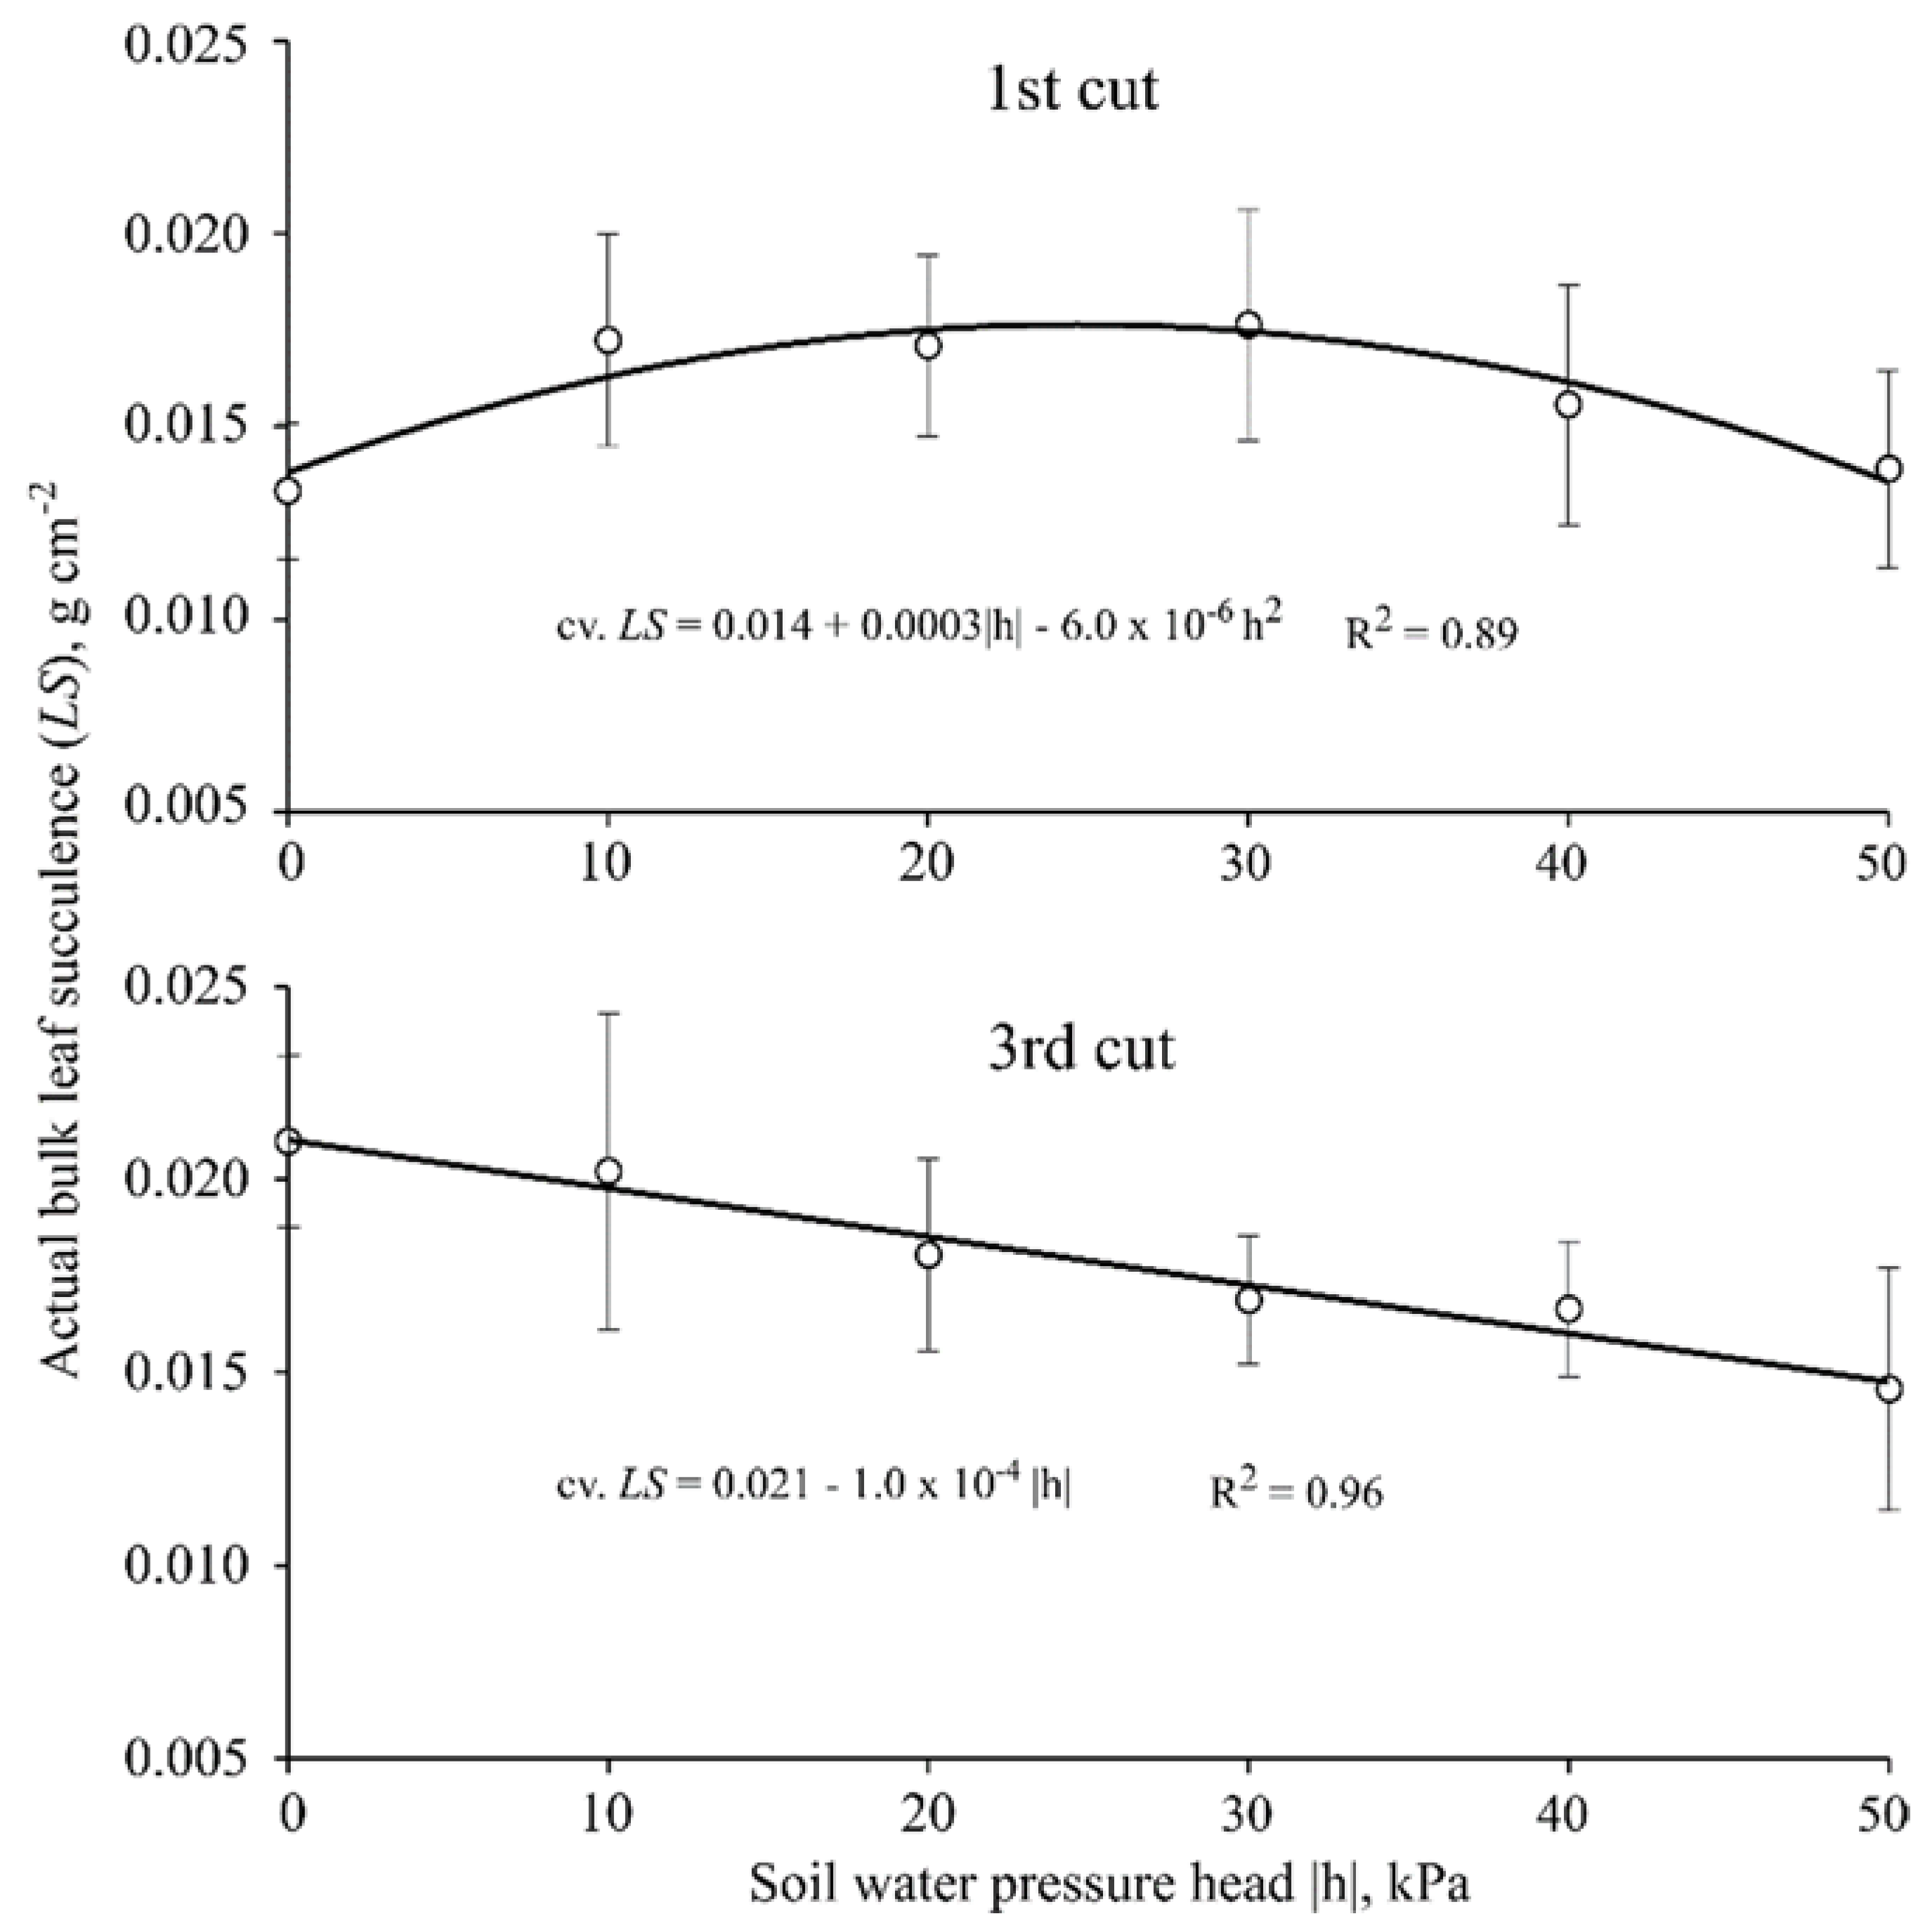
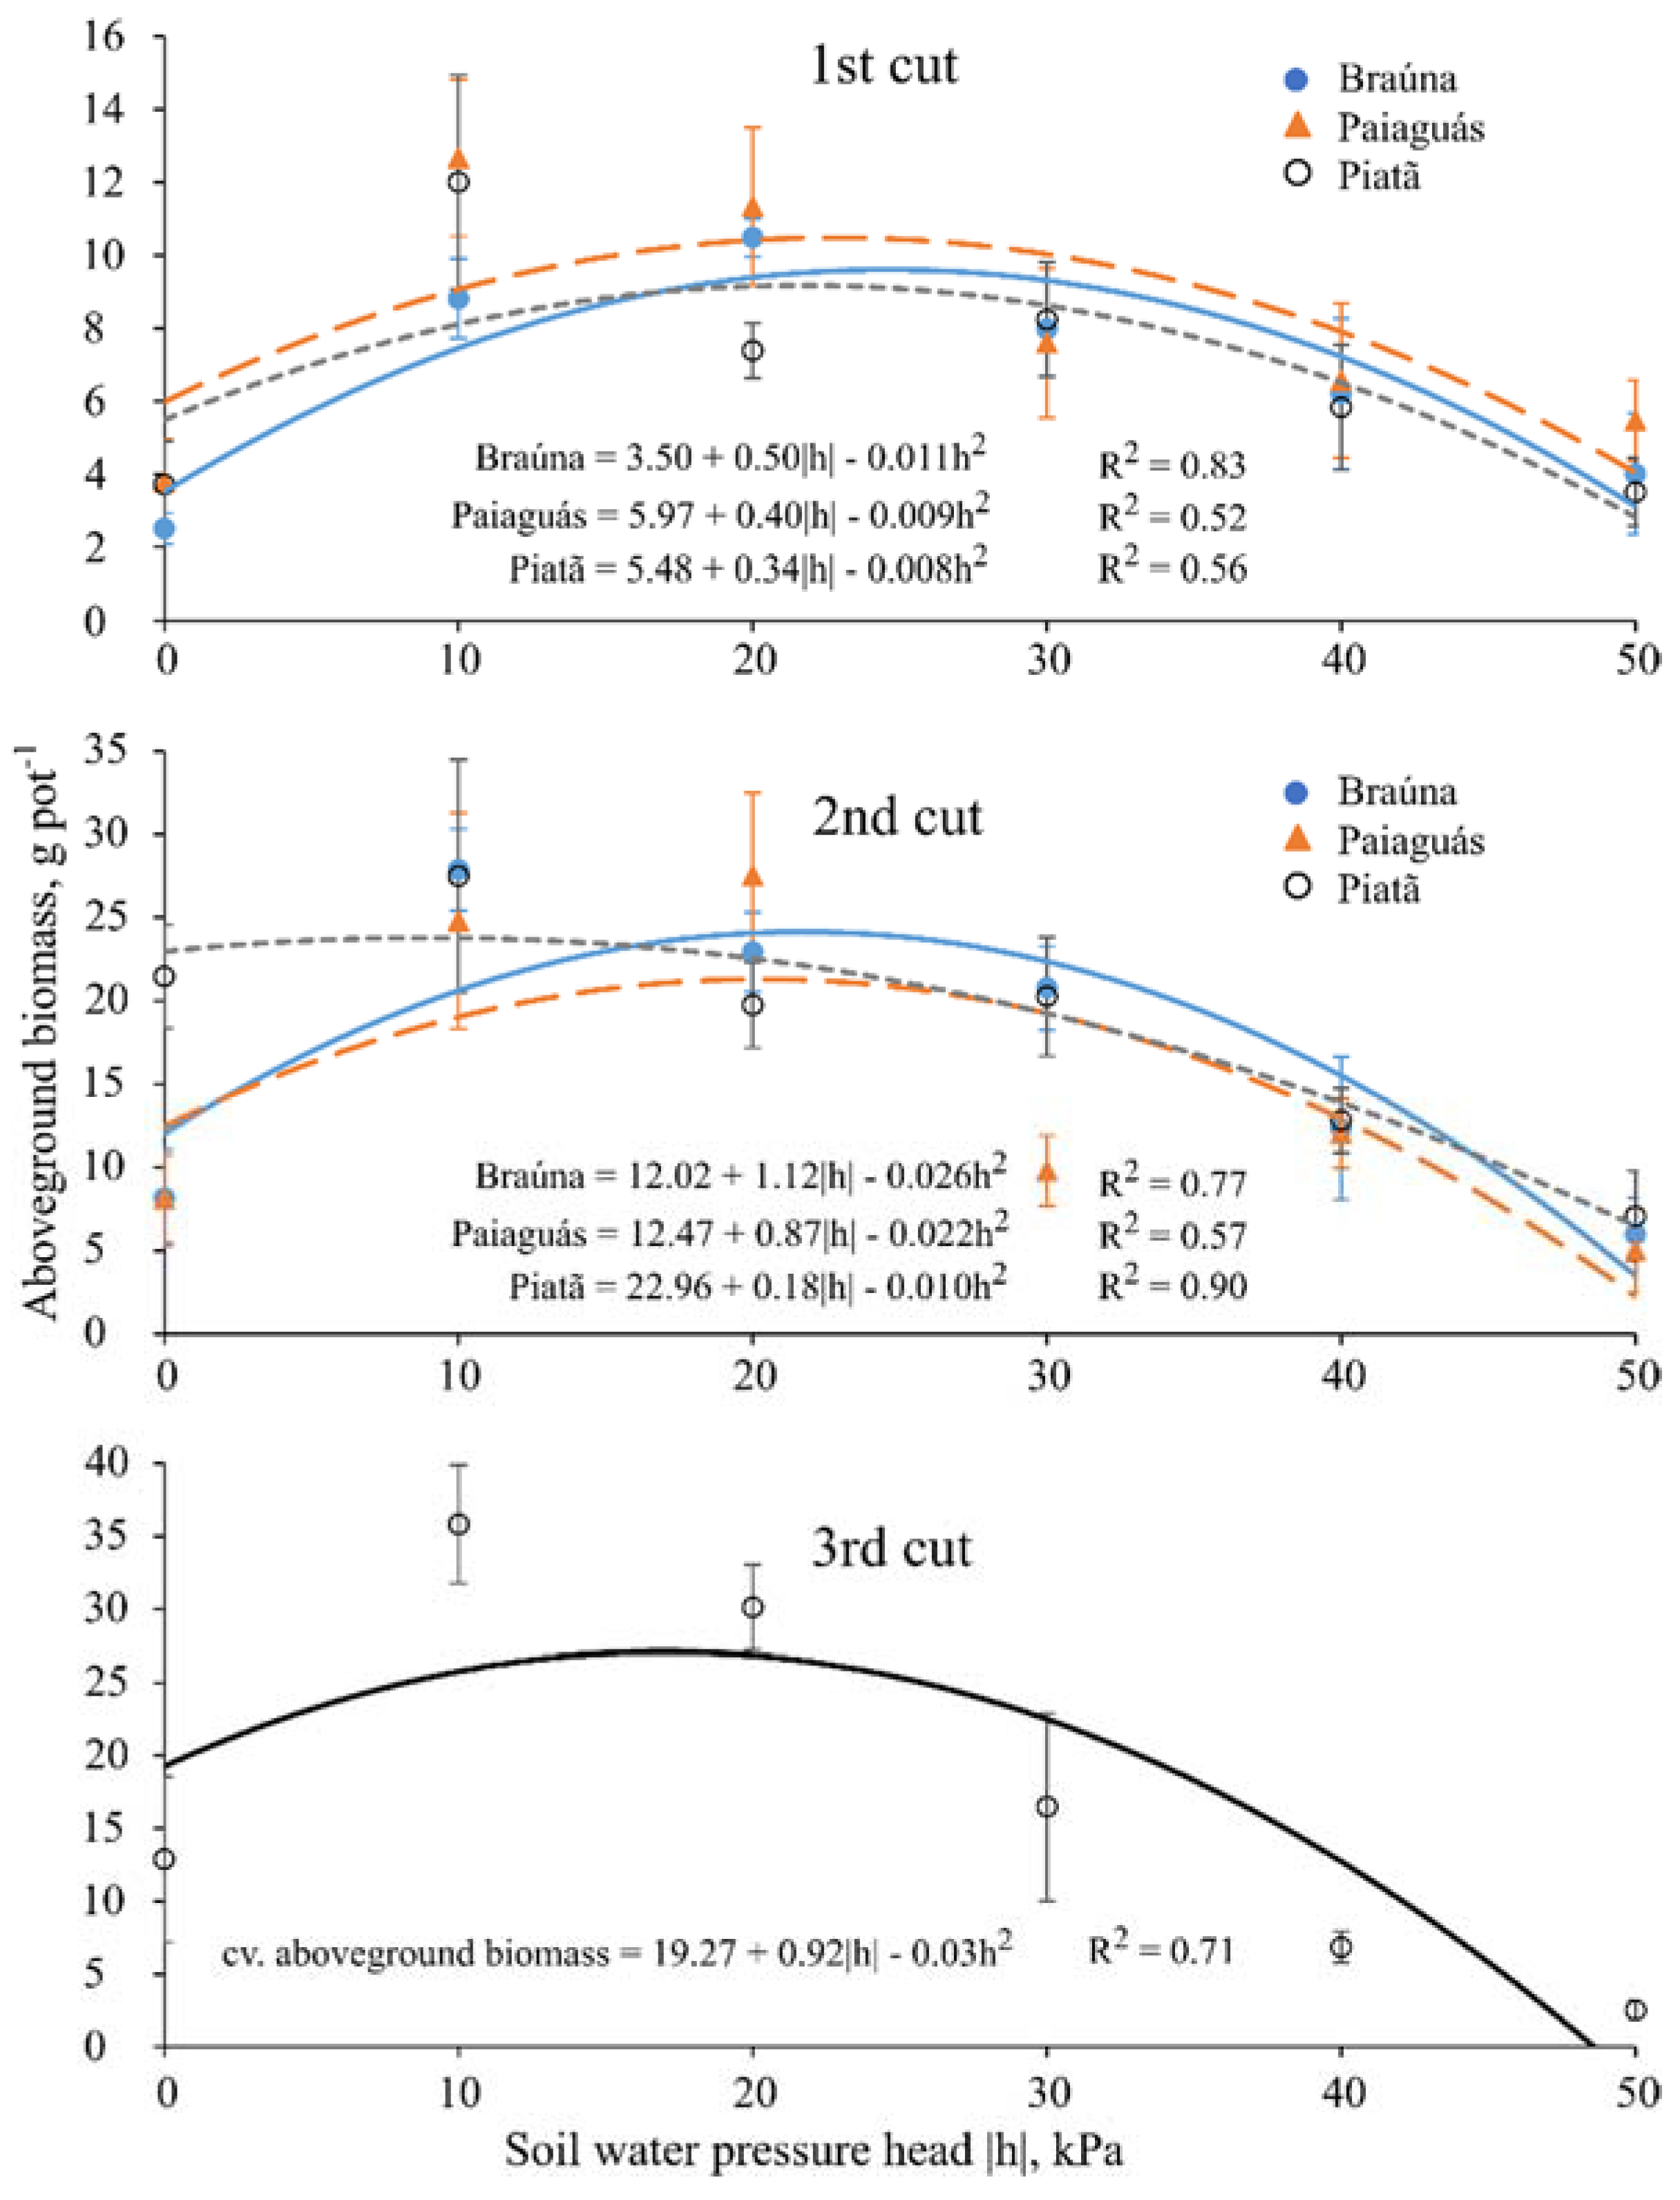
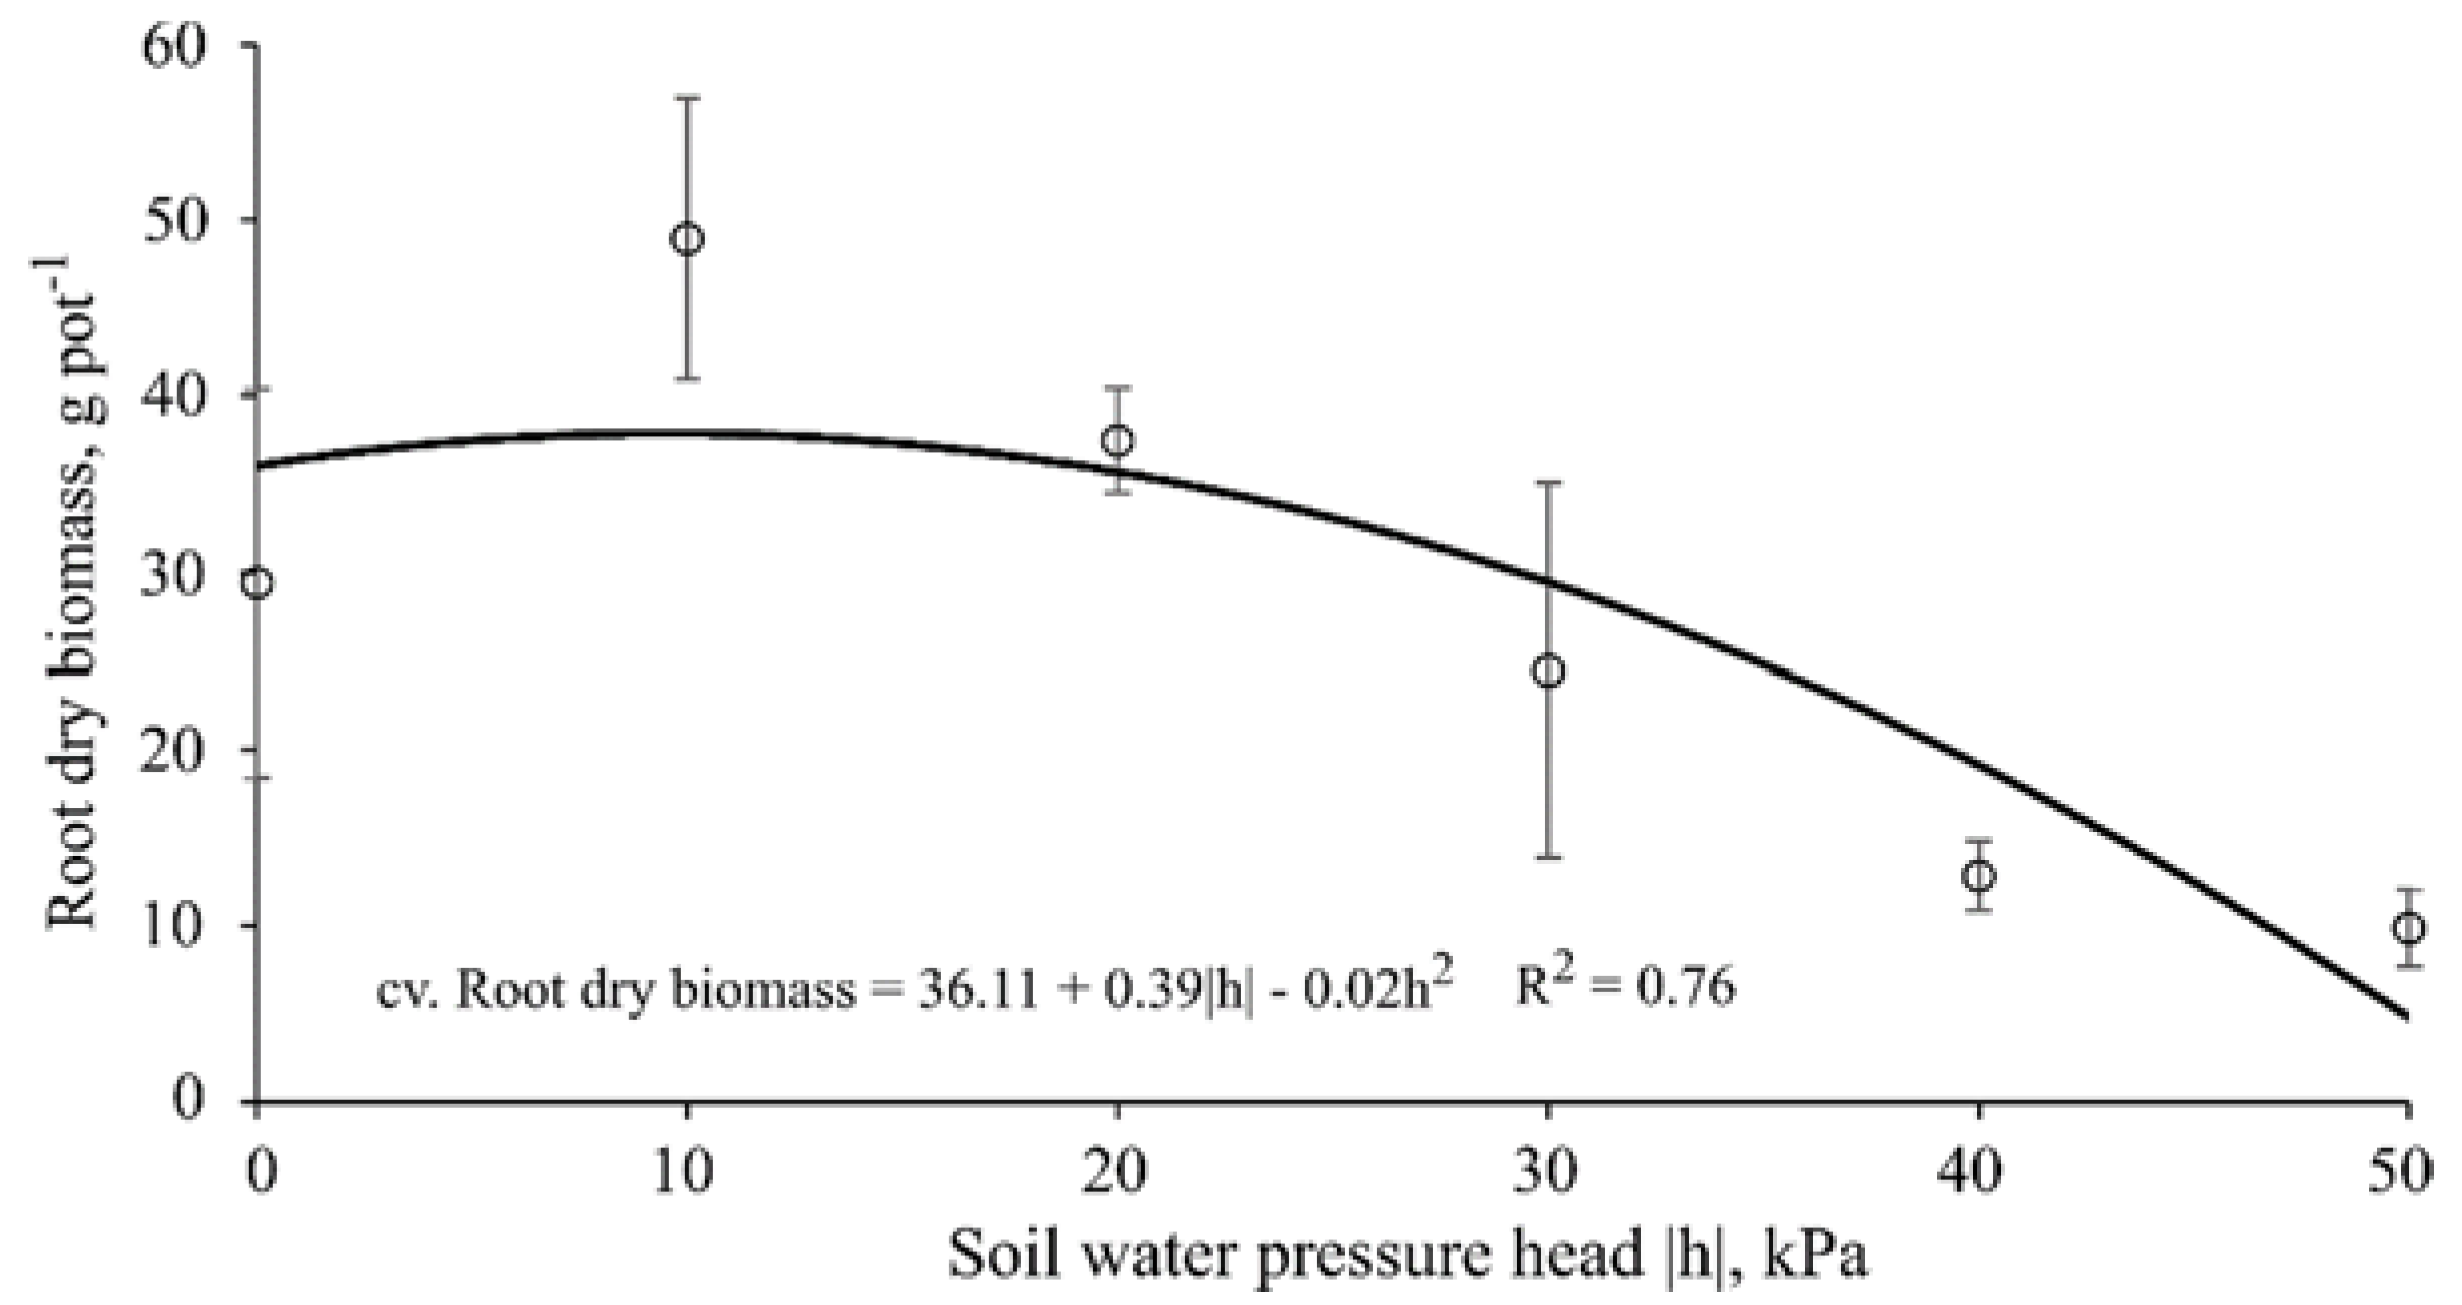
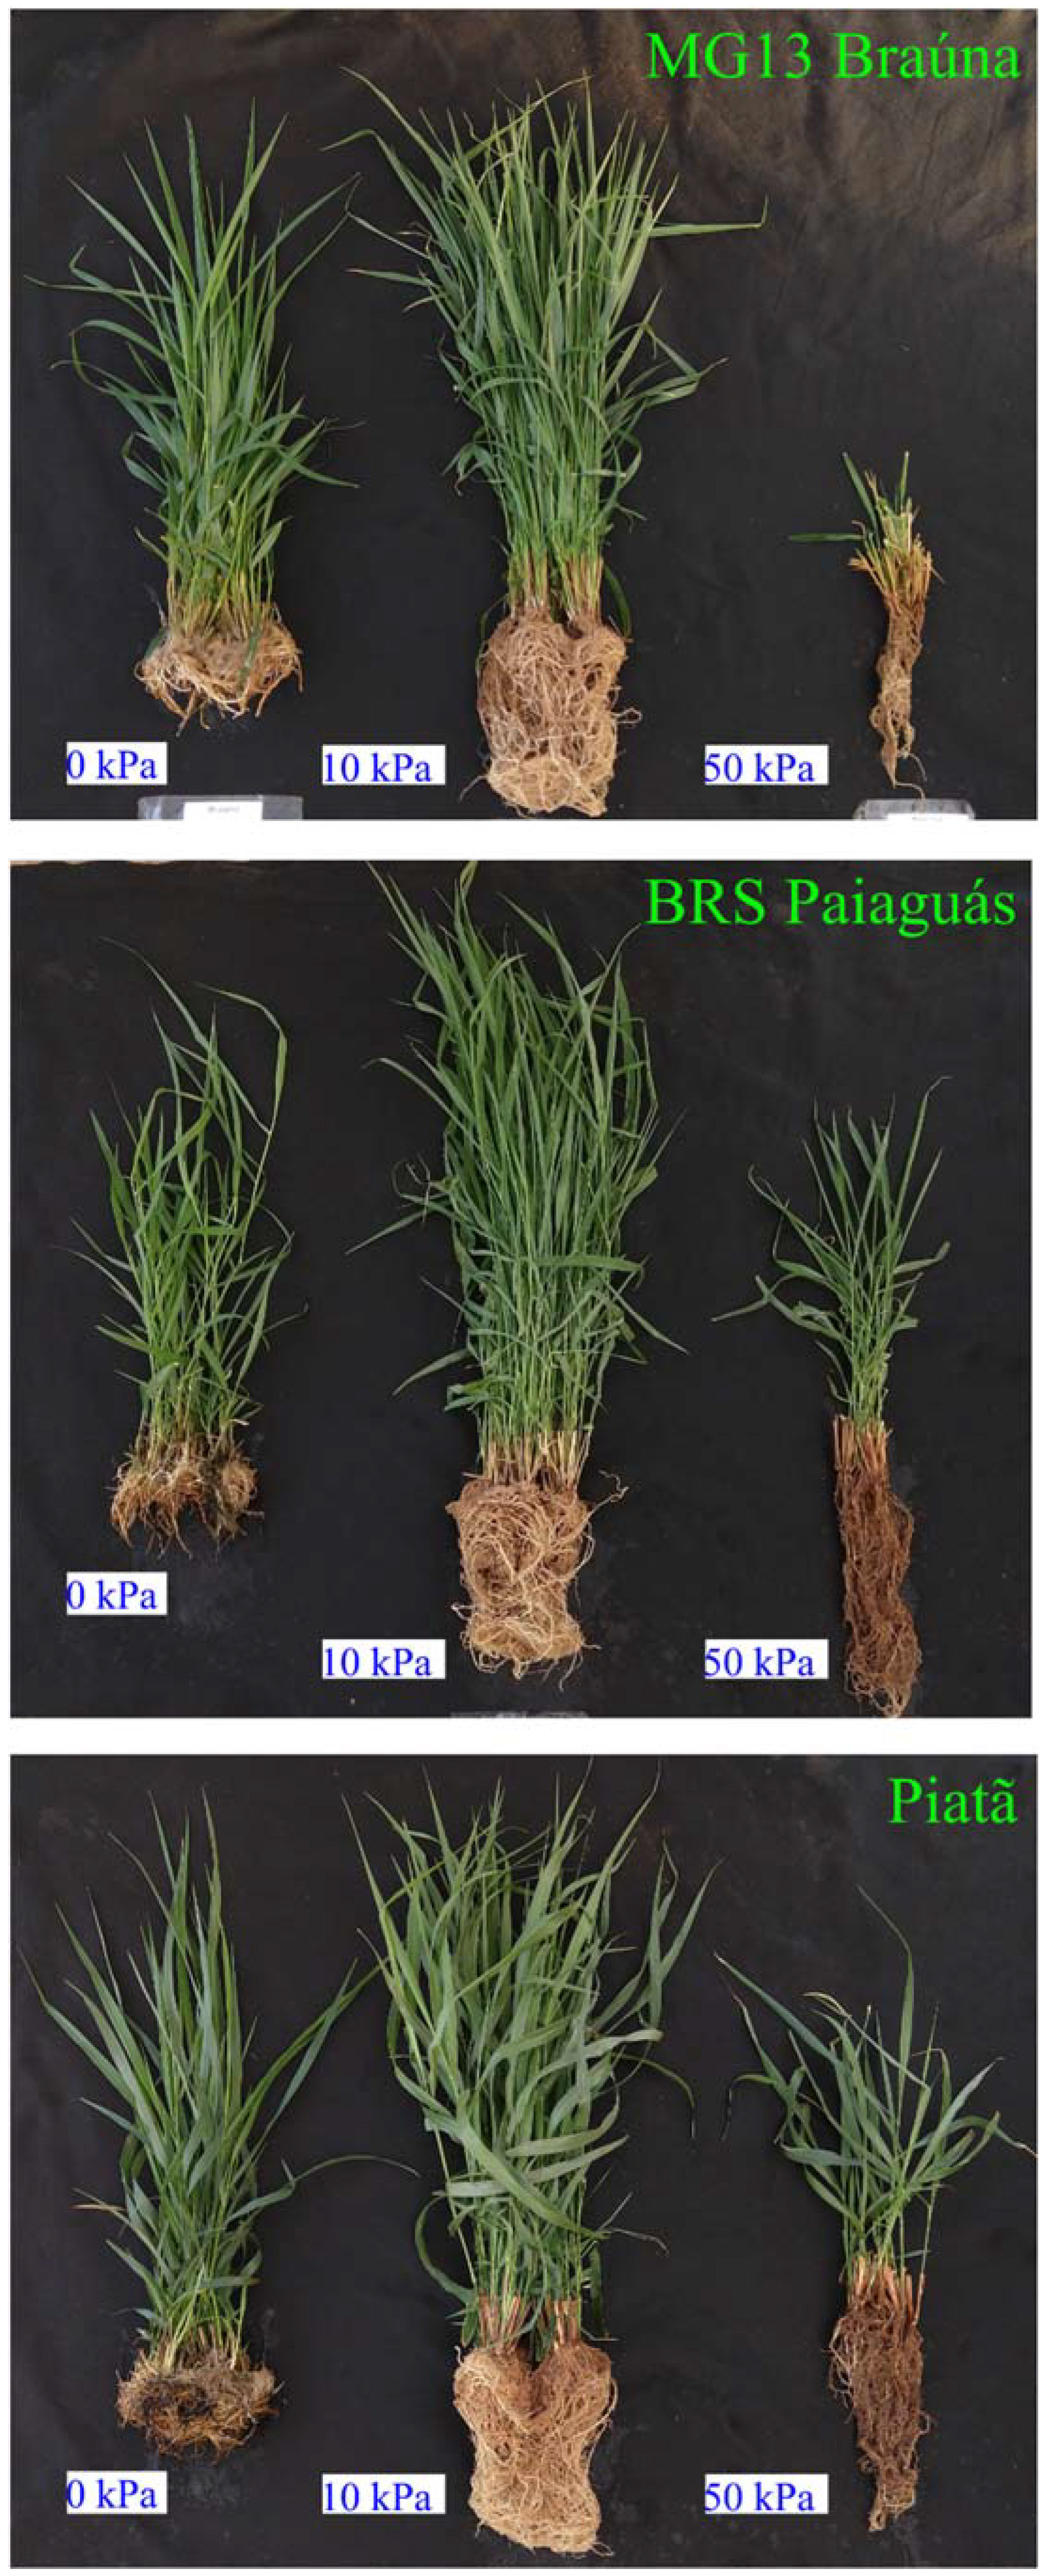
Thirty days after starting the treatments (40 DAE), plants were clipped at 5 cm above pot surface level to stimulate regrowth; this protocol was repeated twice throughout the experiment with the same time interval between cuts (30 day), totaling 90 days of experiment. At each cut, the following variables were measured: plant height (cm); leaf area (cm2·pot−1); actual bulk leaf succulence (g·cm−2; for the first and third cuts); aboveground dry biomass (g·pot−1); water use efficiency (kg·m−3; for the second cut); and root dry biomass (g·pot−1, measured only once at the end of the experiment).
Plant height was considered as the vertical distance from the pot soil surface to the curvature point of the last expanded leaf. The leaf area (LA) measurements were performed using a LI 3100 area meter (LI-COR Bio-Science). Regarding the dry biomass measurements, the fresh material was packed in proper paper bags and allowed to dry in a forced-air ventilation oven at 65 °C.
The following relation was used to obtain the actual bulk leaf succulence (
LS, g·cm
−2), an indicative of pasture palatability:
where FLB is the fresh harvested leaves, and DLB is the dry leaf biomass.
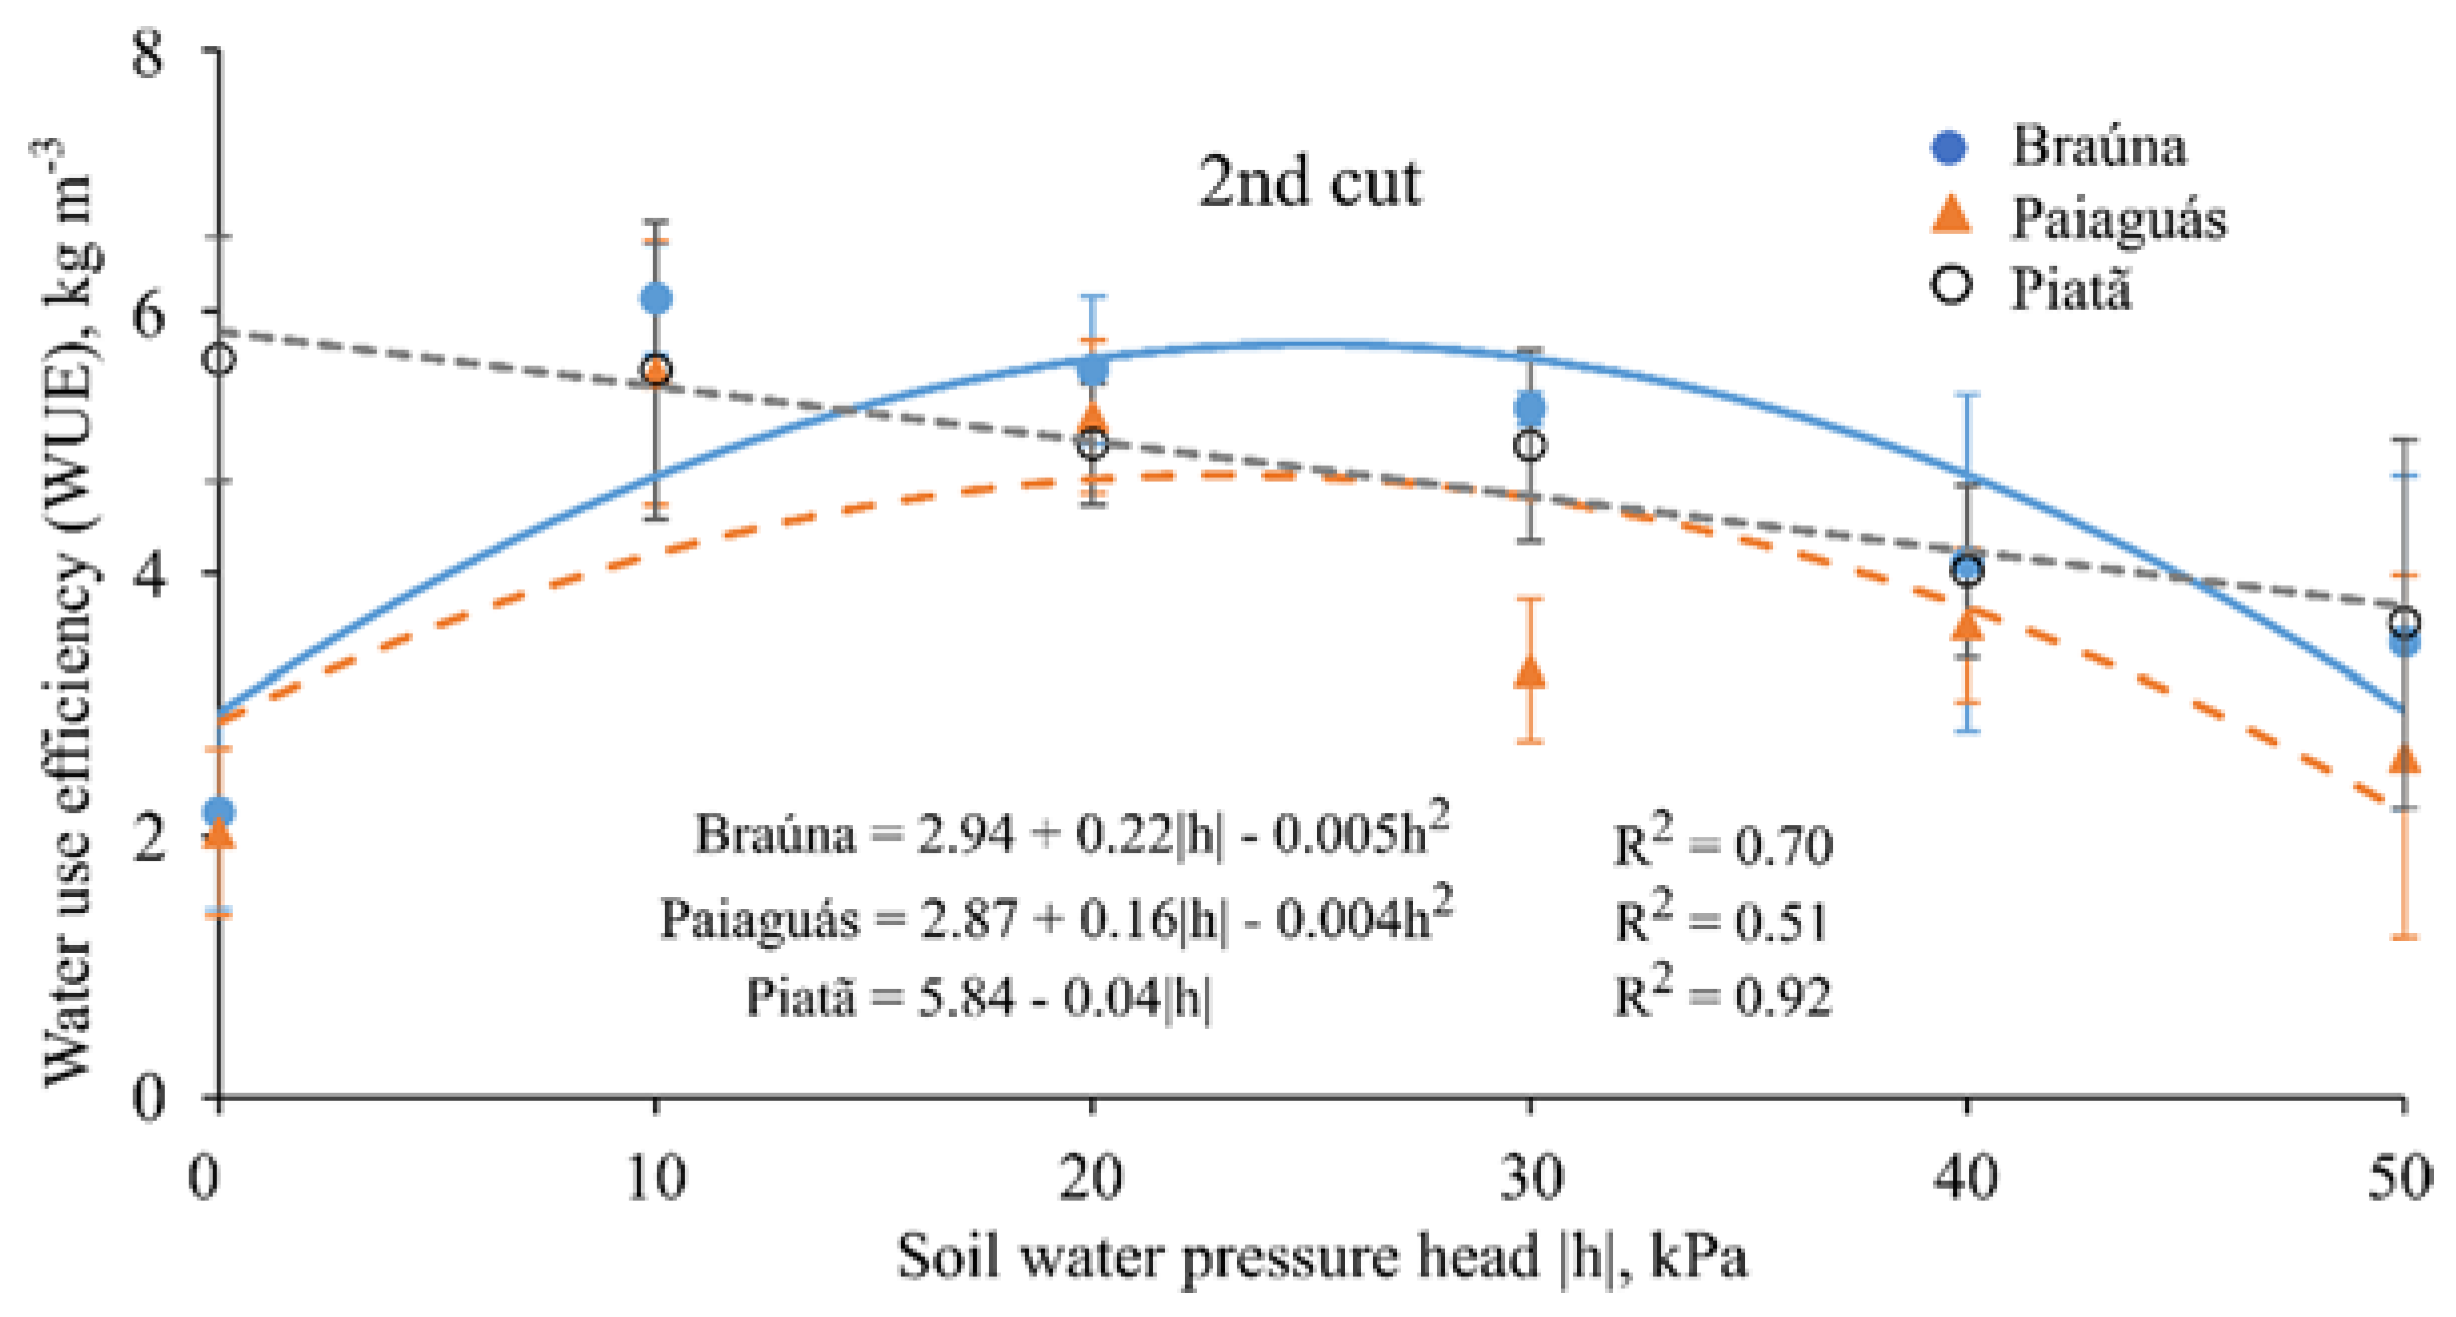
The agricultural water use efficiency (WUE) is the ratio between the amount (e.g., biomass) of agricultural yield per a volume (or value) of water used for achieving this production. The most common units for expressing water use efficiency are kg·m
−3 or ton·m
−3, i.e., the mass of agricultural yield per volume of water used [
20,
21]. Expressing WUE in kg·m
−3, we calculated it by the ratio between aboveground dry biomass yield (kg) of each pot (PY) and the amount of water consumed by the crop (ET) during the growth period:
With controlled water depth applied on pots with sealed bottom, no runoff or deep percolation occurred, and water use was strictly due to evaporation and transpiration processes. Thus, the daily water volume applied in each pot in order to maintain the pressure head values constant for each treatment throughout the experiment, was assumed as a proxy of evapotranspiration (ET) rate.

 ,
, 


