Epistasis and Quantitative Resistance to Pyricularia oryzae Revealed by GWAS in Advanced Rice Breeding Populations

 , ,
, , 
Abstract
:1. Introduction
2. Materials and Methods
2.1. Plant Material
2.2. Phenotyping of Disease Resistance and Pyricularia Oryzae Isolate
2.3. Genotyping
2.4. Population Structure and Genetic Background Analyses
2.5. GWAS Scans
2.6. QTL Identification
2.7. LD Blocks
2.8. Multilocus Models, Epistasis, and Candidate Locus Search
3. Results
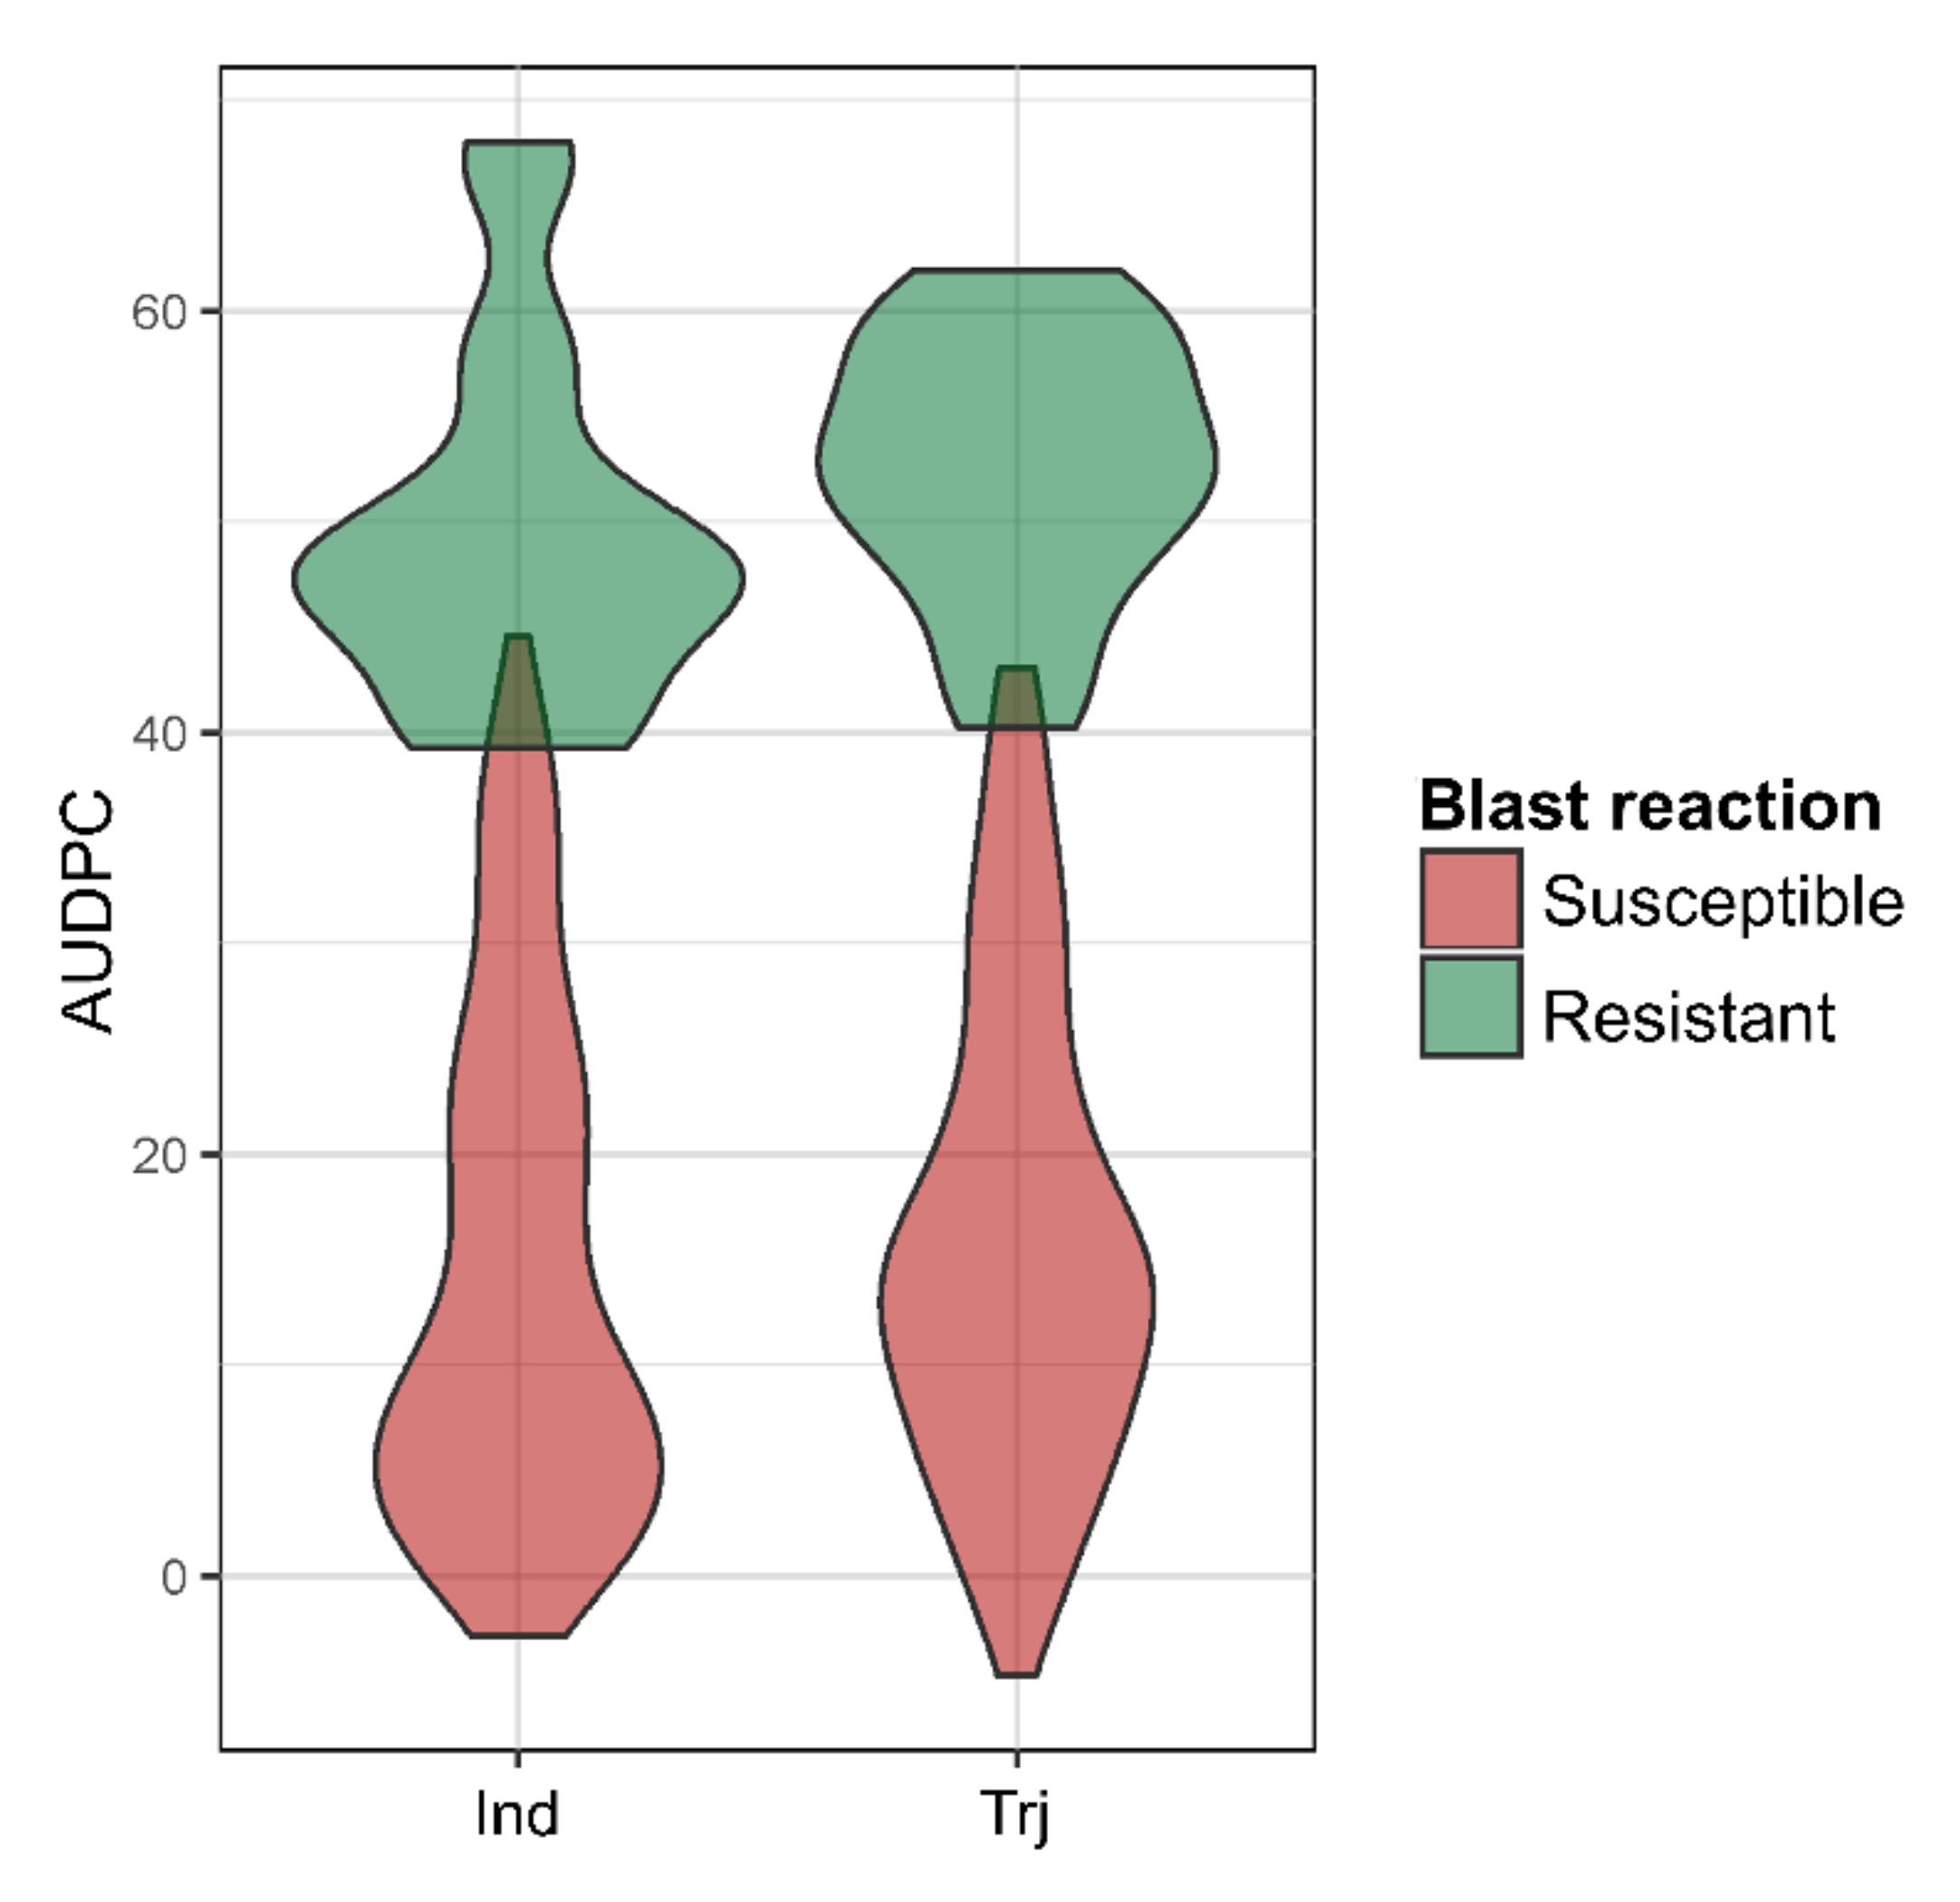
3.1. Phenotyping
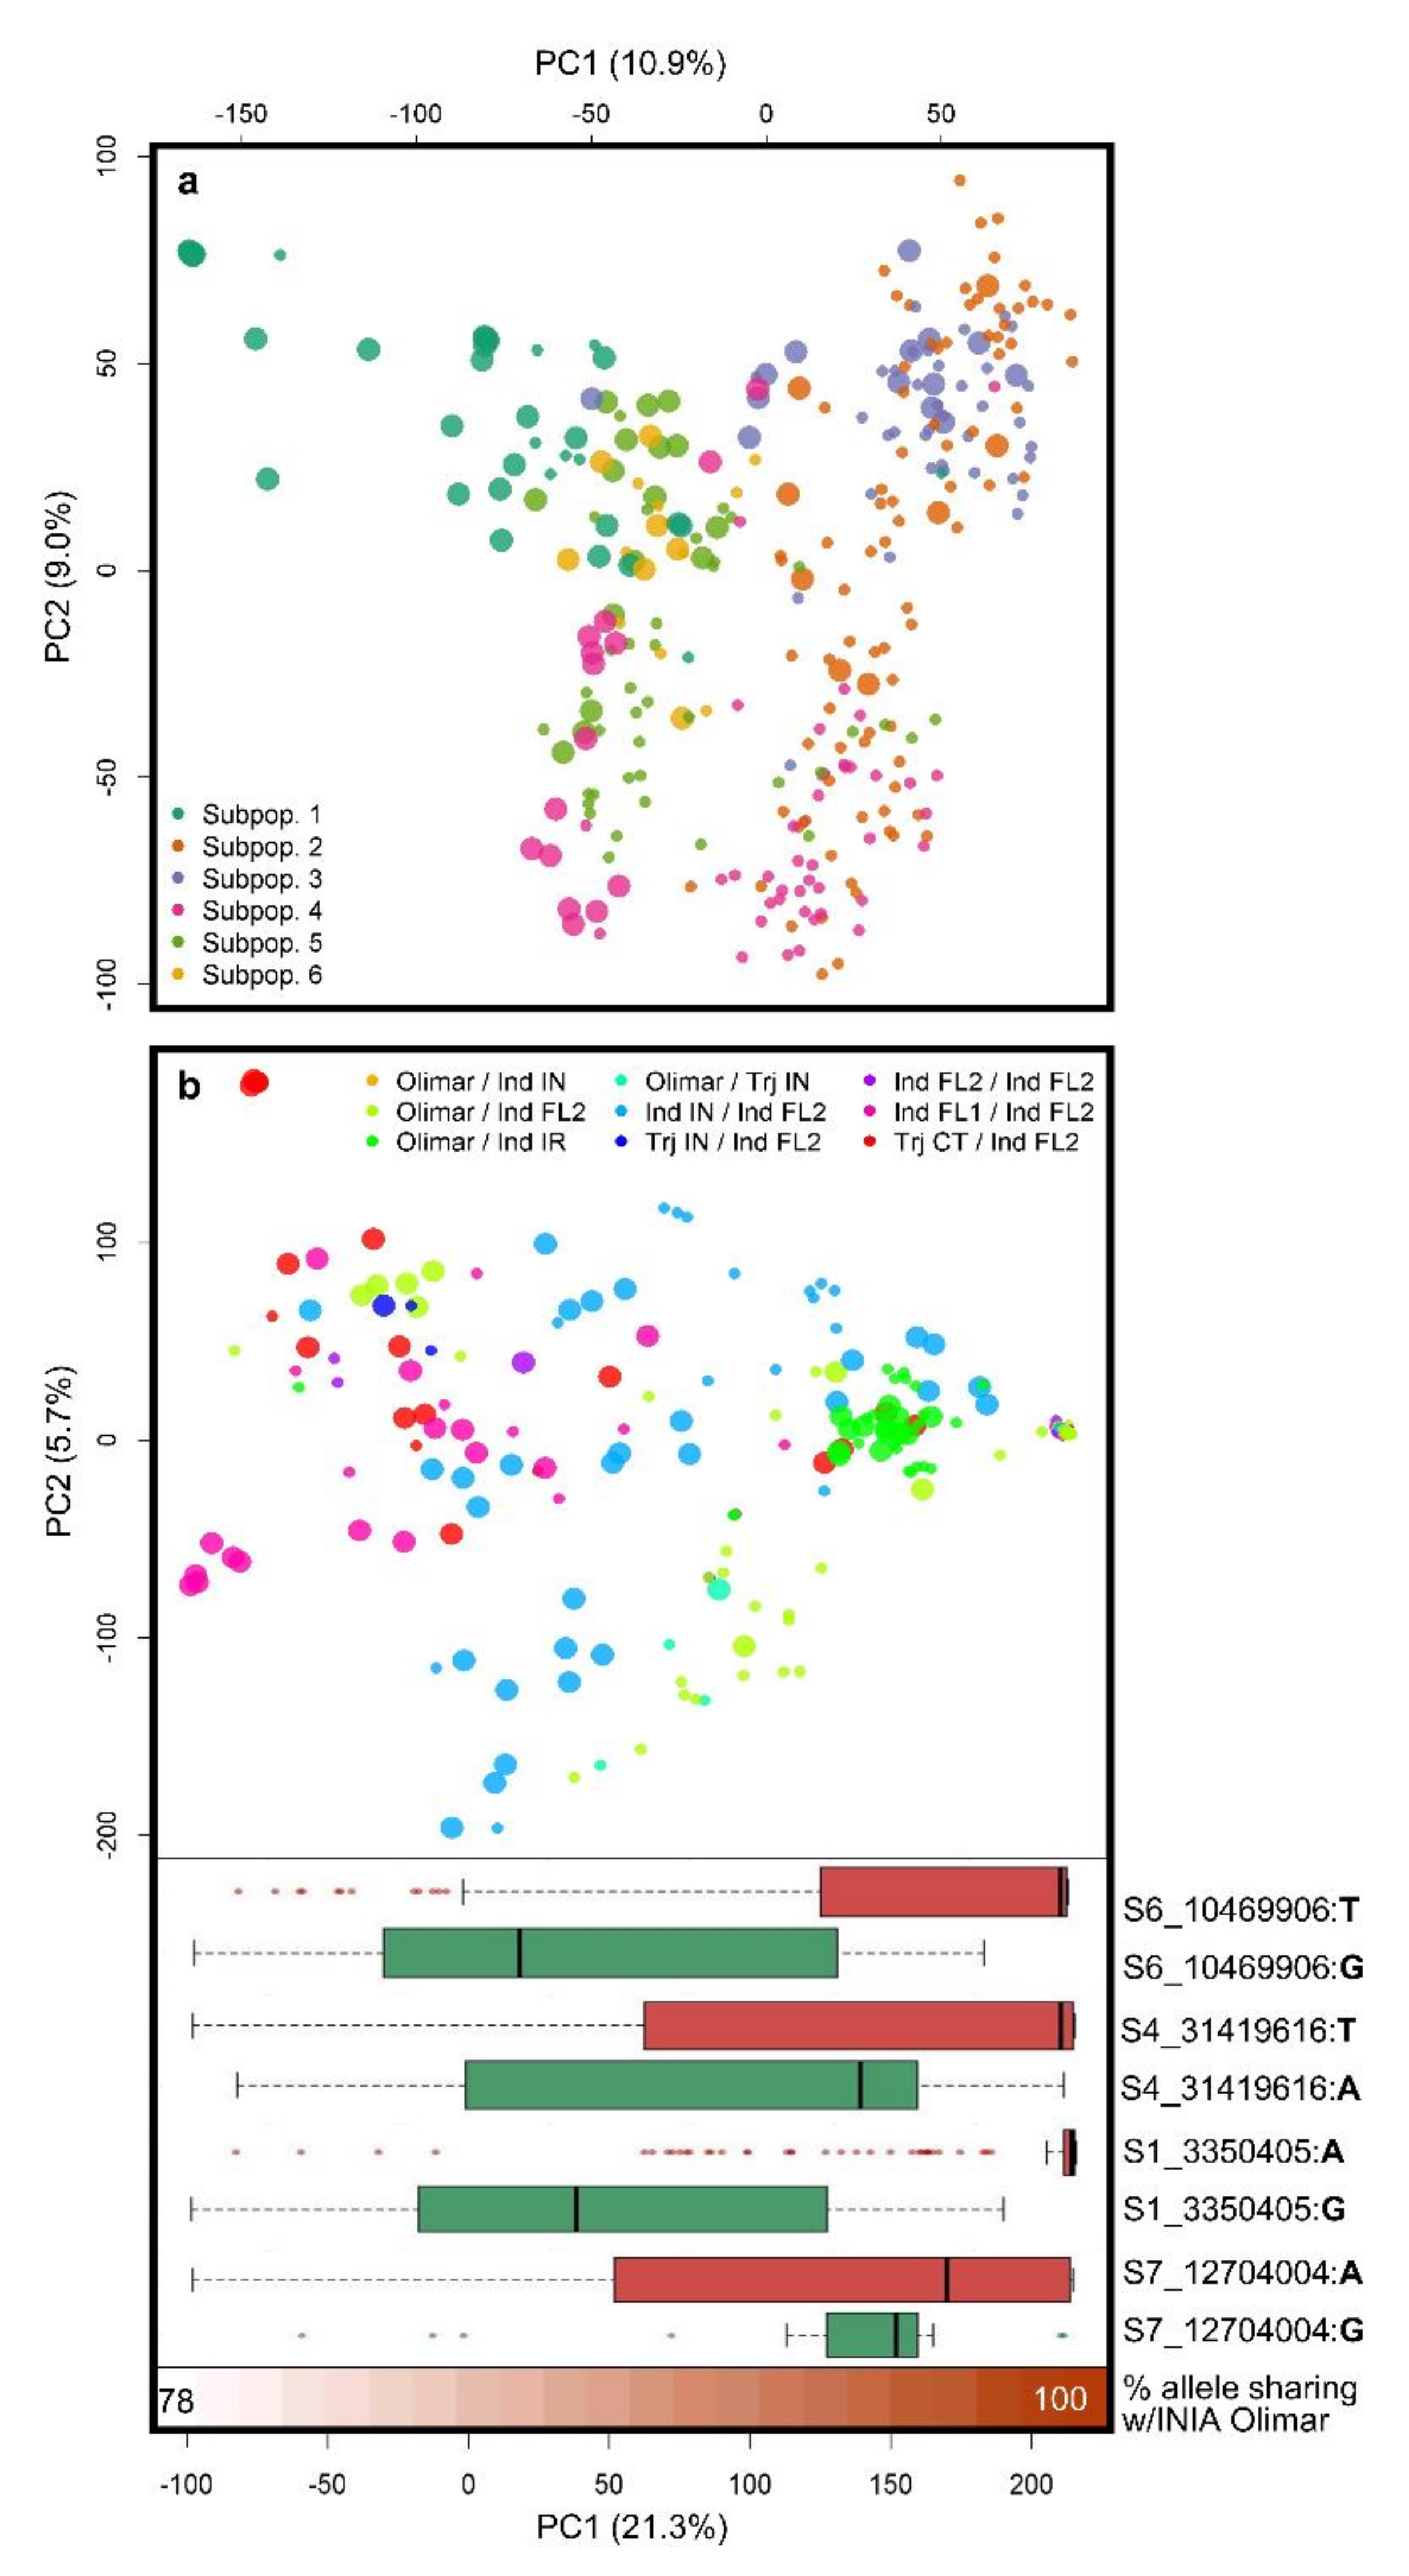
3.2. Population Structure
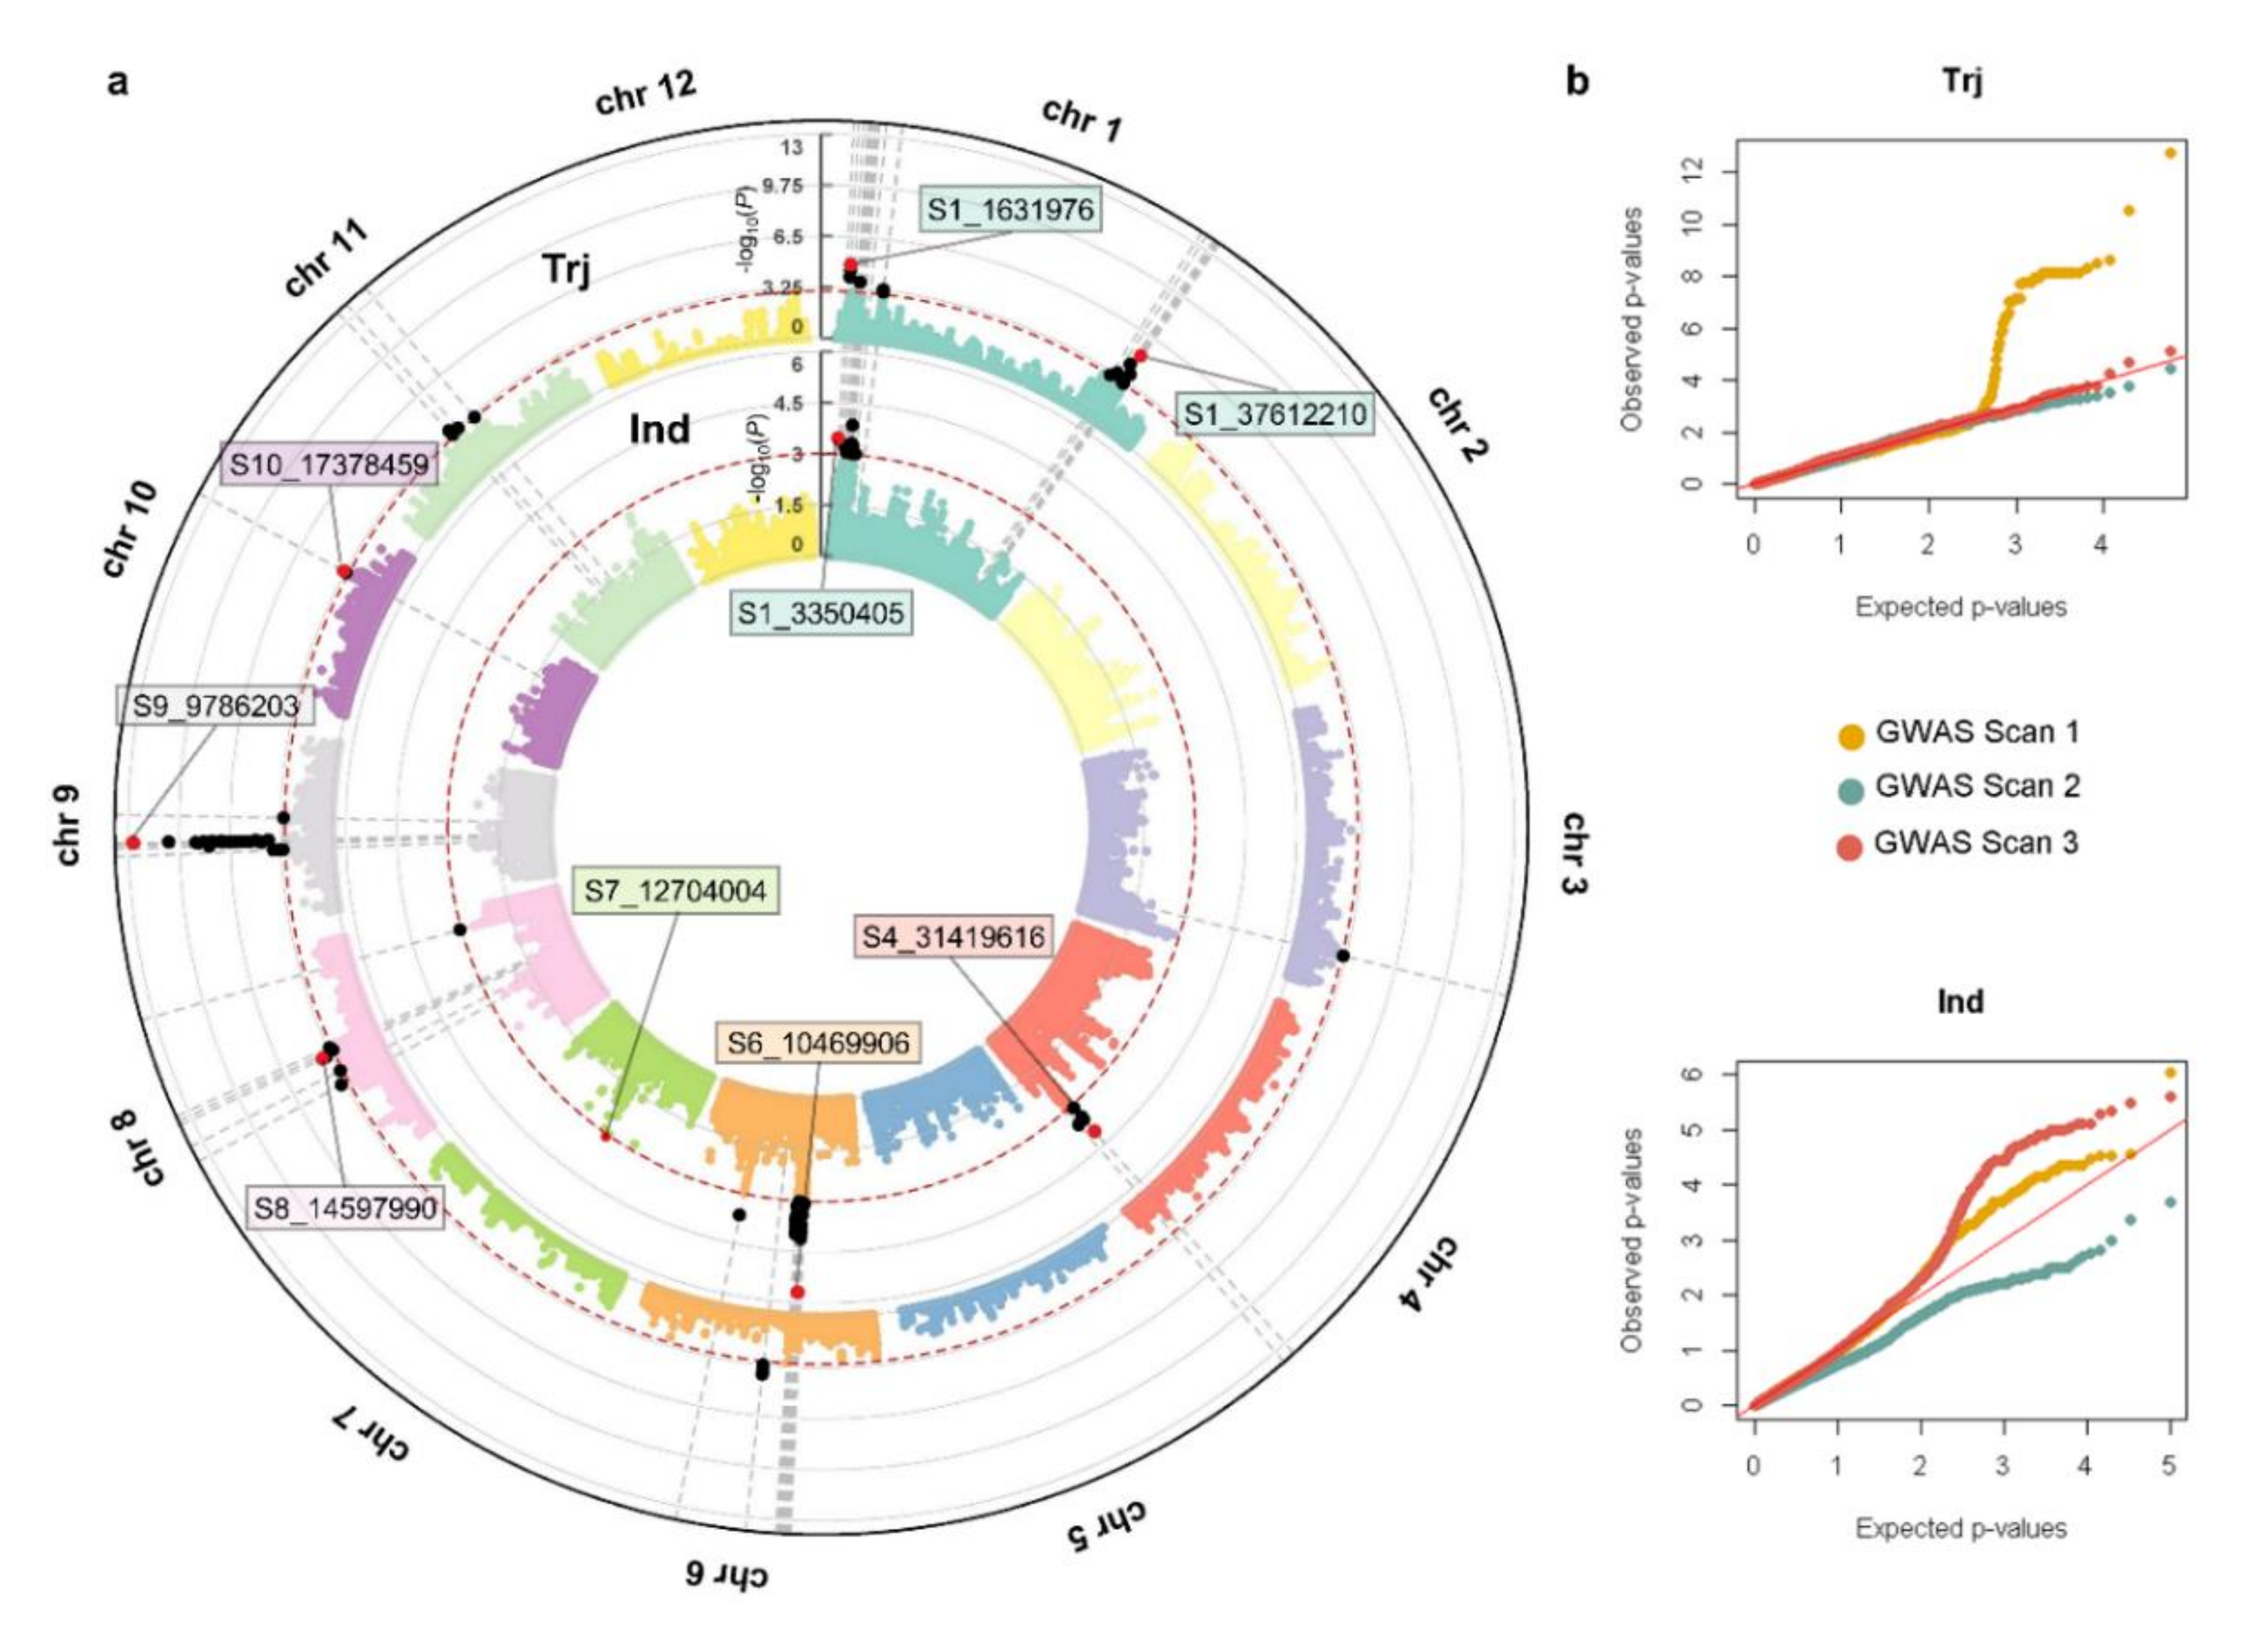
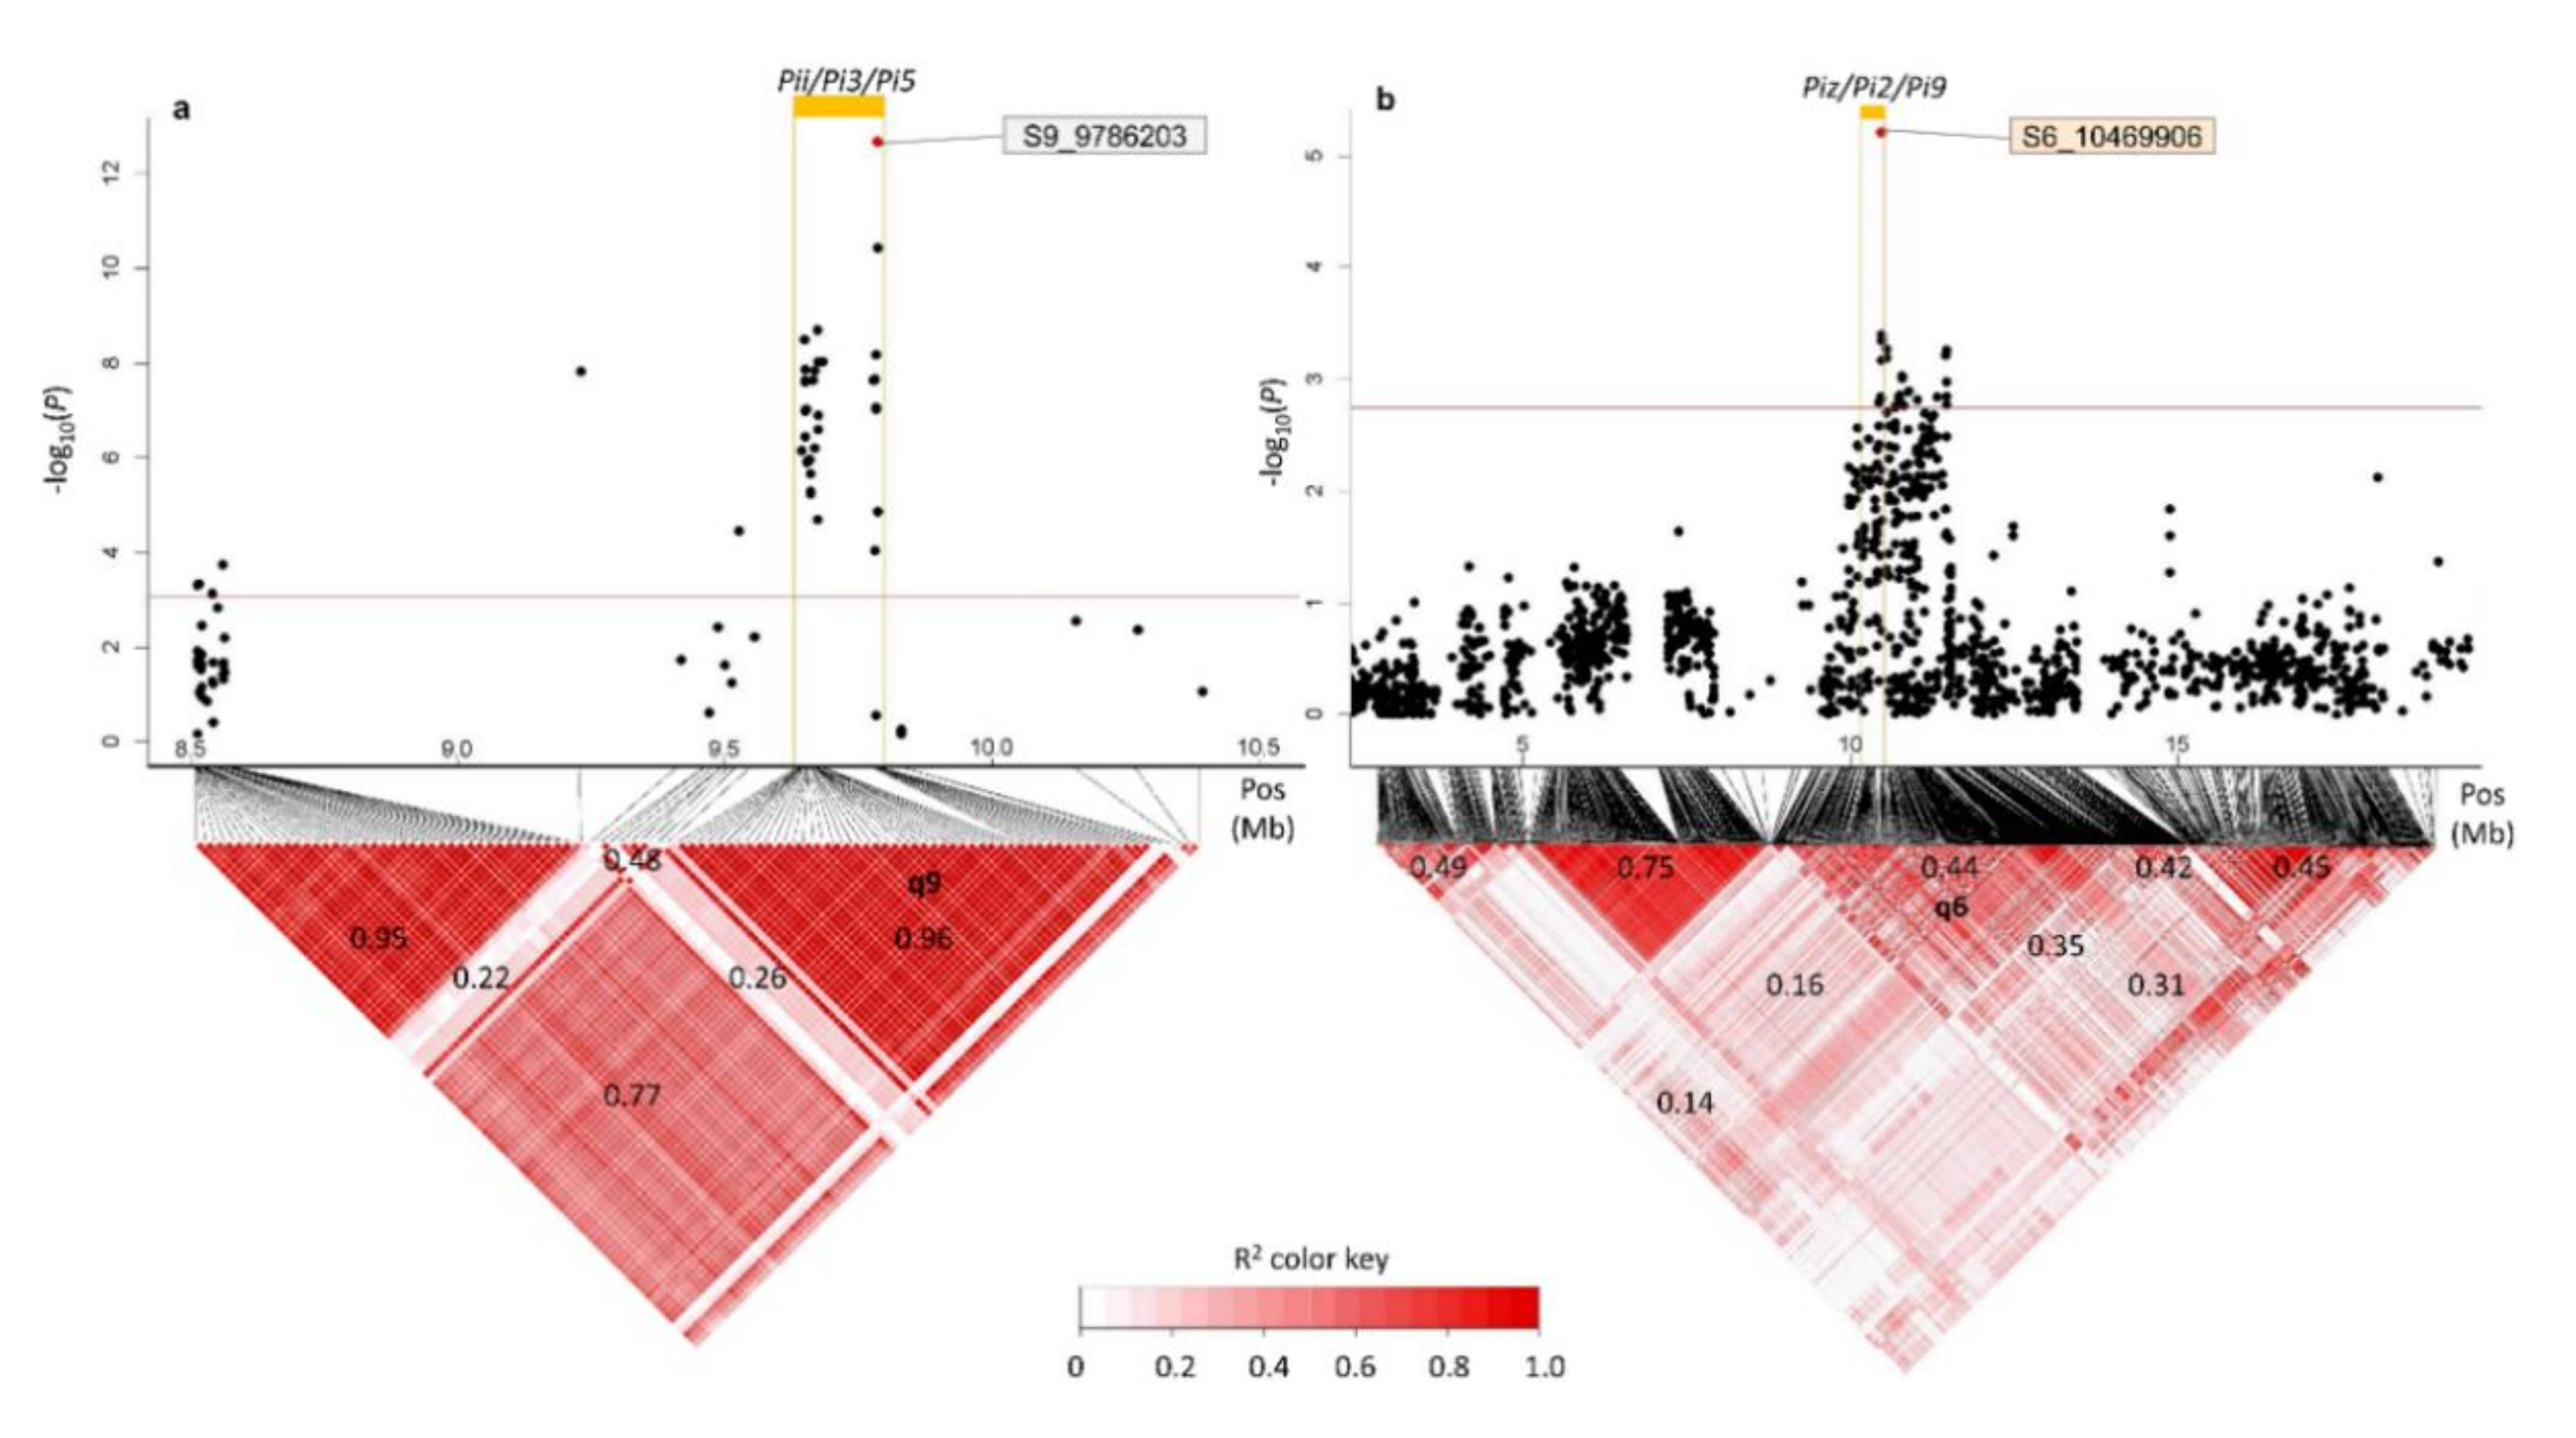
3.3. QTL Found in GWAS Scans 1, 2 and 3, and Colocalizing Reported Blast Resistance Loci
3.4. QTL by QTL Interaction
3.5. QTL by Genetic Background Interaction
4. Dscussion
5. Conclusions
Supplementary Materials
Author Contributions
Funding
Acknowledgments
Conflicts of Interest
References
- Khush, G.S. What It Will Take to Feed 5.0 Billion Rice Consumers in 2030. Plant Mol. Biol. 2005, 59, 1–6. [Google Scholar] [CrossRef] [PubMed]
- Khush, G.S.; Jena, K.K. Current Status and Future Prospects for Research on Blast Resistance in Rice. In Advances in Genetics, Genomics and Control of Rice Blast Disease; Wang, G.-L., Valent, B., Eds.; Springer: Dordrecht, The Netherlands, 2009; pp. 1–10. [Google Scholar] [CrossRef]
- Ashkani, S.; Rafii, M.Y.; Shabanimofrad, M.; Miah, G.; Sahebi, M.; Azizi, P.; Tanweer, F.A.; Akhtar, M.S.; Nasehi, A. Molecular Breeding Strategy and Challenges Towards Improvement of Blast Disease Resistance in Rice Crop. Front. Plant Sci. 2015, 6, 886. [Google Scholar] [CrossRef] [PubMed] [Green Version]
- Miah, G.; Rafii, M.Y.; Ismail, M.R.; Puteh, A.B.; Rahim, H.A.; Asfaliza, R.; Latif, M.A. Blast Resistance in Rice: A Review of Conventional Breeding to Molecular Approaches. Mol. Biol. Rep. 2013, 40, 2369–2388. [Google Scholar] [CrossRef]
- Liu, J.; Wan, X.; Mitchell, T.; Hu, Y.; Liu, X.; Dai, L.; Wang, G.-L. Recent Progress and Understanding of the Molecular Mechanisms of the Rice–Magnaporthe Oryzae Interaction. Mol. Plant Pathol. 2010, 11, 419–427. [Google Scholar] [CrossRef]
- Ashkani, S.; Rafii, M.Y.; Shabanimofrad, M.; Ghasemzadeh, A.; Ravanfar, S.A.; Latif, M.A. Molecular Progress on the Mapping and Cloning of Functional Genes for Blast Disease in Rice (Oryza sativa L.): Current Status and Future Considerations. Crit. Rev. Biotechnol. 2014, 36, 353–367. [Google Scholar] [CrossRef]
- Tanweer, F.A.; Rafii, M.Y.; Sijam, K.; Rahim, H.A.; Ahmed, F.; Ashkani, S.; Latif, M.A. Identification of Suitable Segregating SSR Markers for Blast Resistance in Rice Using Inheritance and Disease Reaction Analysis in Backcross Families. Australas. Plant Pathol. 2015, 44, 619–627. [Google Scholar] [CrossRef]
- Ballini, E.; Morel, J.-B.; Droc, G.; Price, A.; Courtois, B.; Notteghem, J.-L.; Tharreau, D. A Genome-Wide Meta-Analysis of Rice Blast Resistance Genes and Quantitative Trait Loci Provides New Insights into Partial and Complete Resistance. Mol. Plant Microbe Interact. 2008, 21, 859. [Google Scholar] [CrossRef]
- Wang, G.L.; Mackill, D.J.; Bonman, J.M.; McCouch, S.R.; Champoux, M.C.; Nelson, R.J. RFLP Mapping of Genes Conferring Complete and Partial Resistance to Blast in a Durably Resistant Rice Cultivar. Genetics 1994, 136, 1421–1434. [Google Scholar] [PubMed]
- Koide, Y.; Kobayashi, N.; Xu, D.; Fukuta, Y. Resistance Genes and Selection DNA Markers for Blast Disease in Rice (Oryza Sativa L.). Jpn. Agric. Res. Q. JARQ 2009, 4, 255–280. [Google Scholar] [CrossRef] [Green Version]
- Tacconi, G.; Baldassarre, V.; Lanzanova, C.; Faivre-Rampant, O.; Cavigiolo, S.; Urso, S.; Lupotto, E.; Valè, G. Polymorphism Analysis of Genomic Regions Associated with Broad-Spectrum Effective Blast Resistance Genes for Marker Development in Rice. Mol. Breed. 2010, 26, 595–617. [Google Scholar] [CrossRef]
- Miah, G.; Rafii, M.Y.; Ismail, M.R.; Puteh, A.B.; Rahim, H.A.; Islam, N.K.; Latif, M.A. A Review of Microsatellite Markers and Their Applications in Rice Breeding Programs to Improve Blast Disease Resistance. Int. J. Mol. Sci. 2013, 14, 22499–22528. [Google Scholar] [CrossRef] [PubMed] [Green Version]
- Hittalmani, S.; Parco, A.; Mew, T.V.; Zeigler, R.S.; Huang, N. Fine Mapping and DNA Marker-Assisted Pyramiding of the Three Major Genes for Blast Resistance in Rice. Theor. Appl. Genet. 2000, 100, 1121–1128. [Google Scholar] [CrossRef]
- Tabien, R.E.; Li, Z.; Paterson, A.H.; Marchetti, M.A.; Stansel, J.W.; Pinson, S.R.M.; Park, W.D. Mapping of Four Major Rice Blast Resistance Genes from “Lemont” and “Teqing” and Evaluation of Their Combinatorial Effect for Field Resistance. Theor. Appl. Genet. 2000, 101, 1215–1225. [Google Scholar] [CrossRef]
- Telebanco-Yanoria, M.J.; Koide, Y.; Fukuta, Y.; Imbe, T.; Kato, H.; Tsunematsu, H.; Kobayashi, N. Development of Near-Isogenic Lines of Japonica-Type Rice Variety Lijiangxintuanheigu as Differentials for Blast Resistance. Breed. Sci. 2010, 60, 629–638. [Google Scholar] [CrossRef] [Green Version]
- Fukuoka, S.; Saka, N.; Mizukami, Y.; Koga, H.; Yamanouchi, U.; Yoshioka, Y.; Hayashi, N.; Ebana, K.; Mizobuchi, R.; Yano, M. Gene Pyramiding Enhances Durable Blast Disease Resistance in Rice. Sci. Rep. 2015, 5, 7773. [Google Scholar] [CrossRef] [Green Version]
- Collard, B.C.Y.; Mackill, D.J. Marker-Assisted Selection: An Approach for Precision Plant Breeding in the Twenty-First Century. Philos. Trans. Soc. B 2008, 363, 557–572. [Google Scholar] [CrossRef] [Green Version]
- Holland, J.B. Genetic Architecture of Complex Traits in Plants. Curr. Opin. Plant Biol. 2007, 10, 156–161. [Google Scholar] [CrossRef] [PubMed]
- Jannink, J.-L. Identifying Quantitative Trait Locus by Genetic Background Interactions in Association Studies. Genetics 2007, 176, 553–561. [Google Scholar] [CrossRef] [Green Version]
- Bernardo, R. Molecular Markers and Selection for Complex Traits in Plants: Learning from the Last 20 Years. Crop Sci. 2008, 48, 1649. [Google Scholar] [CrossRef] [Green Version]
- Jannink, J.-L. QTL × Genetic Background Interaction: Predicting Inbred Progeny Value. Euphytica 2008, 161, 61–69. [Google Scholar] [CrossRef]
- Remington, D.L.; Thornsberry, J.M.; Matsuoka, Y.; Wilson, L.M.; Whitt, S.R.; Doebley, J.; Kresovich, S.; Goodman, M.M.; Buckler, E.S. Structure of Linkage Disequilibrium and Phenotypic Associations in the Maize Genome. Proc. Natl. Acad. Sci. USA 2001, 98, 11479–11484. [Google Scholar] [CrossRef] [PubMed] [Green Version]
- Arbelbide, M.; Bernardo, R. Mixed-Model QTL Mapping for Kernel Hardness and Dough Strength in Bread Wheat. Theor. Appl. Genet. 2006, 112, 885–890. [Google Scholar] [CrossRef] [PubMed]
- von Zitzewitz, J.; Cuesta-Marcos, A.; Condon, F.; Castro, A.J.; Chao, S.; Corey, A.; Filichkin, T.; Fisk, S.P.; Gutierrez, L.; Haggard, K.; et al. The Genetics of Winterhardiness in Barley: Perspectives from Genome-Wide Association Mapping. Plant Genome J. 2011, 4, 76–91. [Google Scholar] [CrossRef] [Green Version]
- Segura, V.; Vilhjálmsson, B.J.; Platt, A.; Korte, A.; Seren, Ü.; Long, Q.; Nordborg, M. An Efficient Multi-Locus Mixed-Model Approach for Genome-Wide Association Studies in Structured Populations. Nat. Genet. 2012, 44, 825–830. [Google Scholar] [CrossRef] [PubMed] [Green Version]
- Lipka, A.E.; Gore, M.A.; Magallanes-Lundback, M.; Mesberg, A.; Lin, H.; Tiede, T.; Chen, C.; Buell, C.R.; Buckler, E.S.; Rocheford, T.; et al. Genome-Wide Association Study and Pathway Level Analysis of Tocochromanol Levels in Maize Grain. G3 Genes Genomes Genet. 2013, 3, 1287–1292. [Google Scholar] [CrossRef] [Green Version]
- Locatelli, A.; Cuesta-Marcos, A.; Gutiérrez, L.; Hayes, P.M.; Smith, K.P.; Castro, A.J. Genome-Wide Association Mapping of Agronomic Traits in Relevant Barley Germplasm in Uruguay. Mol. Breed. 2013, 31, 631–654. [Google Scholar] [CrossRef]
- Gutiérrez, L.; Germán, S.; Pereyra, S.; Hayes, P.M.; Pérez, C.A.; Capettini, F.; Locatelli, A.; Berberian, N.M.; Falconi, E.E.; Estrada, R.; et al. Multi-Environment Multi-QTL Association Mapping Identifies Disease Resistance QTL in Barley Germplasm from Latin America. Theor. Appl. Genet. 2015, 128, 501–516. [Google Scholar] [CrossRef]
- Rosas, J.E.; Martínez, S.; Blanco, P.; Pérez de Vida, F.; Bonnecarrère, V.; Mosquera, G.; Cruz, M.; Garaycochea, S.; Monteverde, E.; McCouch, S.; et al. Resistance to Multiple Temperate and Tropical Stem and Sheath Diseases of Rice. Plant Genome J. 2018, 11, 1–13. [Google Scholar] [CrossRef] [Green Version]
- Hamblin, M.T.; Buckler, E.S.; Jannink, J.-L. Population Genetics of Genomics-Based Crop Improvement Methods. Trends Genet. 2011, 27, 98–106. [Google Scholar] [CrossRef]
- Zhang, X.; Yang, S.; Wang, J.; Jia, Y.; Huang, J.; Tan, S. A Genome-Wide Survey Reveals Abundant Rice Blast R-Genes in Resistant Cultivars. Plant J. 2016, 84, 20–28. [Google Scholar] [CrossRef] [Green Version]
- Begum, H.; Spindel, J.E.; Lalusin, A.; Borromeo, T.; Gregorio, G.; Hernandez, J.; Virk, P.; Collard, B.; McCouch, S.R. Genome-Wide Association Mapping for Yield and Other Agronomic Traits in an Elite Breeding Population of Tropical Rice (Oryza Sativa). PLoS ONE 2015, 10, e0119873. [Google Scholar] [CrossRef] [PubMed] [Green Version]
- Liang, S.; Wu, L.; Ren, G.; Zhao, X.; Zhou, M.; McNeil, D.; Ye, G. Genome-Wide Association Study of Grain Yield and Related Traits Using a Collection of Advanced Indica Rice Breeding Lines for Irrigated Ecosystems. Field Crop. Res. 2016, 193, 70–86. [Google Scholar] [CrossRef]
- Quero, G.; Gutiérrez, L.; Monteverde, E.; Blanco, P.; Pérez de Vida, F.; Rosas, J.; Fernández, S.; Garaycochea, S.; McCouch, S.; Berberian, N.; et al. Genome-Wide Association Study Using Historical Breeding Populations Discovers Genomic Regions Involved in High-Quality Rice. Plant Genome J. 2018, 11, 1–12. [Google Scholar] [CrossRef] [Green Version]
- Bandillo, N.; Raghavan, C.; Muyco, P.A.; Sevilla, M.A.L.; Lobina, I.T.; Dilla-Ermita, C.J.; Tung, C.-W.; McCouch, S.; Thomson, M.; Mauleon, R.; et al. Multi-Parent Advanced Generation Inter-Cross (MAGIC) Populations in Rice: Progress and Potential for Genetics Research and Breeding. Rice 2013, 6, 11. [Google Scholar] [CrossRef] [PubMed] [Green Version]
- Wang, C.; Yang, Y.; Yuan, X.; Xu, Q.; Feng, Y.; Yu, H.; Wang, Y. Genome-Wide Association Study of Blast Resistance in Indica Rice. BMC Plant Biol. 2014, 14, 311. [Google Scholar] [CrossRef] [PubMed] [Green Version]
- Shinada, H.; Yamamoto, T.; Sato, H.; Yamamoto, E.; Hori, K.; Yonemaru, J.; Sato, T.; Fujino, K. Quantitative Trait Loci for Rice Blast Resistance Detected in a Local Rice Breeding Population by Genome-Wide Association Mapping. Breed. Sci. 2015, 65, 388–395. [Google Scholar] [CrossRef] [Green Version]
- Kang, H.; Wang, Y.; Peng, S.; Zhang, Y.; Xiao, Y.; Wang, D.; Qu, S.; Li, Z.; Yan, S.; Wang, Z.; et al. Dissection of the Genetic Architecture of Rice Resistance to the Blast Fungus Magnaporthe Oryzae. Mol. Plant Pathol. 2016, 17, 6. [Google Scholar] [CrossRef] [PubMed] [Green Version]
- Raboin, L.-M.; Ballini, E.; Tharreau, D.; Ramanantsoanirina, A.; Frouin, J.; Courtois, B.; Ahmadi, N. Association Mapping of Resistance to Rice Blast in Upland Field Conditions. Rice 2016, 9, 59. [Google Scholar] [CrossRef] [Green Version]
- Li, Z.; Pinson, S.R.M.; Park, I.W.D.; Paterson, A.H.; Stanselt, J.W. Epistasis for Three Grain Yield Components in Rice. Genetics 1997, 145, 453–465. [Google Scholar]
- Lin, H.X.; Yamamoto, T.; Sasaki, T.; Yano, M. Characterization and Detection of Epistatic Interactions of 3 QTLs, Hd1, Hd2, and Hd3, Controlling Heading Date in Rice Using Nearly Isogenic Lines. Theor. Appl. Genet. 2000, 101, 1021–1028. [Google Scholar] [CrossRef]
- Xing, Y.Z.; Tan, Y.F.; Hua, J.P.; Sun, X.L.; Xu, C.G.; Zhang, Q. Characterization of the Main Effects, Epistatic Effects and Their Environmental Interactions of QTLs on the Genetic Basis of Yield Traits in Rice. Theor. Appl. Genet. 2002, 105, 248–257. [Google Scholar] [CrossRef] [PubMed]
- Fan, C.C.; Yu, X.Q.; Xing, Y.Z.; Xu, C.G.; Luo, L.J.; Zhang, Q. The Main Effects, Epistatic Effects and Environmental Interactions of QTLs on the Cooking and Eating Quality of Rice in a Doubled-Haploid Line Population. Theor. Appl. Genet. 2005, 110, 1445–1452. [Google Scholar] [CrossRef] [PubMed]
- Wang, Z.; Cheng, J.; Chen, Z.; Huang, J.; Bao, Y.; Wang, J.; Zhang, H. Identification of QTLs with Main, Epistatic and QTL × Environment Interaction Effects for Salt Tolerance in Rice Seedlings under Different Salinity Conditions. Theor. Appl. Genet. 2012, 125, 807–815. [Google Scholar] [CrossRef] [PubMed]
- Urso, S.; Desiderio, F.; Biselli, C.; Bagnaresi, P.; Crispino, L.; Piffanelli, P.; Abbruscato, P.; Assenza, F.; Guarnieri, G.; Cattivelli, L.; et al. Genetic Analysis of Durable Resistance to Magnaporthe Oryzae in the Rice Accession Gigante Vercelli Identified Two Blast Resistance Loci. Mol. Genet. Genom. 2016, 291, 17–32. [Google Scholar] [CrossRef]
- Blanco, P.; Pérez de Vida, F.; Píriz, M. INIA Tacuarí. Nueva Variedad de Arroz Precoz de Alto Rendimiento. Bol. Divulg. INIA 1993, 31, 5–10. [Google Scholar]
- Molina, F.; Blanco, P.; Pérez, F. Nuevo Cultivar de Arroz L5502 Parao, Caracteristicas y Comportamiento. Arroz 2011, 29, 28–34. [Google Scholar]
- Yan, W.; Rutger, J.N.; Bryant, R.J.; Bockelman, H.E.; Fjellstrom, R.G.; Chen, M.-H.; Tai, T.H.; McClung, A.M. Development and Evaluation of a Core Subset of the USDA Rice Germplasm Collection. Crop Sci. 2007, 47, 869–876. [Google Scholar] [CrossRef]
- Blanco, P.; Molina, F.; Pérez de Vida, F.; Avila, S.; Lavecchia, A.; Marchesi, C.; Deambrosi, E.; Mendez, R.; Saldain, N.; Roel, A.; et al. INIA Olimar, Características y Comportamiento en la Zafra 2003–2004. Arroz 2004, 39, 40–48. [Google Scholar]
- Bonman, J.M.; de Dios, T.I.; Khin, M.M. Physiologic Specialization of Pyricularia oryzae in the Philippines. Plant Dis. 1986, 70, 767–769. [Google Scholar] [CrossRef] [Green Version]
- De Mendiburu, F.; Yaseen, M. Agricolae: Statistical Procedures for Agricultural Research. R Package Version 1.4.0. Available online: https://CRAN.R-project.org/package=agricolae (accessed on 29 October 2020).
- R Core Team. R: A Language and Environment for Statistical Computing. Version 4.0.3. Available online: https://www.R-project.org/ (accessed on 29 October 2020).
- Simko, I.; Piepho, H.P. The Area under the Disease Progress Stairs: Calculation, Advantage, and Application. Phytopathology 2012, 102, 381–389. [Google Scholar] [CrossRef] [Green Version]
- Bates, D.; Mächler, M.; Bolker, B.M.; Walker, S.C. Fitting Linear Mixed-Effects Models Using Lme4. J. Stat. Softw. 2015, 67, 1. [Google Scholar] [CrossRef]
- Cullis, B.R.; Smith, A.B.; Coombes, N.E. On the Design of Early Generation Variety Trials with Correlated Data. J. Agric. Biol. Environ. Stat. 2006, 11, 381–393. [Google Scholar] [CrossRef]
- Holland, J.; Nyquist, W.; Cervantes, C. Estimating and Interpreting Heritability for Plant Breeding: An Update. In Plant Breeding Reviews; Janick, J., Ed.; John Wiley & Sons, Inc.: Hoboken, NJ, USA, 2003; pp. 9–112. [Google Scholar]
- Canty, A.; Ripley, B.D. Boot: Bootstrap Functions. R Package Version 1.3-25. Available online: https://cran.r-project.org/package=boot (accessed on 29 October 2020).
- Titone, P.; Mongiano, G.; Tamborini, L. Resistance to Neck Blast Caused by Pyricularia Oryzae in Italian Rice Cultivars. Eur. J. Plant Pathol. 2015, 142, 49–59. [Google Scholar] [CrossRef] [Green Version]
- Elshire, R.J.; Glaubitz, J.C.; Sun, Q.; Poland, J.A.; Kawamoto, K.; Buckler, E.S.; Mitchell, S.E. A Robust, Simple Genotyping-by-Sequencing (GBS) Approach for High Diversity Species. PLoS ONE 2011, 6, e19379. [Google Scholar] [CrossRef] [PubMed] [Green Version]
- Glaubitz, J.C.; Casstevens, T.M.; Lu, F.; Harriman, J.; Elshire, R.J.; Sun, Q.; Buckler, E.S. TASSEL-GBS: A high capacity genotyping by sequencing analysis pipeline. PLoS ONE 2014, 9, e90346. [Google Scholar] [CrossRef]
- Kawahara, Y.; de la Bastide, M.; Hamilton, J.P.; Kanamori, H.; McCombie, W.R.; Ouyang, S.; Schwartz, D.C.; Tanaka, T.; Wu, J.; Zhou, S.; et al. Improvement of the Oryza sativa Nipponbare reference genome using next generation sequence and optical map data. Rice 2013, 6, 4. [Google Scholar] [CrossRef] [Green Version]
- Li, H.; Durbin, R. Fast and accurate short read alignment with Burrows–Wheeler transform. Bioinformatics 2009, 25, 1754–1760. [Google Scholar] [CrossRef] [Green Version]
- Endelman, J.B.; Jannink, J.-L. Shrinkage Estimation of the Realized Relationship Matrix. G3 Genes Genomes Genet. 2012, 2, 1405–1413. [Google Scholar] [CrossRef]
- Endelman, J.B. Ridge Regression and Other Kernels for Genomic Selection with R Package rrBLUP. Plant Genome J. 2011, 4, 250–255. [Google Scholar] [CrossRef] [Green Version]
- Li, J.; Ji, L. Adjusting Multiple Testing in Multilocus Analyses Using the Eigenvalues of a Correlation Matrix. Heredity 2005, 95, 221–227. [Google Scholar] [CrossRef] [Green Version]
- Shin, J.-H.; Blay, S.; McNeney, B.; Graham, J. LDheatmap: An R Function for Graphical Display of Pairwise Linkage Disequilibria between Single Nucleotide Polymorphisms. J. Stat. Softw. 2006, 16, 3. [Google Scholar] [CrossRef] [Green Version]
- Ziyatdinov, A.; Vázquez-Santiago, M.; Brunel, H.; Martinez-Pérez, A.; Aschard, H.; Soria, J.M. Lme4qtl: Linear Mixed Models with Flexible Covariance Structure for Genetic Studies of Related Individuals. BMC Bioinform. 2018, 19, 68. [Google Scholar] [CrossRef]
- Lenth, R. Emmeans: Estimated Marginal Means, Aka Least-Squares Means. R Package Version 1.5-2-1. Available online: https://cran.r-project.org/package=emmeans (accessed on 29 October 2020).
- Yonemaru, J.I.; Yamamoto, T.; Fukuoka, S.; Uga, Y.; Hori, K.; Yano, M. Q-TARO: QTL Annotation Rice Online Database. Rice 2010, 3, 194–203. [Google Scholar] [CrossRef] [Green Version]
- Alexandrov, N.; Tai, S.; Wang, W.; Mansueto, L.; Palis, K.; Fuentes, R.R.; Ulat, V.J.; Chebotarov, D.; Zhang, G.; Li, Z.; et al. SNP-Seek Database of SNPs Derived from 3000 Rice Genomes. Nucleic Acids Res. 2015, 43, D1023–D1027. [Google Scholar] [CrossRef]
- Linscombe, S.D.; Jodari, F.; McKenzie, K.S.; Bollich, P.K.; White, L.M.; Groth, D.E.; Dunand, T.T. Registration of ‘Cypress’ Rice. Crop Sci. 1993, 33, 355. [Google Scholar] [CrossRef]
- Bollich, C.N.; Webb, B.D.; Marchetti, M.A.; Scott, J.E. Registration of “Gulfmont” Rice. Crop Sci. 1990, 30, 1159–1160. [Google Scholar] [CrossRef]
- Johnston, T.H.; Kuenzel, K.A.; Lee, F.N.; Wells, B.R.; Henry, S.E.; Sunderman, D.W.; O’Connell, B.; Walker, A.K.; Schmitthenner, A.F.; Hartwig, E.E. Registration of Newbonnet Rice. Crop Sci. 1984, 24, 209–210. [Google Scholar] [CrossRef]
- Bollich, C.N.; Webb, B.D.; Marchetti, M.A.; Scott, J.E. Registration of Lemont Rice. Crop Sci. 1985, 25, 883–885. [Google Scholar] [CrossRef]
- Lee, S.K.; Song, M.Y.; Seo, Y.S.; Kim, H.K.; Ko, S.; Cao, P.J.; Suh, J.P.; Yi, G.; Roh, J.H.; Lee, S.; et al. Rice Pi5-Mediated Resistance to Magnaporthe oryzae Requires the Presence of Two Coiled-Coil-Nucleotide-Binding-Leucine-Rich Repeat Genes. Genetics 2009, 181, 1627–1638. [Google Scholar] [CrossRef] [Green Version]
- Wang, Y.; Wang, D.; Deng, X.; Liu, J.; Sun, P.; Liu, Y.; Huang, H.; Jiang, N.; Kang, H.; Ning, Y.; et al. Molecular Mapping of the Blast Resistance Genes Pi2-1 and Pi51(t) in the Durably Resistant Rice “Tianjingyeshengdao”. Phytopathology 2012, 102, 779–786. [Google Scholar] [CrossRef] [Green Version]
- Liu, G.; Lu, G.; Zeng, L.; Wang, G.L. Two Broad-Spectrum Blast Resistance Genes, Pi9(t) and Pi2(t) Are Physically Linked on Rice Chromosome 6. Mol. Genet. Genom. 2002, 267, 472–480. [Google Scholar] [CrossRef]
- Jeon, J.-S.; Chen, D.; Yi, G.-H.; Wang, G.L.; Ronald, P.C. Genetic and Physical Mapping of Pi5(t) a Locus Associated with Broad-Spectrum Resistance to Rice Blast. Mol. Gen. Genom. 2003, 269, 280–289. [Google Scholar] [CrossRef] [Green Version]
- DeYoung, B.J.; Innes, R.W. Plant NBS-LRR Proteins in Pathogen Sensing and Host Defense. Nat. Immunol. 2006, 7, 1243–1249. [Google Scholar] [CrossRef]
- Matsui, H.; Miyao, A.; Takahashi, A.; Hirochika, H. Pdk1 Kinase Regulates Basal Disease Resistance Through the OsOxi1—OsPti1a Phosphorylation Cascade in Rice. Plant Cell Physiol. 2010, 51, 2082–2091. [Google Scholar] [CrossRef]
- Ebitani, T.; Hayashi, N.; Omoteno, M.; Ozaki, H.; Yano, M.; Moriikawa, M.; Fukuta, Y. Characterization of Pi13, a Blast Resistance Gene that Maps to Chromosome 6 in Indica Rice (Oryza Sativa L.) Variety, Kasalath. Breed. Sci. 2011, 61, 251–259. [Google Scholar] [CrossRef] [Green Version]
- Xu, X.; Hayashi, N.; Pikahei, Á.; Pi, Á. Rice Blast Resistance Gene Pikahei-1(t) a Member of a Resistance Gene Cluster on Chromosome 4, Encodes a Nucleotide-Binding Site and Leucine-Rich Repeat Protein. Mol. Breed. 2014, 34, 691–700. [Google Scholar] [CrossRef]
- Liu, M.H.; Kang, H.; Xu, Y.; Peng, Y.; Wang, D.; Gao, L.; Wang, X.; Ning, Y.; Wu, J.; Liu, W.; et al. Genome-Wide Association Study Identifies an NLR Gene That Confers Partial Resistance to Magnaporthe oryzae in Rice. Plant Biotechnol. J. 2020, 18, 1376–1383. [Google Scholar] [CrossRef] [Green Version]
- Xie, K.; Chen, J.; Wang, Q.; Yang, Y. Direct Phosphorylation and Activation of a Mitogen-Activated Protein Kinase by a Calcium-Dependent Protein Kinase in Rice. Plant Cell 2014, 26, 3077–3089. [Google Scholar] [CrossRef] [Green Version]
- Marone, D.; Russo, M.A.; Laidò, G.; De Leonardis, A.M.; Mastrangelo, A.M. Plant Nucleotide Binding Site-Leucine-Rich Repeat (NBS-LRR) Genes: Active Guardians in Host Defense Responses. Int. J. Mol. Sci. 2013, 14, 7302–7326. [Google Scholar] [CrossRef] [Green Version]
- Lee, H.A.; Yeom, S.I. Plant NB-LRR Proteins: Tightly Regulated Sensors in a Complex Manner. Brief. Funct. Genom. 2015, 14, 233–242. [Google Scholar] [CrossRef] [Green Version]
- Timmerman-Vaughan, G.M.; Moya, L.; Frew, T.J.; Murray, S.R.; Crowhurst, R. Ascochyta Blight Disease of Pea (Pisum Sativum L.): Defense-Related Candidate Genes Associated with QTL Regions and Identification of Epistatic QTL. Theor. Appl. Genet. 2016, 129, 879–896. [Google Scholar] [CrossRef]
- Sirithunya, P.; Tragoonrung, S.; Vanavichit, A.; Pa-In, N.; Vongsaprom, C.; Toojinda, T. Quantitative Trait Loci Associated with Leaf and Neck Blast Resistance in Recombinant Inbred Line Population of Rice (Oryza Sativa). DNA Res. 2002, 9, 79–88. [Google Scholar] [CrossRef] [Green Version]
- Wu, J.L.; Fan, Y.Y.; Li, D.B.; Zheng, K.L.; Leung, H.; Zhuang, J.Y. Genetic Control of Rice Blast Resistance in the Durably Resistant Cultivar Gumei 2 against Multiple Isolates. Theor. Appl. Genet. 2005, 111, 50–56. [Google Scholar] [CrossRef]
- Li, Y.B.; Wu, C.J.; Jiang, G.H.; Wang, L.Q.; He, Y.Q. Dynamic Analyses of Rice Blast Resistance for the Assessment of Genetic and Environmental Effects. Plant Breed. 2007, 126, 541–547. [Google Scholar] [CrossRef]
Publisher’s Note: MDPI stays neutral with regard to jurisdictional claims in published maps and institutional affiliations. |
© 2020 by the authors. Licensee MDPI, Basel, Switzerland. This article is an open access article distributed under the terms and conditions of the Creative Commons Attribution (CC BY) license (http://creativecommons.org/licenses/by/4.0/).
Share and Cite
Rosas, J.E.; Escobar, M.; Martínez, S.; Blanco, P.; Pérez, F.; Quero, G.; Gutiérrez, L.; Bonnecarrère, V. Epistasis and Quantitative Resistance to Pyricularia oryzae Revealed by GWAS in Advanced Rice Breeding Populations. Agriculture 2020, 10, 622. https://doi.org/10.3390/agriculture10120622
Rosas JE, Escobar M, Martínez S, Blanco P, Pérez F, Quero G, Gutiérrez L, Bonnecarrère V. Epistasis and Quantitative Resistance to Pyricularia oryzae Revealed by GWAS in Advanced Rice Breeding Populations. Agriculture. 2020; 10(12):622. https://doi.org/10.3390/agriculture10120622
Chicago/Turabian StyleRosas, Juan E., Maia Escobar, Sebastián Martínez, Pedro Blanco, Fernando Pérez, Gastón Quero, Lucía Gutiérrez, and Victoria Bonnecarrère. 2020. "Epistasis and Quantitative Resistance to Pyricularia oryzae Revealed by GWAS in Advanced Rice Breeding Populations" Agriculture 10, no. 12: 622. https://doi.org/10.3390/agriculture10120622