Market Integration and Price Transmission in the Vertical Supply Chain of Rice: An Evidence from Bangladesh


Abstract
:1. Introduction
- (i)
- To analyze short-run and long-run vertical price relationships among farm, wholesale and retail rice markets in Bangladesh.
- (ii)
- To examine the magnitude, speed and, nature of price transmission among vertically separated upstream and downstream markets of rice in Bangladesh.
- (iii)
- To determine the existence of shocks that can make rice market be asymmetric in Bangladesh.
2. Methodology
2.1. Data and Data Sources
2.2. Model Selection and Specification
2.2.1. Stationarity Test
2.2.2. Modeling Rice Price Relstionship among Market Channels
2.2.3. Modeling Causality to Identify Price Leadership
2.2.4. Modeling Magnitude, Speed and Nature of Price Transmission
2.2.5. Modeling Threshold Effect in Price Transmission and Asymmetry Confirmation
3. Results and Discussion
3.1. Stationarity Test
3.2. Co-Integration Analysis
3.3. Testing Causality in the Johansen Vector Error Correction Model (VECM)
3.4. Price Transmission Analysis by Asymmetric Error Correction Model
3.5. Non-Linear Price Transmission Analysis by TAR and M-TAR Model
3.6. Limitations
4. Conclusions
Author Contributions
Funding
Acknowledgments
Conflicts of Interest
Appendix A

| Lag | LR | FPE | AIC | SC | HQ |
|---|---|---|---|---|---|
| 0 | NA | 7.64 × 10⁻⁷ | −5.571373 | −5.501686 | −5.543073 |
| 1 | 656.5394 | 3.09/109 | −11.08120 | −10.80245 * | −10.96799 * |
| 2 | 17.56566 * | 3.08/109 * | −11.08664 * | −10.59883 | −10.88854 |
| 3 | 8.773931 | 3.30/109 | −11.01641 | −10.31953 | −10.73340 |
| 4 | 16.78309 | 3.28/109 | −11.02326 | −10.11732 | −10.65535 |
| Lag | LR | FPE | AIC | SC | HQ |
|---|---|---|---|---|---|
| 0 | NA | 0.000223 | −2.734494 | −2.688036 | −2.715628 |
| 1 | 441.6655 | 5.46/106 | −6.442747 | −6.303372 | −6.386146 |
| 2 | 18.53178 | 4.97/106 | −6.537226 | −6.304935 * | −6.442892 * |
| 3 | 8.256243 | 4.94/106 | −6.543623 | −6.218416 | −6.411555 |
| 4 | 11.18582 * | 4.77/106 * | −6.577730 * | −6.159606 | −6.407928 |
| 5 | 1.672779 | 5.02/106 | −6.526410 | −6.015370 | −6.318874 |
| 6 | 1.089080 | 5.32/106 | −6.469922 | −5.865965 | −6.224652 |
| 7 | 0.407322 | 5.67/106 | −6.407134 | −5.710261 | −6.124131 |
| 8 | 1.327303 | 5.99/106 | −6.353354 | −5.563565 | −6.032617 |
| Lag | LR | FPE | AIC | SC | HQ |
|---|---|---|---|---|---|
| 0 | NA | 8.78/105 | −3.665167 | −3.618708 | −3.646300 |
| 1 | 503.3772 * | 1.27/106 * | −7.900869* | −7.761495 * | −7.844268 * |
| 2 | 3.055629 | 1.32/106 | −7.860773 | −7.628482 | −7.766439 |
| 3 | 1.714242 | 1.39/106 | −7.809277 | −7.484069 | −7.677209 |
| 4 | 6.444439 | 1.40/106 | −7.800668 | −7.382544 | −7.630866 |
| 5 | 7.486049 | 1.40/106 | −7.802681 | −7.291641 | −7.595145 |
| 6 | 5.268256 | 1.43/106 | −7.785250 | −7.181294 | −7.539981 |
| 7 | 3.203863 | 1.48/106 | −7.749096 | −7.052224 | −7.466093 |
| 8 | 4.207150 | 1.52/106 | −7.723276 | −6.933487 | −7.402539 |


References
- Conforti, P. Price transmission in selected agricultural markets. In FAO Commodity and Trade Policy Research Working Paper No. 7; Food and Agriculture Organization (FAO): Rome, Italy, 2004. [Google Scholar]
- Asche, F.; Jaffry, S.; Hartmann, J. Price transmission and market integration: Vertical and horizontal price linkages for salmon. Appl. Econ. 2007, 39, 2535–2545. [Google Scholar] [CrossRef]
- Mottaleb, K.A.; Mishra, A.K. Rice consumption and grain-type preference by household: A Bangladesh case. J. Agric. Appl. Econ. 2016, 48, 298–319. [Google Scholar] [CrossRef] [Green Version]
- United States Department of Agriculture (USDA). Production, Import, Supply and Distribution Online Database; Foreign Agriculture Service; United States Department of Agriculture: Washington, DC, USA, 2019. Available online: https://apps.fas.usda.gov/psdonline (accessed on 4 August 2019).
- Alam, M.J.; McKenzie, A.M.; Buysse, J.; Begum, I.A.; Wailes, E.J.; Van Huylenbroeck, G. Asymmetry Price Transmission in the Deregulated Rice Markets in Bangladesh: Asymmetric Error Correction Model. Agribusiness 2016, 32, 498–511. [Google Scholar] [CrossRef]
- Zaki-Uz, Z.; Mishima, T.; Hisano, S.; Gergely, M.C. The Role of Rice Processing Industries in Bangladesh: A Case Study of Sherpur District. Hokkaido Univ. Agric. Econ. 2001, 57, 121–133. [Google Scholar]
- Goletti, F.A.; Farid, N.R. Structural determinants of rice market integration: The case of rice markets in Bangladesh. Dev. Econ. 1995, 33, 185–202. [Google Scholar] [CrossRef]
- Dawson, P.J.; Dey, P.K. Testing for the law of one price: Rice market integration in Bangladesh. J. Int. Dev. 2002, 14, 473–484. [Google Scholar] [CrossRef]
- Engle, R.F.; Granger, C.W.J. Co-integration and Error Correction: Representation, Estimation, and Testing. Econometrica 1987, 55, 251–276. [Google Scholar] [CrossRef]
- Johansen, S. Statistical analysis of cointegration vectors. J. Econ. Dyn. Control 1988, 12, 231–254. [Google Scholar] [CrossRef]
- Johansen, S. Estimation and Hypothesis Testing of Cointegration Vectors in Gaussian Vector Autoregressive Models. Econom. J. Econom. Soc. 1991, 1551–1580. [Google Scholar] [CrossRef]
- Dickey, D.; Fuller, W. Distribution of the estimators for autoregressive time series with a unit root. J. Am. Stat. Assoc. 1979, 74, 427–431. [Google Scholar]
- Ng, S.; Perron, P. Unit Root Tests in ARMA Models with Data-Dependent Methods for the Selection of the Truncation Lag. J. Am. Stat. Assoc. 1995, 90, 268–281. [Google Scholar] [CrossRef]
- Newey, W.; Kenneth, W. Automatic lag selection in covariance matrix estimation. Rev. Econ. Stud. 1994, 61, 631–653. [Google Scholar] [CrossRef]
- Gujarati, D.N. Basic Econometrics; Tata McGraw-Hill Education: New Delhi, India, 2009. [Google Scholar]
- Mosconi, R.; Giannini, C. Non-causality in cointegrated systems: Representation, estimation and testing. Oxf. Bull. Econ. Stat. 1992, 54, 399–417. [Google Scholar] [CrossRef]
- Dolado, J.; Lutkepohl, H. Making Wald tests for cointegrated VAR systems. Econom. Rev. 1996, 15, 369–386. [Google Scholar] [CrossRef]
- Houck, J.P. Nonreversible and Estimating an Approach to Specifying Functions. Am. J. Agric. Econ. 1977, 59, 570–572. [Google Scholar] [CrossRef]
- Mohanty, S.; Peterson, E.W.F.; Kruse, N.C. Price asymmetry in the international wheat market. Can. J. Agric. Econ. 1995, 43, 355–366. [Google Scholar] [CrossRef]
- Peltzman, S. Prices Rise Faster than They Fall. J. Political Econ. 2000, 108, 466–502. [Google Scholar] [CrossRef]
- Bart, M.; Steven, K. Retail margins, price transmission and price asymmetry in urban food markets: The case of Kinshasa (Zaire). J. Afr. Econ. 2000, 9, 1–23. [Google Scholar]
- Aguiar, D.; Santana, J.A. Asymmetry in farm to retail price transmission: Evidence for Brazil. Agribusiness 2002, 18, 37–48. [Google Scholar] [CrossRef]
- Von Cramon-Taubadel, S.; Loy, J.P. Price asymmetry in the international wheat market: Comment. Can. J. Agric. Econ. 1996, 44, 311–317. [Google Scholar] [CrossRef]
- Von Cramon-taubadel, S. Estimating asymmetric price transmission with the error correction representation: An application to the German pork market. Eur. Rev. Agric. Econ. 1998, 25, 1–18. [Google Scholar] [CrossRef]
- Abdulai, A. Spatial price transmission and asymmetry in the Ghanaian maize market. J. Dev. Econ. 2000, 63, 327–349. [Google Scholar] [CrossRef]
- Michela, C.; Kirsten, J. Asymmetric price transmission and market concentration: An investigation into four South African agro-food industries. S. Afr. J. Econ. 2006, 74, 323–333. [Google Scholar]
- Van, C. Modeling trends in food market integration: Method and application to Tanzanian maize markets. Food Policy 2007, 32, 112–127. [Google Scholar]
- Gomez, M.I.; Richards, T.J.; Lee, J. Trade promotions and consumer search in supermarket retailing. Am. J. Agric. Econ. 2013, 95, 1209–1215. [Google Scholar] [CrossRef]
- Kuiper, W.E.; Lutz, C.; Van Tilburg, A. Vertical price leadership on local maize markets in Benin. J. Dev. Econ. 2003, 71, 417–433. [Google Scholar] [CrossRef] [Green Version]
- Enders, W.; Siklos, P.L. Cointegration and Threshold Adjustment. J. Bus. Econ. Stat. 2001, 19, 166–167. [Google Scholar] [CrossRef] [Green Version]
- Ndoricimpa, A.; Achandi, L.E. Are current account deficits sustainable in EAC countries? Evidence from Threshold Cointegration. Econ. Bull. 2014, 34, 1990–2001. [Google Scholar]
- Chan, K.S. Consistency and Limiting Distribution of the Least Squares Estimator of a Threshold Autoregressive Model. Ann. Stat. 1993, 21, 520–533. [Google Scholar] [CrossRef]
- Acquah, H.D. Threshold Cointegration Analysis of Asymmetric Adjustments. Russ. J. Agric. Socio-Econ. Sci. 2012, 8, 21–25. [Google Scholar]
- Alam, M.J.; Jha, R. Asymmetric threshold vertical price transmission in wheat and flour markets in Dhaka (Bangladesh): Seemingly unrelated regression analysis. In ASARC Working Papers; The Australian National University, Australia South Asia Research Centre: Canberra, Australia, 2016. [Google Scholar]
- Griffith, G.R.; Piggott, N. Asymmetry in Beef, Lamb and Pork Farm-Retail Price Transmission in Australia. Agric. Econ. 1994, 10, 307–316. [Google Scholar]
- Bettendorf, L.; Verboven, F. Incomplete transmission of coffee bean prices: Evidence from the Dutch coffee market. Eur. Rev. Agric. Econ. 2000, 27, 1–16. [Google Scholar] [CrossRef]
- Moorthy, S. A general theory of pass-through in channels with category management and retail competition. Mark. Sci. 2005, 24, 110–122. [Google Scholar] [CrossRef]
- Buckle, R.A.; Carlson, J.A. Inflation and asymmetric price adjustment. Rev. Econ. Stat. 2000, 82, 157–160. [Google Scholar] [CrossRef]
- Chavas, J.P.; Mehta, A. Price Dynamics in a Vertical Sector: The Case of Butter. Am. J. Agric. Econ. 2004, 86, 1078–1093. [Google Scholar] [CrossRef] [Green Version]
- Richards, T.J.; Gomez, M.I.; Lee, J. Pass-through and consumer search: An empirical analysis. Am. J. Agric. Econ. 2014, 96, 1049–1069. [Google Scholar] [CrossRef] [Green Version]
- Reagan, P.B.; Weitzman, M.L. Asymmetries in price and quantity adjustments by the competitive firm. J. Econ. Theory 1982, 27, 410–420. [Google Scholar] [CrossRef]
- Cui, T.H.; Raju, J.S.; Zhang, Z.J. A price discrimination model of trade promotion. Mark. Sci. 2008, 27, 779–795. [Google Scholar] [CrossRef] [Green Version]
- Bailey, D.; Brorsen, B.W. Price Asymmetry in Spatial Fed Cattle Markets. West. J. Agric. Econ. 1989, 14, 246–252. [Google Scholar]
- Kumar, N.; Rajiv, S.; Jeuland, A. Effectiveness of trade promotions: Analyzing the determinants of retail pass through. Mark. Sci. 2001, 20, 382–404. [Google Scholar] [CrossRef] [Green Version]
- Lee, J.; Gomez, M.I. Impacts of the end of the coffee export quota system on international-to-retail price transmission. J. Agric. Econ. 2013, 64, 343–362. [Google Scholar] [CrossRef] [Green Version]
- Kinnucan, H.W.; Forker, O.D. Asymmetry in farm-retail price transmission for major dairy products. Am. J. Agric. Econ. 1987, 69, 285–292. [Google Scholar] [CrossRef]


| Sources of Causations | Hypotheses | Price Leadership Decisions | Causality Decisions |
|---|---|---|---|
| Long-run causality | No price leadership | Bidirectional | |
| Farm leads Wholesale Retail leads Wholesale | Unidirectional | ||
| Wholesale leads Farm Wholesale leads Retail | Unidirectional | ||
| Short-run causality | No price leadership | Bidirectional | |
| Farm leads Wholesale Retail leads Wholesale | Unidirectional | ||
| Wholesale leads Farm Wholesale leads Retail | Unidirectional | ||
| Strong exogeneity | No price leadership | Bidirectional | |
| Farm leads Wholesale Retail leads Wholesale | Unidirectional | ||
| Wholesale leads Farm Wholesale leads Retail | Unidirectional |
| Price Series/Tests | Level Data | First Differences | Order of Integration | |||
|---|---|---|---|---|---|---|
| γ-statc | γ-statc,t | γ-statw | I(d) | |||
| Farm Price (FP) | ||||||
| ADF | −2.68 | −3.70 | −8.11 *** | I(1) | ||
| PP | −2.47 | −2.91 | −8.17 *** | |||
| Wholesale Price (WP) | ||||||
| ADF | −2.65 | −3.38 | −9.31 *** | I(1) | ||
| PP | −2.24 | −2.69 | −9.69*** | |||
| Retail Price (RP) | ||||||
| ADF | −2.57 | −3.89 | −9.37 *** | I(1) | ||
| PP | −2.55 | −2.97 | −9.94 *** | |||
| Critical Values | γ-statc | γ-statc,t | γ-statw | |||
| Level of Significance | 1% | 5% | 1% | 5% | 1% | 5% |
| ADF | −3.48 | −2.88 | −4.03 | −3.45 | −2.58 | −1.94 |
| PP | −3.48 | −2.88 | −4.03 | −3.45 | −2.58 | −1.94 |
| Retail, Wholesale and Farm Level | ||||
|---|---|---|---|---|
| Co-Integration Rank (r) | ||||
| r = 0 vs. | 41.94848 *** | 29.79707 | 21.23827 ** | 21.13162 |
| r ≤ 1 vs. | 20.71021 *** | 15.49471 | 14.12689 * | 14.26460 |
| r ≤ 2 vs. | 6.583319 ** | 3.841466 | 6.583319 ** | 3.841466 |
| Causality Test | |||
|---|---|---|---|
| Sources of Causations | Dependent Variable ∆FP | Dependent Variable ∆WP | Causality Decision |
| Long-run causality | vs. 7.196448 ** [0.0073] | vs. 0.895 [0.3442] | Unidirectional (Wholesale → Farm) |
| Short-run causality | vs. 5.64240 [0.1304] | vs. 10.12207 ** [0.0176] | Unidirectional (Farm → Wholesale) |
| Strong exogeneity | vs. 15.30817 ** [0.0041] | vs. 20.10853 ** [0.0005] | Bidirectional (Wholesale ⬌ Farm) |
| Causality Test | |||
|---|---|---|---|
| Sources of Causations | Dependent Variable ∆RP | Dependent Variable ∆WP | Causality Decision |
| Long-run causality | vs. 11.24899 ** [0.0008] | vs. 0.512 [0.4743] | Unidirectional (Wholesale → Retail) |
| Short-run causality | vs. 2.621539 * [0.0954] | vs. 0.1277 [0.7207] | Unidirectional (Wholesale → Retail) |
| Strong exogeneity | vs. 17.61459 ** [0.0041] | vs. 0.627841 [0.7306] | Unidirectional (Wholesale → Retail) |
| Farm-Wholesale | Retail-Wholesale | ||||
|---|---|---|---|---|---|
| Regressors | Coefficients | t-Statistics | Regressors | Coefficients | t-Statistics |
| 0.288555 ** | 2.891544 | −0.132748 | −1.504456 | ||
| 0.025737 | 0.246374 | 0.583457 *** | 8.474050 | ||
| −0.008676 | −0.079020 | 0.139843 * | 1.884684 | ||
| 0.061633 | 0.558938 | 0.089580 | 1.086427 | ||
| 0.505198 ** | 3.387956 | 0.068034 | 0.737192 | ||
| 0.218602 | 0.984663 | ||||
| 0.003069 | 0.018612 | ||||
| 0.009870 | 0.043138 | ||||
| 0.085525 | 0.512652 | ||||
| −0.076931 | −0.360297 | ||||
| 0.213523 * | 1.692238 | ||||
| 0.187891 | 0.916896 | ||||
| −0.038645 | −0.242151 | ||||
| −0.048874 | −0.254390 | ||||
| −0.299727 * | −1.892067 | −0.106754 ** | −2.558078 | ||
| −0.157633 * | −1.932706 | −0.181382 ** | −2.200916 | ||
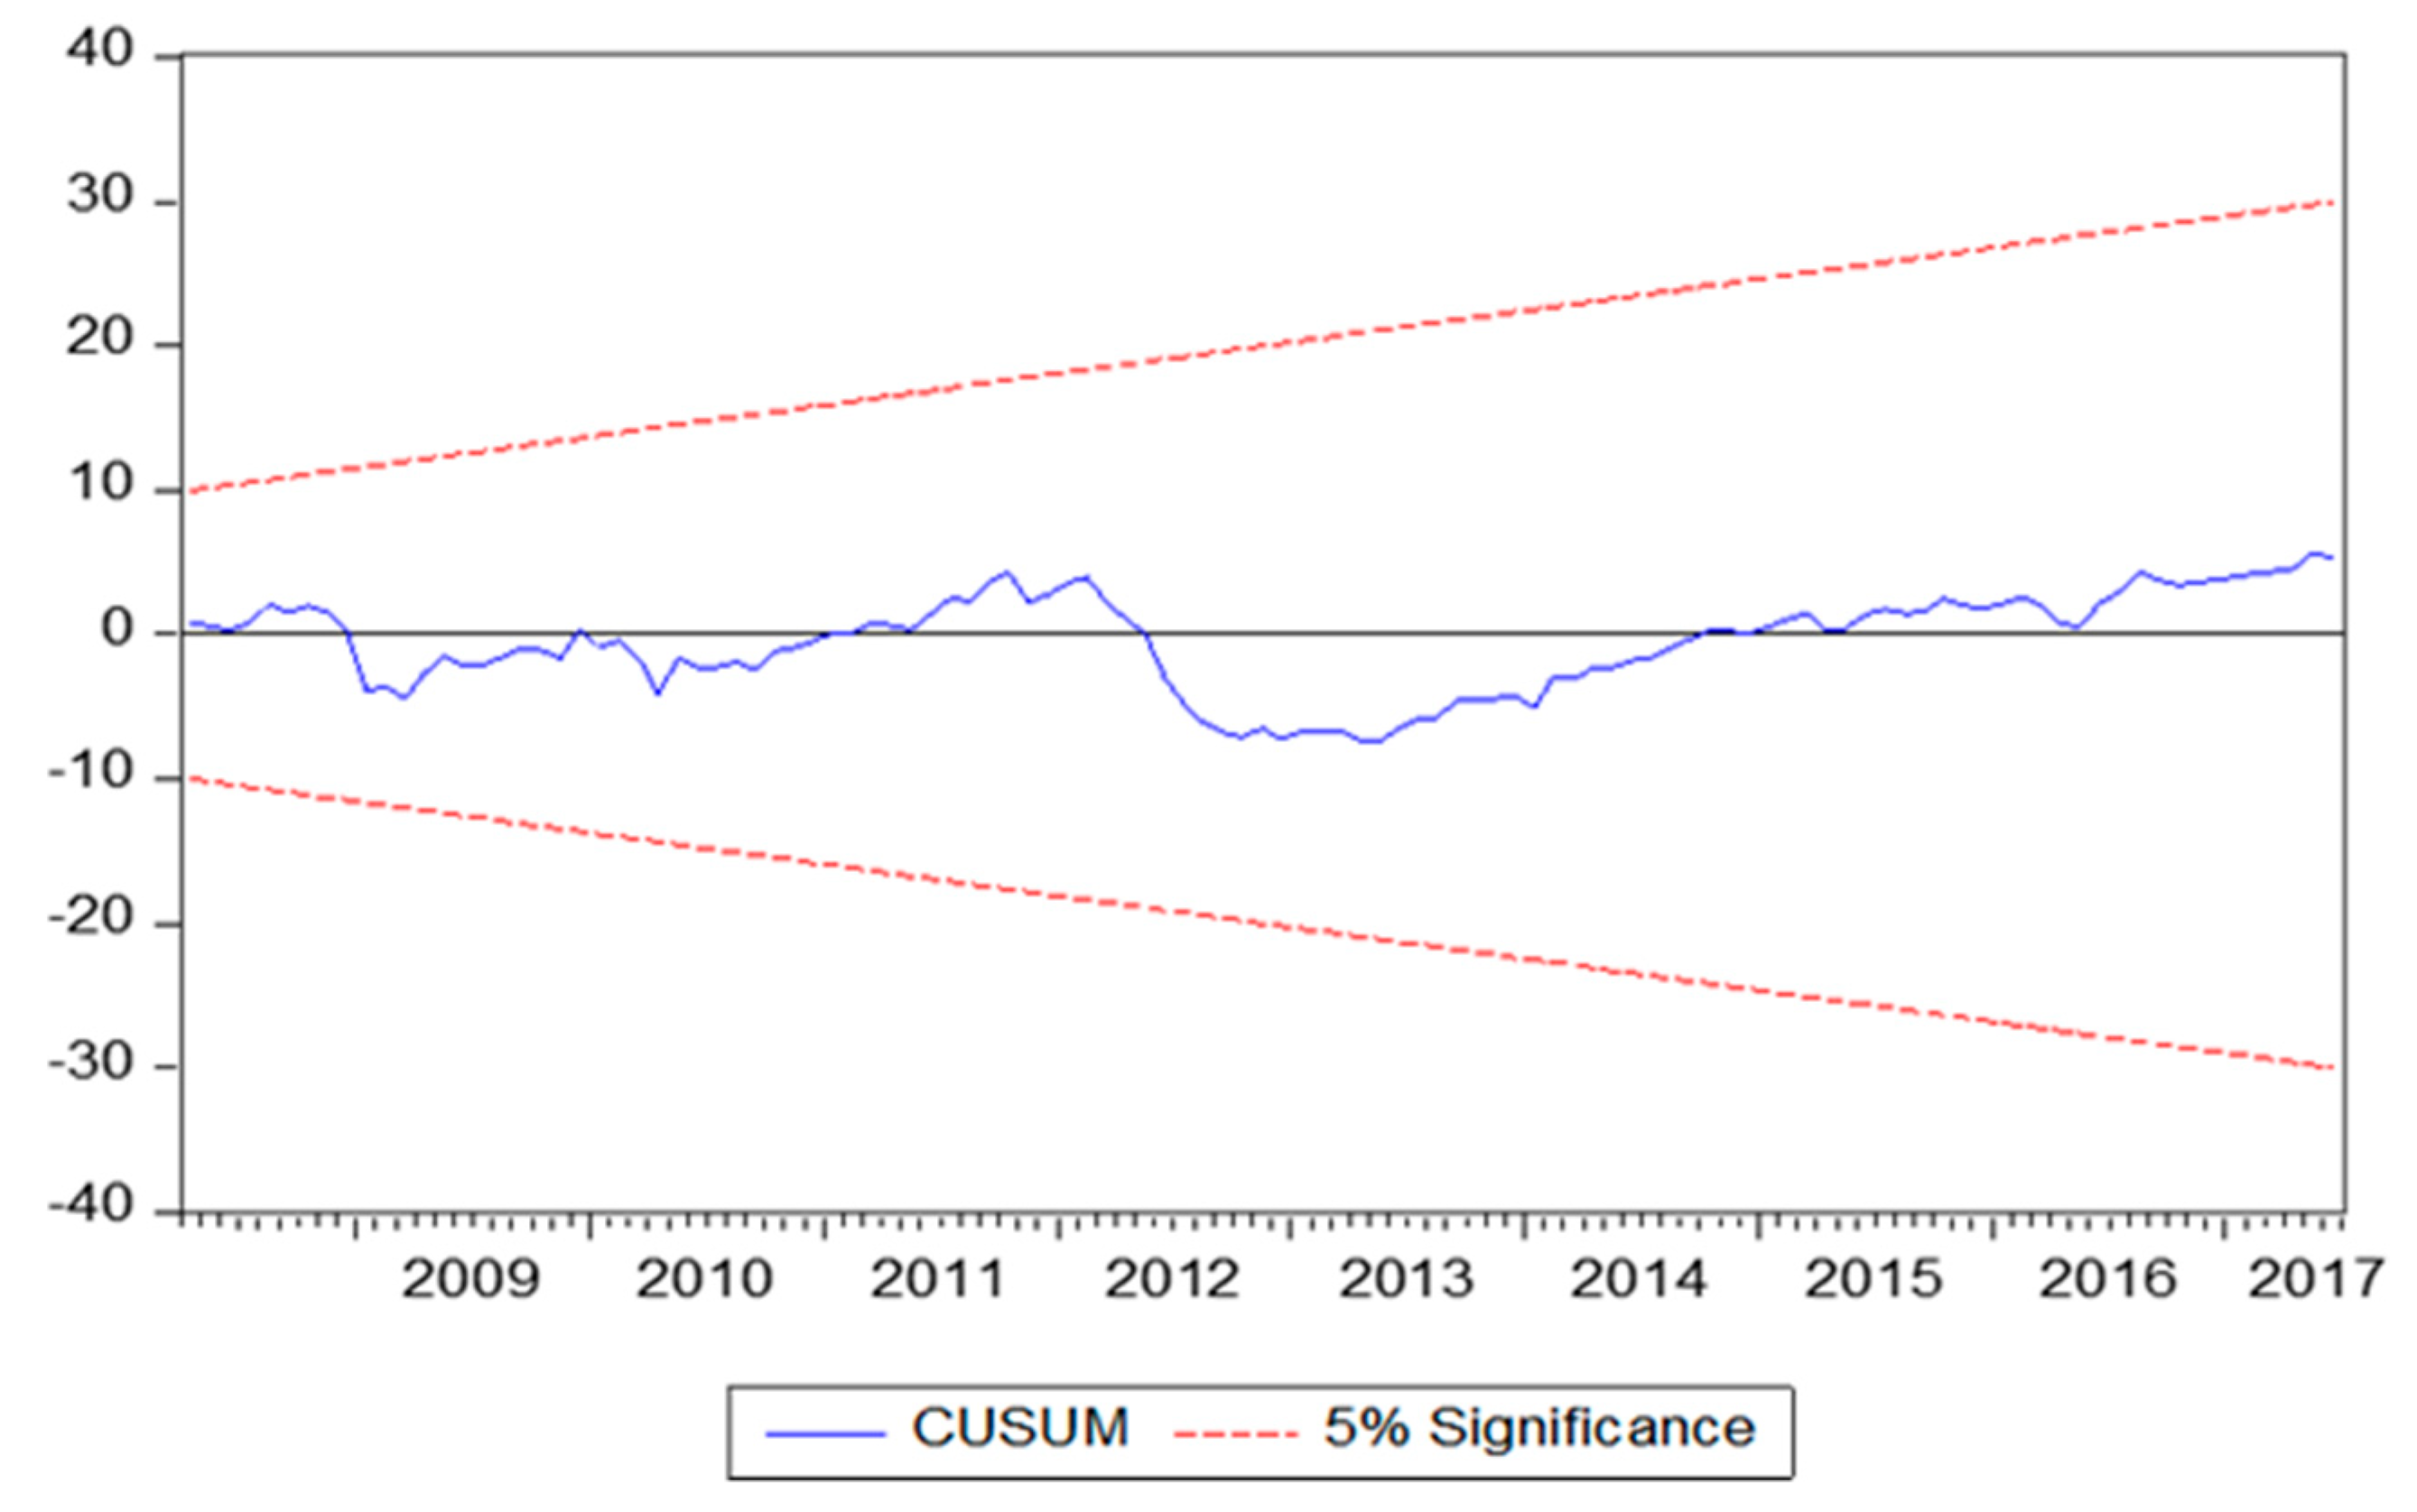
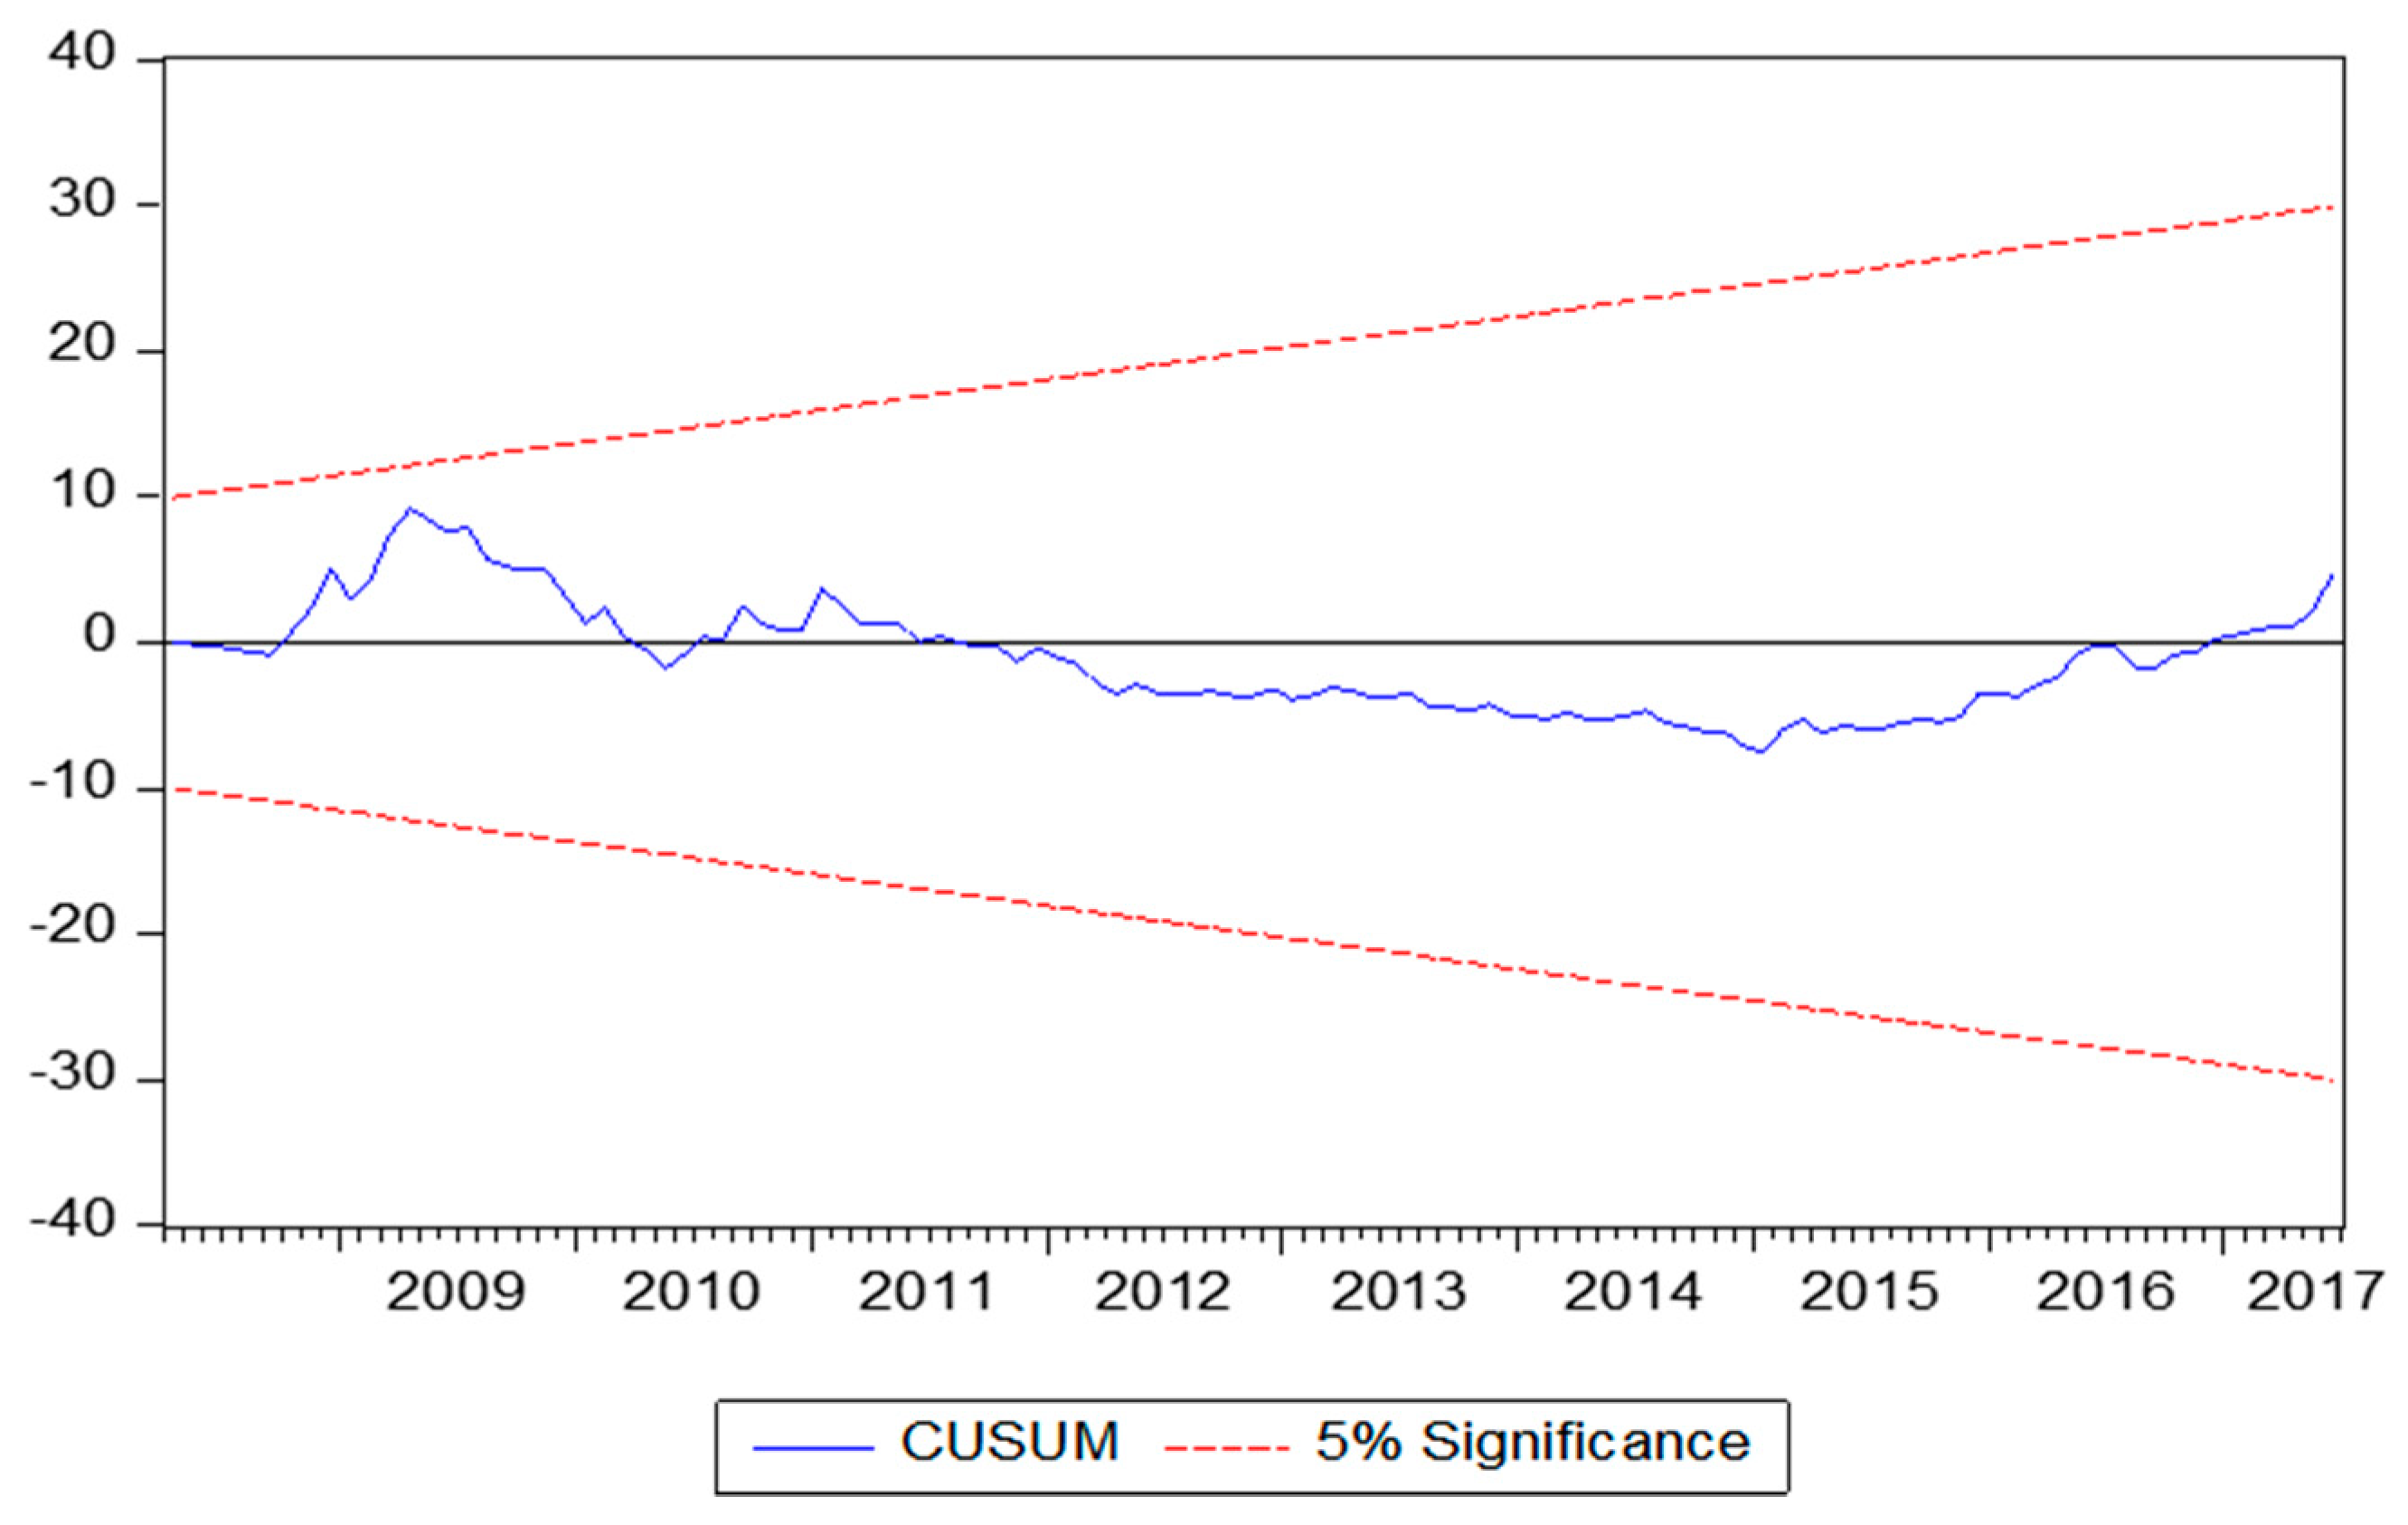
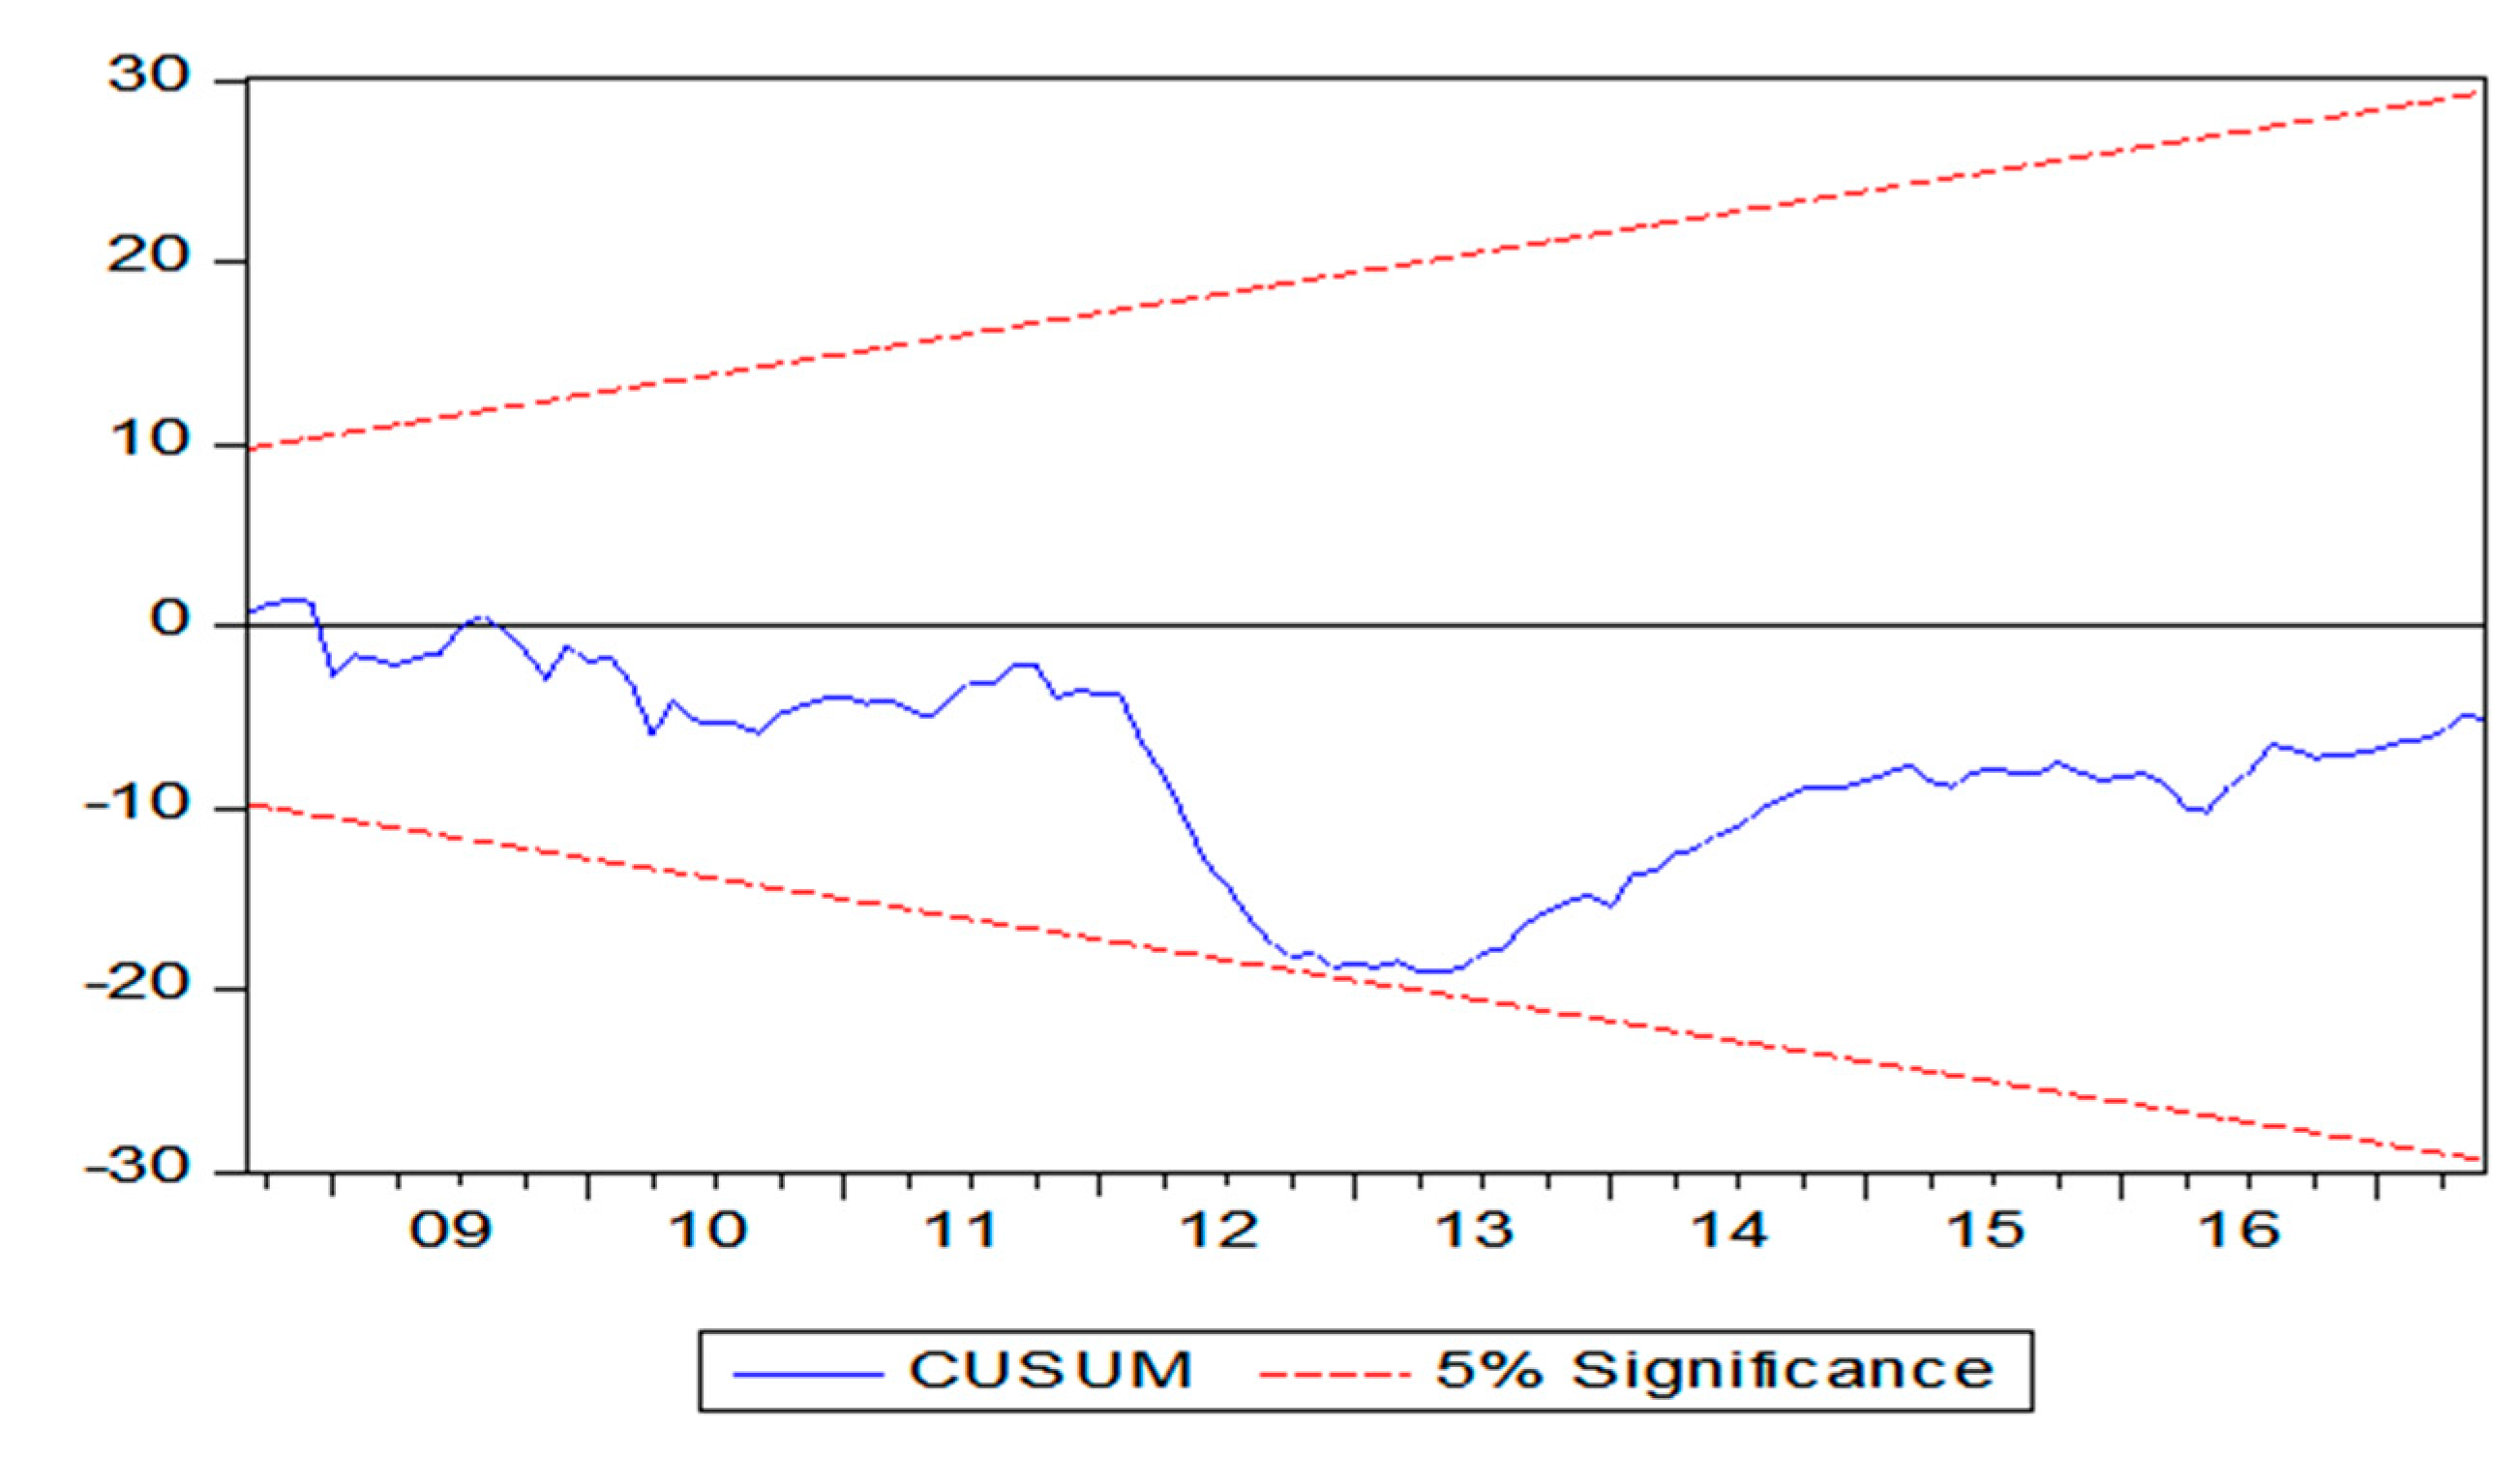
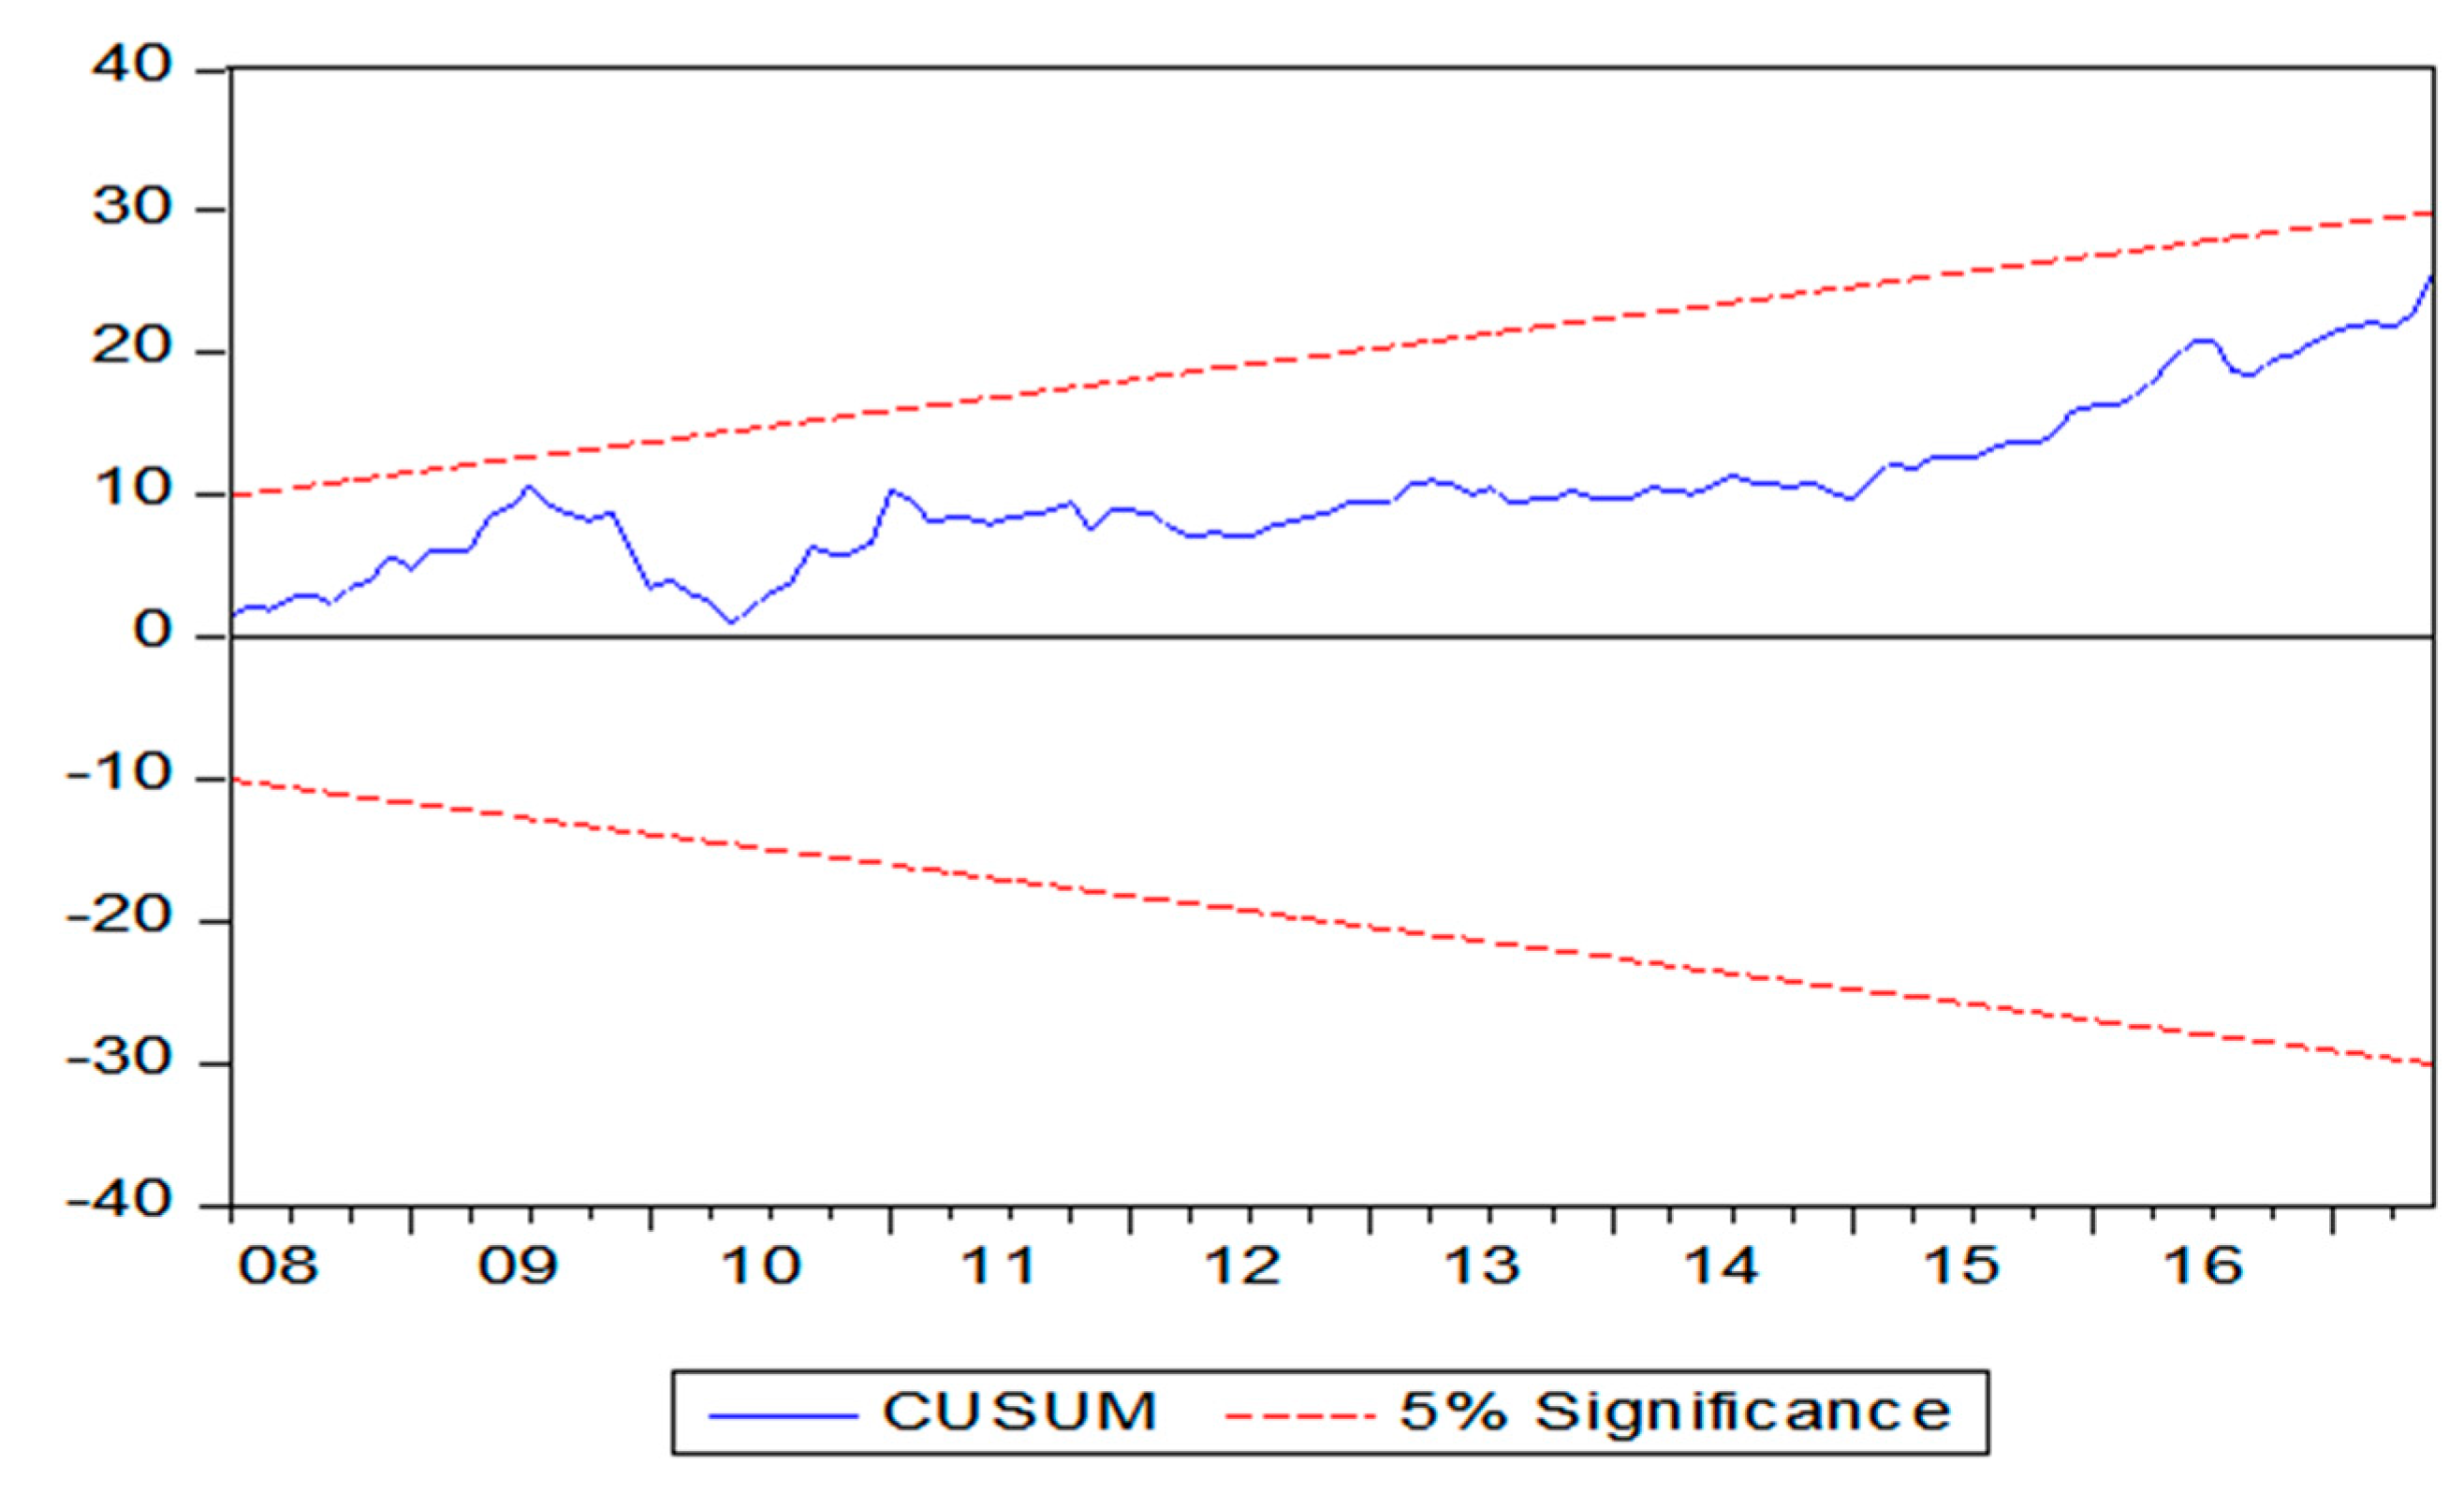
| LM test ARCH test Normality test (Jarque-Bera) CUSUM test | 0.8235 [~F (4,102)] 0.9998 [~F (4,114)] 2.30 [0.102] S | 0.3524 [~F (1,117)] 0.5831 [~F (1,123)] 2.58 [0.112] S | |||
| Farm-Wholesale | Retail-Wholesale | ||||
| Test of co-integration (from asymmetric model) | |||||
(No Co-integration) | (0.009 ***) | (No co-integration) | (0.0002 ***) | ||
| Wald test for symmetry | |||||
| Hypothesis 1 | (0.096 *) | Hypothesis 1 | (0.151) | ||
| Hypothesis 2 | F-stat: 2.227 (0.089 *) | Hypothesis 2 | F-stat: 6.269 (0.002 ***) | ||
| Market Pairs | Farm-Wholesale | Retail-Wholesale | ||
|---|---|---|---|---|
| TAR | M-TAR | TAR | M-TAR | |
| −0.263102 ** (0.115) | −0.125598 ** (0.062) | −0.110574 ** (0.041) | −0.135571 ** (0.039) | |
| −0.151137 ** (0.077) | −0.475233 *** (0.114) | −0.263558 ** (0.066) | −-0.099894 (0.065) | |
| 10.50063 ** | 19.04142 *** | 14.32855 ** | 14.08717 ** | |
| F-statistics | 0.581604 | 8.425138 ** | 3.429578 * | 0.213173 |
| -0.068218 | −0.032160 | −0.051041 | −0.015185 | |
| AIC | −3.161186 | −3.229120 | −4.613962 | −4.552164 |
| SBIC | −2.886827 | −2.954760 | −4.478901 | −4.407103 |
| LB (4) | 0.999 | 0.997 | 0.333 | 0.389 |
| LB (8) | 0.505 | 0.994 | 0.122 | 0.146 |
| Lags | 4 | 4 | 1 | 1 |
© 2020 by the authors. Licensee MDPI, Basel, Switzerland. This article is an open access article distributed under the terms and conditions of the Creative Commons Attribution (CC BY) license (http://creativecommons.org/licenses/by/4.0/).
Share and Cite
Deb, L.; Lee, Y.; Lee, S.H. Market Integration and Price Transmission in the Vertical Supply Chain of Rice: An Evidence from Bangladesh. Agriculture 2020, 10, 271. https://doi.org/10.3390/agriculture10070271
Deb L, Lee Y, Lee SH. Market Integration and Price Transmission in the Vertical Supply Chain of Rice: An Evidence from Bangladesh. Agriculture. 2020; 10(7):271. https://doi.org/10.3390/agriculture10070271
Chicago/Turabian StyleDeb, Limon, Yoonsuk Lee, and Sang Hyeon Lee. 2020. "Market Integration and Price Transmission in the Vertical Supply Chain of Rice: An Evidence from Bangladesh" Agriculture 10, no. 7: 271. https://doi.org/10.3390/agriculture10070271