Article

Starch Granule Size Distribution and Pasting Characteristic Response to Post-Anthesis Combined Stress of Waterlogging and Shading

1
Crop Research Institute, Shandong Academy of Agricultural Science, Jinan 250100, China
2
National Technique Innovation Center for Regional Wheat Production/Key Laboratory of Crop Physiology and Ecology in Southern China, Ministry of Agriculture/National Engineering and Technology Center for Information Agriculture, Nanjing Agricultural University, Nanjing 210095, China
*
Author to whom correspondence should be addressed.
Agriculture 2020, 10(9), 384; https://doi.org/10.3390/agriculture10090384
Submission received: 25 June 2020 / Revised: 7 August 2020 / Accepted: 12 August 2020 / Published: 2 September 2020

Abstract

:
The combined stress of waterlogging and shading (WS) caused by continuous rain threatens the production of high-quality weak gluten wheat in China (Triticum aestivum L.). To evaluate its influences on wheat quality formation, Yangmai 158 was chosen to be subjected to WS at 0–7 days after anthesis (DAA, WS0–7), 8–15 DAA (WS8–15), 16–23 DAA (WS16–23), and 24–31 DAA (WS24–31), respectively, with non-stressed plants as control (Non-WS). Compared with Non-WS, WS reduced the amylopectin content and enhanced amylose content in the mature grains. WS enhanced the number and surface but reduced the size of the starch granules. The number, volume, and surface area percentages of B-type starch granules were enhanced, and the number and volume percentages of A-type starch granules were reduced by WS. The peak viscosity and gelatinization temperature were enhanced and the low viscosity and final viscosity were decreased by WS. WS applied at the mid-grain-filling stage (WS8–15 and WS16–23) had greater modification on the starch content, granule size distribution and pasting characteristics than that applied at early (WS0–7) or late (WS24–31). The changes of starch pasting characteristics under WS had a significant correlation with the amylase and amylopectin content, amylase/amylopectin, and the ratio of the volume percent of B-type and A-type starch granules.

1. Introduction

Starch is the most abundant component in winter wheat grains, and accounts for two-thirds to three-quarters of wheat kernel dry weight. Starch is distributed in different classes of granules in the endosperm, and has a major role in the properties of wheat flour and its products [1,2,3,4]. At least two distinct starch granules, according to their size, exist in the grains of mature wheat, the large A-type with a boundary diameter bigger than 10 μm and the small B type with a boundary smaller than 10 μm [5,6,7]. A very small C-type starch granule has also been reported, and it is debated whether it should be classified as a B-type because of the difficulty in plotting the boundary between them [1]. In wheat endosperm, A-type granules constitute the majority weight of starch [1,8], whereas B-type granules comprise up to 99% of granules in number [9]. Starch granules are primarily composed of amylose and amylopectin bound with a few proteins and lipids [2,6,10,11]. Amylose is a predominantly linear molecule linked by α-1,4 bonds that comprises 25–30% of wheat grain starch. Amylopectin is a highly branched polymer with branch points linked by α-1,6 bonds and comprises 70–75% of wheat grain starch [11]. It has been reported that the B-type starch granules have a lower amylose content than A-type ones [2], and B-type starch granules were negatively correlated with the content of starch in the grain [6]. A-type and B-type starch granules showed a significant difference in the capacity to combine lipid and protein, due to their structural differences [2,6,10,11]. Thereby the characters of the pasting, the retrogradation, the viscosity, and the baking properties also exhibit significant differences between the two types of starch granules [11,12,13].
The pasting properties, the retrogradation, and the viscosity characteristics of starch are extremely important to the appearance, structure, and quality of wheat flour food. It is demonstrated that the peak viscosity of starch is positively correlated with the ratings of noodles, and the final viscosity is positively correlated with the slippage of noodles [5,14]. A-granules, generally, contain more amylose and showed higher paste viscosities than B-granules [15]. Common and durum starches with high proportions of A-granules exhibit higher paste viscosities than those with more B- and C-granules, and peak and final viscosities of wheat starch decrease with increasing proportions of B-type granules [15,16]. The starch pasting behavior of soft wheat flour is associated with A- and B-type granule content and their composition [8]. The gelatinization, pasting, and retrogradation properties of starch granules are also different in starch sources that differ in the ratio of amylose to amylopectin contents, molecular structures of amylose and amylopectin, granule morphology, and minor-component contents [4]. The starch granule distribution in wheat grains is a quantitative trait and is co-regulated by genetic characteristics and environmental factors [17]. The changes in environmental factors and agronomic practices such as abnormal temperature [18], water stress [19], nitrogen and sulfur fertilization supplementation [20,21], and light intensity [22] during the grain-filling stage is demonstrated as significantly affecting the number of starch granules in wheat grains, the ratio of the volume percentage of A-type to B-type starch granules (PA/PB), and the starch granule volume and surface area distribution, thus the starch quality may also be influenced.
The Downstream Plain of the Yangtze River is the second largest wheat production region in China and it represents the primary production area of high quality weak gluten wheat. However, wheat in this region is often subjected to persistent rainfall during the grain-filling stage. Statistically, during the wheat grain-filling stage, a rainfall event lasting more than 5 days occurred almost every year during the past 50 years in this region [23]. Persistent rainfall imposes the combination of waterlogging and shading stress (WS) on wheat production. Studies have demonstrated that shading alters the function of chloroplasts in plant leaves [24] and reduces their electron transport and photosynthetic functions [23,25], thereby leading to changes in starch quality [22]. On the other hand, soil waterlogging also limits plant carbon assimilation and reduces starch accumulation in wheat grains [26]. However, a single stress of shading or waterlogging is not sufficient to reveal the combined effect of waterlogging and shading result in persistent rainfall on wheat yield and starch quality, which limits the production of wheat in this region [23]. In this study, Yangmai 158 is used and subjected to a 7-day combined stress of waterlogging and shading (WS) at different periods of the wheat grain-filling stage to simulate the effect of continuous rainfall. Changes of the content and accumulation amount of starch and its components, the size distribution characteristics of starch granules in wheat grains, and starch pasting properties are analyzed to reveal the effects of the combined stresses of waterlogging and shading occurring at different periods of the grain-filling stages on wheat yield and starch quality.

2. Materials and Methods

2.1. Experimental Design

We detailed the experimental setup in our previous report [23]. Briefly, Yangmai 158 (Triticum aestivum L.) was chosen to be subjected to combined waterlogging and shading stress (WS) at 0–7 days after anthesis (DAA, WS0–7), 8–15 DAA (WS8–15), 16–23 DAA (WS16–23), or 24–31 DAA (WS24–31), represent the early, early-mid, mid-late, and late grain filling period, respectively, with non-stressed plants served as control (Non-WS). About 75% of the full radiation was blocked on the top of the crop canopy with two layers of black polyethylene screens installed more than 180 cm above the ground. A 2-cm water layer was kept above the soil surface of the pot to achieve the waterlogging treatment. The screens were removed and the excessive water in the pots was drained immediately at the end of the treatments. The experiment was a randomized block design, with three replicates for each treatment.

2.2. Measurement of Content of Starch, Starch Granule Size Distribution, and Starch Pasting Properties

The determination of amylose and amylopectin content in wheat grains was done according to the method described by Zhang et al. [7]. We stirred 50 mg of amylose or amlopectin standard sample with 0.5 mL of absolute ethanol and 4.5 mL of 1M NaOH at 85 °C for 20 min and then diluted to 50 mL with distilled water. Of standard amylose solution, 0.25, 0.5, 0.75, 1, 1.25, and 1.5 mL were diluted to 20 mL with distilled water, respectively, after adjusting the pH to 3.5 with 1 M acetic acid. Then, 0.5 mL of I2-KI reagent were added, and then we used distilled water diluted to 50 mL. We diluted the standard amylopectin solution 0.5, 1.25, 2, 2.75, 3.5, and 4.25 mL proceeding under the same reaction conditions as above. The mixed solution then was scanned between 400 and 960 nm with a Heλios Gamma spectrophotometer (ThermoSpectronic, Cambridge, UK) after blending for 20 min. The absorption peaks of the standard amylose that reacted with the I2-KI reagent were 630 and 460 nm, while those of amylopectin were 740 and 550 nm. The standard equation of amylose or amylopectin was achieved by calculating the relationship between the compositions and their absorption values. Next, 100 mg of wheat grains were milled and then diluted to 50 mL with distilled water. The solution was kept at 85 ℃ for 20 min, after reacting with I2-KI reagent, the absorption was scanned at 460, 550, 630, and 740 nm with the Heλios Gamma spectrophotometer. The rest of the process was carried out according to standard sample analysis, and the composition was calculated according to standard equations. The total starch content was the sum of amylose and amylopectin.
According to the procedure described by Bechtel and Wilson [1] and Zhang et al. [27], the starch granule was isolated and the size of the granule was measured with a Saturn DigiSizer-5200 (Micromeritics Instrument Corporation, Norcross, GA, USA). Briefly, the endosperm was squeezed out from the caryopses of wheat carefully and then mixed with the pH 7.5 buffer solution (5 mM magnesium acetate, 25 mM Tricine and 50 mM potassium acetate) at 4 °C. The pellets were collected and were suspended in ethanol after being centrifuged for 10 min at 3000× g at 4 °C. The suspension was filtered through a 53 mm pore size nylon screen and was washed with excess ethanol. Then, the starch sample was collected by centrifugation, re-suspended in a 0.1 M NaCl aqueous solution containing 10% of toluene, and stirred with a high-speed magnetic stirrer for 1 h to remove the protein. We repeated this step until the toluene layer became clear and no protein was present. To re-purify the starch, the starch was washed three times with water and twice with ethanol, and then dried at 30 °C for 48 h. The starch granule size distribution was measured with a Saturn DigiSizer-5200 (Micromeritics Instrument Corporation, Norcross, GA, USA). The standard refractive indices used were 1.31 for water and 1.52 for starch. Volume frequency percent and mean diameter of starch granules were then automatically measured using the embedded laser light scattering technology and summing Mie scattering models. Each measurement was repeated three times.
The pasting properties of wheat flour starch were measured with a Rapid Visco Analyser (RVA, Newport Scientific Pty. Ltd., Warriewood, Australia) according to the standard method of the American Association of Cereal Chemists (AACC) 76-21.

2.3. Statistics

For the statistical analysis we used the Statistical Package for the Social Sciences (IBM SPSS Statistics 23, IBM, Armonk, NY, USA). All data were subjected to a one-way analysis of variance (ANOVA) to determine the significance of differences between treatments. Pearson correlation analysis was used to determine the relationship between starch characteristic parameters and RVA characteristic parameters.

3. Results

3.1. Effect of Post-Anthesis WS Treatments on the Yield and the Pasting Characteristics of Starch in Wheat Mature Grains

The WS treatments during the grain-filling stage significantly affected the content and accumulation of amylopectin and amylose in the mature wheat grains (Table 1). Compared with that under Non-WS, the amylopectin content decreased by 19.57% and 8.17% (p < 0.05) under the WS8–15 and WS16–23 treatments and by 4.16% and 1.93% (p < 0.05) under the WS24–31 and WS0–7 treatments, respectively. In contrast, the amylose content in grains increased under WS treatments; the biggest increment was found in WS8–15, followed by WS16–23 and WS0–7, and then was WS24–31, significant differences existed among all of the treatments except between WS0–7 and WS16-23. The total starch content (the sum of the content of amylopectin and amylose) of wheat grains decreased by 12.3% and 4.5% (p < 0.05) under WS8–15 and WS16–23. No statistical significance in the reduction of total starch content was found under WS0–7 and WS24–31. The ratio of the content of amylose to that of amylopectin (amylose/amylopectin) in wheat grains was 0.309 under the control, while that under WS0–7, WS8–15, WS16–23 and WS24–31 were increased by 6.22%, 38.15%, 16.46%, and 8.12% (p < 0.05). The accumulation account of amylopectin in grains was found to be the lowest under WS8–15, followed by WS16–23, both of them then exhibited significantly lower than WS0–7 and WS24–31 and then lower than Non-WS. The accumulation account of amylose in the grains was found to be the lowest under WS8–15 and WS16–23, followed by WS0–7 and WS24–31, and all of them were then significantly lower than Non-WS.
The peak viscosity, trough viscosity, final viscosity, and pasting temperature of starch in wheat grains was influenced significantly by the WS treatments applied at any phase post anthesis (Table 1). The peak viscosity was enhanced by WS, and the highest enhancement was observed in WS8–15, followed by WS16–23, and WS0–7, and no difference was found between WS24–31 and Non-WS. The trough viscosity and the final viscosity exhibited an opposite trend to the peak viscosity when responded to WS; the biggest reduction was found in WS8–15, and then was in WS16–23 and WS0–7. WS24–31 exhibited no significant effects on the trough viscosity and the final viscosity. Compared with Non-WS, the pasting temperature was increased by 6.22% (p < 0.05) and 3.45% (p < 0.05) under WS8–15 and WS16–23 respectively, yet no significant changes were observed under WS0–7 and WS24–31.

3.2. Effect of Post-Anthesis WS Treatments on the Volume Distribution of Starch Granules in Mature Wheat Grains

The starch granule size distribution profile in the grain endosperms at the maturity stage of Yangmai 158 exhibited a multimodal distribution ranging from 0.44 to 42 μm. Apparently, three kinds of B-type granules peaked at 1.25 µm (ranged in 0.44–1.41 µm), 2.97 µm (ranged in 1.41–3.53 µm), and 5.59 µm (ranged in 3.53–10 µm), and one kind of A-type granule that peaked at 21.04 μm could be defined through the granule size distribution profile (Figure 1). The starch granule in different size ranges showed varied patterns when responding to the WS treatments applied at different periods of the grain-filling stage (Figure 1), thus the difference of the starch granule size distribution profile between WS and Non-WS presented a positive and negative alternation. Generally, the volume present of three kinds of B-type granules increased. The volume present of A-type granules ranged in 10–30 μm decreased under WS, and that of ranged in 30–42 μm decreased under WS0–7 and WS24–31, while it increased under WS8–15 and WS16–23, which suggests that two kinds of A granule that peak at 17.7 and 33.3 µm could exist. In order to analyze the changes of starch granule characteristics under WS treatment in more detail, here we marked the B-type granules that peaked at 1.25, 2.97, and 5.59 µm as B1-, B2-, and B3-type, and the A-type granules that peaked at 17.7 and 33.3 µm as A1- and A2-type, respectively.
WS applied at different stages of the grain-filling reduced the mean grain size of starch granules (Table 2). Compared with Non-WS, the mean grain size of starch granules was dramatically decreased by 0.84 μm under WS8–15 and 0.43 μm (p < 0.05) under WS16–23; the reductions were approximately 0.40 μm (p < 0.05) under WS0–7 and WS24–31 treatments, with no significant differences between them. The reduction of the mean grain size of starch granules under WS may result in the reduction of volume frequency percentage of A-type and the increment of that of B-type. Interestingly, the changes of the volume frequency percent under WS differed in A- or B-type peaked starch granules. Compared with Non-WS, the B1-type starch granules had a biggest increment at WS0–7, which was significantly bigger than WS16–23 and WS24–31 and had a lowest increment at WS8–15. However, the maximal increments of B2- and B3-type starch granules were all found under WS8–15, while the minimum increments were found under WS16–23 of B2-type and under WS0–7 and WS 24–31 of B3-type starch granules. The volume frequency percent of A1-type starch granules reduced by 7.8%, 4.95%, 2.95%, and 2.86% under WS8–15, WS16–23, WS0–7, and WS24–31, respectively. The volume frequency percent of A2-type changed hardly under WS24–31 and had a significance enhancement of 0.98% and 0.89% under WS8–15 and WS16–23, while they were reduced by 0.16% under WS0–7. The ratio of volume percentage of A-type to B-type starch granules were significantly decreased under WS applied at any period of the grain-filling stage, with the largest decrement showed in WS8–15 and WS16–23, followed by that in WS24–31 and WS0–7 (p < 0.05).

3.3. Effect of Post-Anthesis WS Treatments on the Surface area Distribution of Starch Granules in Mature Wheat Grains

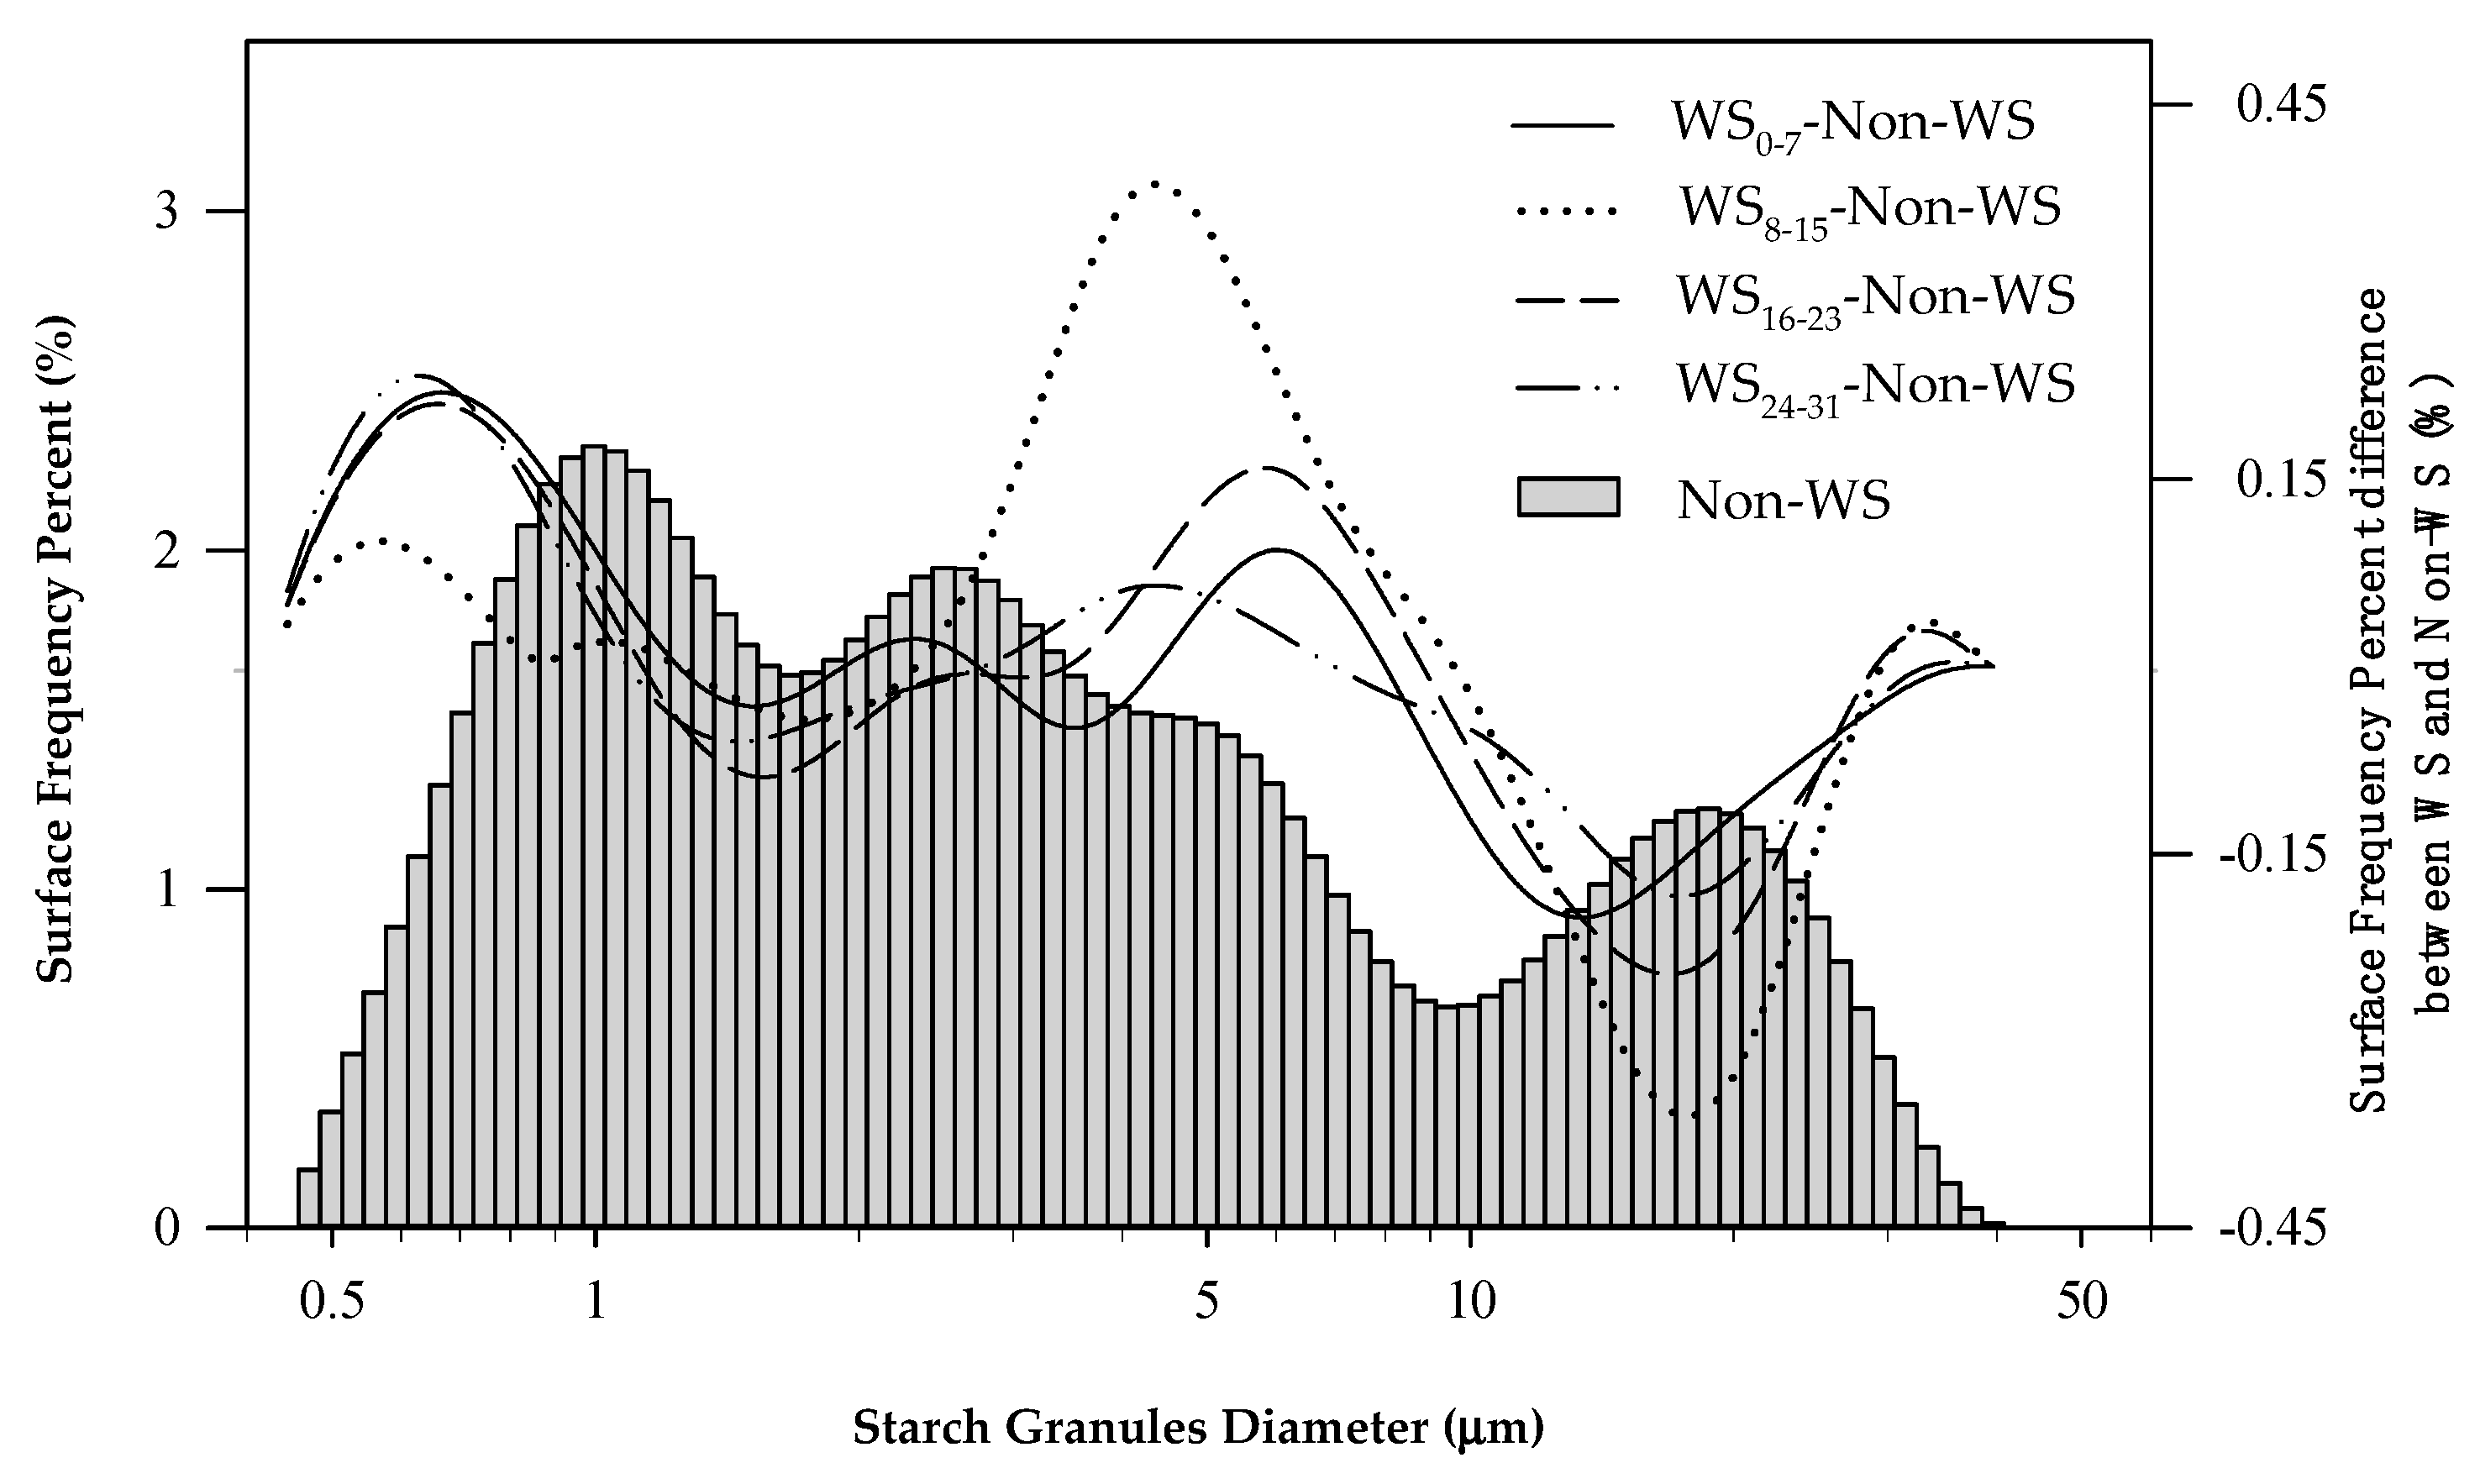
The starch granule surface area distribution profile in Yangmai 158 endosperm at maturity also showed as a four-peak curve under Non-WS (Figure 2). The surface area of starch granules was dramatically enhanced 16.08%, 8.80%, 4.85%, and 4.55% by WS8–15, WS16–23, WS24–31, and WS0–7, respectively, compared with the control (Table 3). However, WS had different impacts on the surface area of the different B- or A-types starch granules, as shown in Figure 2, namely, the surface area of the B1- and B3-type starch granules was enhanced, while that of B2-type and A1-type starch granules was reduced compared to Non-WS. The highest surface area percent of B1-type was found in WS0–7, it was significantly higher than WS16–23 and WS24–31, and then higher than WS0–7, which was then significantly higher than Non-WS. Compared with the control, the surface area frequency percent of B2-type starch granules was found enhanced by WS8–15 and reduced by WS24–31, but changed little by WS0–7 and WS24–31. WS8–15 had a greater surface area frequency percent of B3-type starch granules followed by WS16–23, WS24–31, WS0–7, and Non-WS orderly, and significant differences existed among treatments. The surface frequency percentage of the A1-type was reduced by the WS, with the largest reduction being seen in WS8–15, followed by WS16–23, WS0–7 and WS24–31. The surface frequency percentage of the A2-type was enhanced by WS8–15 and WS16–23 but reduced by WS0–7, with non-change under WS24–31 compared with control.

3.4. Effect of Post-Anthesis WS Treatments on the Number Distribution of Starch Granules in Mature Wheat Grains

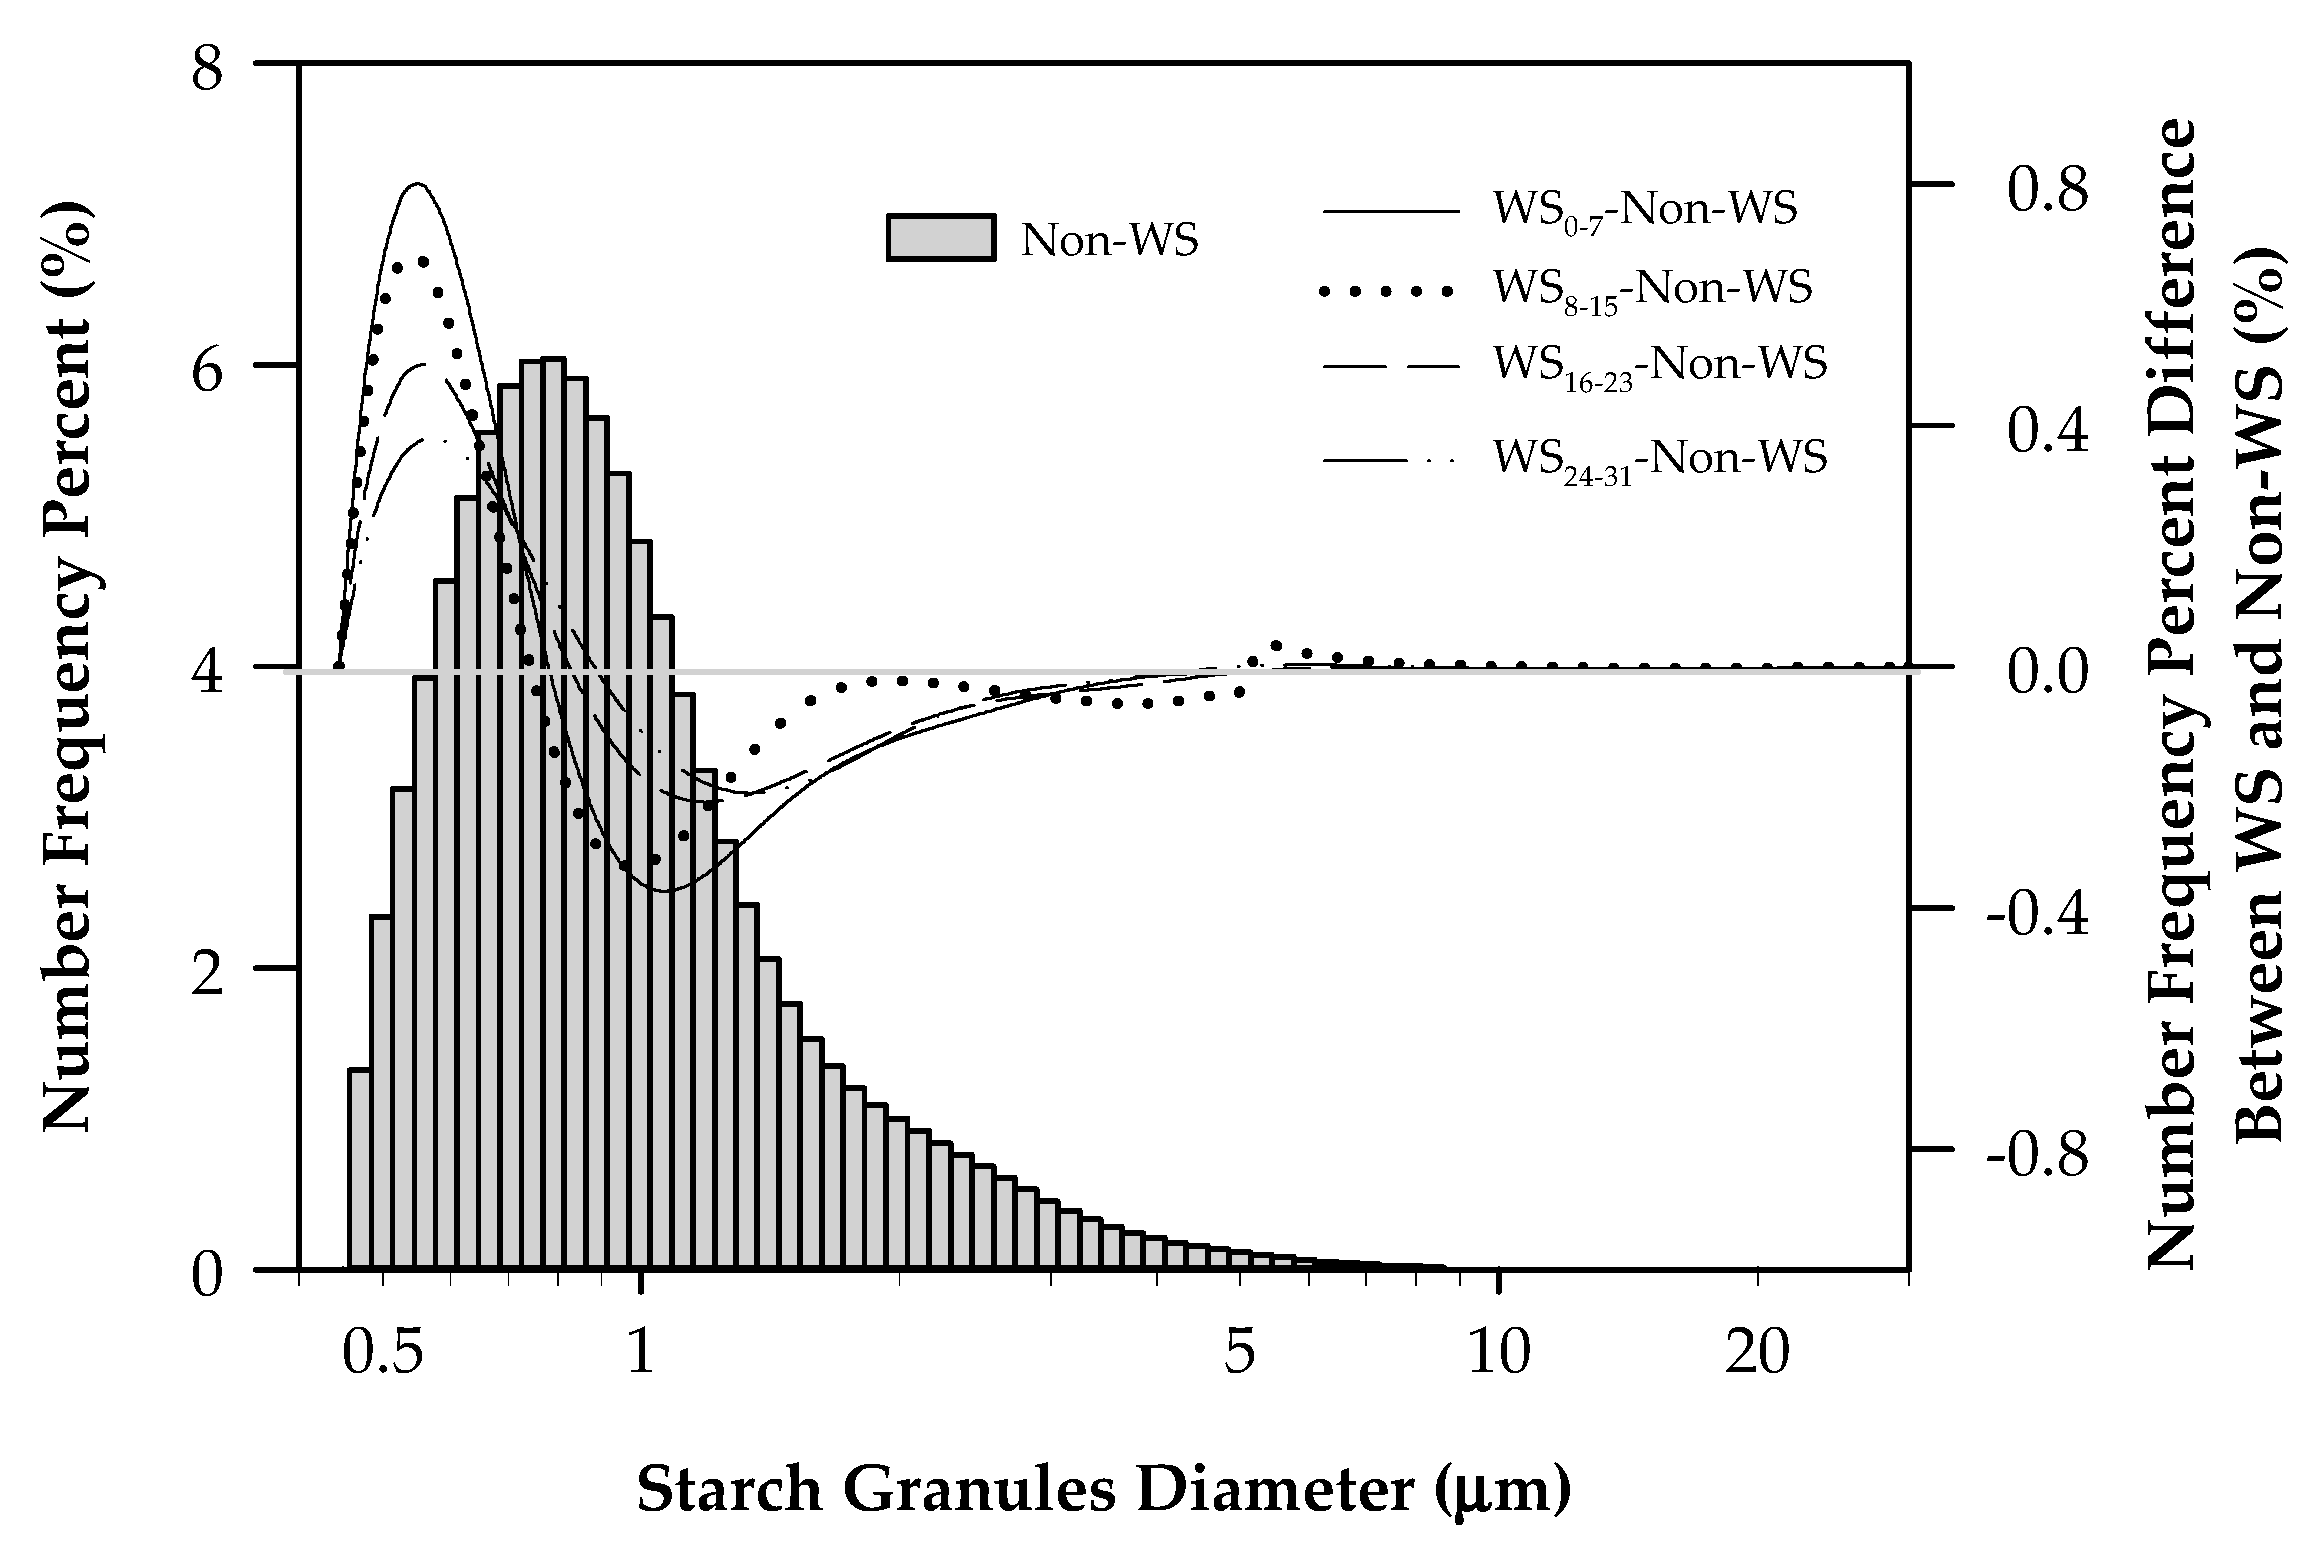
The starch granules with a boundary diameter of 0.5–8 μm comprise up the most part of the granules in number. The number frequency percent of the starch granule with a diameter of 0.5–0.75 μm was enhanced, and with a diameter of 0.75–30 μm was reduced by WS applied post-anthesis compared with those of Non-WS (Figure 3). Compared with control, the number of starch granules per unit weight starch in wheat endosperms was significantly increased under WS, with the largest increment showed in WS8–15, followed by that in WS0–7, WS16–23 and WS24–31 (Table 4). The variation of the starch granule number under WS mainly caused by the increment percentage of B1-type ones, which was enhanced greatest under WS0–7, followed by WS8–15, WS16–23 and WS24–31 compared with control. The greatest reduction of the B2-type starch granules number frequency percent was observed under WS24–31, then was WS16–23 and WS0–7, and the smallest reduction was observed under WS8–15. The lowest percentage of number of B3-type appeared under WS8–15 WS16–23 and WS24–31, with non-significant differences among them, which was then significantly lower than WS0–7 and Non-WS orderly. The number frequency percentage of the A1-type was reduced by the WS stress, with the largest reduction being seen in WS8–15, followed by WS16–23 and WS0–7, then was WS24–31. The number frequency percentage of the A2-type was enhanced by WS8–15, but reduced by WS0–7, WS16–23 and WS24–31 compared with control.

3.5. Relationship between the Starch Content and Starch Pasting Characteristics of Wheat under Post-Anthesis WS Treatments

Significant correlations among starch granule distribution, starch content and components, and the starch pasting characteristic parameters were noted (Table 5). Peak viscosity exhibited significant positive correlation with the amylose content and the number of starch granules but an extremely significant negative correlation with mean grain size of A-type starch granules. Trough viscosity and final viscosity were positively correlated with the content of starch and amylopectin, the mean grain size of starch granules and PA/PB, while there was an extremely significant negative correlation with amylose content, amylose/ amylopectin, the mean grain size of B-type starch granules and number and surface area of starch granules. Pasting temperature was positively correlated with amylose content, amylose/ amylopectin, and number and surface area of starch granules, while there was a negative correlation with the content of starch, amylopectin content, the mean grain size of starch granules, the mean grain size of A-type starch granules, and PA/PB. The trough viscosity had an extremely significant positive correlation with the mean grain size of A-type starch granules, while it had a significant negative correlation with the mean grain size of B-type starch.

4. Discussion

The biosynthesis and accumulation of starches in wheat grains are significantly affected by environmental conditions and cultivation measures [7,18,21]. Covering 10% of the radiation in the early and mid-grain-filling stage reduces the amylopectin and total starch content and increases the amylose content [22], while shading (33% of light) during the jointing and maturity stages reduced the amylopectin and total starch content, yet it had no significant impact on amylose [27]. Soil waterlogging reduces the total starch and amylopectin content in wheat grains but increases the amylose content [26]. In this study, the combined stress of waterlogging and shading applied at any phase after anthesis all significantly resulted in the change of the total starch. The grain-filling process could be divided into three periods as gradual increase, rapid increase, and slow increase, and the response to environmental stress at different periods of the grain-filling stage varies [23]. The endosperm cells undergo rapid divisions and most of grain filling occurred during this time window, thus the effects of environmental stresses in this period on grain development are greatest [23,28]. Our study indeed demonstrated that the WS treatments during the mid-grain-filling stage (WS8–15 and WS16–23) exhibited the largest effects on starch accumulation relative to the treatment during the early grain-filling stage (WS0–7) and during the late grain-filling stage (WS24–31). Under the WS8–15 and WS16–23, the large decrease in the amylopectin content resulted in a decrease in the total starch content, whereas the decrease in the amylopectin content accompanied with an increase in the amylose content resulted in no significance in the total starch content under the WS0–7 and WS24–31. After WS treatments, a trend opposite that of the change in amylose and in amylopectin lead to an increase in the ratio of amylose/amylopectin, which was consistent with the effects under shading or waterlogging stress [22,26]. Because the starch content in the mature wheat grains during the maturity stage accounts for 65–70% of the total dry weight, the decrease in the starch content under environmental stresses represents the primary reason for the decrease in the wheat yield [18]. Here, the decrease in the starch accumulation accounted for 64.8–97% of the decrease in the grain yield under WS stresses, which indicated that the insufficiency of starch accumulation was the primary reason for the decrease in the wheat yield under the WS treatments.
In wheat endosperms, starch is present in the form of starch granules. It is demonstrated that the development of the large-sized and small-sized starch granules in wheat endosperms differs significantly [1]. The onset of the development of the A-type starch granules is from 4–5 days after anthesis, and that of the B-type starch granules is from 12–14 days after anthesis [11]; therefore, the formation of starch granules is regulated by the development process. The weak-light treatment at the grain-filling stage reduced the mean grain size of starch granules in wheat grains and increased the number of starch granules, the surface area, and the percentage of small-sized starch granules [22]. There are relatively few studies on the effects of soil waterlogging stress or the double stress of waterlogging and shading on the distribution characteristics of wheat starch granules. The results of this study demonstrated that WS treatments during different periods of the grain-filling stage all significantly altered the size distribution of starch granules in wheat grains, decreased the mean grain size of starch granules, and increased the number and the surface area of starch granules. WS enhanced the number, surface, and volume percentage of B-type granules and reduced the number and the surface of A-type granules. Two kinds (A- and B-types) or three kinds (A-, B-, and C-types) were conventionally used to analyze the distribution of wheat starch granules [7,12,26]. However, in percent study, a four-peak curve of volume and surface frequency percentage distribution profile was observed. Interestingly, we found in the percent study that the three different peaked B-types respond differently to WS, and two different kinds of A-types also apparently respond differently to WS. The number, surface, and volume percentage of B1-type which peaked at 1.25 μm was enhanced by WS, to all appearances, the increment of the surface area of B1-type caused by both the enhancement of the number and size as the increment of the number infrequency percent was smaller than that of the surface infrequency percent. The increased surface and volume and percentage together with the decreased number frequency percentage of B2- and B3-type starch granules indicated that they were getting bigger under WS. Furthermore, the surface, volume, and number frequency percentages of A1-type were reduced by WS, however, the decrement of the number frequency percentages was smaller than that of the surface frequency percentages, which means the A1-type were getting fewer and smaller under WS. WS applied during 0–7 DAA had an apparent greater effect on B1-type starch granules, while applied at 8–15 DAA had a smaller effect on B2- and B3-type starch granules compared with other WS. WS applied during the mid-grain-filling stage had a greater impact on the distribution of A-type starch granules. The starch granule development fastest during the mid-grain-filling stage, when environmental stress imposes the greatest impact on wheat starch development [23,28]. Zhang et al. [27] demonstrated that the maximum grain size of Yangmai 158 occurred 16–20 days after anthesis and that shading stress (33% of light) from the jointing stage to the maturity stage has the greatest effect on the volume-based size distribution of starch granules in wheat grains, whereas stress during the late grain-filling stage has the smallest effect. In this study, the mid-early WS treatment, which was applied prior to the occurrence of the maximal grain size of Yangmai 158, had the greatest effect on the volume, surface, and number-based size distribution of starch granules in grains, followed by WS16–23, and the effect of WS treatments during the early and late grain-filling stage had the smaller effect.
The morphology, structure, and composition of starch granules in wheat grains are one of the primary factors that determine the quality of wheat starches [16,29]. Studies have demonstrated that A-type and B-type starch granules exhibit significantly different starch components [3,9,11,12]; A-type starch granules contain approximately 30–36% amylose, whereas B-type starch granules contain only 24–27% amylose [2,3,9,18]. The increase in the percentage of B-type starch granules should lead to a decrease in the amylose content [29]. In this study, the relative percentage increase in the B-type starch granules under the WS treatments was associated with an increase in the amylose content. Under drought and high-temperature stresses, the decrease in the percentage of B-type starch granules in wheat grains did not affect amylose content [18,26]. All these findings may be because of the differences in the amylose and amylopectin composition in different starch granules among different wheat qualities [5,9,14].
The pasting properties of starches are important indicators that reflect the quality of starches, which directly affect the tissue structure of bread and steamed bread and the elasticity and viscosity of noodles [14]. Environmental conditions may have significant effects on the pasting characteristics of wheat starches. Weak-light treatment reduced the peak viscosity, trough viscosity, and final viscosity when applied during the early and mid-grain-filling stage but increased the peak viscosity, trough viscosity, and final viscosity when applied during the late grain-filling stage [22]. The pasting characteristics of wheat grain starches also altered significantly under waterlogging stress [30]. In this study, the combined stress of weak-light and waterlogging during different periods of the grain-filling stage all increased the peak viscosity and pasting temperature and decreased the trough viscosity and final viscosity of starches; however, treatment during the mid-grain-filling stage had a greater impact on the pasting properties of starches than during the early and late grain filling stages. The effects of environmental condition changes on the pasting characteristics of wheat starches were closely related to the distribution of starch granules with different sizes and to the ratio of amylose/amylopectin [5,14,30] The correlation analysis between the pasting properties and starch compositions or granule distribution (Table 3) demonstrates that under the WS treatments, the increase in the amylose content and the number of starch granules in wheat grains exhibited a significantly positive correlation with the peak viscosity and a significant negative correlation with the trough viscosity and final viscosity; the increase of the content of starch and amylopectin, PA/PB, the mean grain size exhibited a significantly positive correlation with the trough viscosity and the final viscosity, but affected the peak viscosity hardly; and the amylose/amylopectin and surface area of starch granules negatively correlated with the trough viscosity and the final viscosity and exhibited a non-significant positive correlation with peak viscosity; the increment of amylose content, amylose/amylopectin, number and surface area and the decrement of the content of starch, amylopectin content, the mean grain size of starch granules, the mean grain size of A-type starch granules and PA/PB were positively benefit for pasting temperature.

5. Conclusions

In summary, all the WS treatments during the grain-filling stage were not conducive to the formation of grain yield and grain quality in wheat. The treatments during the mid-grain-filling stage (DAA 8–15 and DAA 16–23) exhibited the greatest impact. The WS treatments during the grain-filling stage decreased the amylopectin content but increased the amylose content and the amylose/amylopectin ratio. The total starch content was affected by the timing of the treatment applied; total starch was decreased when treatment was in the mid-grain-filling stage but had no significant change when the treatment was applied during the early or late periods of the grain-filling stage. The WS treatments increased the number and the surface area of starch granules, increased the proportion of B-type starch granules (and thus decreased PA/PB), and reduced the mean grain size of starch granules. WS enhanced the number and size of B-type starch peaked at 1.25 μm and the size of B-type starch peaked at 2.97 and 5.59 μm, but reduced the number and size of A-type starch that peaked at 17.7 μm. WS applied at earlier (WS0–7) had a greater influence on the number, size, and surface area frequency percentage of B-type starch granules peaked at 1.25 μm compared with other WS. The influence of WS on the surface area and volume frequency percentage of B-type starch granules peaked at 2.97 and 5.59 μm, and A-type peaked at 17.77μm was greater when applied at mid-grain-filling stage than at earlier or later stage. Starch pasting parameters also changed accordingly: the peak viscosity and pasting temperature were increased, whereas the trough viscosity and the final viscosity were decreased under the WS treatments. Likewise, WS treatment during the early to mid-grain-filling stage had the greatest impact on the grain size distribution and pasting parameters of starch granules, followed by that during the mid- to late grain filling stage, and treatments during the early and late grain-filling stage had a relatively small impact.

Author Contributions

All the authors conceived and structured the trials; formal analysis, B.Z.; funding acquisition, H.L.; methodology, Q.Z.; resources, B.Z.; software, Z.W.; supervision, D.J.; writing—original draft, H.L.; writing—review and editing, F.W. and D.J. All authors have read and agreed to the published version of the manuscript.

Funding

This work was supported by the National Natural Science Foundation of China (31801282), the Major scientific and technological innovation projects in Shandong Province (2018YFJH0602), Taishan Industry Leading Talent Project (LJNY201601).

Conflicts of Interest

The manuscript was finished by Huawei Li, Zongshuai Wang, Qicui Zhuo, Bin Zhang, Fahong Wang, Dong Jiang. I would like to declare on behalf of my co-authors that the work described is the original research that has not been published previously and is not under consideration for publication elsewhere, in whole or in part. All the authors listed have approved the manuscript that is enclosed. No conflict of interest exits in the submission of this manuscript, and the manuscript is approved by all authors for publication.

References

  1. Bechtel, D.B.; Zayas, I.; Kaleikau, L.; Pomeranz, Y. Size-distribution of wheat starch granules during endosperm development. Cereal Chem. 1990, 67, 59–63. [Google Scholar]
  2. Morell, M.; Rahman, S.; Abrahams, S.; Appels, R. The biochemistry and molecular biology of starch synthesis in cereals. Funct. Plant Biol. 1995, 22, 647–660. [Google Scholar] [CrossRef]
  3. Salman, H.; Blazek, J.; Lopez-Rubio, A.; Gilbert, E.P.; Hanley, T.; Copeland, L. Structure–function relationships in A and B granules from wheat starches of similar amylose content. Carbohydr. Polym. 2009, 75, 420–427. [Google Scholar] [CrossRef]
  4. Srichuwong, S.; Jane, J.-L. Physicochemical properties of starch affected by molecular composition and structures: A Review. Food Sci. Biotechnol. 2007, 16, 663–674. [Google Scholar]
  5. Pérez, S.; Bertoft, E. The molecular structures of starch components and their contribution to the architecture of starch granules: A comprehensive review. Starch Stärke 2010, 62, 389–420. [Google Scholar] [CrossRef]
  6. Zhang, B.; Li, X.; Liu, J.; Xie, F.; Chen, L. Supramolecular structure of A-and B-type granules of wheat starch. Food Hydrocoll. 2013, 31, 68–73. [Google Scholar] [CrossRef]
  7. Zhang, C.; Jiang, D.; Liu, F.; Cai, J.; Dai, T.; Cao, W. Starch granules size distribution in superior and inferior grains of wheat is related to enzyme activities and their gene expressions during grain filling. J. Cereal Sci. 2010, 51, 226–233. [Google Scholar] [CrossRef]
  8. Shinde, S.V.; Nelson, J.E.; Huber, K.C. Soft Wheat Starch Pasting Behavior in Relation to A- and B-type Granule Content and Composition. Cereal Chem. 2003, 80, 91–98. [Google Scholar] [CrossRef]
  9. Raeker, M.Ö.; Gaines, C.S.; Finney, P.L.; Donelson, T. Granule size distribution and chemical composition of starches from 12 soft wheat cultivars. Cereal Chem. 1998, 75, 721–728. [Google Scholar] [CrossRef]
  10. Gerits, L.R.; Pareyt, B.; Delcour, J.A. Wheat starch swelling, gelatinization and pasting: Effects of enzymatic modification of wheat endogenous lipids. LWT Food Sci. Technol. 2015, 63, 361–366. [Google Scholar] [CrossRef]
  11. Yan, Z.; Jinfeng, D.; Jianmin, S.; Gavin, H.S.; Yongxin, P.; Chunyan, L.; Xinkai, Z.; Wenshan, G. Grain yield, starch content and activities of key enzymes of waxy and non-waxy wheat (Triticum aestivum L.). Sci. Rep. 2018, 8, 4548. [Google Scholar]
  12. Meredith, P. Large and small starch granules in wheat–are they really different? Starch Stärke 1981, 33, 40–44. [Google Scholar] [CrossRef]
  13. Sandhu, K.S.; Sharma, L.; Kaur, M. Effect of granule size on physicochemical, morphological, thermal and pasting properties of native and 2-octenyl-1-ylsuccinylated potato starch prepared by dry heating under different pH conditions. LWT-Food Sci. Technol. 2015, 61, 224–230. [Google Scholar] [CrossRef]
  14. Guo, Q.; He, Z.; Xia, X.; Qu, Y.; Zhang, Y. Effects of Wheat Starch Granule Size Distribution on Qualities of Chinese Steamed Bread and Raw White Noodles. Cereal Chem. 2014, 91, 623–630. [Google Scholar] [CrossRef]
  15. Li, W.; Gao, J.; Wu, G.; Zheng, J.; Ouyang, S.; Luo, Q.; Zhang, G. Physicochemical and structural properties of A- and B-starch isolated from normal and waxy wheat: Effects of lipids removal. Food Hydrocoll. 2016, 60, 364–373. [Google Scholar] [CrossRef]
  16. Kaur, A.; Shevkani, K.; Katyal, M.; Singh, N.; Ahlawat, A.K.; Singh, A.M. Physicochemical and rheological properties of starch and flour from different durum wheat varieties and their relationships with noodle quality. J. Food Sci. Technol. 2016, 53, 2127–2138. [Google Scholar] [CrossRef] [Green Version]
  17. Panozzo, J.; Eagles, H. Cultivar and environmental effects on quality characters in wheat. I. Starch. Aust. J. Agric. Res 2000, 51, 629–636. [Google Scholar] [CrossRef]
  18. Wang, X.; Cai, J.; Liu, F.; Jin, M.; Yu, H.; Jiang, D.; Cao, W. Pre-anthesis high temperature acclimation alleviates the negative effects of post-anthesis heat stress on stem stored carbohydrates remobilization and grain starch accumulation in wheat. J. Cereal Sci. 2012, 55, 331–336. [Google Scholar] [CrossRef]
  19. Zhang, T.; Wang, Z.; Yin, Y.; Cai, R.; Yan, S.; Li, W. Starch content and granule size distribution in grains of wheat in relation to post-anthesis water deficits. J. Agron. Crop. Sci. 2010, 196, 1–8. [Google Scholar] [CrossRef]
  20. Ni, Y.; Wang, Z.; Yin, Y.; Li, W.; Yan, S.; Cai, T. Starch granule size distribution in wheat grain in relation to phosphorus fertilization. J. Agric. Sci. 2010, 150, 45–52. [Google Scholar] [CrossRef]
  21. Xiong, F.; Yu, X.; Zhou, L.; Zhang, J.; Jin, Y.; Li, D.; Wang, Z. Effect of nitrogen fertilizer on distribution of starch granules in different regions of wheat endosperm. Crop. J. 2014, 2, 46–54. [Google Scholar] [CrossRef] [Green Version]
  22. Li, W.; Yan, S.; Yin, Y.; Wang, Z. Starch granule size distribution in wheat grain in relation to shading after anthesis. J. Agric. Sci. 2010, 148, 183–189. [Google Scholar] [CrossRef]
  23. Li, H.; Cai, J.; Jiang, D.; Liu, F.; Dai, T.; Cao, W. Carbohydrates accumulation and remobilization in wheat plants as influenced by combined waterlogging and shading stress during grain filling. J. Agron. Crop. Sci. 2013, 199, 38–48. [Google Scholar] [CrossRef]
  24. Burkey, K.O.; Wells, R. Effects of natural shade on soybean thylakoid membrane composition. Photosynth. Res. 1996, 50, 149–158. [Google Scholar] [CrossRef]
  25. Huang, Q.; Liu, H.; Chen, R. Effects of shade on photosynthetic characteristics in Chieh-qua. Acta Hortic. 2004, 659, 799–804. [Google Scholar]
  26. Dai, Z.; Yin, Y.; Wang, Z. Starch granule size distribution from seven wheat cultivars under different water regimes. Cereal Chem. 2009, 86, 82–87. [Google Scholar] [CrossRef]
  27. Zhang, C. Research on Characteristics and Physiological Mechanism for Formation of Starch Granule Size Distribution in Wheat Grain Agricultural College; Nanjing Agricultural University: Nanjing, China, 2010. [Google Scholar]
  28. Wardlaw, I.F.; Moncur, L. The response of wheat to high temperature following anthesis. I. the rate and duration of kernel filling. Funct. Plant. Biol. 1995, 22, 391–397. [Google Scholar] [CrossRef]
  29. Yu, X.; Yu, H.; Zhang, J.; Shao, S.; Zhou, L.; Xiong, F.; Wang, Z. Comparison of endosperm starch granule development and physicochemical properties of starches from waxy and non-waxy wheat. Int. J. Food Prop. 2015, 18, 2409–2421. [Google Scholar] [CrossRef]
  30. Zhou, Q.; Huang, M.; Huang, X.; Xin, H.; Jing, L.; Xiao, W.; Jian, C.; Tingbo, D.; Weixing, C.; Dong, J. Effect of post-anthesis waterlogging on biosynthesis and granule size distribution of starch in wheat grains. Plant. Physiol. Biochem. 2018, 132, 222–228. [Google Scholar] [CrossRef]
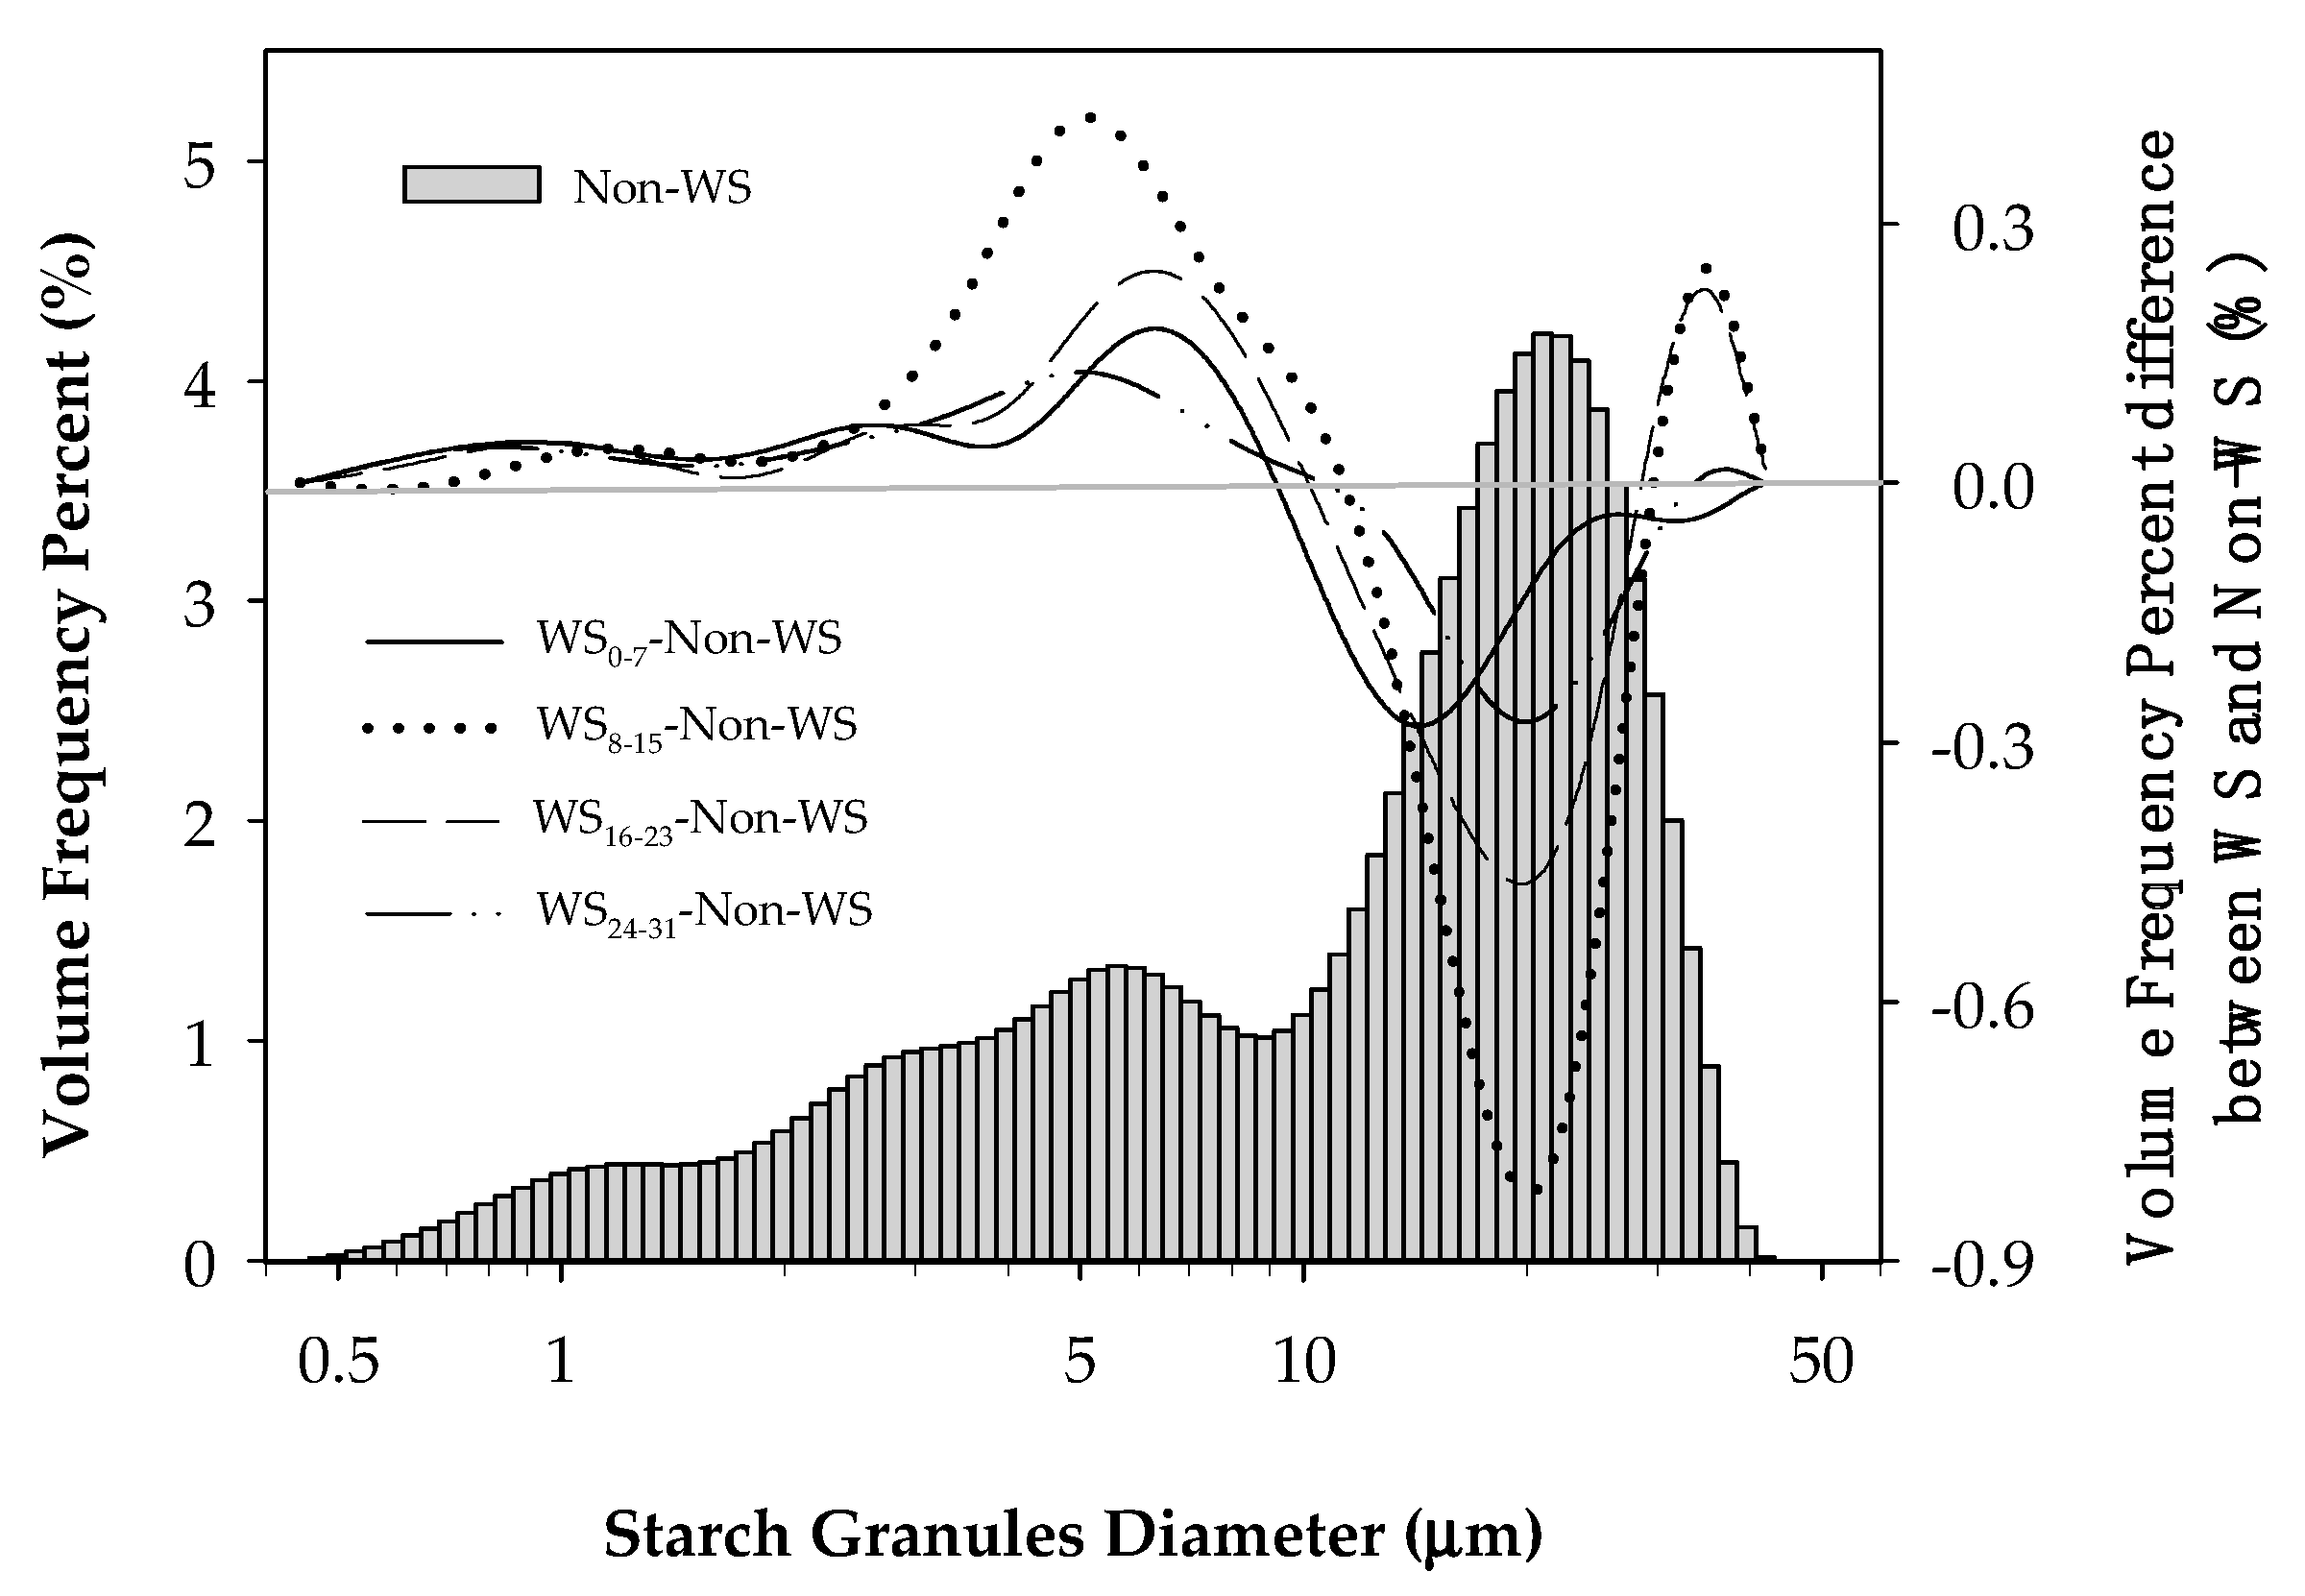
Figure 1. Effects of post-anthesis combined waterlogging and shading stress on the starch granule size distribution in the endosperm of mature wheat grains. WS–Non-WS indicates the difference of volume frequency percent distribution profile of the starch granules between WS and Non-WS.
Agriculture 10 00384 g001
Figure 2. Effects of post-anthesis combined waterlogging and shading stress on starch granule surface area distribution profile in the endosperm of mature wheat grains. WS–Non-WS indicates the difference of surface area frequency percent distribution profile of the starch granules between WS and Non-WS.
Agriculture 10 00384 g002
Figure 3. Effects of post-anthesis combined waterlogging and shading stress on starch granule number distribution profile in the endosperm of mature wheat grains. WS–Non-WS indicates the difference of the number frequency percent distribution profile of the starch granules between WS and Non-WS.
Agriculture 10 00384 g003
Table 1. Effect of combined waterlogging and shading stress during post-anthesis on starch accumulation and paste traits of wheat.
TreatmentContent
(%)
Accumulation Account
(mg/plant)
Peak Viscosity
(cP)
Trough Viscosity
(cP)
Final Viscosity
(cP)
Pasting Temperature
(°C)
AmyloseAmylopectinAmyloseAmylopectin
Non-WS14.4 d46.5 a326.9 a1055.6 a3195 c2320 a4213 a72.3 b
WS0–715 b45.6 b316.5 b962.2 b3663 b2108 b3960 b72.8 b
WS8–1516 a37.4 d300.8 c703.1 e3988 a1916 d3492 c76.8 a
WS16–2315.4 b42.7 c297.2 c824.1 d3653 b2040 c3978 b75.3 a
WS24–3114.9 c44.5 b311.4 b930.1 c3187 c2206 ab4050 ab73.5 ab
Note: WS0–7, WS8–15, WS16–23 and WS24–31 indicate the combined waterlogging and shading stress (WS) applied at 0–7 days after anthesis (DAA), 8–15 DAA, 16–23 DAA, or 24–31 DAA, respectively, and Non-WS indicates the non-stress treatment. Trait data are the means of three replicates, and different letters afterwards indicate a significant difference among treatments (p < 0.05).
Table 2. Effect of combined waterlogging and shading stress during post-anthesis on the size and volume percent distribution of different kinds of starch granules in wheat grains at maturity.
TreatmentsMean Grain Size
(μm)
Volume Frequency Percent of Different Kinds Starch Granules (%)PA/PB
B1-typeB2-typeB3-typeA1-typeA2-type
Non-WS15.03 a5.16 d10.61 d0.249 d57.31 a4.93 c1.65 a
WS0–714.68 b5.84 a11.34 b0.254 c54.3 c4.8 d1.45 b
WS8–1514.19 d5.47 c11.61a0.268 a49.51 d5.88 a1.24 d
WS16–2314.6 c5.76 b11.16 c0.263 b52.36 c5.82 b1.39 c
WS24–3114.65 b5.75 b11.25 b0.257 c54.45 b4.93 c1.47 b
Notes: Trait data are the means of three replicates, and different letters afterwards indicate significant difference among treatments (p < 0.05). PB/PA: The ratio of volume percentage of A-type to B-type starch granules. B1-, B2-, and B3-type indicating the B-type granules peaked at 1.25, 2.97, and 5.59 µm, and A1- and A2-type indicating the A-type granules peaked at 17.7 and 33.3µm, respectively. Same as below.
Table 3. Effect of combined waterlogging and shading stress during post-anthesis on character values of starch surface area distribution in wheat grains at maturity.
TreatmentsSurface Area
m2 g−1
Surface Frequency Percent of Different Kinds Starch Granules (%)
B1-typeB2-typeB3-typeA1-typeA2-type
Non-WS0.659 d31.47 d26.79 b22.59 e18.33 a0.81 b
WS0–70.689 c34.00 a26.68 b22.84 d15.72 c0.76 c
WS8–150.765 a33.56 c27.03 a24.55 a14.33 d0.93 a
WS16–230.717 b33.64 b26.16 c24.04 b15.25 c0.91 a
WS24–310.691 c33.72 b26.41 b23.03 c16.06 b0.79 b
Note: Trait data are the means of three replicates, and different letters afterwards indicate significant difference among treatments (p < 0.05).
Table 4. Effect of combined waterlogging and shading stress during post-anthesis on number frequency percent distribution of different kinds of starch granules in wheat grains at maturity.
TreatmentsNumber × 1010 g−1Number Frequency Percent of Different Kinds Starch Granules (%)
B1-typeB2-typeB3-typeA1-typeA2-type
Non-WS6.63 e85.43 d12.54 a1.86 a0.145 a0.017 b
WS0-77.39 b86.03 a12.13 c1.72 c0.135 c0.006 c
WS8-158.45 a85.94 b12.27 b1.65 c0.133 d0.018 a
WS16-237.22 c85.9 b12.13 c1.83 b0.138 c0.006 c
WS24-317.06 d85.86 c11.95 d1.73 c0.141 b0.006 c
Note: Trait data are the means of three replicates, and different letters afterwards indicate significant difference among treatments (p < 0.05).
Table 5. Correlation coefficients between starch composition, starch size distribution values and RVA characteristic parameters.
Peak ViscosityTrough ViscosityFinal ViscosityPasting Temperature
Amylose content0.890 *−0.982 **−0.943 *0.958 *
Amylopectin content−0.7820.882 *0.946 *−0.967 **
Starch content of grain−0.7520.892 *0.935 *−0.957 *
Amylose/Amylopectin0.822−0.909 *−0.962 **0.964 **
Mean grain size of starch granules−0.8160.938 *0.959 **−0.903 *
Mean grain size of B-type starch granules0.795−0.932 *−0.8390.817
Mean grain size of A-type starch granules−0.924 *0.983 **0.878−0.943 *
PA/PB−0.8650.976 **0.933 *−0.911 *
Number (×1010 g−1)0.883 *−0.944 *−0.993 **0.919 *
Surface area (m2 g−1)0.852−0.954 *−0.956 *0.971 **
* and ** indicate significant difference at 5% and 1% levels of the correlation, respectively (2-tailed).