Article

Effect of Tillage Systems on the Yield and Quality of Winter Wheat Grain and Soil Properties

1
Department of Herbology and Plant Cultivation Techniques, University of Life Sciences in Lublin, Akademicka 13, 20-950 Lublin, Poland
2
Department of Plant Production Technology and Commodities Science, University of Life Sciences in Lublin, Akademicka 13, 20-950 Lublin, Poland
*
Author to whom correspondence should be addressed.
Agriculture 2020, 10(9), 405; https://doi.org/10.3390/agriculture10090405
Submission received: 2 September 2020 / Revised: 11 September 2020 / Accepted: 11 September 2020 / Published: 13 September 2020
(This article belongs to the Section Crop Production)

Abstract

:
This study aimed to evaluate the yield and quality of winter wheat grain and soil properties in three tillage systems (TS): (1) Conventional (CT), (2) reduced (RT), and (3) no-tillage (NT). In the CT system, shallow ploughing (at a depth of 10–12 cm from soil surface) and pre-sow ploughing (at a depth of 18–22 cm from soil surface) were performed after the harvest of the previous crop (peas). In the RT system, the shallow ploughing was replaced by field cultivation, whereas pre-sow ploughing was by a tillage unit. In the NT system, a herbicide treatment with glyphosate (4 L ha−1) replaced the ploughing measures, whereas a tillage unit including a cultivator, a string roller, and a harrow was used before wheat sowing. Higher wheat yields were recorded in CT than in NT (by 4.3%) and in 2016 compared to 2015 (by 23.4%). The tillage system differentiated spike number m−2, whereas study years affected spike number m−2, grain weight per spike, and 1000 grain weight. Study years also influenced all quality traits of the grain, whereas tillage systems—only grain uniformity and ash content of the grain. A less uniform grain with a higher ash content was produced in NT than in CT and RT systems. Organic C content in the soil was higher in NT than in CT and RT systems. In turn, total nitrogen and phosphorus contents were higher in the soil from NT and RT than CT, whereas potassium and magnesium contents—in RT and NT compared to the CT system.

1. Introduction

The yield and quality of wheat grain are determined by agrotechnical measures and habitat conditions [1,2,3]. Wheat yield can be reduced due to soil quality (light and acidic soils) and rainfall deficiency during intensive plant growth [4,5]. The wheat grain yield and quality are also affected by the plants’ sequence in crop rotation [6,7,8,9]. The best yield-forming results are obtained with legumes used as the previous crop [8,10,11,12]. However, most often, wheat is sown after cereals, which promotes the growth of weeds [13,14,15,16], and the development of take-all diseases [17]. As a result, a significant reduction is observed in grain yield and quality, in particular a decrease in volumetric mass and grain uniformity, and an increase in the ash content of the grain [18,19,20].
Cultivation also has a significant impact on grain yield and its quality, as it shapes the physical, chemical, and biological properties of soil, which directly affects plant growth [13,21,22,23]. The purpose of cultivation is to create optimal conditions for plants to produce a high grain yield. However, opinions about tillage systems are ambiguous, and the effects of cultivation depend on habitat conditions and sown plants [7,9,24,25,26]. As reported by Morris et al. [19], plant performance depends on many habitat and agrotechnical factors affecting each other. Many studies [18,19,27,28] have shown that in regions with a low sum of precipitation, crops are yielding higher in the no-tillage than in the conventional tillage system. The research conducted by Morris et al. [29] and Jug et al. [30] have shown that wheat grain quality was influenced to a greater extent by weather conditions and varietal characteristics than tillage systems. Similarly, Woźniak and Stępniowska [28] showed that the content of total protein and wet gluten, as well as grain density and uniformity were more affected by years of research than tillage systems. A higher content of protein and gluten was characteristic of the grain harvested in the years with the lowest precipitation, while a lower one at precipitation deficiency. High precipitation favored the accumulation of phytic-P and copper, while precipitation shortage increased potassium and magnesium contents in the grain. Conventional tillage promoted phytic-P and iron accumulation, whereas direct sowing—that of phosphorus, potassium, magnesium, and copper. However, in the studies of Amato et al. [31], the protein content of wheat grain varied depending on the tillage systems, being the highest in the grain from the conventional tillage (CT), a lower one in the grain from reduced tillage (RT), and the lowest one in the grain from no-tillage (NT). According to Amato et al. [31], wheat fertilization requirements for nitrogen are higher in NT than CT due to the lower availability of nitrogen for plants.
According to Rühlemann and Schmidtke [32], agriculture should not focus solely on high crop yields, but must also consider the stable relationship between agricultural human activity and natural environment quality. The stability and durability of the soil environment should be based on improving soil properties and even improving its structure [9,10,21]. Intensive plow cultivation accelerates the mineralization of organic matter in soil and increases the loss of nutrients, which ultimately negatively affects agricultural ecosystems [23,33,34].
In many regions of Poland, there is a significant precipitation deficit in the spring and summer months, which negatively affects the growth and yield of plants. Therefore, optimal solutions are being sought in the field of soil tillage to minimize crop losses. This has underlain the hypothesis that the yields and quality of winter wheat grain can be similar in conventional (CT), reduced (RT), and no-tillage (NT) systems. In addition, the no-tillage system increases the content of nitrogen and organic carbon in the soil, and affects the contents of nutrients: Phosphorus, potassium, and magnesium. This study aimed to assess the yield and quality of winter wheat grain and soil properties in conventional (CT), reduced (RT), and no-tillage (NT) systems.

2. Materials and Methods

2.1. Experiment Localization and Scheme

A field experiment was conducted in the years 2014–2016 at the Uhrusk Experimental Farm belonging to the University of Life Sciences in Lublin and located in south-eastern Poland (51°18′ N, 23°36′ E). The experimental field is a flat area located 175 m asl. The experiment was established with the method of randomized blocks (6 × 75 m) in three replications (Figure 1 and Figure 2).
Winter wheat (Triticum aestivum L.) of Ozon cultivar was grown in three tillage systems: (1) Conventional (CT); (2) reduced (RT); and (3) no-tillage (NT). In the CT system, shallow ploughing (at a depth of 10–12 cm) and pre-sow ploughing in mid-September (18–22 cm) were performed after the harvest of the previous crop (peas). In the RT system, the shallow ploughing was replaced by a double field cultivation, whereas pre-sow ploughing by a tillage unit. In the NT system, a herbicide treatment with glyphosate (4 L ha−1) replaced the ploughing measures, whereas a tillage unit including a cultivator, a string roller, and a harrow was used before wheat sowing. After the harvest, the straw was left in the field. In each study year, wheat was sown in the last week of September, at a sowing density of 500 seeds m−2. Before wheat sowing, the soil was fertilized with nitrogen (20 kg N ha−1), phosphorus (35 kg P ha−1), and potassium (90 kg K ha−1) fertilizers. In the spring, nitrogen fertilizers were applied in three terms: (1) 75 kg N ha−1 at the tillering stage (22–23 in the BBCH scale) [35]; (2) 45 kg N ha−1 at the shooting stage (32–33 in the BBCH scale); and (3) 20 kg N ha−1 at the onset of the ear formation stage (52 in the BBCH scale). The total amount of fertilizers used was 160 kg N ha−1.
Winter wheat crops were protected against fungal diseases by using fungicides composed of flusilazole and carbendazim (1 L ha−1) at the tillering stage (31–32 BBCH), as well as propiconazole and fenpropidine (1 L ha−1) at the heading stage (43–44 BBCH). Weeds were eradicated using herbicides containing a mixture of the following active substances MCPA + mecoprop + dicamba (1.5 L ha−1) and fenoxaprop-P-ethyl (1 L ha−1) at the tillering stage (24–25 BBCH).

2.2. Soil and Weather Conditions

The experiment was established on the soil classified as Rendzic Phaeozem [36], with a sandy clay composition including 26% of silty fraction and 13% of dust fraction. This soil type has an alkaline pH, high contents of available phosphorus and potassium, and a medium content of magnesium. The growing season (the number of days with an average daily temperature above + 5 °C) spans for 210–215 days and begins in the second half of March. The following sums of precipitation were recorded in individual study years: 630 mm in 2014, 448 mm in 2015, and 681 mm in 2016 (Figure 3). Since the renewal of spring vegetation until winter wheat harvest (the first week of August), the sums of precipitations were as follows: 319 mm in 2014, 157 mm in 2015, and 320 mm in 2016. The highest monthly sums of precipitation were recorded in May—65 mm on average, June—73 mm, and July—80 mm, whereas the mean air temperatures recorded in the respective months were at 14.1, 17.3, and 19.5 °C. In the winter months, the sums of precipitation reached 30 mm on average in December, 23 mm in January, and 26 mm in February, whereas average air temperatures reached −1.8, −4.0, and −2.8 °C, respectively.

2.3. Production Traits and Statistical Analysis
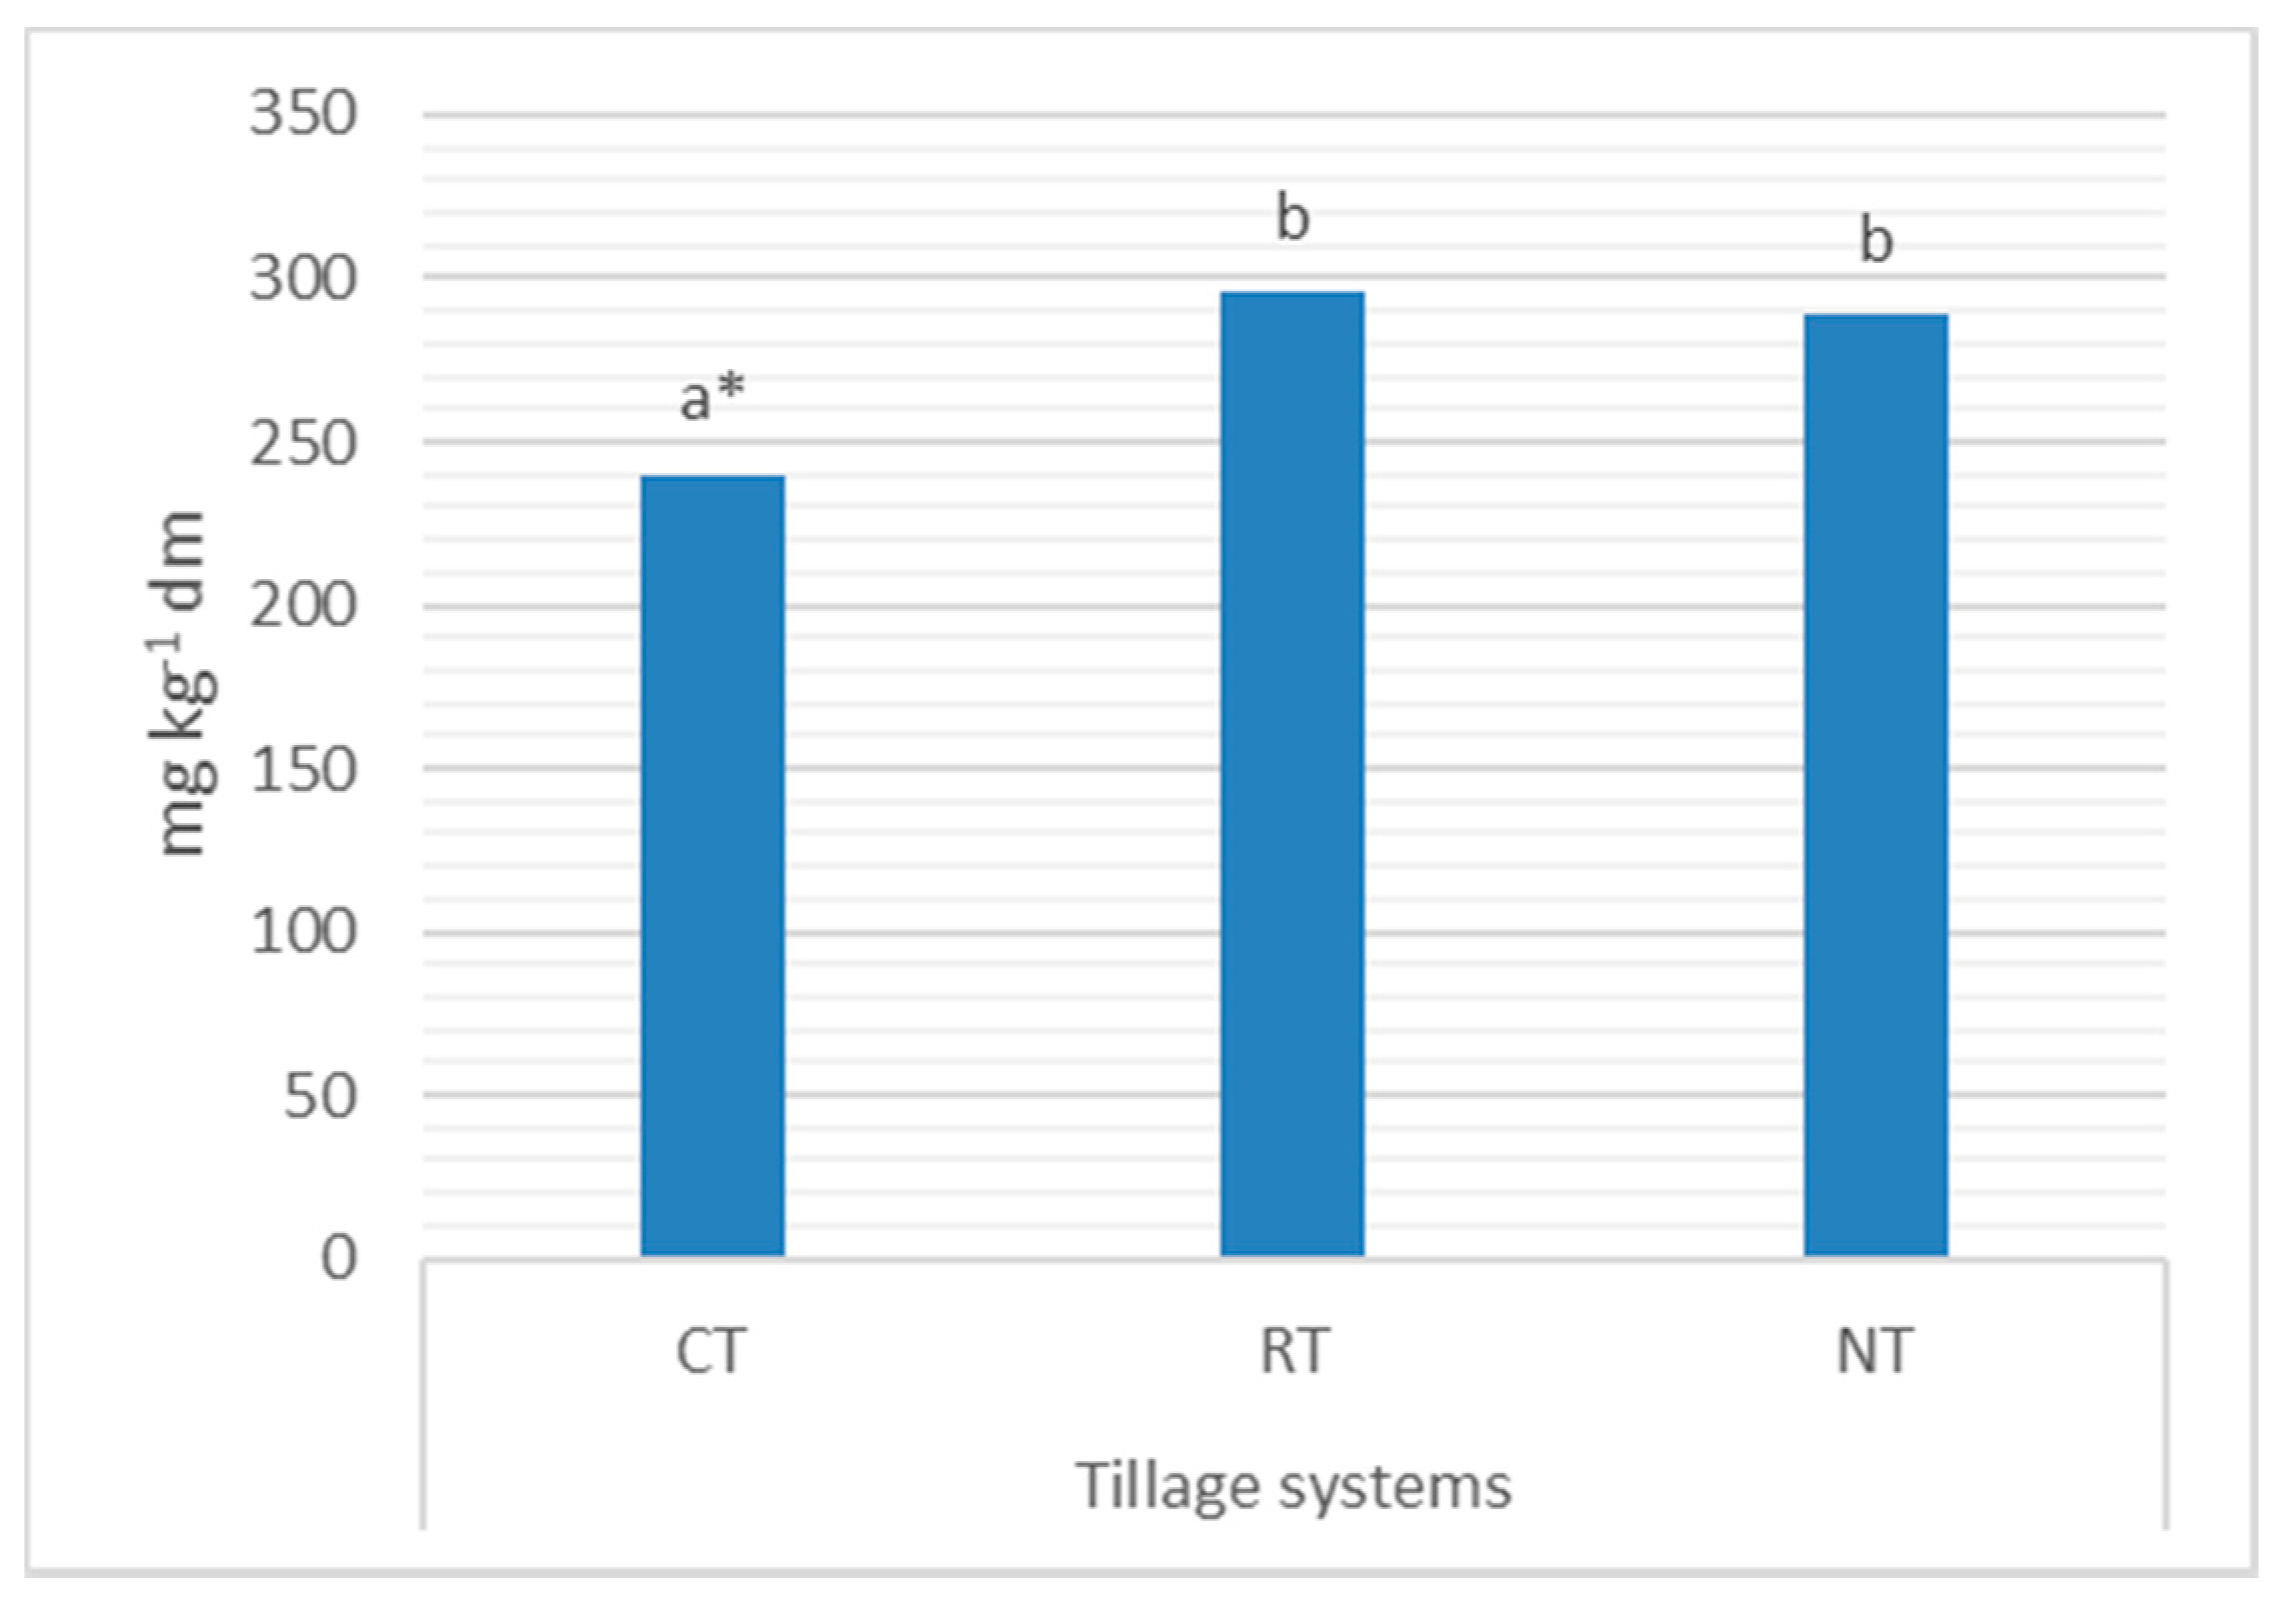
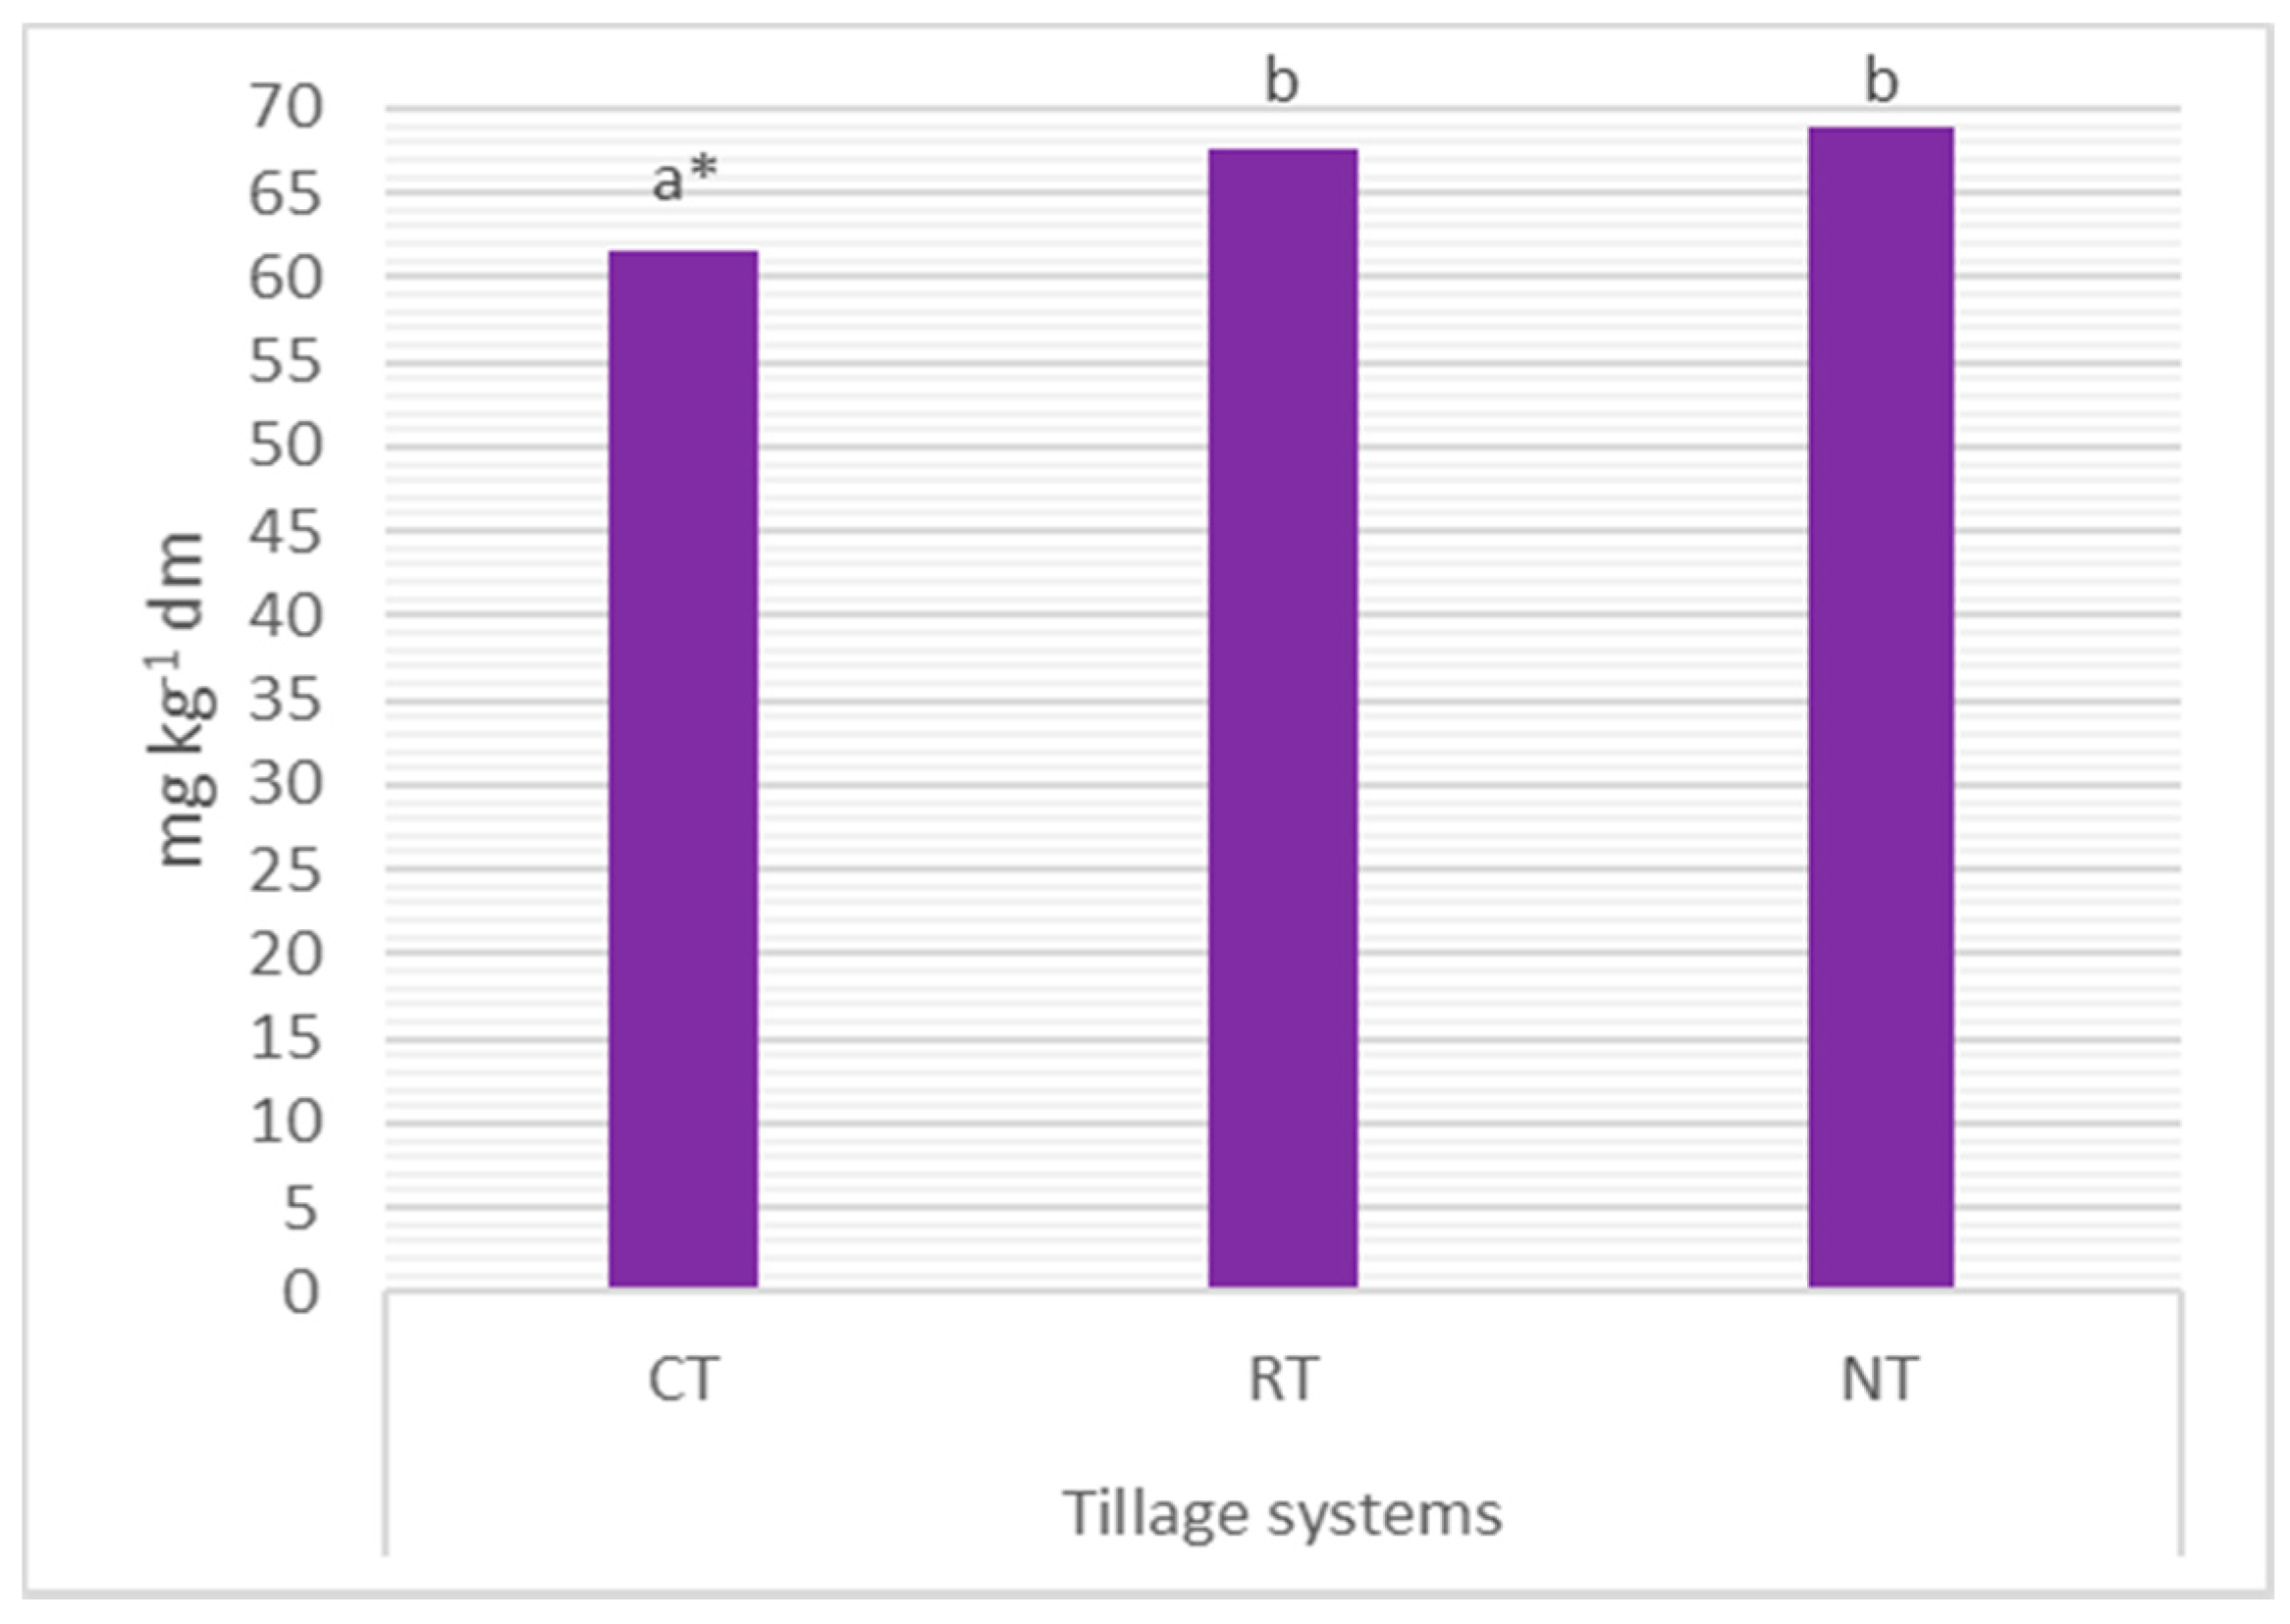
Determinations were carried out for the following production traits: (1) Grain yield and its components: Spike number m−2, grain weight per spike, 1000 grain weight; (2) quality traits of grain including its milling traits (volumetric weight of grain, grain uniformity) and baking traits (total protein content, wet gluten content, Zeleny’s sedimentation index, ash content); as well as (3) soil properties including contents of: Organic C, total N, nitrate nitrogen (N-NO3), ammonia nitrogen (N-NH4), and available forms of phosphorus (P), potassium (K), and magnesium (Mg).
Wheat grain was harvested using a plot harvester. The number of spikes was counted at each plot on the area of 1 m2. The 1000 grain weight was determined by counting and weighing 2 × 500 grains. Contents of total protein and wet gluten, and the sedimentation index were determined with the near infrared reflectance spectroscopy (NIRS) method. The volumetric weight of grain was established using a chondrometer having a volume of 1 L; grain uniformity was evaluated using a sorter with mesh size of 2.5 × 25 mm, whereas ash content of the grain was determined by high-temperature wet-mineralization. The soil samples were determined for contents of: Organic C (with the Tiurin’s method); total N (with the Kjeldahl’s method); N-NO3 (with the colorometric method using phenoldisulfonic acid); N-NH4 (with the method using the Nessler’s reagent); and available forms of: P (with the Egner-Riehm’s method), K (with the Egner-Riehm’s method), and Mg (with the Schachtschabel’s method). To determine the above traits, five primary soil samples were collected from each plot from a depth of 0–25 cm from soil surface. They represented one bulk sample weighing 0.5 kg. All determinations were made in triplicate.
Results obtained were subjected to the analysis of variance (ANOVA), whereas the significance of differences between mean values for tillage systems (YS) and study years (Y) was determined with Tukey’s HSD test, p < 0.05.

3. Results

3.1. Grain Yield and Its Components

A higher winter wheat grain yield was produced in CT than in the NT system (by 4.3%), and in 2014 and 2016 compared to 2015 (by 19.9% and 23.4%, respectively)—Table 1. The grain yield was also differentiated by the TS × Y interaction. In 2014, higher grain yield was produced in NT and RT than in the CT system (by 13.6% and 11.2%, respectively), whereas in 2016, a higher yield was achieved in CT compared to RT and NT (by 13.6% and 25.7%, respectively). Grain yield variability was due to the various spike number m−2, grain weight per spike, and 1000 grain weight in different tillage systems and study years. A higher spike number m−2 was recorded in the CT system compared to NT (by 8.1%) and also in 2014 compared to 2015 (by 17.7%). In turn, the grain weight per spike and 1000 grain weight were affected only by the study year. The grain weight per spike was higher in 2016 than in 2015 (by 14.1%), whereas the 1000 grain weight was higher in 2014 than in 2015 (by 19.2%). These results indicate that the grain yield was influenced more by study years than by tillage systems, which was also confirmed by variance analysis components.

3.2. Grain Quality Attributes

The winter wheat grain weight per volume was differentiated only by study years (Table 2). The precipitation from April until July of 2015 was lower by 50% than in the other study years, which contributed to poor grain filling and, consequently, to the lower volumetric weight of the grain than in the other years. A further consequence was the worse grain uniformity compared to the other study years; however, this trait was also affected by tillage systems. More uniform grain was produced in the CT than in the NT system. The total protein content of wheat grain was also year-dependent. Its higher value was determined in the grain harvested in 2015 compared to the other study years. Analogous changes were observed for wet gluten content, with its higher value determined in 2016 than in 2014. Moreover, the value of the Zeleny’s sedimentation index was higher in 2016 than in the other years analyzed. The total ash content was higher in the grain harvested from NT than from CT and RT plots, and also in 2015 compared to 2014 and 2016. However, the highest ash content was determined in the grain harvested in 2015 from the NT plot compared to the other study years and tillage systems. The variance analysis components indicate that the wheat grain quality was more affected by study years than by tillage systems.

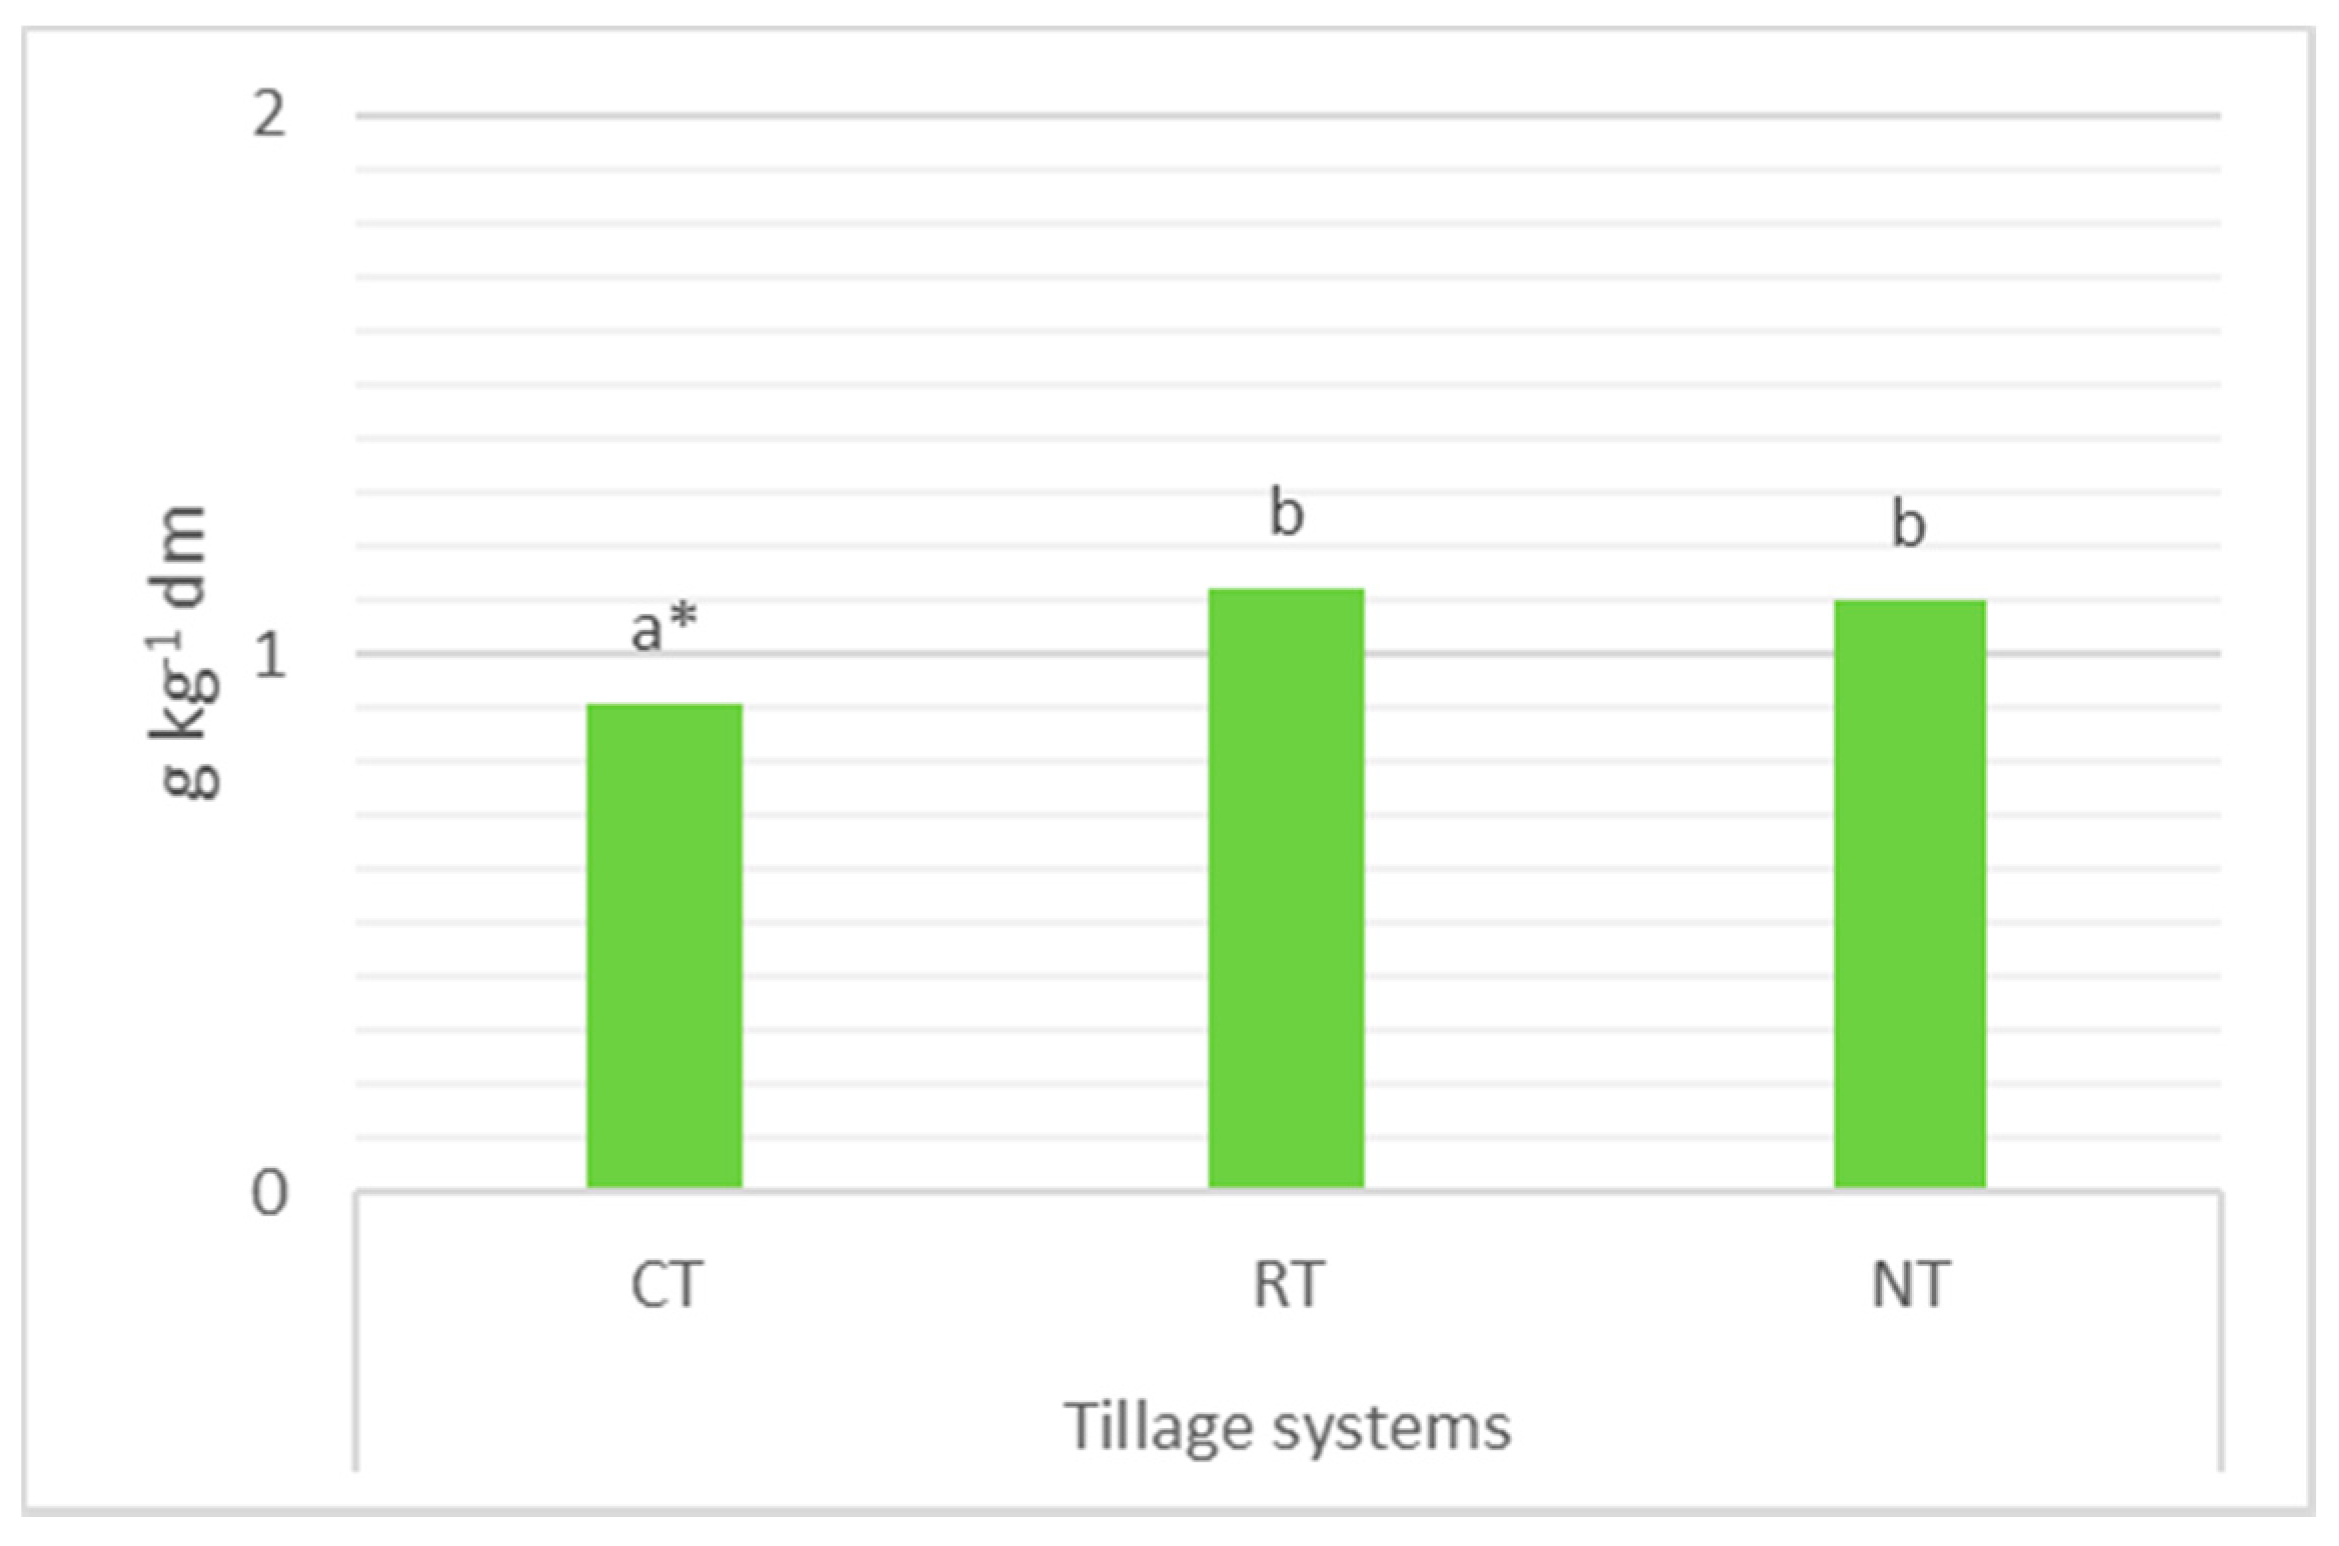
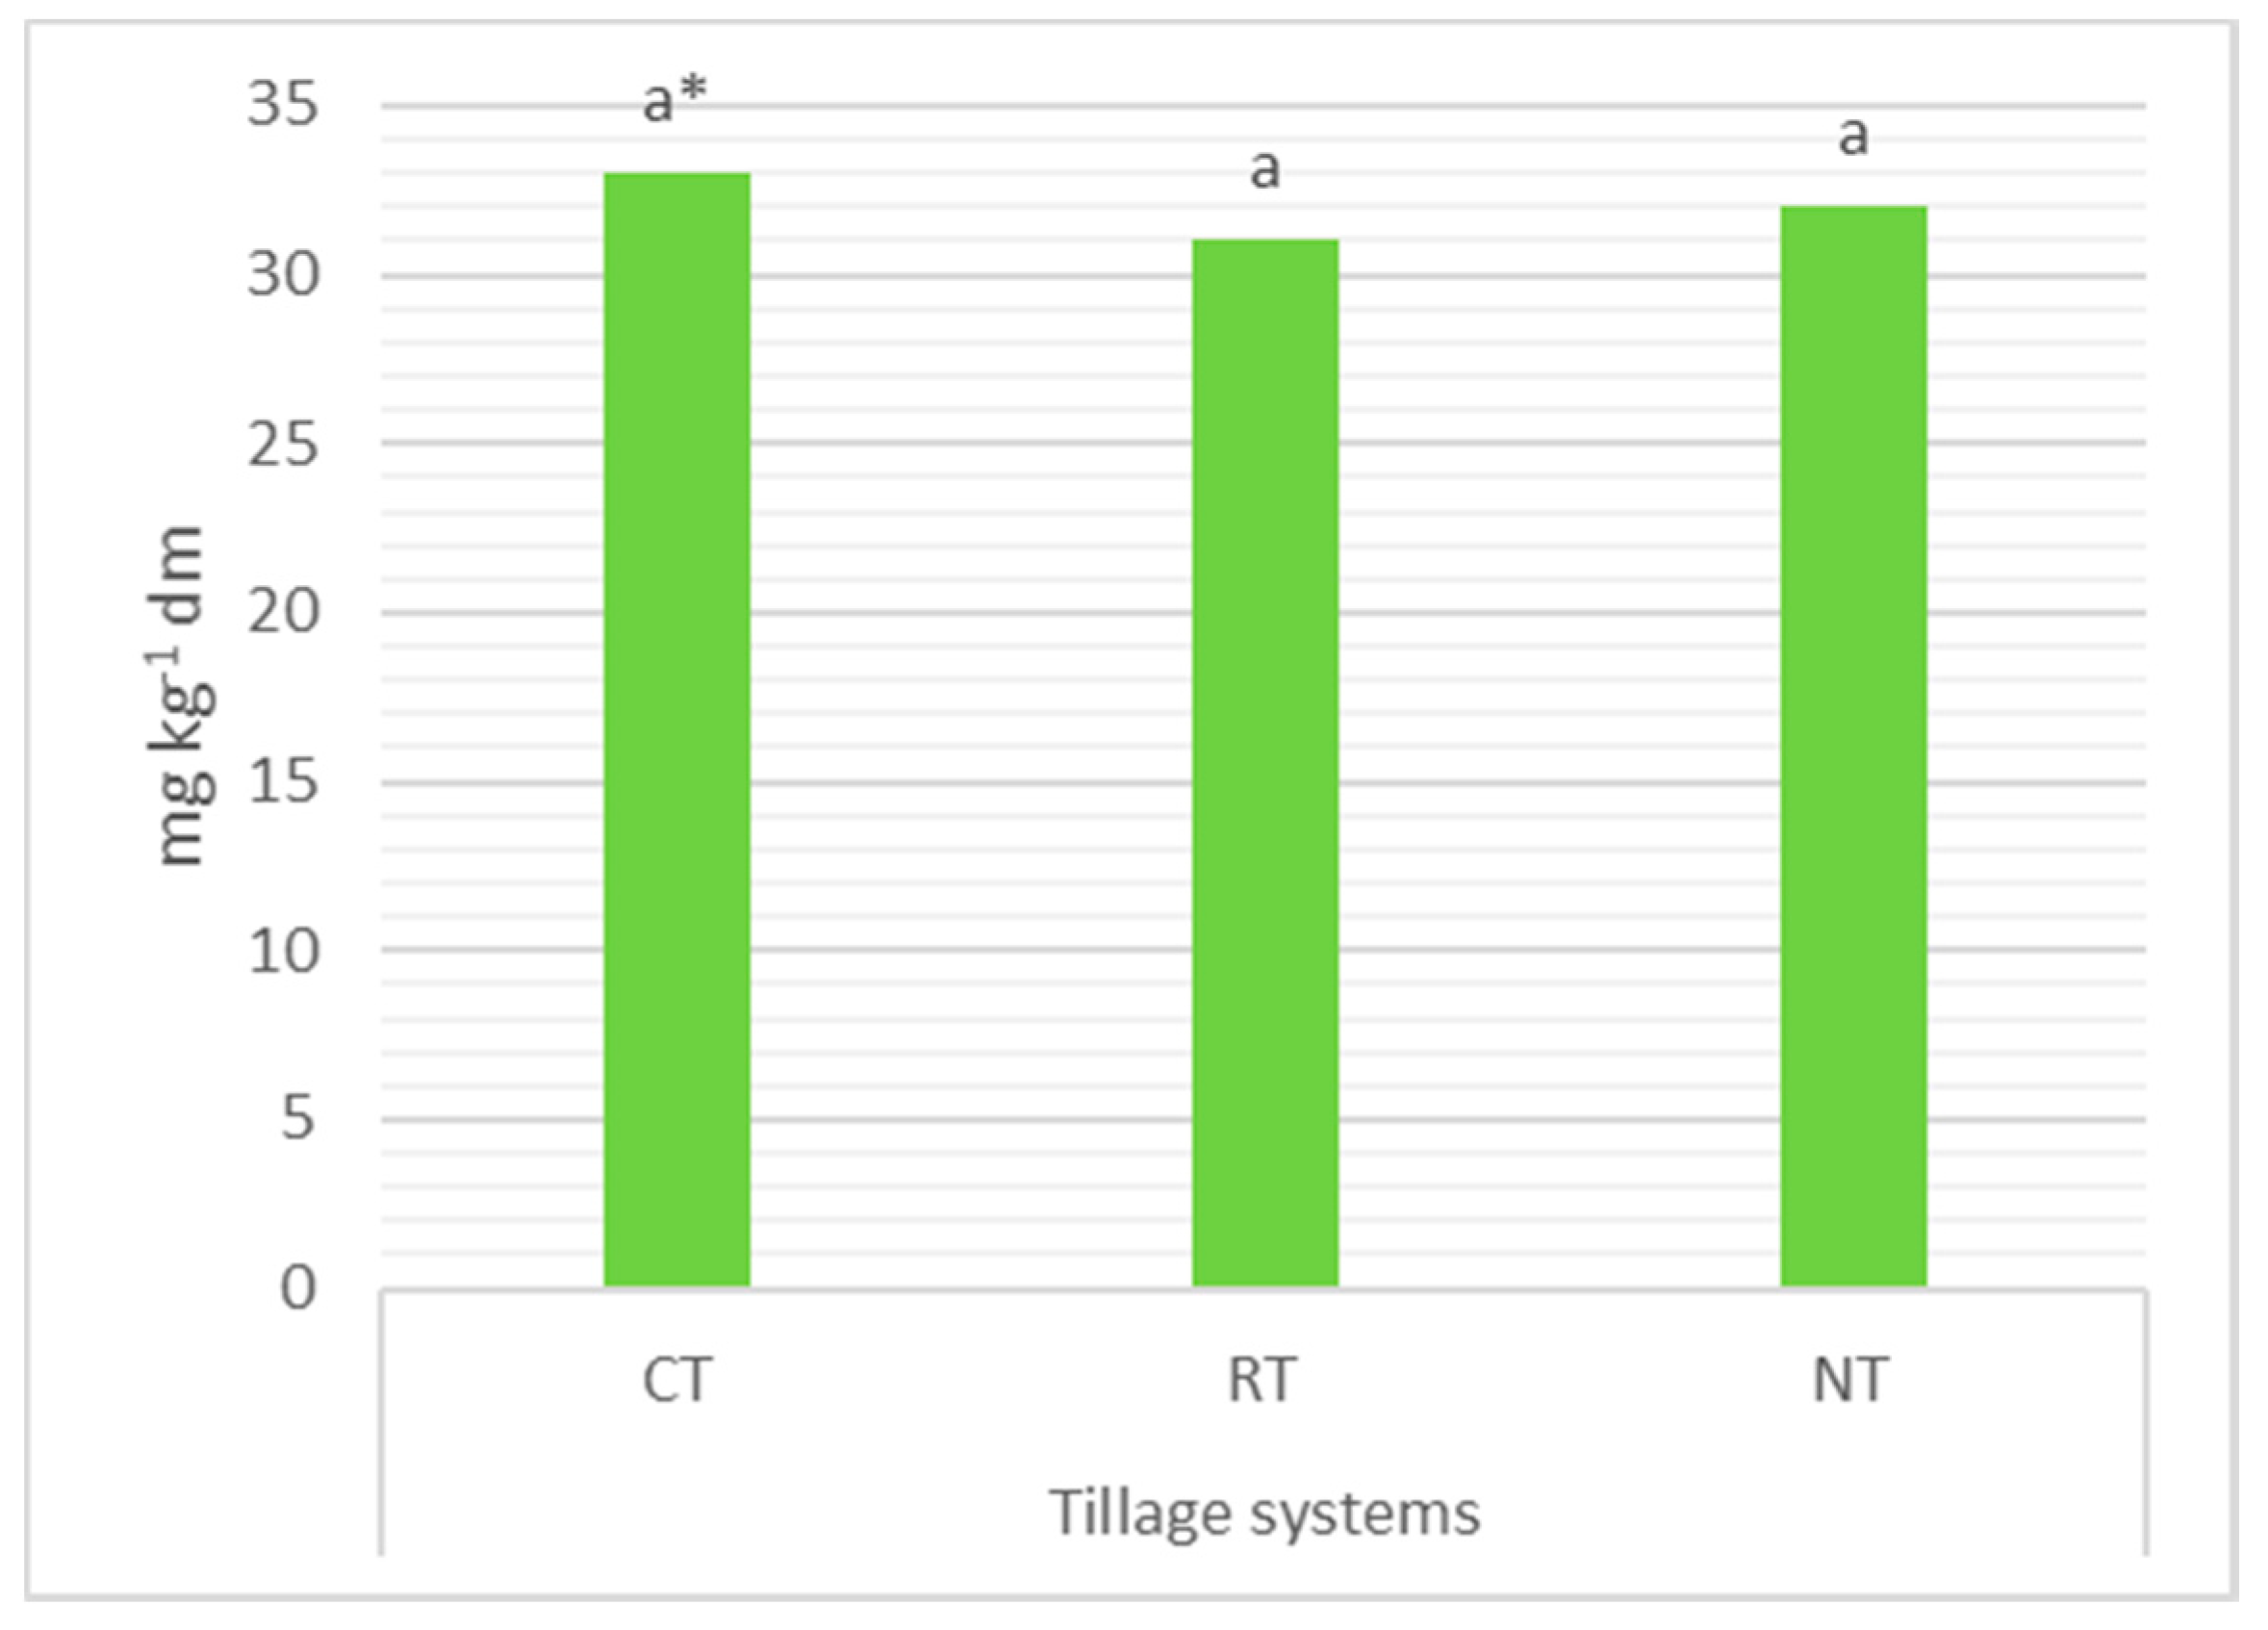
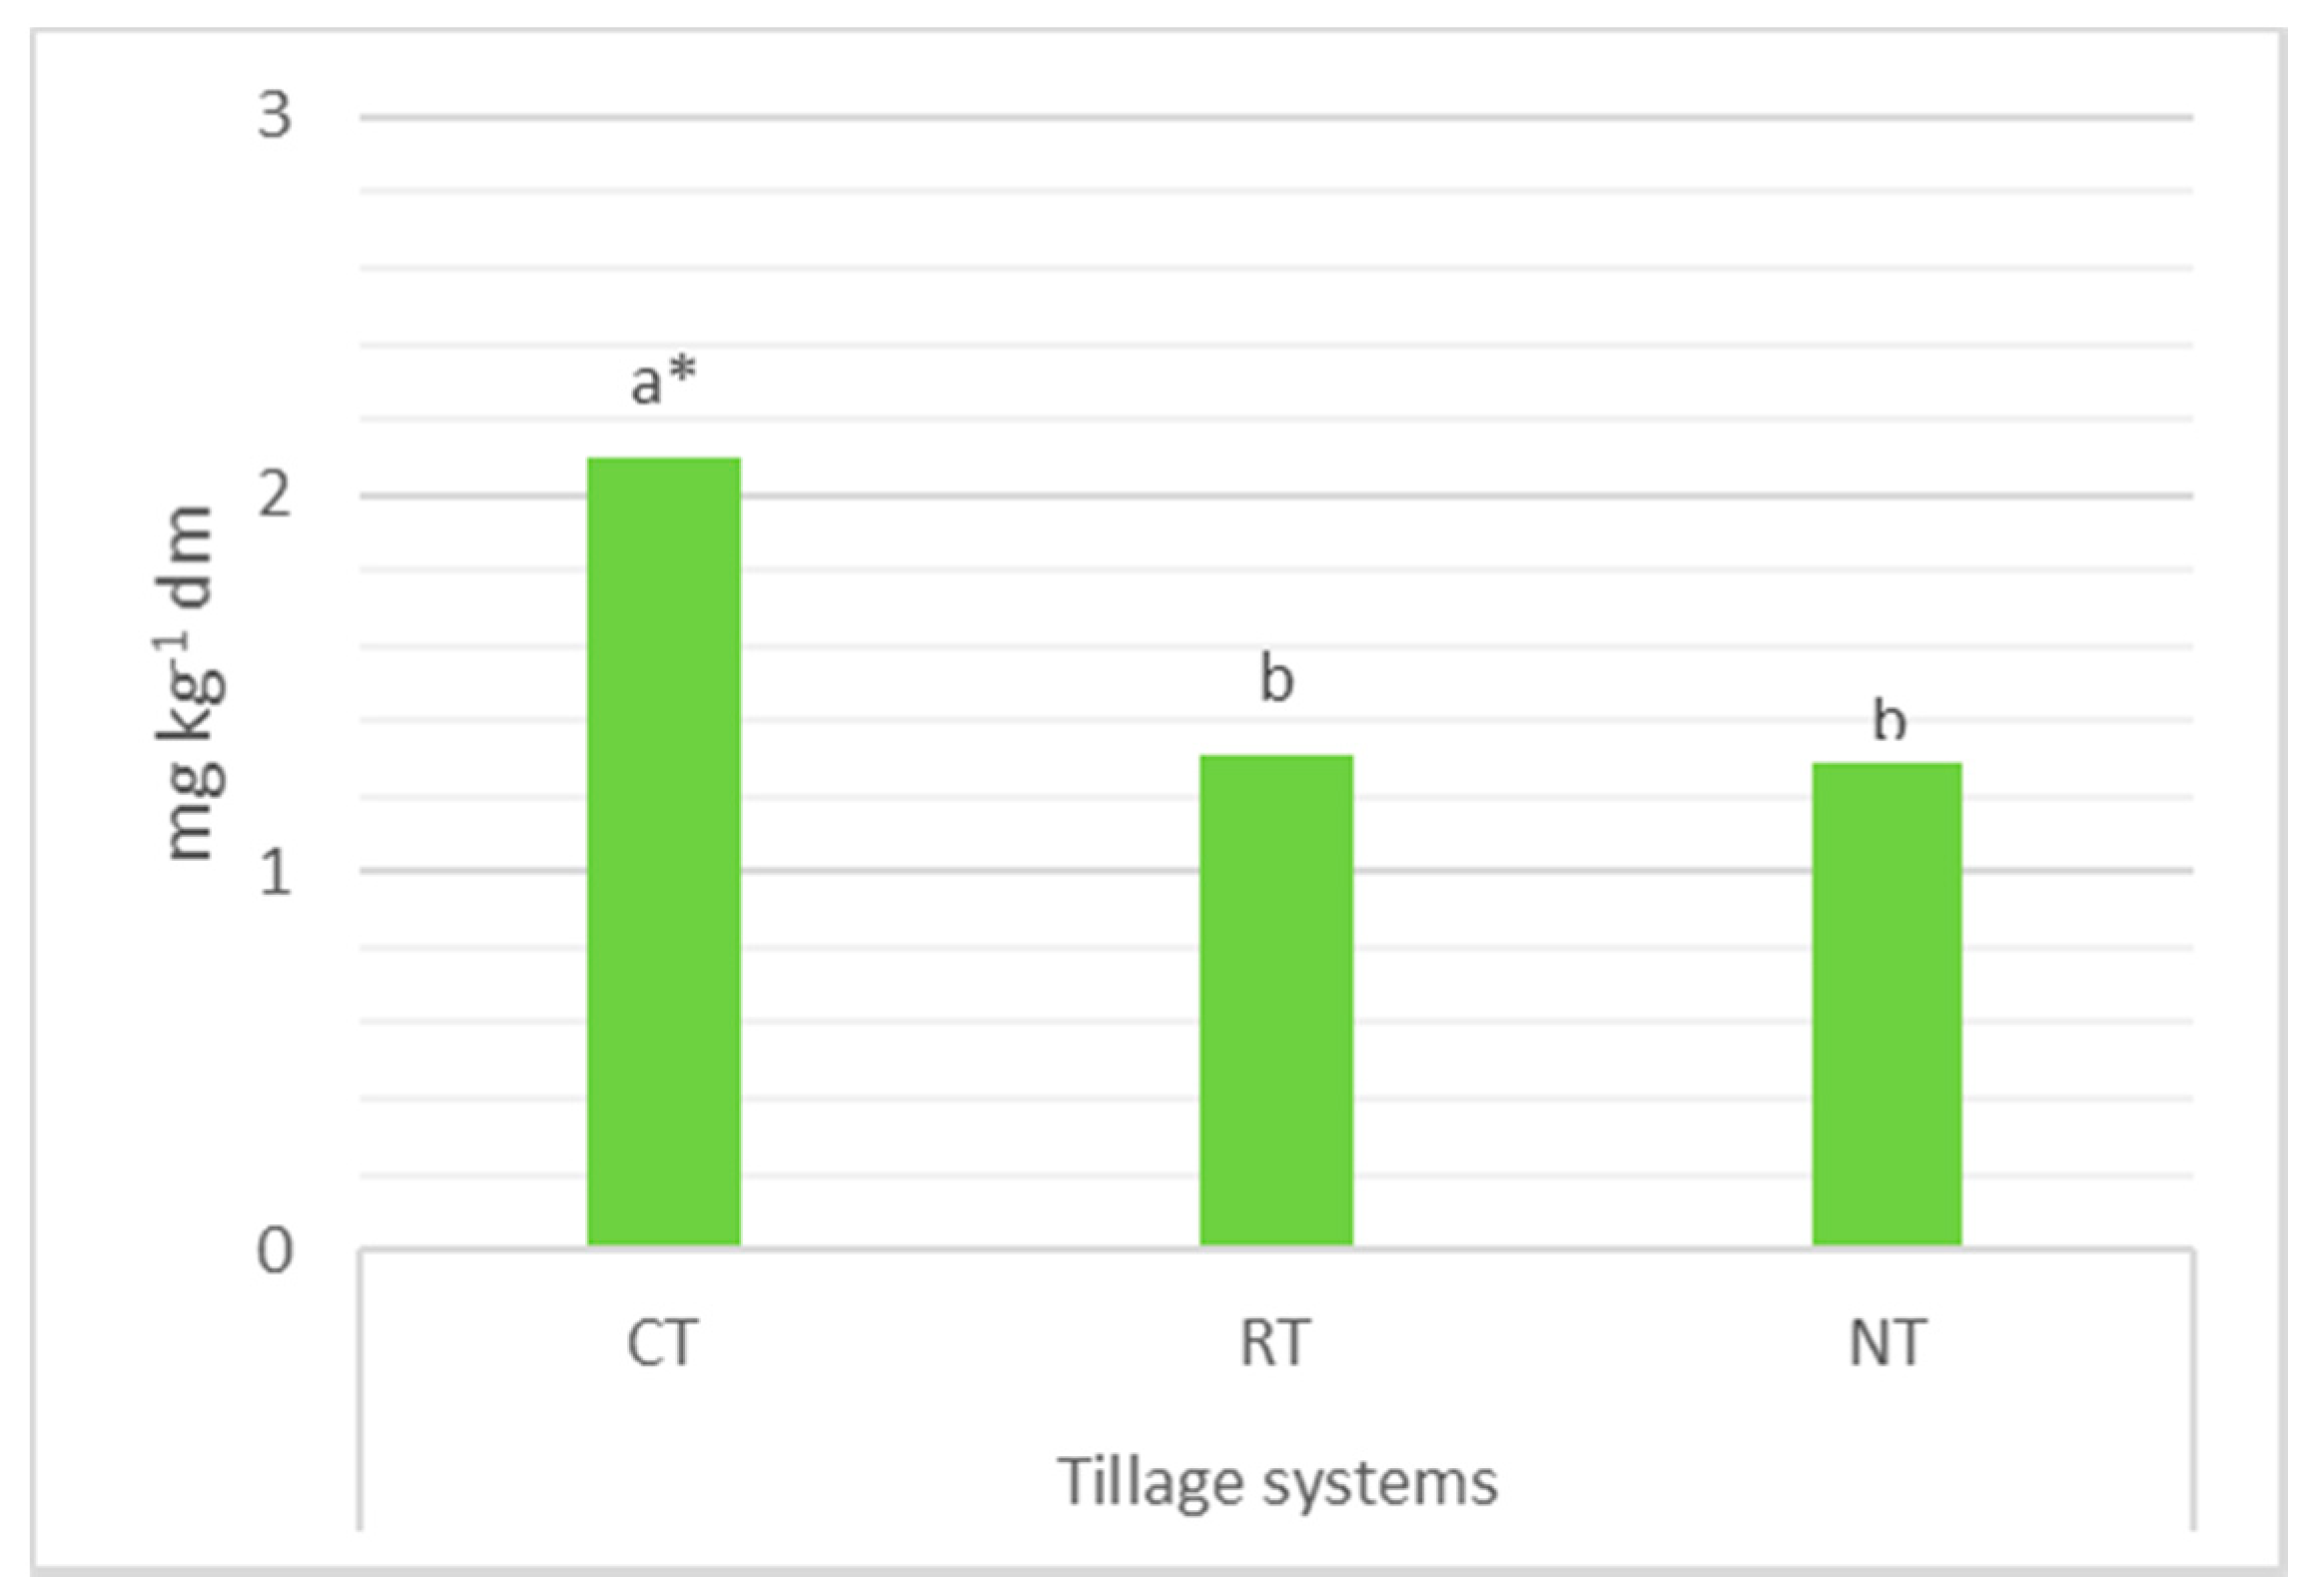
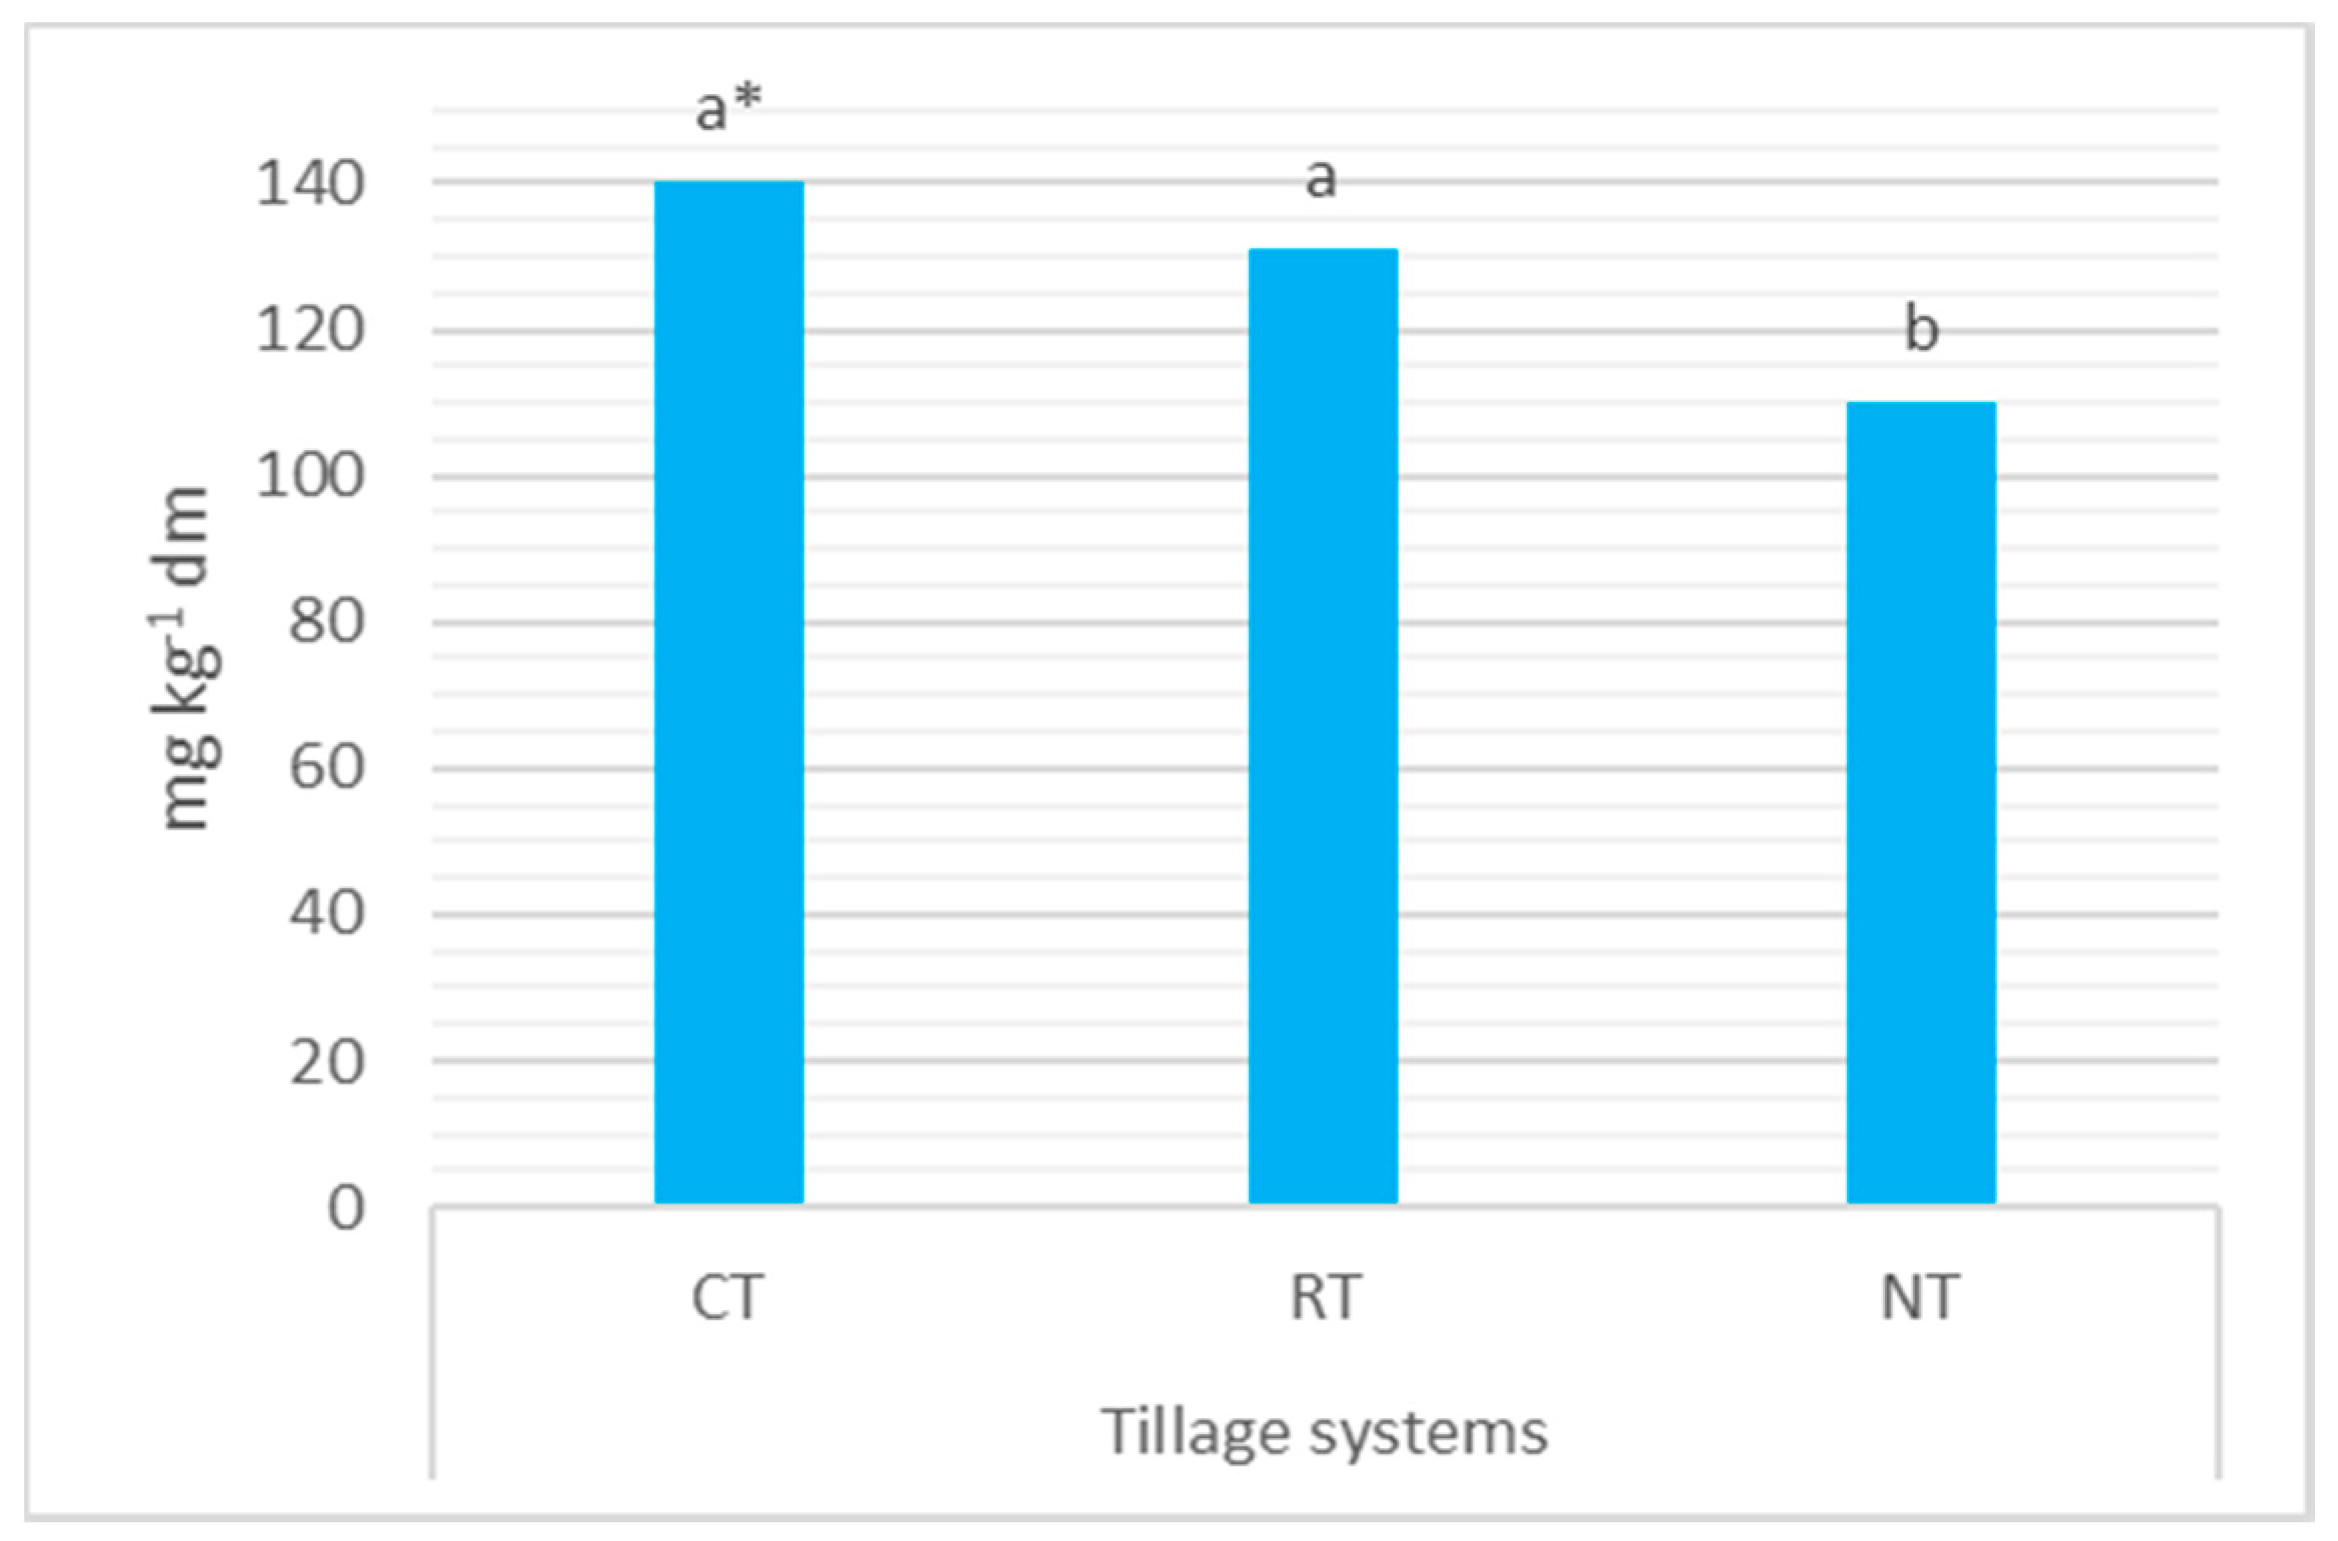
3.3. Soil Properties

The organic C content in the soil was higher in the NT than in RT and CT systems (by 11.5% and 31.2%, respectively) (Figure 4). A significant difference was also noted between RT and CT systems. The total N content was higher in the soil from NT than CT plots (by 18.7%) (Figure 5); however, it did not affect nitrate nitrogen (N-NO3) content in the soil, which was similar in soil samples from all tillage systems (Figure 6). In contrast, the tillage systems did affect the ammonia nitrogen (N-NH4) content, which was higher (by 38%) in the soil from CT than from RT and NT plots (Figure 7). The tillage systems also influenced the content of available phosphorus (P), which was higher in the soil from CT than from RT and NT plots (Figure 8). In turn, contents of potassium (K) and magnesium (Mg) were higher in the soil from RT and NT than from CT plots (Figure 9 and Figure 10).

4. Discussion

The no-tillage system has a very positive effect on many soil properties. It plays a key role in increasing the organic C content in soil and limiting the evaporation of water from the field surface [23,37]. As a result, it creates plants with optimal conditions for growth and high yield. On moderately moist soils, such conditions are created by conventional tillage, while on dry and semi-arid soils, better results are obtained by no-tillage [18,19,22,27,38,39]. Moreover, the no-tillage system brings economic benefits, significantly reducing fuel consumption and labor consumption [40]. Nevertheless, opinions on no-tillage systems are divided. Many authors [13,41,42,43,44,45,46,47] indicate that the no-tillage cultivation system is inseparably associated with the need for using non-selective herbicides. Research shows that this may lead to the selection of species resistant to the herbicides used [48,49,50]. Soil cultivation also affects the obtained grain yield and its technological quality. In the studies of Woźniak and Gos [21], the grain yield of spring wheat sown in CT was higher by over 13% than in NT but did not affect the total protein content and wet gluten in the grain. In our experiment, the winter wheat grain yield in the CT system was only 4.3% higher than in NT. Similarly, studies [28,29,30] showed that the protein and gluten contents and sedimentation index values were more influenced by weather conditions than tillage systems. However, soil cultivation systems were reported to affect grain uniformity, ash content, and volumetric grain weight. The NT system increased the ash content of the grain but decreased the grain weight by volume and uniformity. Similar dependencies were observed in our experiment. The above indicates that the no-tillage system is recommended on areas with often repeating water deficits and that the grain yield and quality obtained in this recommended system are similar to those achieved in the conventional tillage system. Corresponding views were presented in other numerous works [24,25,31,39,47,51].

5. Conclusions

The grain yield of winter wheat was affected to a greater extent by study years than by tillage systems. The higher grain yield was obtained in the CT than the NT system and in the years with higher sums of precipitation (in 2014 and 2016). Moreover, grain quality was more dependent on the course of weather conditions in particular study years than on tillage systems. Study years differentiated the grain weight by volume, total protein content, wet gluten content, sedimentation index value, grain uniformity, and ash content of the grain. In turn, tillage systems differentiated grain uniformity and total ash content. Winter wheat cultivation in the NT system increased the total ash content of the grain and decreased grain uniformity compared to CT and RT systems. The tillage systems also affected soil properties. The no-tillage system increased contents of organic C, total N, and available forms of potassium and magnesium in the soil compared to the conventional tillage system. The choice of the tillage system should be driven by local soil and weather conditions.

Author Contributions

Conceptualization, A.W.; Data curation, A.W. and L.R.; Formal analysis, A.W. and L.R.; Methodology, A.W. All authors have read and agreed to the published version of the manuscript.

Funding

Research financed by the Ministry of Science and Higher Education of Poland as the part of statutory activities of Department of Herbology and Plant Cultivation Techniques, University of Life Sciences in Lublin.

Conflicts of Interest

The authors declare no conflict of interest.

References

  1. Rachoń, L.; Szumiło, G.; Brodowska, M.; Woźniak, A. Nutritional value and mineral composition of grain of selected wheat species depending on the intensity of a production technology. J. Elem. 2015, 20, 705–715. [Google Scholar]
  2. Rial-Lovera, K.; Davies, W.P.; Cannon, N.D.; Conway, J.S. Influence of tillage systems and nitrogen management on grain yield, grain protein and nitrogen-use efficiency in UK spring wheat. J. Agric. Sci. 2016, 154, 1437–1452. [Google Scholar] [CrossRef]
  3. Guzmán, C.; Autrique, E.; Mondal, S.; Huerta-Espino, J.; Singh, R.P.; Vargas, M.; Crossa, J.; Amaya, A.; Pena, R.J. Genetic improvement of grain quality traits for CIMMYT semi-dwarf spring bread wheat varieties developed during 1965–2015: 50 years of breeding. Field Crops Res. 2017, 210, 192–196. [Google Scholar] [CrossRef]
  4. Skudra, I.; Ruza, A. Winter wheat grain baking quality depending on environmental conditions and fertilizer. Agron. Res. 2016, 14, 1460–1466. [Google Scholar]
  5. Rachoń, L.; Woźniak, A. Variability of spring durum and common wheat yields in the decade 2009–2018 in the Lublin region. Agron. Sci. 2020, 75, 67–74. [Google Scholar] [CrossRef]
  6. Kunzová, E. The effect of crop rotation and fertilization on dry matter yields and organic C content in soil in long-term field experiments in Prague. Arch. Agron. Soil Sci. 2013, 59, 1177–1191. [Google Scholar] [CrossRef]
  7. Hernanz, J.L.; Sánchez-Girón, V.; Navarrete, L.; Sánchez, M.J. Long-term (1983–2012) assessment of three tillage systems on the energy use efficiency, crop production and seeding emergence in a rain fed cereal monoculture in semiarid conditions in central Spain. Field Crops Res. 2014, 166, 26–37. [Google Scholar] [CrossRef]
  8. Plaza-Bonilla, D.; Nolot, J.M.; Raffaillac, D.; Justes, E. Innovative cropping systems to reduce N inputs and maintain wheat yields by inserting grain legumes and cover crops in southwestern France. Eur. J. Agron. 2017, 82, 331–341. [Google Scholar] [CrossRef] [Green Version]
  9. Woźniak, A.; Soroka, M. Effect of crop rotation and tillage system on the weed infestation and yield of spring wheat and on soil properties. Appl. Ecol. Environ. Res. 2018, 16, 3087–3096. [Google Scholar] [CrossRef]
  10. Jensen, E.S.; Peoples, M.B.; Hauggaard-Nielsen, H. Faba bean in cropping systems. Field Crops Res. 2010, 115, 203–216. [Google Scholar] [CrossRef] [Green Version]
  11. Ali, S.A.; Tedone, L.; Verdini, L.; Cazzato, E.; De Mastro, G. Wheat response to no-tillage and nitrogen fertilization in a long-term faba bean-based rotation. Agronomy 2019, 9, 50. [Google Scholar] [CrossRef] [Green Version]
  12. Pagnani, G.; Galieni, A.; D’Egidio, S.; Visioli, G.; Stagnari, F.; Pisante, M. Effect of soil tillage and crop sequence on grain yield and quality of durum wheat in Mediterranean Areas. Agronomy 2019, 9, 488. [Google Scholar] [CrossRef] [Green Version]
  13. Shahzad, M.; Farooq, M.; Jabran, K.; Hussain, M. Impact of different crop rotations and tillage systems on weed infestation and productivity of bread wheat. Crop Prot. 2016, 89, 161–169. [Google Scholar] [CrossRef]
  14. Hernández Plaza, E.H.; Kozak, M.; Navarrete, L.; González-Andújar, J.L. Tillage system did not affect weed diversity in a 23-year experiment in Mediterranean dryland. Agricult. Ecosyst. Environ. 2011, 140, 102–105. [Google Scholar] [CrossRef]
  15. Woźniak, A. Effect of tillage system on the structure of weed infestation of winter wheat. Span. J. Agric. Res. 2018, 16, e1009. [Google Scholar] [CrossRef]
  16. Feledyn-Szewczyk, B.; Smagacz, J.; Kwiatkowski, C.K.; Harasim, E.; Woźniak, A. Weed Flora and Soil Seed Bank Composition as affected by tillage system in three-year crop rotation. Agriculture 2020, 10, 186. [Google Scholar] [CrossRef]
  17. Hernandez-Restrepo, M.; Groenewald, J.Z.; Elliott, M.L.; Canning, G.; McMillan, V.E.; Crous, P.W. Take-all or nothing. Stud. Mycol. 2016, 83, 19–48. [Google Scholar] [CrossRef] [Green Version]
  18. De Vita, P.; Di Paolo, E.; Fecondo, G.; Di Fonzo, N.; Pisante, M. No-tillage and conventional tillage effects on durum wheat yield, grain quality, and soil moisture content in Southern Italy. Soil Tillage Res. 2007, 92, 69–78. [Google Scholar] [CrossRef]
  19. Morris, N.L.; Miller, P.C.H.; Orson, J.H.; Froud-Williams, R.J. The adoption of non-inversion tillage systems in the United Kingdom and the agronomic impact on soil, crops and the environment—A review. Soil Tillage Res. 2010, 108, 1–15. [Google Scholar] [CrossRef]
  20. Gomez-Becerra, H.F.; Erdem, H.; Yazici, A.; Tutus, Y.; Torun, B.; Ozturk, L.; Cakmak, I. Grain concentrations of protein and mineral nutrients in a large collection of spelt wheat grown under different environments. J. Cereal Sci. 2010, 52, 342–349. [Google Scholar] [CrossRef]
  21. Woźniak, A.; Gos, M. Yield and chemical quality of spring wheat and soil properties as affected by tillage system. Plant Soil Environ. 2014, 60, 141–145. [Google Scholar] [CrossRef] [Green Version]
  22. Giannitsopoulos, M.L.; Burgess, P.J.; Rickson, R.J. Effects of conservation tillage systems on soil physical changes and crop yields in a wheat-oilseed rape rotation. J. Soil Water Conserv. 2019, 74, 247–258. [Google Scholar] [CrossRef]
  23. Woźniak, A. Chemical properties and enzyme activity of soil as affected by tillage system and previous crop. Agriculture 2019, 9, 262. [Google Scholar] [CrossRef] [Green Version]
  24. Lahmar, R. Adoption of conservation agriculture in Europe lesson of the KASSA project. Land Use Policy 2010, 27, 4–10. [Google Scholar] [CrossRef]
  25. Aziz, I.; Mahmood, T.; Islam, K.R. Effect of long-term no-till and conventional tillage practices on soil quality. Soil Tillage Res. 2013, 131, 28–35. [Google Scholar] [CrossRef]
  26. Ruisi, P.; Giambalvo, D.; Saia, S.; Di Miceli, G.; Frenda, A.S.; Plaia, A.; Amato, G. Conservation tillage in a semiarid Mediterranean environment: Results of 20 years of research. Ital. J. Agron. 2014, 9, 560. [Google Scholar] [CrossRef] [Green Version]
  27. Tebrügge, F.; Düring, R.A. Reducing tillage intensity—A review of results from long-term study in Germany. Soil Tillage Res. 1999, 53, 15–28. [Google Scholar] [CrossRef]
  28. Woźniak, A.; Stępniowska, A. Yield and quality of durum wheat grain in different tillage systems. J. Elem. 2017, 22, 817–829. [Google Scholar] [CrossRef]
  29. Morris, C.F.; Li, S.; King, G.E.; Engle, D.A.; Burns, J.W.; Ross, A.S. A comprehensive genotype and environment assessment of wheat grain ash content in Oregon and Washington: Analysis of variation. Cereal Chem. 2009, 86, 307–312. [Google Scholar] [CrossRef]
  30. Jug, I.; Jug, D.; Sabo, M.; Stipeševic, B.; Stošic, M. Winter wheat and yield components as affected by soil tillage systems. Turk. J. Agric. For. 2011, 35, 1–7. [Google Scholar]
  31. Amato, G.; Ruisi, P.; Frenda, A.S.; Di Miceli, G.; Saia, S.; Plaia, A.; Giambalvo, D. Long-term tillage and crop sequence effects on wheat grain yield and quality. Agron. J. 2013, 105, 1317–1327. [Google Scholar] [CrossRef]
  32. Rühlemann, L.; Schmidtke, K. Evaluation of monocropped and intercropped grain legumes for cover cropping in no-tillage and reduced tillage organic agriculture. Eur. J. Agron. 2015, 65, 83–94. [Google Scholar] [CrossRef]
  33. Franzluebbers, A.J.; Stuedemann, J.A. Crop and cattle production responses to tillage and cover crop management in an integrated crop-livestock system in the southeastern USA. Eur. J. Agron. 2014, 57, 62–70. [Google Scholar] [CrossRef]
  34. Zhang, S.; Wang, L.C.; Shi, C.; Chen, J.; Zhou, Q.; Xiong, Y. Soil respiration in a triple intercropping system under conservation tillage. Plant Soil Environ. 2015, 61, 378–384. [Google Scholar] [CrossRef] [Green Version]
  35. BBCH Working Group. Growth Stages of Mono-and Dicotyledonous Plants, 2nd ed.; Meier, U., Ed.; Federal Biological Research Centre for Agriculture and Forestry: Bonn, Germany, 2001; Available online: https://www.politicheagricole.it/flex/AppData/WebLive/Agrometeo/MIEPFY800/BBCHengl2001.pdf (accessed on 2 July 2010).
  36. IUSS Working Group. World Reference Base for Soil Resources 2014, Update 2015. International Soil Classification System for Naming Soils and Creating Legends for Soil Maps; World Soil Resources Reports No. 106; FAO: Rome, Italy, 2015; p. 192. [Google Scholar]
  37. Gliesmann, S.R. Agroecosystem Sustainability: Developing Practical Strategies; CRC Press: Boca Raton, FL, USA, 2001. [Google Scholar]
  38. Lal, R. The plow and agricultural sustainability. J. Sustain. Agric. 2009, 33, 66–84. [Google Scholar] [CrossRef]
  39. Soane, B.D.; Ball, B.C.; Arvidsson, J.; Basch, G.; Moreno, F.; Roger Estrade, J. No-till in northern, western and south-western Europe: A review of problems and opportunities for crop production and the environment. Soil Tillage Res. 2012, 118, 66–87. [Google Scholar] [CrossRef] [Green Version]
  40. Haliniarz, M.; Nowak, A.; Woźniak, A.; Sekutowski, T.R.; Kwiatkowski, C.A. Production and economic effects of environmentally friendly spring wheat production technology. Pol. J. Environ. Stud. 2018, 27, 1523–1532. [Google Scholar] [CrossRef]
  41. Ernst, G.; Emmerling, C. Impact of five different tillage systems on soil organic carbon content and the density, biomass, and community composition of earthworms after a ten-year period. Eur. J. Soil Biol. 2009, 45, 247–251. [Google Scholar] [CrossRef]
  42. Zikeli, S.; Gruber, S.; Teufel, C.F.; Hartung, K.; Claupein, W. Effects of reduced tillage on crop yield, plant available nutrients and soil organic matter in a 12-year long-term trial under organic management. Sustainability 2013, 5, 3876–3894. [Google Scholar] [CrossRef] [Green Version]
  43. Dimassi, B.; Mary, B.; Wylleman, R.; Labreuche, J.; Couture, D.; Piraux, F.; Cohan, J.P. Long-term effect of contrasted tillage and crop management on soil carbon dynamics during 41 years. Agric. Ecosyst. Environ. 2014, 188, 134–146. [Google Scholar] [CrossRef]
  44. Montemurro, F.; Maiorana, M. Cropping systems, tillage and fertilization strategies for durum wheat performance and soil properties. Int. J. Plant Prod. 2014, 8, 51–76. [Google Scholar]
  45. Farooq, M.; Flower, K.C.; Jabran, K.; Wahid, A.; Siddique, K.H.M. Crop yield and weed management in rainfed conservation agriculture. Soil Tillage Res. 2011, 117, 172–183. [Google Scholar] [CrossRef]
  46. Känkänen, H.; Alakukku, L.; Salo, Y.; Pitkänen, T. Growth and yield of different spring cereal species in zero tillage, compared to conventional tillage. Eur. J. Agron. 2011, 34, 35–45. [Google Scholar] [CrossRef]
  47. Woźniak, A. Mechanical and chemical weeding effects on the weed structure in durum wheat. Ital. J. Agron. 2020, 15, 1559. [Google Scholar]
  48. Owen, M.D.K.; Zelaya, I.A. Herbicide-resistant crops and weed resistance to herbicides. Pest Manag. Sci. 2005, 61, 301–311. [Google Scholar] [CrossRef]
  49. Collavo, A.; Sattin, M. First glyphosate-resistant Lolium spp. biotypes found in a European annual arable cropping system also affected by ACCase and ALS resistance. Weed Res. 2014, 54, 325–334. [Google Scholar] [CrossRef]
  50. Heap, I. Global perspective of herbicide-resistant weeds. Pest Manag. Sci. 2014, 70, 1306–1315. [Google Scholar] [CrossRef]
  51. Woźniak, A. Effect of various systems of tillage on winter barley yield, weed infestation and soil properties. Appl. Ecol. Environ. Res. 2020, 18, 3483–3496. [Google Scholar] [CrossRef]
Figure 1. General view of the experiment. Winter wheat at the shooting stage (33–35 in the BBCH (Biologische Bundesanstalt, Bundessortenamt und Chemische Industrie) scale).
Agriculture 10 00405 g001
Figure 2. General view of the experiment. Winter wheat at the flowering stage (63–65 BBCH scale).
Agriculture 10 00405 g002
Figure 3. Monthly sums of precipitation and average air temperatures at the Uhrusk Experimental Station.
Agriculture 10 00405 g003
Figure 4. Content of organic C in the 0–25 cm soil layer depending on the tillage system (average of 2014–2016). * a—Means denoted with the same letters do not differ significantly, p < 0.05.
Agriculture 10 00405 g004
Figure 5. Content of total nitrogen in the 0–25 cm soil layer depending on the tillage system (average of 2014–2016). * a—Means denoted with the same letters do not differ significantly, p < 0.05.
Agriculture 10 00405 g005
Figure 6. Content of N-NO3 in the 0–25 cm soil layer depending on the tillage system (average of 2014–2016). * a—Means denoted with the same letters do not differ significantly, p < 0.05.
Agriculture 10 00405 g006
Figure 7. Content of N-NH4 in the 0–25 cm soil layer depending on the tillage system (average of 2014–2016). * a—Means denoted with the same letters do not differ significantly, p < 0.05.
Agriculture 10 00405 g007
Figure 8. Content of phosphorus (P) in the 0–25 cm soil layer depending on the tillage system (average of 2014–2016). * a—Means denoted with the same letters do not differ significantly, p < 0.05.
Agriculture 10 00405 g008
Figure 9. Content of potassium (K) in the 0–25 cm soil layer depending on the tillage system (average of 2014–2016). * a—Means denoted with the same letters do not differ significantly, p < 0.05.
Agriculture 10 00405 g009
Figure 10. Content of magnesium (Mg) in the 0–25 cm soil layer depending on the tillage system (average of 2014–2016). * a—Means denoted with the same letters do not differ significantly, p < 0.05.
Agriculture 10 00405 g010
Table 1. Grain yield of winter wheat and its components.
SpecificationGrain Yield
(t ha−1)
Spike Number (m−2)Grain Weight per Spike (g)1000 Grain Weight (g)
Tillage System (TS)
CT5.31 a456.5 a1.15 a45.0 a
RT5.21 a,b448.1 a,b1.16 a42.4 a
NT5.08 b419.7 b1.19 a43.2 a
Mean5.20441.41.1743.5
Year (Y)
20145.48 a483.3 a1.13 a48.5 a
20154.39 b397.6 b1.10 a39.2 b
20165.73 c443.4 c1.28 b42.9 b
Mean5.20441.41.1743.5
ANOVA
TS * *
Y * * ** *
TS × Y * *
CT—Conventional tillage; RT—Reduced tillage; NT—No-tillage. Different letters indicate significant differences. Significant effects: p < 0.05 (*), p < 0.01 (**). Blank cells indicate that no significant differences were found.
Table 2. Quality parameters of winter wheat grain.
SpecificationGrain Weight per Volume
(kg hL−1)
Grain Uniformity (%)Total Protein
(g kg−1 dm)
Wet Gluten
(%)
Zeleny’s Sedimentation Index (mL)Total Ash Content
(g kg−1 dm)
Tillage System (TS)
CT76.5 a86.8 a116.3 a21.834.4 a20.2 a
RT74.6 a84.3 a,b115.6 a21.934.1 a20.7 a
NT75.4 a79.3 b118.3 a22.836.4 a22.1 b
Mean75.583.5116.722.235.021.0
Year (Y)
201476.5 a86.1 a117.0 a21.633.1 a17.2 a
201570.9 b72.1 b121.0 a21.832.1 a28.4 b
201679.1 a92.5 c112.3 b23.239.8 b17.4 a
Mean75.583.5116.722.235.021.0
ANOVA
TS * *
Y****** * * **
TS × Y *
CT—Conventional tillage; RT—Reduced tillage; NT—No-tillage. Different letters indicate significant differences. Significant effects: p < 0.05 (*), p < 0.01 (**). Blank cells indicate that no significant differences were found.

