Article

Analysis of Metabolomic Changes in Lettuce Leaves under Low Nitrogen and Phosphorus Deficiencies Stresses

1
School of Agricultural Engineering, Jiangsu University, Zhenjiang 212013, China
2
Key Laboratory of Agriculture Equipment and Intelligence of Jiangsu Province, Zhenjiang 212013, China
*
Author to whom correspondence should be addressed.
Agriculture 2020, 10(9), 406; https://doi.org/10.3390/agriculture10090406
Submission received: 18 August 2020 / Revised: 11 September 2020 / Accepted: 11 September 2020 / Published: 16 September 2020
(This article belongs to the Section Agricultural Technology)

Abstract

:
Nitrogen and phosphorus limitation affect the growth, development, and productivity of lettuce, which exert a marked influence on metabolites. To compare the influence of low-nitrogen and low-phosphorus stresses on various metabolites of lettuce leaves, experiments were performed under three conditions of treatment—low-nitrogen stress, low-phosphorus stress, and normal samples. Metabolomic analyses were conducted based on ultra-performance liquid chromatography-quadrupole time-of-flight mass spectrometry. Principle components analysis yielded distinctive clustering information among the holistic samples; fold change analysis, t-test and orthogonal partial least square discriminant analysis were used for the selection of metabolic biomarkers. Ten pathways were selected which were significantly enriched by metabolic biomarkers. Metabolic biomarkers were screened by fold change (FC) value, p-value and variable importance in the projection (VIP) value, low-nitrogen and low-phosphorus stresses caused an increase in 16 metabolites (FC > 2, p-value < 0.05, VIP > 1) and a decrease in 26 metabolites (FC < 0.5, p-value < 0.05, VIP > 1). Outside of these, our results showed that inositol, p-hydroxybenzoic acid, stachyose, dinoseb, and 7, 8-dihydroxycoumarin increase in low-nitrogen stress samples. Low-phosphorus stress caused accumulation of citrate, isocitrate, l-5-oxoproline, succinate, and histamine, which may be considered potential metabolic biomarkers. The metabolites could be used to monitor the nitrogen and phosphorus status of lettuce and to guide appropriate fertilization regimens.

1. Introduction

Mineral nutrients, such as nitrogen and phosphorus, frequently limit plant growth [1]. Nitrogen limitation directly influences the biosynthesis of compounds, such as proteins, vitamins, phytohormones, co-enzymes, chlorophyll, and nucleic acids [2,3]. Phosphorus is a component of many cellular molecules and plays an essential role in structural maintenance [4]. A key concern for growers is to be able to verify plant nutrition status early while nutrition deficiency can still be remedied [5]; thus, the early diagnosis of nutrition stress plays a key role in the regulation of plant nutrition. Studies have focused on topics such as the nutritional deficit of plants through the differences of surface macro characteristics, such as height, length, and color [6]; the differences of micro characteristics such as leaf surface roughness and texture [7]; the differences of the internal microstructure such as stomata, sponges and palisade tissues; and the differences of macromolecular compounds such as chlorophyll and lutein [8,9,10].
The diagnosis of cancer is based on tissue, cell, and molecule level. The detection of metabolic biomarkers at the molecular level can realize early warning [11], which is of great significance to improve the life span and quality of life. On research of plant physiology and nutrition has indicated that the reaction of crop nutrition stress is a complex mechanism, which involves macro characteristics, micro characteristics, internal organization, macromolecules, and small molecule compounds [12]. To resist nutrition stress, plants use their metabolic capacity to produce a large variety of small molecular compounds and reorganize their metabolic networks to maintain essential metabolism [13]. Plant metabolomics is now widespread and valuable biotechnology, which has been used to explore the resistance mechanisms of plants in adverse environments [14]. Metabolomics has largely focused on the study of all small molecular compounds and the related dynamic changes found in or produced by organisms [15,16]. In this regard, several recent studies have explored the change of small molecular compounds underlying the response to mineral nutrient stress. Sung et al. [17] conducted a detailed broad-scale identification of metabolic responses of tomato leaves and roots to nitrogen, phosphorus, or potassium deficiency, with deficiency of any of these three minerals affecting energy production and amino acid metabolism. Cevallos-Cevallos et al. [18] found significant differences in oxo-butanedioic acid, arabitol, and neo-inositol between zinc-deficient and healthy orange trees. The metabolomics of rice leaves under conditions of nitrogen and phosphorus deficiencies were analyzed by Shen [19] and Watanabe et al. [20], the stress-resistant substances and amino acid substitution products increased under nitrogen deficiency, with sinapate, benzoate, and glucuronate related to phosphorus deficiency.
Lettuce forms an important component of the human diet and is typically low in calories and fat, and high in protein, dietary fiber, iron, calcium, and phytochemicals. Lettuce metabolomic studies have focused only on associations with light quality and intensity conditions [21], temperature stress [22], saline stress [23], cultivation conditions [24], and lettuce varieties [25]. Few studies have focused on the metabolite variation of lettuce and the identification of biomarkers under mineral nutrient stress, particularly low-nitrogen and low-phosphorus stresses. In this study, the metabolites of lettuce leaves were analyzed by an ultra-performance liquid chromatography–quadrupole time-of-flight mass spectrometer (UPLC-QTOF MS) platform, insight into lettuce responses to low-nitrogen and low-phosphorus stresses were obtained by discovering new information about changes in metabolite abundance, aiming to provide a basis for further diagnosis of lettuce early nutrition stress and guide appropriate fertilization regimens.

2. Materials and Methods

2.1. Plant Material and Growth Conditions

Lettuce seed (Lactuca sativa, Italian) was obtained from Woshu Seeds Co. Ltd., Nanjing, China, and sown in sponge blocks, then the investigated plants were transplanted in Rockwool cubes (50 × 50 × 50 mm) during the period of five true leaves and grown in a micro plant factory (Hangzhou Shuolian instrument CO., LTD, Zhejiang, China) at Jiangsu University, China. This was a closed cultivation room with an air conditioner to control the temperature and artificial lighting. Sample cultivation is shown in Figure 1. The Yamasaki lettuce nutrient solution formula was used for lettuce growth. The compositions of the nutrient solution supplied were: Ca(NO3)2·4H2O, 236 mg L−1; KNO3, 404 mg L−1; NH4H2PO4, 57 mg L−1; MgSO4·7H2O, 123 mg L−1; Fe–EDTA, 16 mg L−1; MnCl2·4H2O, 1.2 mg L−1; H3BO3, 0.72 mg L−1; ZnSO4·4H2O, 0.09 mg L−1; CuSO4·5H2O, 0.04 mg L−1 and (NO4)2Mo7O4, 0.01 mg L−1. Lettuce use nitrate (NO3) or ammonium (NH4+) as primary nitrogen source and primarily in the form of H2PO4 as phosphorus sources. Among nutrient solution, NO3 was 6mmol L−1, NH4+ was 0.5mmol L−1 and H2PO4 0.5mmol L−1. Three treatments had varying levels of nitrogen and phosphorus. Treatment A: normal nutrient solution concentration; treatment B: low-nitrogen stress, without NO3 and NH4+ in nutrient solution; treatment C: low-phosphorus stress, without PO43− in the nutrient solution. The EC and pH of the nutrient solution were adjusted to 1.6 dS m−1 and 6.0, respectively. Air temperature, relative humidity, and CO2 concentration were maintained at 20 ± 5 °C, 60–80%, and 400 ± 10 μmol mol−1, respectively [26]. After two weeks, eighteen plants having similar growth from each treatment were harvested between 10:00 and 12:00 to minimize diurnal effects on metabolite concentration. The leaves were rinsed briefly in deionized water and immediately frozen in liquid nitrogen, and stored at −80 °C until biochemical analysis.

2.2. Metabolite Extraction

Three groups of lettuce leaves were ground into liquid nitrogen, 1000 μL methanol/acetonitrile/water (2:2:1, v/v/v) was added to each sample, then the samples were ultrasonicated twice at low temperature for 30 min after vortexing, and incubated at −20 °C for 1 h. Acetonitrile (1499230-935) and methanol (144282) were purchased from Merck (Darmstadt, Germany). Subsequently, the samples were centrifuged at 16,626 g at 4 °C for 15 min. Supernatants were collected, lyophilized, and stored at −80 °C. Five quality control (QC) samples were prepared by pooling aliquots of all samples. The pretreatment of the QC samples was the same as that of the study samples. The QC samples were evenly inserted in each set of the analysis running sequence to monitor the stability of the large-scale analysis [27].

2.3. Non-Targeted LC–MS Analysis

Separation of compounds was achieved using an Agilent 1290 infinity liquid chromatography system (Agilent Technologies, USA) coupled with an Acquity UPLC BEH amide column (2.1 mm × 100 mm, 1.7 μm) (Waters Corporation, Milford, MA, USA). Mobile phase A consisted of 25 mmol L−1 ammonium acetate and ammonia in ultrapure water, and mobile phase B consisted of acetonitrile. The gradient elution program was optimized as follows: 95% B (0–0.5 min), 95–65% B (0.5–7 min), 65–40% B (7–9 min), 40% B (9–10 min), 40–95% B (10–11.1 min), 95% B (11.1–16 min). The injection temperature was 4 °C. The flow rate was 0.3 mL/min. The injection volume was 10 μL. The column temperature was maintained at 25 °C.
Metabolites were measured using an UPLC-QTOF MS platform. Experiments were performed with a triple time-of-flight 5600+ mass spectrometer (AB SCIEX, Framingham, MA, USA) in both electrospray ionization (ESI) positive and negative ion modes. The mass spectrometer was equipped with an electrospray ionization (ESI) source. The ESI source parameters in ionization mode were as follows: source temperature, 600 °C; ion source pressure, 60 psig; curtain pressure, 30 psig; ion spray voltage floating (ISVF), ±5.5 KV; TOF MS scan m/z range, 60–1200 Da; TOF MS scan accumulation time, 0.15 s/spectra; production scan m/z range, 25–1200 Da; production scan accumulation time, 0.03 s/spectra; declustering potential, ±60 V; collision energy, 30 eV; isotopes within 4 Da excluded; candidate ions to monitor per cycle, 6.

2.4. Data Processing, Statistical Analysis, and Metabolic Pathway Analysis

The raw data were converted to common data format (mzXML) files for peak alignment, retention time correction, and peak area extraction. The structure of metabolites was identified by mass number matching (<25 ppm) and secondary spectrum matching. The ion peaks with missing values > 50% were deleted and normalized by Pareto-scaling. 13,046 and 13,028 metabolite ions were acquired separately in the negative ion mode of nitrogen and phosphorus, whereas 9761 and 9757 metabolite ions were acquired separately in positive ion mode for nitrogen and phosphorus.
Principal component analysis (PCA) was applied for unsupervised multivariate analysis using SIMCA-P 14.1 (Umetric, Umea, Sweden) software, which provided an overview of the similarities and differences among the samples. Screening metabolites was divided into two steps. Fold change analysis and t-test were used to search preliminarily for metabolic biomarkers, then fold change (FC) value and p-value were calculated, and volcano plots were generated. The processed data sets were imported to SIMCA-P 14.1 for orthogonal partial least squares-discriminant analysis (OPLS-DA). The variable importance in the projection (VIP) values were considered as differential variables for further screening metabolic biomarkers [28]. Metabolite structural identification was conducted based on UPLC-QTOF MS analysis and retention time, accurate molecular weight, and MS/MS data. The metabolomics pathway was analyzed by MetaboAnalyst (https://www.metaboanalyst.ca) based on the Kyoto Encyclopedia of Genes and Genomes (KEGG) metabolic pathway database.

3. Results

3.1. Metabolic Biomarkers Screening

QC samples were visualized using total ion current, which indicated that the instrumental analysis of all samples was strong and the peak capacity was large, so the retention time was reproducible. The correlation between QC samples was greater than 0.9, which indicated the system was stable as shown in Figure 2. To observe the overall distribution of samples, the PCA was considered an unsupervised model to operate without any anthropogenic factors, which was conducive to understanding the holistic data and eliminating abnormal samples. The results showed that QC samples were aggregated, and stress and normal treatment groups of samples separated clearly. There were no outlier samples in the Hotelling’s T2 region (95% confidence interval).
To examine the significant differences of metabolites between low-nitrogen stress, low-phosphorus stress, and normal samples, the univariate analysis with fold change analysis and t-test were used for screening metabolic biomarkers. The importance of metabolites in sample discrimination was visible in the volcano plots. The volcano plots were employed to recognize the downregulated (FC < 0.5) and upregulated (FC > 2) metabolites that showed significant differences (p-value < 0.05). As shown in Figure 3, red points were upregulated metabolites, green points were downregulated metabolites, the blue points were metabolites with no change. Low-nitrogen stress caused an increase in 4952 metabolites and a decrease in 6787 metabolites, low-phosphorus stress caused an increase in 4359 metabolites and a decrease in 7538 metabolites, the Venn diagrams are shown in Figure 4. According to structural features of metabolic biomarkers, 260 metabolites were identified for low-nitrogen stress (134 metabolites increased and 126 metabolites decreased). The low-phosphorus stress treatment caused an increase in 53 metabolites and a decrease in 116 metabolites.
The next step of the statistical analysis was to perform a supervised OPLS-DA to separate samples into two clusters and identify biomarkers between the normal and stress groups. To prevent the model from overfitting, the quality of the model was investigated by seven-fold interactive validation and a 200-response sequencing test. Validation parameters for the two OPLS-DA were R2Y = 0.948 and Q2Y = 0.885 for low-nitrogen stress, and for low-phosphorus stress R2Y = 0.921 and Q2Y = 0.892. 262 and 169 identified compounds of low-nitrogen and low-phosphorus stresses were further screened by Figure 5, in which the upper part was the V-plot figure, the lower part was the S-plot figure, and each box/point represented one compound. In the V-plot figure, the biomarkers were filtered by VIP > 1. In the S-plot figure, the closer the compound was to the lower left and the upper right corners the greater the contribution to each category. In sum, 55 and 76 compounds were identified as important variables that contribute to the low-nitrogen or low-phosphorus stress.

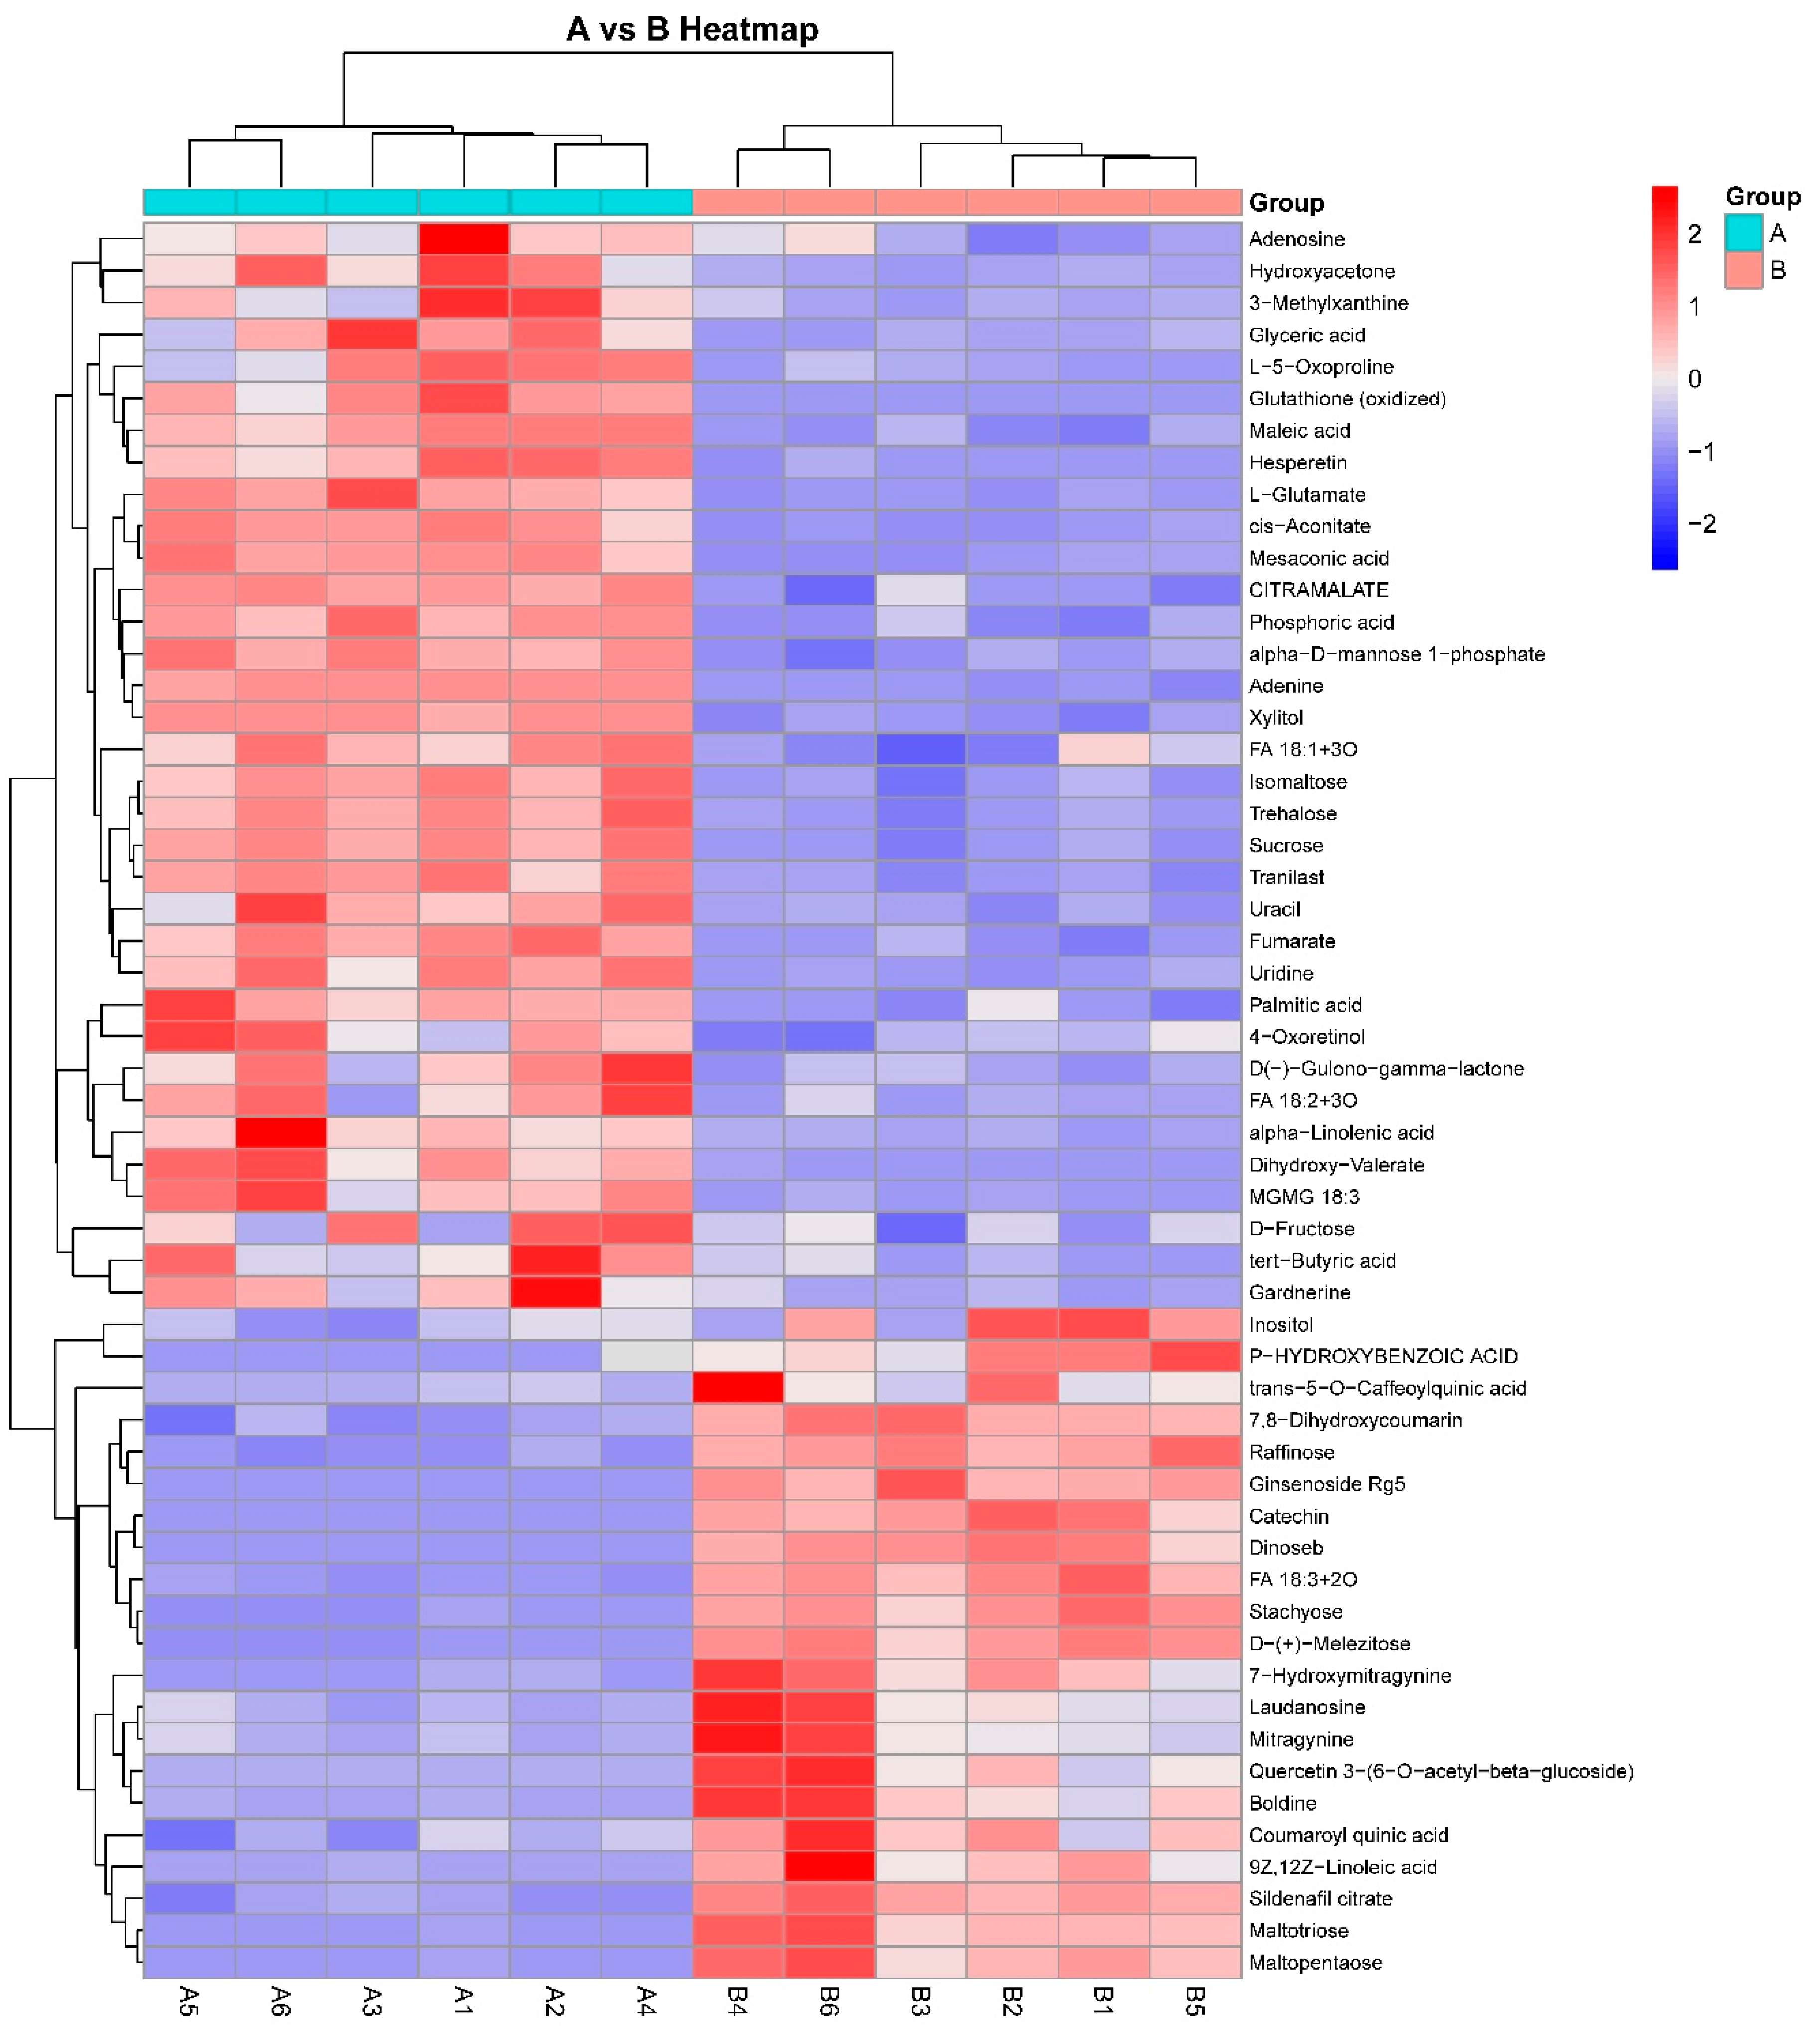
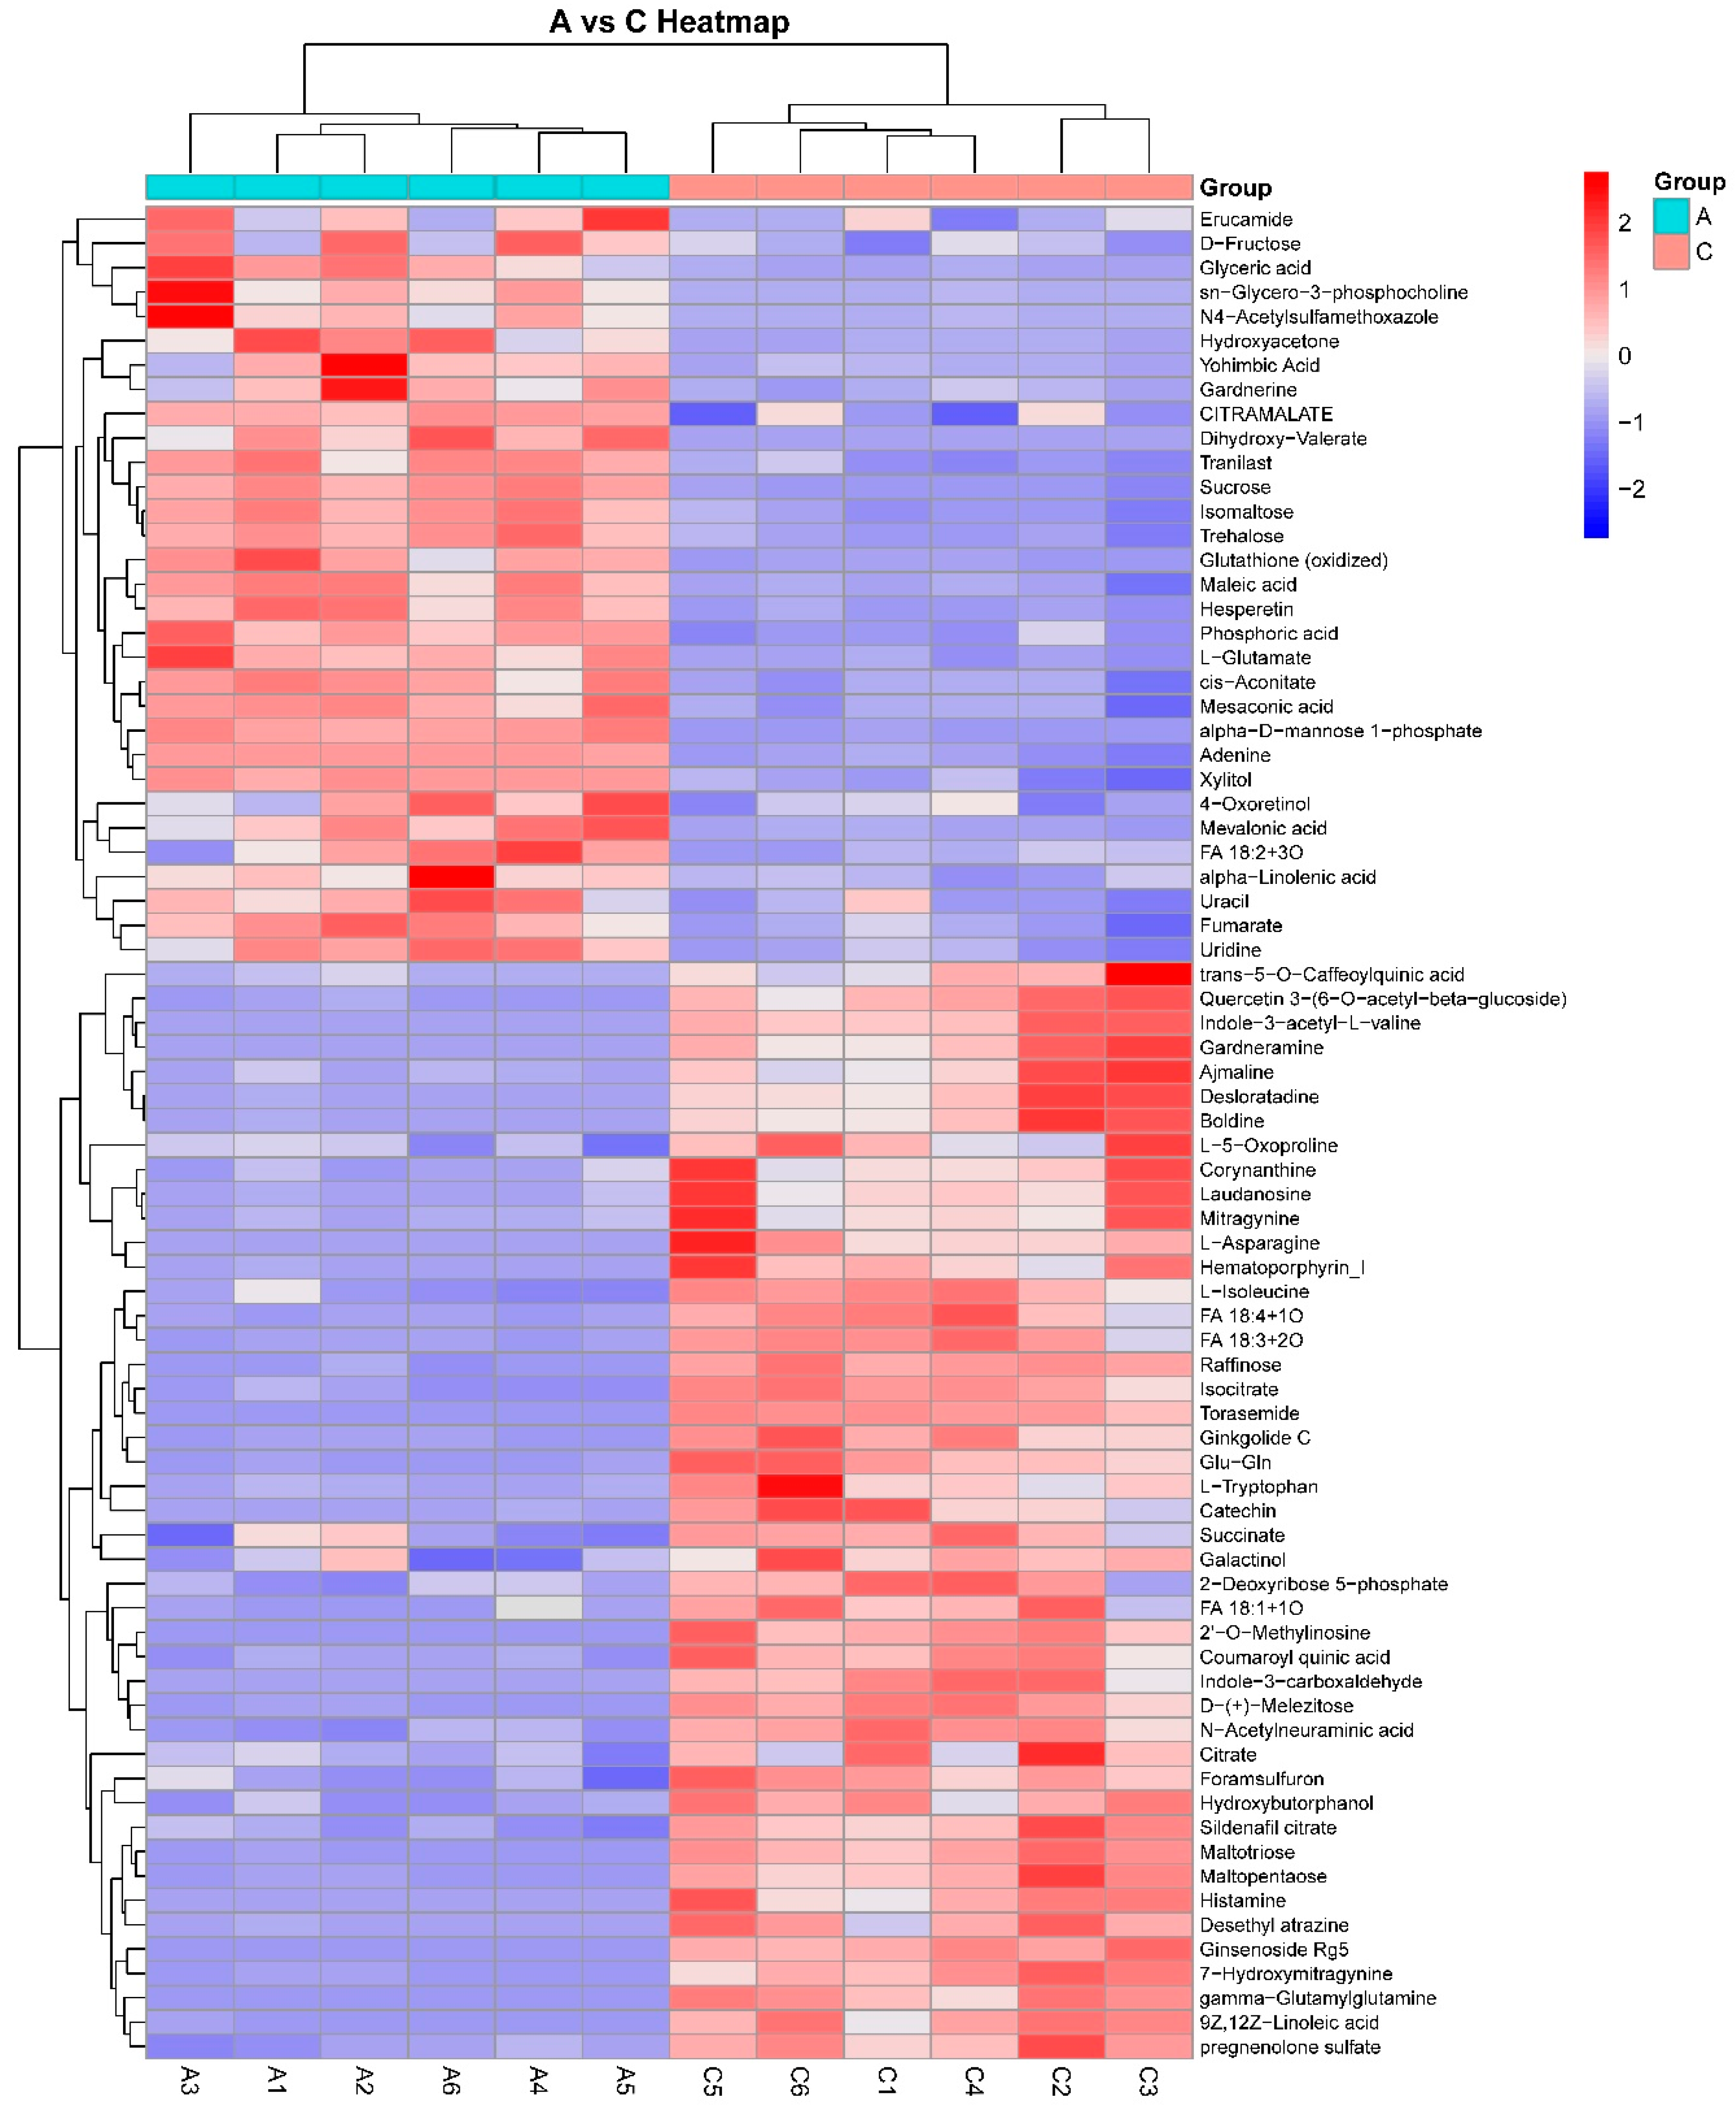
3.2. Cluster Analysis of Metabolic Biomarkers

To more intuitively and comprehensively display the expression patterns of the metabolites, six samples were randomly selected from each group. The metabolic biomarkers in the two groups were analyzed using heat maps, which showed that the low-nitrogen and low-phosphorus stresses responded differently compared with the normal treatment. The results showed the distribution of metabolic biomarkers in the two groups and demonstrated that metabolic biomarkers between the two groups had a clustering trend. As shown in Figure 6, low-nitrogen stress caused an increase in 21 metabolites and a decrease in 34 metabolites, 45 of which were negative ion mode and 10 were positive ion mode. In Figure 7, low-phosphorus stress caused an increase in 45 metabolites and a decrease in 31 metabolites, 54 metabolites in negative ion mode, 22 metabolites in positive ion mode.

3.3. KEGG Metabolic Pathway Analysis

The KEGG enrichment results can be visualized by bubble diagrams, and the ten pathways with the smallest p-value were mapped. As shown in Figure 8, complex interactions between networks of metabolic pathways exist in many aspects of nitrogen and phosphorus metabolism, and these enriched pathways were ATP-binding cassette (ABC) transporters and Biosynthesis of plant secondary metabolites. ABC transporters manage the active transport of a wide range of molecules across biological membranes, including secondary metabolites, inorganic acids, lipids, and phytohormones [29]. In this study, ABC transporters were associated with phosphoric acid; L-glutamate; sucrose; xylitol; raffinose; maltotriose; and alpha, alpha-trehalose; among others. Secondary metabolites often act as defense molecules and protect plants in various adverse conditions [30], the pathways included succinate; l-tryptophan; fumarate; l-asparagine; citrate; isocitrate; l-isoleucine; and cis-aconitate.

4. Discussion

Nitrogen and phosphorus deficiencies resulted in changes of morphology, color, and texture. For instance, nutritional deficiency caused the changes in foliar color due to the loss of chlorophyll [31,32], and changes in texture may occur because of changes in surface structure and yellowish appearance in the leaves [33]. There was some evidence that nitrogen and phosphorus may affect the endogenous levels of phytohormones, such as cytokinins, which are involved in the regulation of both cell division and cell elongation, known to be implicated in the regulation of plant morphogenesis [34,35]. Hence, there were two potential problems with the detection of nitrogen and phosphorus. First, plants had a similar performance in low-nitrogen and low-phosphorus stresses [36]. Second, changes in morphology, color, and texture are inconspicuous in the early stages of nutrient stress. When these characteristics show obvious differences, nutritional stress was severe [37].
The change of internal small molecular compounds can occur earlier than changes in external characteristics [37]. Previous studies only focused on the changes of metabolites under single nutrient stress, such as nitrogen, phosphorus, potassium or zinc [17,18,19,20,38]. In fact, different nutritional stress can cause changes of the same metabolites. In this study, a large number of metabolic biomarkers were selected by FC value, p-value and VIP value. In these, low-nitrogen and low-phosphorus stresses caused an increase in 16 metabolites (Raffinose; 9Z, 12Z-Linoleic acid; Maltotriose; Catechin; Sildenafil citrate; D-(+)-Melezitose; Laudanosine; FA 18:3 + 2O; Coumaroyl quinic acid; trans-5-O-Caffeoylquinic acid; Quercetin 3-(6-O-acetyl-beta-glucoside); Ginsenoside Rg5; Boldine; Mitragynine; 7-Hydroxymitragynine and Maltopentaose) and a decrease in 26 metabolites (Phosphoric acid; L-Glutamate; Sucrose; Uracil; Fumarate; Adenine; Isomaltose; Glyceric acid; Uridine; Xylitol; cis-Aconitate; alpha-D-mannose 1-phosphate; Citramalate; Trehalose; Maleic acid; Hesperetin; Mesaconic acid; D-Fructose; Hydroxyacetone; alpha-Linolenic acid; 4-Oxoretinol; Dihydroxy-Valerate; Tranilast; FA 18:2 + 3O; Gardnerine and Glutathione (oxidized); Tranilast). These metabolites have no significance for determining low-nitrogen or low-phosphorus stress in lettuce. The special biomarkers are listed in Table 1 and Table 2.
Since the content of downregulated metabolites was low in lettuce under low-nitrogen or low-phosphorus stress, the study focused on upregulated biomarkers. The 5 biomarkers of low-nitrogen stress, all in negative ESI mode, belonged to classes of organic compounds known as cyclohexanols, hydroxybenzoic acid derivatives, oligosaccharides, dinitrophenols, and phenylpropanoids. However, the biomarker panel of low-phosphorus stress included 29 metabolites, which is not beneficial for practical application. The top 5 biomarkers were further screened by VIP > 1.75, which were citrate, isocitrate, l-5-oxoproline, succinate, and histamine. Citrate and isocitrate belonged to the class of organic compounds known as tricarboxylic acids and derivatives. L-5-oxoproline, succinate, and histamine are included in alpha amino acids and derivatives, dicarboxylic acids and derivatives and 2-arylethylamines.

5. Conclusions

Our objective aimed to obtain insight into lettuce responses to low-nitrogen and low-phosphorus stresses by examining metabolites. We used LC-MS techniques to investigate the abundance and identities of metabolites. PCA, Fold change analysis, t-test and OPLS-DA were used to understand the holistic data and search for metabolic biomarkers. This study indicated that low-nitrogen stress caused an increase in 21 metabolites and a decrease in 34 metabolites; low-phosphorus stress caused an increase in 45 metabolites and a decrease in 31 metabolites. The most relevant pathways were ATP-binding cassette transporters and Biosynthesis of plant secondary metabolites. From our comparison and analysis, low-nitrogen stress caused accumulation of inositol, p-hydroxybenzoic acid, stachyose, dinoseb, and 7, 8-dihydroxycoumarin; low-phosphorus stress caused accumulation of citrate, isocitrate, l-5-oxoproline, succinate, and histamine. The metabolic biomarkers could be used to monitor the early nitrogen or phosphorus status of lettuce, presumably to guide appropriate fertilization regimens.

Author Contributions

Conceptualization, H.G. and H.M.; software, H.G.; writing—original draft preparation, H.G.; writing—review and editing, H.G., I.U. and H.M.; project administration, H.M.; funding acquisition, H.G. and H.M. All authors have read and agreed to the published version of the manuscript.

Funding

This research was funded by Natural Science Foundation of Jiangsu Province of China, grant number BK20180864; Postdoctoral Research Foundation of China, grant number 2017M621650; Jiangsu Synergy Innovation Center Program of Modern Agricultural Equipment and Technology, grant number 4091600028; Open Fund of the Ministry of Education Key Laboratory of Modern Agricultural Equipment and Technology, grant number JNZ201903; and Priority Academic Program Development of Jiangsu Higher Education Institutions, grant number PAPD-2018-87.

Conflicts of Interest

The authors declare no conflict of interest.

References

  1. Yoneyama, K.; Xie, X.; Kim, H.I.; Kisugi, T.; Nomura, T.; Sekimoto, H.; Yokota, T.; Yoneyama, K. How do nitrogen and phosphorus deficiencies affect strigolactone production and exudation? Planta 2012, 235, 1197–1207. [Google Scholar] [CrossRef] [PubMed] [Green Version]
  2. Larbat, R.; Olsen, K.M.; Slimestad, R.; Lovdal, T.; Benard, C.; Verheul, M.; Bourgaud, F.; Robin, C.; Lillo, C. Influence of repeated short-term nitrogen limitations on leaf phenolics metabolism in tomato. Phytochemistry 2012, 77, 119–128. [Google Scholar] [CrossRef]
  3. Cao, Y.W.; Qu, R.J.; Tang, X.Q.; Sun, L.Q.; Chen, Q.Q.; Miao, Y.J. UPLC-Triple TOF-MS/MS based metabolomics approach to reveal the influence of nitrogen levels on Isatis indigotica seedling leaf. Sci. Hortic. 2020, 266, 109280. [Google Scholar] [CrossRef]
  4. Carstensen, A.; Herdean, A.; Schmidt, S.B.; Sharma, A.; Spetea, C.; Pribil, M.; Husted, S. The impacts of phosphorus deficiency on the photosynthetic electron transport chain. Plant Physiol. 2018, 177, 271–284. [Google Scholar] [CrossRef] [PubMed] [Green Version]
  5. Abdel-Rahman, E.M.; Ahmed, F.B.; van den Berg, M. Estimation of sugarcane leaf nitrogen concentration using in situ spectroscopy. Int. J. Appl. Earth Obs. Geoinf. 2010, 12 (Suppl. S1), S52–S57. [Google Scholar] [CrossRef]
  6. Story, D.; Kacira, M.; Kubota, C.; Akoglu, A. Morphological and Textural Plant Feature Detection Using Machine Vision for Intelligent Plant Health, Growth and Quality Monitoring. Acta Hortic. 2011, 893, 299–306. [Google Scholar] [CrossRef]
  7. Chen, L.S.; Huang, S.H.; Sun, Y.Y.; Zhu, E.Y.; Wang, K. Rapid Identification of Potassium Nutrition Stress in Rice Based on Machine Vision and Object-Oriented Segmentation. J. Spectrosc. 2019, 2019, 4623545. [Google Scholar] [CrossRef]
  8. Mao, H.P.; Gao, H.Y.; Zhang, X.D.; Kumi, F. Nondestructive measurement of total nitrogen in lettuce by integrating spectroscopy and computer vision. Sci. Hortic. 2015, 184, 1–7. [Google Scholar] [CrossRef]
  9. Kalaji, H.M.; Jajoo, A.; Oukarroum, A.; Brestic, M.; Zivcak, M.; Samborska, I.A.; Cetner, M.D.; Lukasik, I.; Goltsev, V.; Ladle, R.J. Chlorophyll a fluorescence as a tool to monitor physiological status of plants under abiotic stress conditions. Acta Physiol. Plant. 2016, 38, 102. [Google Scholar] [CrossRef] [Green Version]
  10. Gao, H.Y.; Mao, H.P.; Zhang, X.D. Determination of lettuce nitrogen content using spectroscopy with efficient wavelength selection and extreme learning machine. Zemdirb. Agric. 2015, 102, 51–58. [Google Scholar] [CrossRef] [Green Version]
  11. Mayerle, J.; Kalthoff, H.; Reszka, R.; Kamlage, B.; Peter, E.; Schniewind, B.; Maldonado, S.G.; Pilarsky, C.; Heidecke, C.-D.; Schatz, P.; et al. Metabolic biomarker signature to differentiate pancreatic ductal adenocarcinoma from chronic pancreatitis. Gut 2018, 67, 128–137. [Google Scholar] [CrossRef] [PubMed]
  12. Wani, S.H.; Kumar, V.; Shriram, V.; Sah, S.K. Phytohormones and their metabolic engineering for abiotic stress tolerance in crop plants. Crop J. 2016, 4, 162–176. [Google Scholar] [CrossRef] [Green Version]
  13. Zhang, Y.; Ma, X.M.; Wang, X.C.; Liu, J.H.; Huang, B.Y.; Guo, X.Y.; Xiong, S.P.; La, G.X. UPLC-QTOF analysis reveals metabolomic changes in the flag leaf of wheat (Triticum aestivum L.) under low-nitrogen stress. Plant Physiol. Biochem. 2017, 111, 30–38. [Google Scholar] [CrossRef] [PubMed]
  14. Chen, Z.; Chen, H.; Jiang, Y.; Wang, J.; Khan, A.; Li, P.; Cao, C. Metabolomic analysis reveals metabolites and pathways involved in grain quality traits of high-quality rice cultivars under a dry cultivation system. Food Chem. 2020, 326, 126845. [Google Scholar] [CrossRef] [PubMed]
  15. Fiehn, O. Metabolomics—The link between genotypes and phenotypes. Plant Mol. Biol. 2002, 48, 155–171. [Google Scholar] [CrossRef]
  16. Meena, K.K.; Sorty, A.M.; Bitla, U.M.; Choudhary, K.; Gupta, P.; Pareek, A.; Singh, D.P.; Prabha, R.; Sahu, P.K.; Gupta, V.K.; et al. Abiotic Stress Responses and Microbe-Mediated Mitigation in Plants: The Omics Strategies. Front. Plant Sci. 2017, 8, 172. [Google Scholar] [CrossRef]
  17. Sung, J.; Lee, S.; Lee, Y.; Ha, S.; Song, B.; Kim, T.; Waters, B.M.; Krishnan, H.B. Metabolomic profiling from leaves and roots of tomato (Solanum lycopersicum L.) plants grown under nitrogen, phosphorus or potassium-deficient condition. Plant Sci. 2015, 241, 55–64. [Google Scholar] [CrossRef]
  18. Cevallos-Cevallos, J.M.; Garcia-Torres, R.; Etxeberria, E.; Reyes-De-Corcuera, J.I. GC-MS analysis of headspace and liquid extracts for metabolomic differentiation of citrus Huanglongbing and zinc deficiency in leaves of ‘Valencia’ sweet orange from commercial groves. Phytochem. Anal. 2011, 22, 236–246. [Google Scholar] [CrossRef]
  19. Shen, T.H.; Xiong, Q.Q.; Zhong, L.; Shi, X.; Cao, C.H.; He, H.H.; Chen, X.R. Analysis of main metabolisms during nitrogen deficiency and compensation in rice. Acta Physiol. Plant. 2019, 41, 68. [Google Scholar] [CrossRef]
  20. Watanabe, M.; Walther, D.; Ueda, Y.; Kondo, K.; Ishikawa, S.; Tohge, T.; Burgos, A.; Brotman, Y.; Fernie, A.R.; Hoefgen, R.; et al. Metabolomic markers and physiological adaptations for high phosphate utilization efficiency in rice. Plant Cell Environ. 2020, 43, 2066–2079. [Google Scholar] [CrossRef]
  21. Kitazaki, K.; Fukushima, A.; Nakabayashi, R.; Okazaki, Y.; Kobayashi, M.; Mori, T.; Nishizawa, T.; Reyes-Chin-Wo, S.; Michelmore, R.W.; Saito, K.; et al. Metabolic Reprogramming in Leaf Lettuce Grown under Different Light Quality and Intensity Conditions Using Narrow-Band LEDs. Sci. Rep. 2018, 8, 7914. [Google Scholar] [CrossRef]
  22. Mbong, V.B.M.; Ampofo-Asiama, J.; Hertog, M.L.; Geeraerd, A.H.; Nicolai, B.M. The effect of temperature on the metabolic response of lamb’s lettuce (Valerianella locusta, (L), Laterr.) cells to sugar starvation. Postharvest Biol. Technol. 2017, 125, 1–12. [Google Scholar] [CrossRef]
  23. Lucini, L.; Rouphael, Y.; Cardarelli, M.; Canaguier, R.; Kumar, P.; Colla, G. The effect of a plant-derived biostimulant on metabolic profiling and crop performance of lettuce grown under saline conditions. Sci. Hortic. 2015, 182, 124–133. [Google Scholar] [CrossRef]
  24. Tamura, Y.; Mori, T.; Nakabayashi, R.; Kobayashi, M.; Saito, K.; Okazaki, S.; Wang, N.; Kusano, M. Metabolomic Evaluation of the Quality of Leaf Lettuce Grown in Practical Plant Factory to Capture Metabolite Signature. Front. Plant Sci. 2018, 9, 1–11. [Google Scholar] [CrossRef] [PubMed]
  25. Yang, X.; Wei, S.; Liu, B.; Guo, D.; Zheng, B.; Feng, L.; Liu, Y.; Tomas-Barberan, F.A.; Luo, L.; Huang, D. A novel integrated non-targeted metabolomic analysis reveals significant metabolite variations between different lettuce (Lactuca sativa. L) varieties. Hortic. Res. 2018, 5, 1–14. [Google Scholar] [CrossRef] [PubMed] [Green Version]
  26. Mao, H.P.; Hang, T.; Zhang, X.D.; Lu, N. Both Multi-Segment Light Intensity and Extended Photoperiod Lighting Strategies, with the Same Daily Light Integral, Promoted Lactuca sativa L. Growth and Photosynthesis. Agronomy 2019, 9, 857. [Google Scholar] [CrossRef] [Green Version]
  27. Luo, P.; Yin, P.; Zhang, W.; Zhou, L.; Lu, X.; Lin, X.; Xu, G. Optimization of large-scale pseudotargeted metabolomics method based on liquid chromatography-mass spectrometry. J. Chromatogr. A 2016, 1437, 127–136. [Google Scholar] [CrossRef] [PubMed]
  28. Trygg, J.; Holmes, E.; Lundstedt, T. Chemometrics in metabonomics. J. Proteome Res. 2007, 6, 469–479. [Google Scholar] [CrossRef]
  29. Shi, M.Y.; Wang, S.S.; Zhang, Y.; Wang, S.; Zhao, J.; Feng, H.; Sun, P.P.; Fang, C.B.; Xie, X.B. Genome-wide characterization and expression analysis of ATP-binding cassette (ABC) transporters in strawberry reveal the role of FvABCC11 in cadmium tolerance. Sci. Hortic. 2020, 271, 1–16. [Google Scholar] [CrossRef]
  30. Patra, B.; Schluttenhofer, C.; Wu, Y.M.; Pattanaik, S.; Yuan, L. Transcriptional regulation of secondary metabolite biosynthesis in plants. Biochim. Biophys. Acta Gene Regul. Mech. 2013, 1829, 1236–1247. [Google Scholar] [CrossRef]
  31. Ozyigit, Y.; Bilgen, M. Use of Spectral Reflectance Values for Determining Nitrogen, Phosphorus, and Potassium Contents of Rangeland Plants. J. Agric. Sci. Technol. 2013, 15, 1537–1545. [Google Scholar]
  32. Romualdo, L.M.; Luz, P.H.C.; Devechio, F.F.S.; Marin, M.A.; Zuniga, A.M.G.; Bruno, O.M.; Herling, V.R. Use of artificial vision techniques for diagnostic of nitrogen nutritional status in maize plants. Comput. Electron. Agric. 2014, 104, 63–70. [Google Scholar] [CrossRef]
  33. Story, D.; Kacira, M.; Kubota, C.; Akoglu, A.; An, L.L. Lettuce calcium deficiency detection with machine vision computed plant features in controlled environments. Comput. Electron. Agric. 2010, 74, 238–243. [Google Scholar] [CrossRef]
  34. Rubio-Wilhelmi, M.M.; Sanchez-Rodriguez, E.; Rosales, M.A.; Begona, B.; Rios, J.J.; Romero, L.; Blumwald, E.; Ruiz, J.M. Effect of cytokinins on oxidative stress in tobacco plants under nitrogen deficiency. Environ. Exp. Bot. 2011, 72, 167–173. [Google Scholar] [CrossRef]
  35. Wittenmayer, L.; Merbach, W. Plant responses to drought and phosphorus deficiency: Contribution of phytohormones in root-related processes. J. Plant Nutr. Soil Sci. 2010, 168, 531–540. [Google Scholar] [CrossRef]
  36. Jiang, J.; Wang, Y.P.; Yang, Y.H.; Yu, M.X.; Wang, C.; Yan, J.H. Interactive effects of nitrogen and phosphorus additions on plant growth vary with ecosystem type. Plant Soil 2019, 440, 523–537. [Google Scholar] [CrossRef]
  37. Mirande-Ney, C.; Tcherkez, G.; Balliau, T.; Zivy, M.; Gilard, F.; Cui, J.; Ghashghaie, J.; Lamade, E. Metabolic leaf responses to potassium availability in oil palm (Elaeis guineensis Jacq.) trees grown in the field. Environ. Exp. Bot. 2020, 175, 104062. [Google Scholar] [CrossRef]
  38. Sun, Y.L.; Mu, C.H.; Chen, Y.; Kong, X.P.; Xu, Y.C.; Zheng, H.X.; Zhang, H.; Wang, Q.C.; Xue, Y.F.; Li, Z.X.; et al. Comparative transcript profiling of maize inbreds in response to long-term phosphorus deficiency stress. Plant Physiol. Biochem. 2016, 109, 467–481. [Google Scholar] [CrossRef] [Green Version]
Figure 1. Samples cultivation in the micro plant factory.
Agriculture 10 00406 g001
Figure 2. The correlation coefficient of quality control samples.
Agriculture 10 00406 g002
Figure 3. Volcano plots for lettuce samples of nitrogen and phosphorus. (a), low-nitrogen stress; (b), low-phosphorus stress.
Agriculture 10 00406 g003
Figure 4. Venn diagrams of upregulated, downregulated, and no change metabolites. (a), low-nitrogen stress; (b), low-phosphorus stress.
Agriculture 10 00406 g004
Figure 5. V + S plots of nitrogen and phosphorus. (a), low-nitrogen stress; (b), low-phosphorus stress.
Agriculture 10 00406 g005aAgriculture 10 00406 g005b
Figure 6. Hierarchical cluster analysis of metabolic biomarkers under low-nitrogen stress.
Agriculture 10 00406 g006
Figure 7. Hierarchical cluster analysis of metabolic biomarkers under low-phosphorus stress.
Agriculture 10 00406 g007
Figure 8. Pathway analysis showing metabolic biomarkers of lettuce leaves. (a), low-nitrogen stress; (b), low-phosphorus stress.
Agriculture 10 00406 g008
Table 1. The metabolic biomarkers under low-nitrogen stress.
NameESI Modem/zRT (min)
UpregulationInositolNegative179.05869.03
P-hydroxybenzoic acidNegative137.02470.72
StachyoseNegative725.234012.05
DinosebNegative239.07040.99
7,8-DihydroxycoumarinNegative177.02114.42
DownregulationAdenosinePositive268.10283.96
Palmitic acidNegative255.23261.13
L-5-OxoprolinePositive130.04979.68
3-MethylxanthineNegative165.04128.65
tert-Butyric acidNegative115.07871.82
D(-)-Gulono-gamma-lactoneNegative177.04182.55
FA 18:2 + 3ONegative329.23143.22
MGMG 18:3Negative559.30702.56
Table 2. The metabolic biomarkers under low-phosphorus stress.
NameESI Modem/zRT (min)
UpregulationSuccinateNegative117.02179.20
L-TryptophanNegative203.08226.44
L-AsparagineNegative131.04619.57
CitrateNegative191.021111.99
Indole-3-carboxaldehydeNegative144.04680.87
IsocitrateNegative191.019311.30
HistaminePositive112.08656.75
L-IsoleucineNegative130.08776.64
2-Deoxyribose 5-phosphateNegative213.01643.09
GalactinolNegative341.106211.85
L-5-OxoprolinePositive130.04979.68
gamma-GlutamylglutaminePositive276.118610.66
AjmalinePositive327.20302.13
Desethyl atrazinePositive188.07026.43
Ginkgolide CNegative439.12208.51
CorynanthinePositive355.20866.11
pregnenolone sulfateNegative395.18983.78
N-Acetylneuraminic acidNegative308.09556.96
Glu-GlnNegative274.104010.66
2’-O-MethylinosineNegative281.08658.92
FA 18:4 + 1ONegative291.19431.09
FA 18:1 + 1ONegative297.24271.06
TorasemideNegative347.116711.04
ForamsulfuronNegative451.10340.52
Indole-3-acetyl-L-valinePositive275.134610.49
DesloratadinePositive311.13368.51
HydroxybutorphanolPositive344.22641.69
GardneraminePositive413.21108.46
Hematoporphyrin_IPositive599.28715.69
DownregulationMevalonic acidNegative295.13852.49
sn-Glycero-3-phosphocholinePositive258.10999.75
N4-AcetylsulfamethoxazolePositive296.06589.75
Yohimbic AcidNegative339.16312.54
ErucamidePositive338.34220.80

